Rougemont, NC Map & Demographics
Rougemont Map
Rougemont Overview
$26,019
PER CAPITA INCOME
$115,679
AVG FAMILY INCOME
0.43
INEQUALITY / GINI INDEX
1,125
TOTAL POPULATION
412
MALE POPULATION
713
FEMALE POPULATION
57.78
MALES / 100 FEMALES
173.06
FEMALES / 100 MALES
43.9
MEDIAN AGE
4.6
AVG FAMILY SIZE
3.0
AVG HOUSEHOLD SIZE
433
LABOR FORCE [ PEOPLE ]
56.7%
PERCENT IN LABOR FORCE
4.4%
UNEMPLOYMENT RATE
Rougemont Zip Codes
Income in Rougemont
Income Overview in Rougemont
| Characteristic | Number | Measure |
| Per Capita Income | 1,125 | $26,019 |
| Median Family Income | 203 | $115,679 |
| Mean Family Income | 203 | $99,376 |
| Median Household Income | 371 | $0 |
| Mean Household Income | 371 | $69,350 |
| Income Deficit | 203 | $0 |
| Wage / Income Gap (%) | 1,125 | 0.00% |
| Wage / Income Gap ($) | 1,125 | 100.00¢ per $1 |
| Gini / Inequality Index | 1,125 | 0.43 |
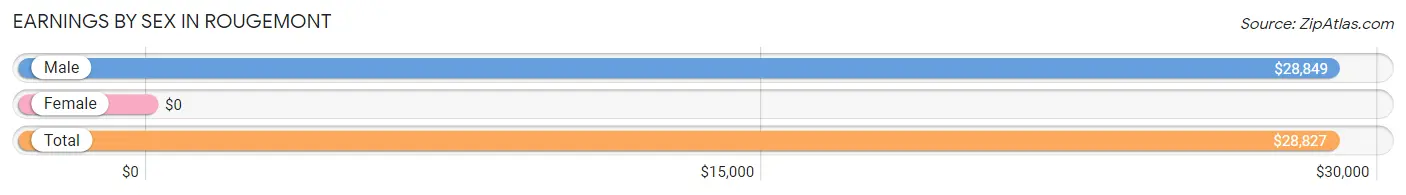
Earnings by Sex in Rougemont
| Sex | Number | Average Earnings |
| Male | 172 (36.9%) | $28,849 |
| Female | 294 (63.1%) | $0 |
| Total | 466 (100.0%) | $28,827 |
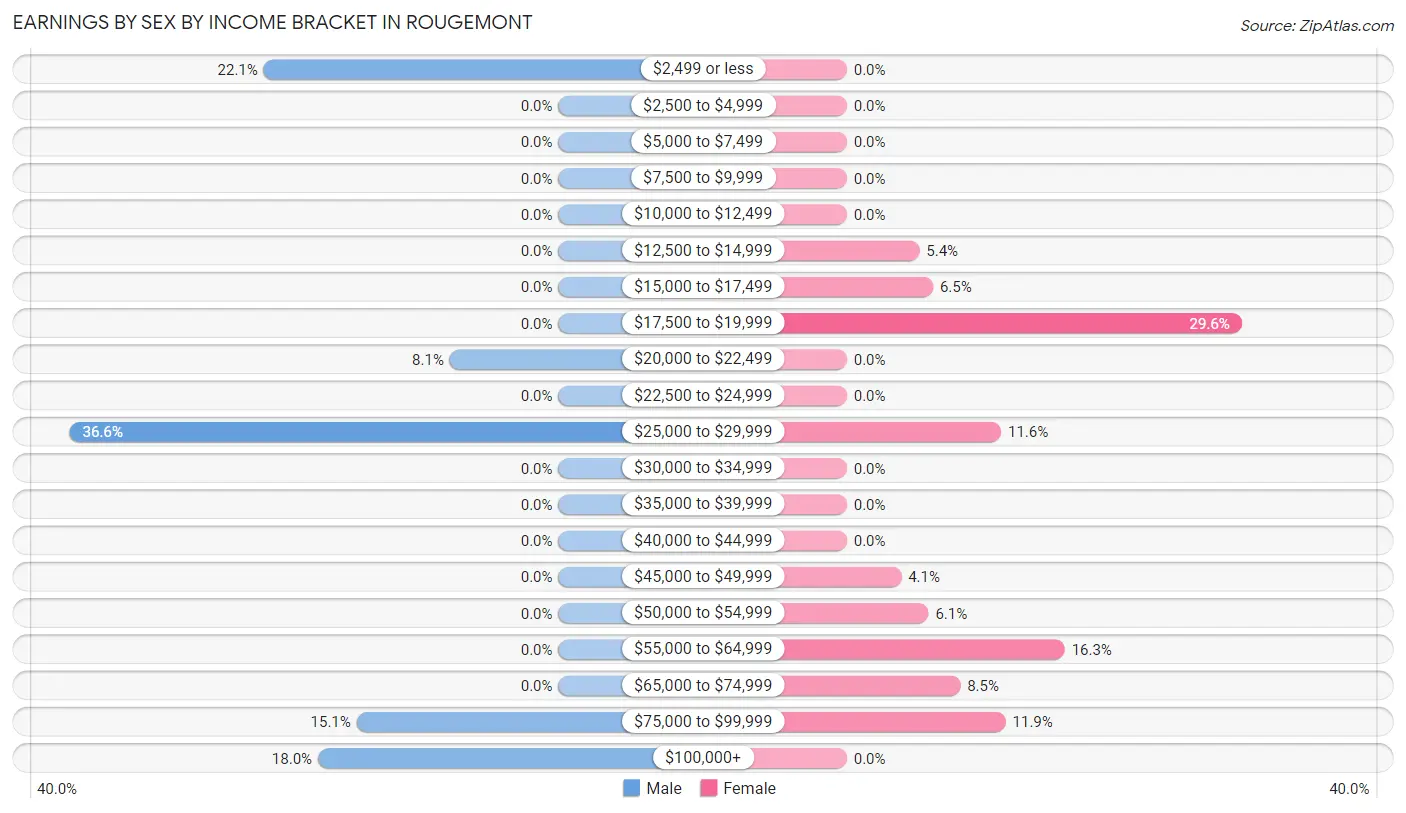
Earnings by Sex by Income Bracket in Rougemont
The most common earnings brackets in Rougemont are $25,000 to $29,999 for men (63 | 36.6%) and $17,500 to $19,999 for women (87 | 29.6%).
| Income | Male | Female |
| $2,499 or less | 38 (22.1%) | 0 (0.0%) |
| $2,500 to $4,999 | 0 (0.0%) | 0 (0.0%) |
| $5,000 to $7,499 | 0 (0.0%) | 0 (0.0%) |
| $7,500 to $9,999 | 0 (0.0%) | 0 (0.0%) |
| $10,000 to $12,499 | 0 (0.0%) | 0 (0.0%) |
| $12,500 to $14,999 | 0 (0.0%) | 16 (5.4%) |
| $15,000 to $17,499 | 0 (0.0%) | 19 (6.5%) |
| $17,500 to $19,999 | 0 (0.0%) | 87 (29.6%) |
| $20,000 to $22,499 | 14 (8.1%) | 0 (0.0%) |
| $22,500 to $24,999 | 0 (0.0%) | 0 (0.0%) |
| $25,000 to $29,999 | 63 (36.6%) | 34 (11.6%) |
| $30,000 to $34,999 | 0 (0.0%) | 0 (0.0%) |
| $35,000 to $39,999 | 0 (0.0%) | 0 (0.0%) |
| $40,000 to $44,999 | 0 (0.0%) | 0 (0.0%) |
| $45,000 to $49,999 | 0 (0.0%) | 12 (4.1%) |
| $50,000 to $54,999 | 0 (0.0%) | 18 (6.1%) |
| $55,000 to $64,999 | 0 (0.0%) | 48 (16.3%) |
| $65,000 to $74,999 | 0 (0.0%) | 25 (8.5%) |
| $75,000 to $99,999 | 26 (15.1%) | 35 (11.9%) |
| $100,000+ | 31 (18.0%) | 0 (0.0%) |
| Total | 172 (100.0%) | 294 (100.0%) |
Earnings by Sex by Educational Attainment in Rougemont
| Educational Attainment | Male Income | Female Income |
| Less than High School | - | - |
| High School Diploma | - | - |
| College or Associate's Degree | - | - |
| Bachelor's Degree | - | - |
| Graduate Degree | - | - |
| Total | - | - |
Family Income in Rougemont
Family Income Brackets in Rougemont
According to the Rougemont family income data, there are 66 families falling into the $100,000 to $149,999 income range, which is the most common income bracket and makes up 32.5% of all families.
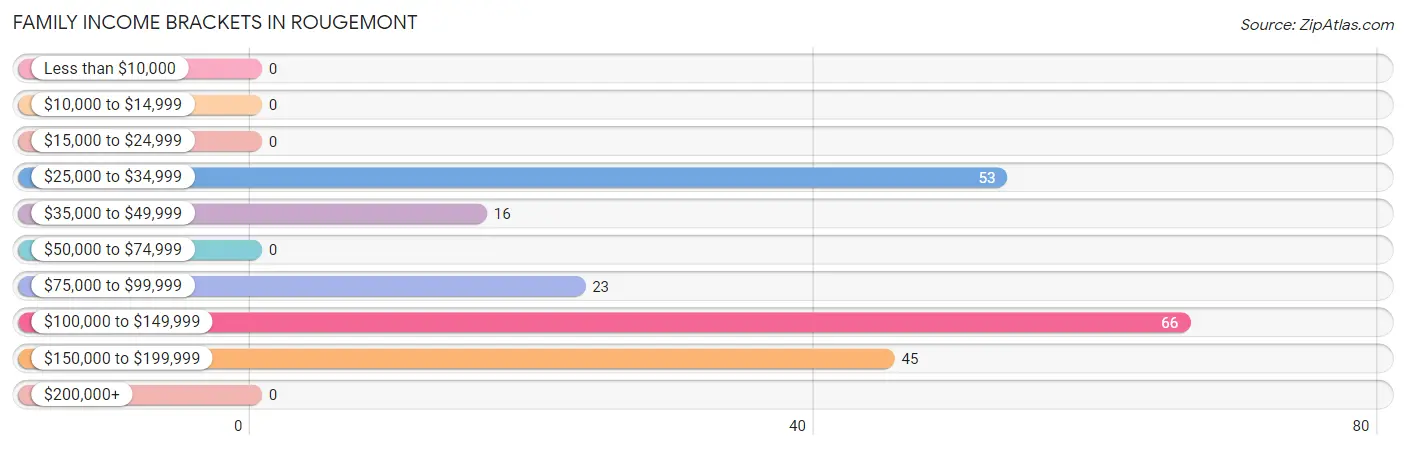
| Income Bracket | # Families | % Families |
| Less than $10,000 | 0 | 0.0% |
| $10,000 to $14,999 | 0 | 0.0% |
| $15,000 to $24,999 | 0 | 0.0% |
| $25,000 to $34,999 | 53 | 26.1% |
| $35,000 to $49,999 | 16 | 7.9% |
| $50,000 to $74,999 | 0 | 0.0% |
| $75,000 to $99,999 | 23 | 11.3% |
| $100,000 to $149,999 | 66 | 32.5% |
| $150,000 to $199,999 | 45 | 22.2% |
| $200,000+ | 0 | 0.0% |
Family Income by Famaliy Size in Rougemont
| Income Bracket | # Families | Median Income |
| 2-Person Families | 69 (34.0%) | $0 |
| 3-Person Families | 27 (13.3%) | $0 |
| 4-Person Families | 0 (0.0%) | $0 |
| 5-Person Families | 72 (35.5%) | $0 |
| 6-Person Families | 0 (0.0%) | $0 |
| 7+ Person Families | 35 (17.2%) | $0 |
| Total | 203 (100.0%) | $115,679 |
Family Income by Number of Earners in Rougemont
| Number of Earners | # Families | Median Income |
| No Earners | 0 (0.0%) | $0 |
| 1 Earner | 123 (60.6%) | $0 |
| 2 Earners | 49 (24.1%) | $0 |
| 3+ Earners | 31 (15.3%) | $0 |
| Total | 203 (100.0%) | $115,679 |
Household Income in Rougemont
Household Income Brackets in Rougemont
With 80 households falling in the category, the $100,000 to $149,999 income range is the most frequent in Rougemont, accounting for 21.6% of all households.
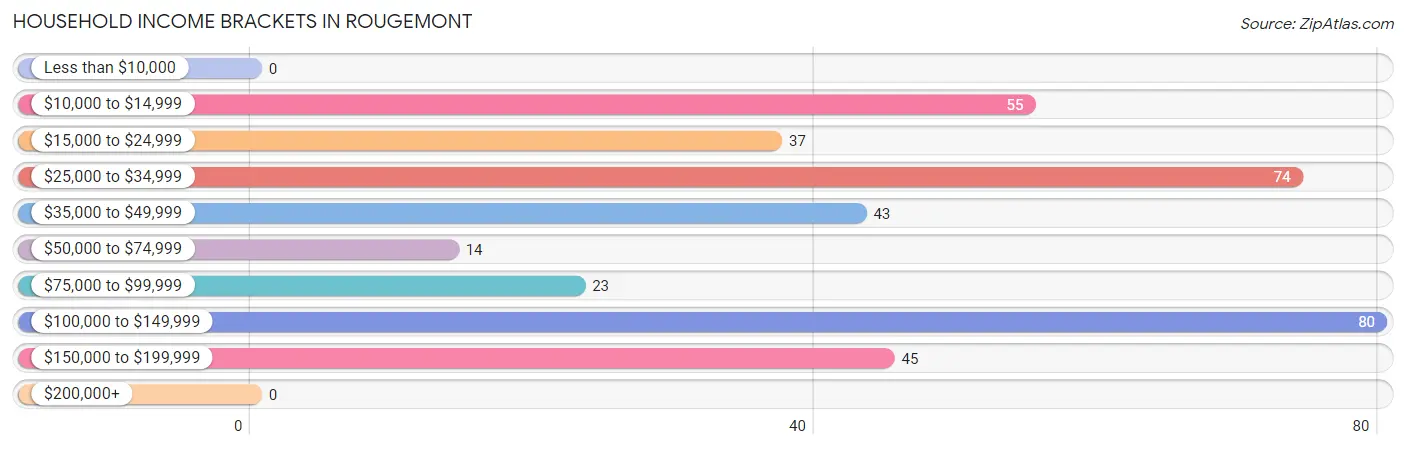
| Income Bracket | # Households | % Households |
| Less than $10,000 | 0 | 0.0% |
| $10,000 to $14,999 | 55 | 14.8% |
| $15,000 to $24,999 | 37 | 10.0% |
| $25,000 to $34,999 | 74 | 19.9% |
| $35,000 to $49,999 | 43 | 11.6% |
| $50,000 to $74,999 | 14 | 3.8% |
| $75,000 to $99,999 | 23 | 6.2% |
| $100,000 to $149,999 | 80 | 21.6% |
| $150,000 to $199,999 | 45 | 12.1% |
| $200,000+ | 0 | 0.0% |
Household Income by Householder Age in Rougemont
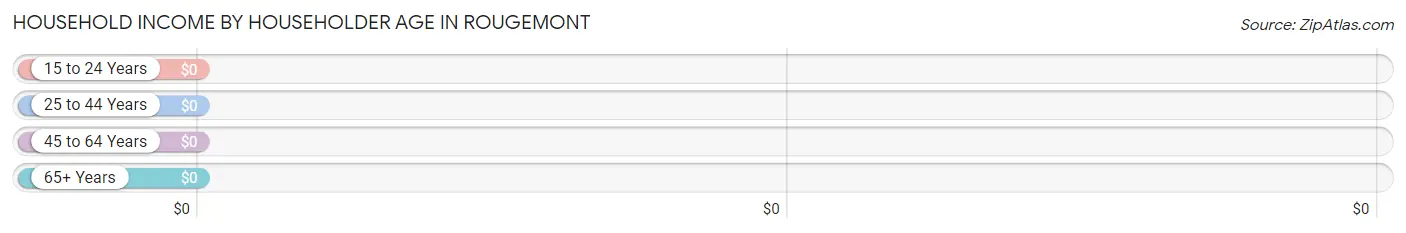
| Income Bracket | # Households | Median Income |
| 15 to 24 Years | 0 (0.0%) | $0 |
| 25 to 44 Years | 39 (10.5%) | $0 |
| 45 to 64 Years | 124 (33.4%) | $0 |
| 65+ Years | 208 (56.1%) | $0 |
| Total | 371 (100.0%) | $0 |
Poverty in Rougemont
Income Below Poverty by Sex and Age in Rougemont
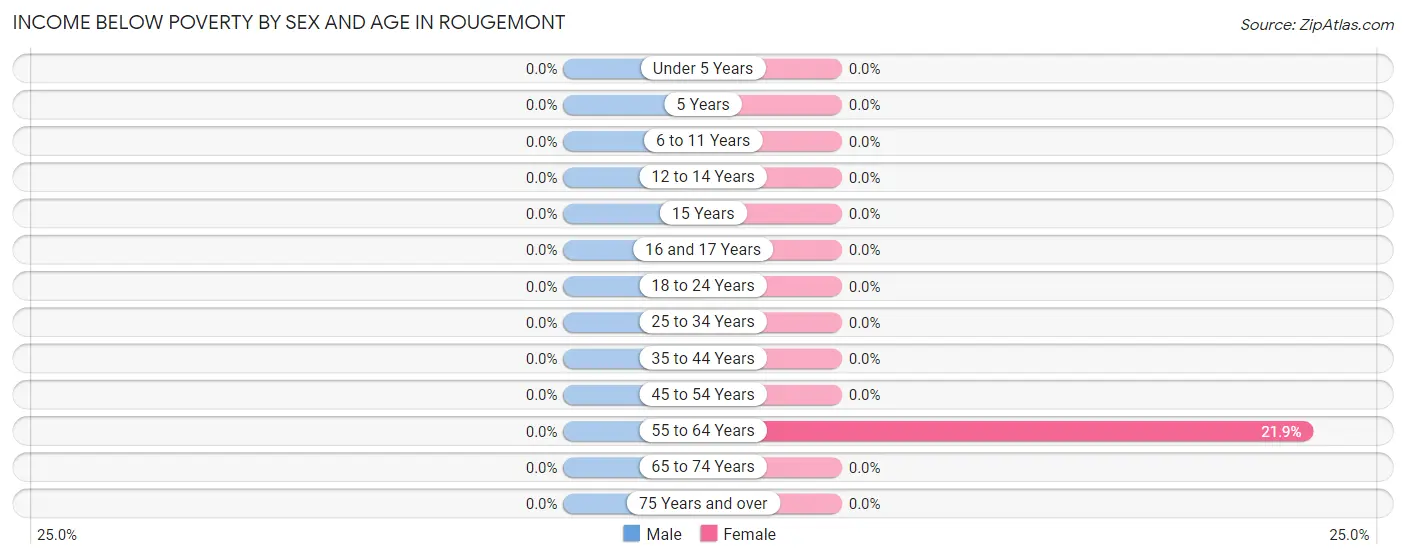
| Age Bracket | Male | Female |
| Under 5 Years | 0 (0.0%) | 0 (0.0%) |
| 5 Years | 0 (0.0%) | 0 (0.0%) |
| 6 to 11 Years | 0 (0.0%) | 0 (0.0%) |
| 12 to 14 Years | 0 (0.0%) | 0 (0.0%) |
| 15 Years | 0 (0.0%) | 0 (0.0%) |
| 16 and 17 Years | 0 (0.0%) | 0 (0.0%) |
| 18 to 24 Years | 0 (0.0%) | 0 (0.0%) |
| 25 to 34 Years | 0 (0.0%) | 0 (0.0%) |
| 35 to 44 Years | 0 (0.0%) | 0 (0.0%) |
| 45 to 54 Years | 0 (0.0%) | 0 (0.0%) |
| 55 to 64 Years | 0 (0.0%) | 21 (21.9%) |
| 65 to 74 Years | 0 (0.0%) | 0 (0.0%) |
| 75 Years and over | 0 (0.0%) | 0 (0.0%) |
| Total | 0 (0.0%) | 21 (2.9%) |
Income Above Poverty by Sex and Age in Rougemont
According to the poverty statistics in Rougemont, males aged under 5 years and females aged under 5 years are the age groups that are most secure financially, with 100.0% of males and 100.0% of females in these age groups living above the poverty line.
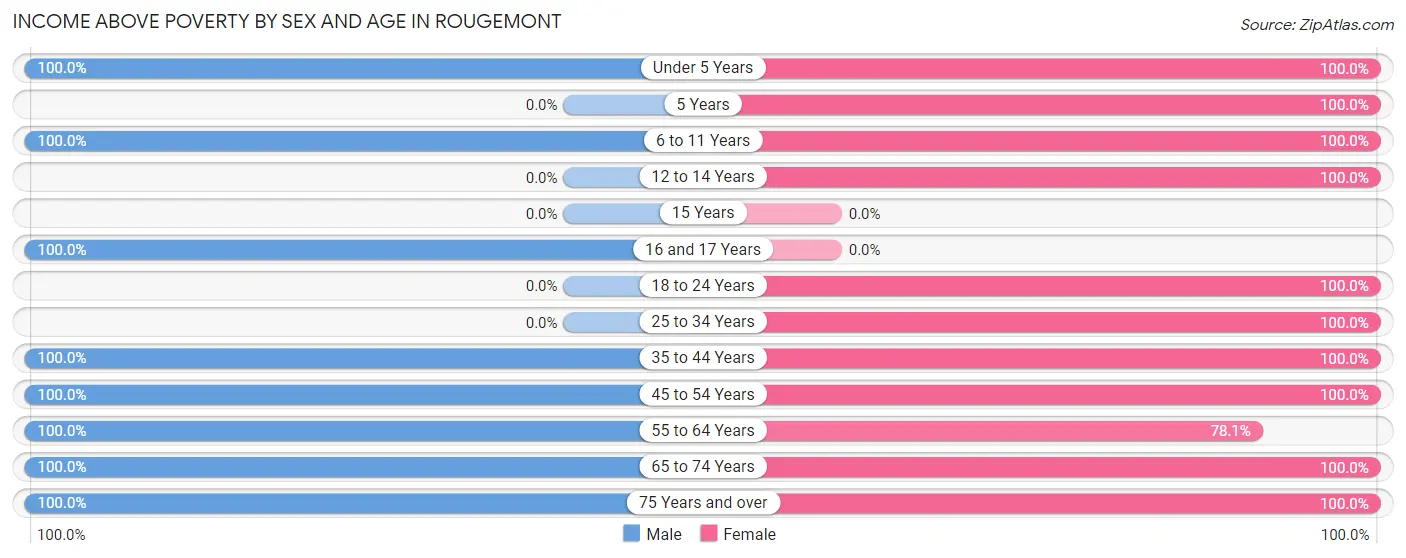
| Age Bracket | Male | Female |
| Under 5 Years | 44 (100.0%) | 65 (100.0%) |
| 5 Years | 0 (0.0%) | 25 (100.0%) |
| 6 to 11 Years | 69 (100.0%) | 101 (100.0%) |
| 12 to 14 Years | 0 (0.0%) | 58 (100.0%) |
| 15 Years | 0 (0.0%) | 0 (0.0%) |
| 16 and 17 Years | 38 (100.0%) | 0 (0.0%) |
| 18 to 24 Years | 0 (0.0%) | 16 (100.0%) |
| 25 to 34 Years | 0 (0.0%) | 39 (100.0%) |
| 35 to 44 Years | 45 (100.0%) | 66 (100.0%) |
| 45 to 54 Years | 82 (100.0%) | 108 (100.0%) |
| 55 to 64 Years | 12 (100.0%) | 75 (78.1%) |
| 65 to 74 Years | 91 (100.0%) | 68 (100.0%) |
| 75 Years and over | 31 (100.0%) | 71 (100.0%) |
| Total | 412 (100.0%) | 692 (97.1%) |
Income Below Poverty Among Married-Couple Families in Rougemont
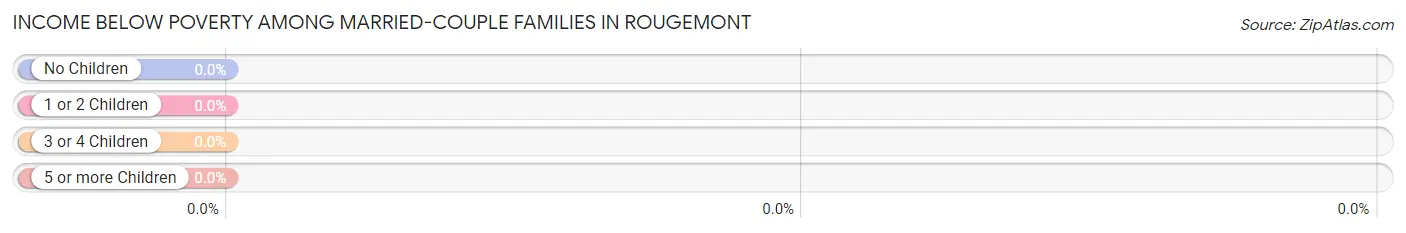
| Children | Above Poverty | Below Poverty |
| No Children | 15 (100.0%) | 0 (0.0%) |
| 1 or 2 Children | 45 (100.0%) | 0 (0.0%) |
| 3 or 4 Children | 74 (100.0%) | 0 (0.0%) |
| 5 or more Children | 0 (0.0%) | 0 (0.0%) |
| Total | 134 (100.0%) | 0 (0.0%) |
Income Below Poverty Among Single-Parent Households in Rougemont
| Children | Single Father | Single Mother |
| No Children | 0 (0.0%) | 0 (0.0%) |
| 1 or 2 Children | 0 (0.0%) | 0 (0.0%) |
| 3 or 4 Children | 0 (0.0%) | 0 (0.0%) |
| 5 or more Children | 0 (0.0%) | 0 (0.0%) |
| Total | 0 (0.0%) | 0 (0.0%) |
Income Below Poverty Among Married-Couple vs Single-Parent Households in Rougemont
| Children | Married-Couple Families | Single-Parent Households |
| No Children | 0 (0.0%) | 0 (0.0%) |
| 1 or 2 Children | 0 (0.0%) | 0 (0.0%) |
| 3 or 4 Children | 0 (0.0%) | 0 (0.0%) |
| 5 or more Children | 0 (0.0%) | 0 (0.0%) |
| Total | 0 (0.0%) | 0 (0.0%) |
Race in Rougemont
The most populous races in Rougemont are White / Caucasian (632 | 56.2%), Black / African American (391 | 34.8%), and Hispanic or Latino (102 | 9.1%).

| Race | # Population | % Population |
| Asian | 0 | 0.0% |
| Black / African American | 391 | 34.8% |
| Hawaiian / Pacific | 0 | 0.0% |
| Hispanic or Latino | 102 | 9.1% |
| Native / Alaskan | 0 | 0.0% |
| White / Caucasian | 632 | 56.2% |
| Two or more Races | 102 | 9.1% |
| Some other Race | 0 | 0.0% |
| Total | 1,125 | 100.0% |
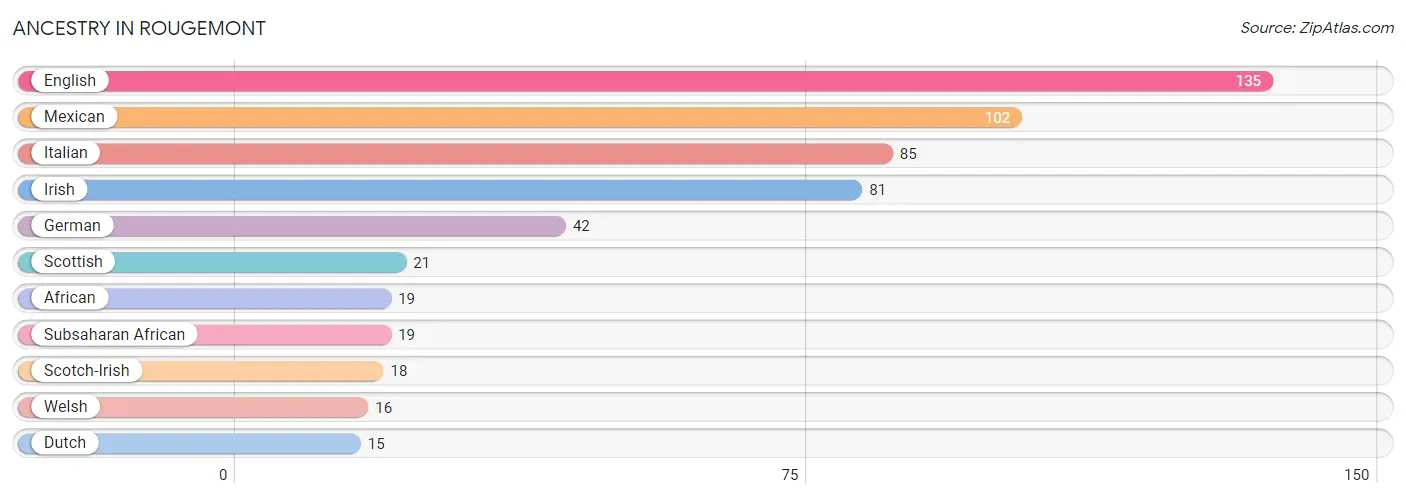
Ancestry in Rougemont
The most populous ancestries reported in Rougemont are English (135 | 12.0%), Mexican (102 | 9.1%), Italian (85 | 7.6%), Irish (81 | 7.2%), and German (42 | 3.7%), together accounting for 39.6% of all Rougemont residents.
| Ancestry | # Population | % Population |
| African | 19 | 1.7% |
| Dutch | 15 | 1.3% |
| English | 135 | 12.0% |
| German | 42 | 3.7% |
| Irish | 81 | 7.2% |
| Italian | 85 | 7.6% |
| Mexican | 102 | 9.1% |
| Scotch-Irish | 18 | 1.6% |
| Scottish | 21 | 1.9% |
| Subsaharan African | 19 | 1.7% |
| Welsh | 16 | 1.4% | View All 11 Rows |
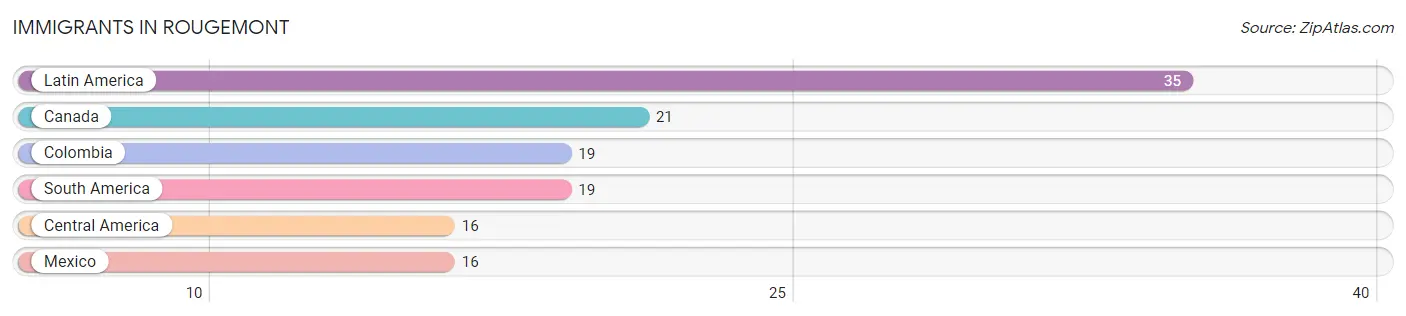
Immigrants in Rougemont
The most numerous immigrant groups reported in Rougemont came from Latin America (35 | 3.1%), Canada (21 | 1.9%), Colombia (19 | 1.7%), South America (19 | 1.7%), and Central America (16 | 1.4%), together accounting for 9.8% of all Rougemont residents.
| Immigration Origin | # Population | % Population |
| Canada | 21 | 1.9% |
| Central America | 16 | 1.4% |
| Colombia | 19 | 1.7% |
| Latin America | 35 | 3.1% |
| Mexico | 16 | 1.4% |
| South America | 19 | 1.7% | View All 6 Rows |
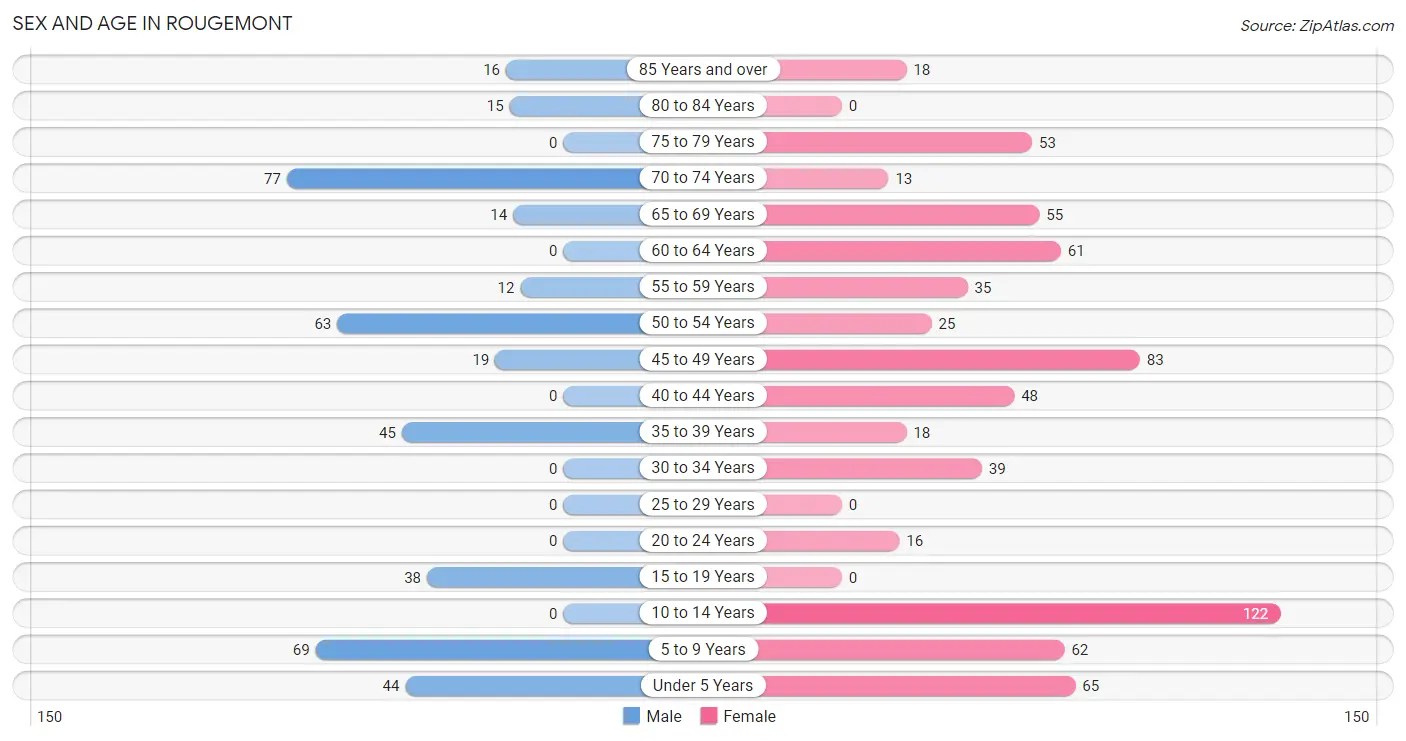
Sex and Age in Rougemont
Sex and Age in Rougemont
The most populous age groups in Rougemont are 70 to 74 Years (77 | 18.7%) for men and 10 to 14 Years (122 | 17.1%) for women.
| Age Bracket | Male | Female |
| Under 5 Years | 44 (10.7%) | 65 (9.1%) |
| 5 to 9 Years | 69 (16.8%) | 62 (8.7%) |
| 10 to 14 Years | 0 (0.0%) | 122 (17.1%) |
| 15 to 19 Years | 38 (9.2%) | 0 (0.0%) |
| 20 to 24 Years | 0 (0.0%) | 16 (2.2%) |
| 25 to 29 Years | 0 (0.0%) | 0 (0.0%) |
| 30 to 34 Years | 0 (0.0%) | 39 (5.5%) |
| 35 to 39 Years | 45 (10.9%) | 18 (2.5%) |
| 40 to 44 Years | 0 (0.0%) | 48 (6.7%) |
| 45 to 49 Years | 19 (4.6%) | 83 (11.6%) |
| 50 to 54 Years | 63 (15.3%) | 25 (3.5%) |
| 55 to 59 Years | 12 (2.9%) | 35 (4.9%) |
| 60 to 64 Years | 0 (0.0%) | 61 (8.6%) |
| 65 to 69 Years | 14 (3.4%) | 55 (7.7%) |
| 70 to 74 Years | 77 (18.7%) | 13 (1.8%) |
| 75 to 79 Years | 0 (0.0%) | 53 (7.4%) |
| 80 to 84 Years | 15 (3.6%) | 0 (0.0%) |
| 85 Years and over | 16 (3.9%) | 18 (2.5%) |
| Total | 412 (100.0%) | 713 (100.0%) |
Families and Households in Rougemont
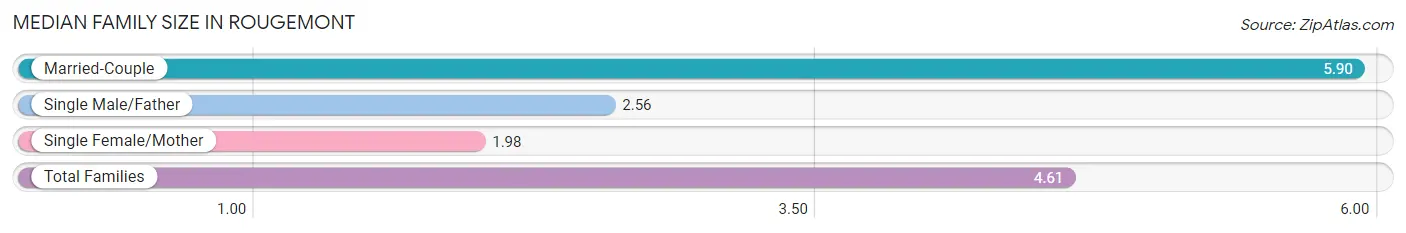
Median Family Size in Rougemont
The median family size in Rougemont is 4.61 persons per family, with married-couple families (134 | 66.0%) accounting for the largest median family size of 5.9 persons per family. On the other hand, single female/mother families (53 | 26.1%) represent the smallest median family size with 1.98 persons per family.
| Family Type | # Families | Family Size |
| Married-Couple | 134 (66.0%) | 5.90 |
| Single Male/Father | 16 (7.9%) | 2.56 |
| Single Female/Mother | 53 (26.1%) | 1.98 |
| Total Families | 203 (100.0%) | 4.61 |
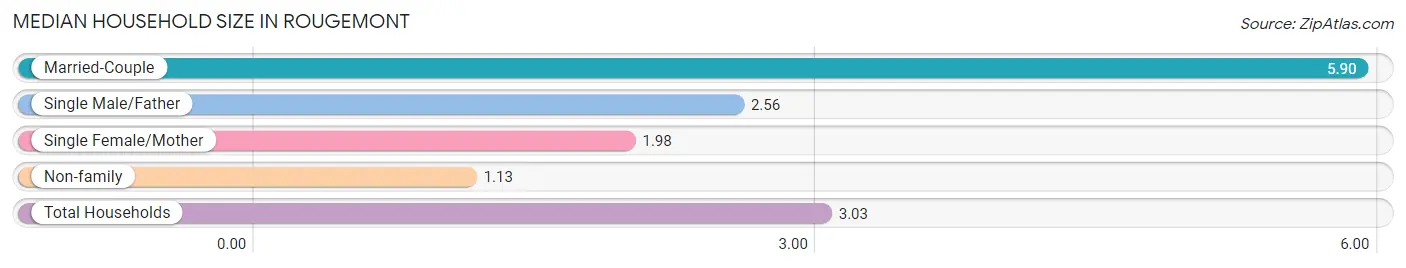
Median Household Size in Rougemont
The median household size in Rougemont is 3.03 persons per household, with married-couple households (134 | 36.1%) accounting for the largest median household size of 5.9 persons per household. non-family households (168 | 45.3%) represent the smallest median household size with 1.13 persons per household.
| Household Type | # Households | Household Size |
| Married-Couple | 134 (36.1%) | 5.90 |
| Single Male/Father | 16 (4.3%) | 2.56 |
| Single Female/Mother | 53 (14.3%) | 1.98 |
| Non-family | 168 (45.3%) | 1.13 |
| Total Households | 371 (100.0%) | 3.03 |
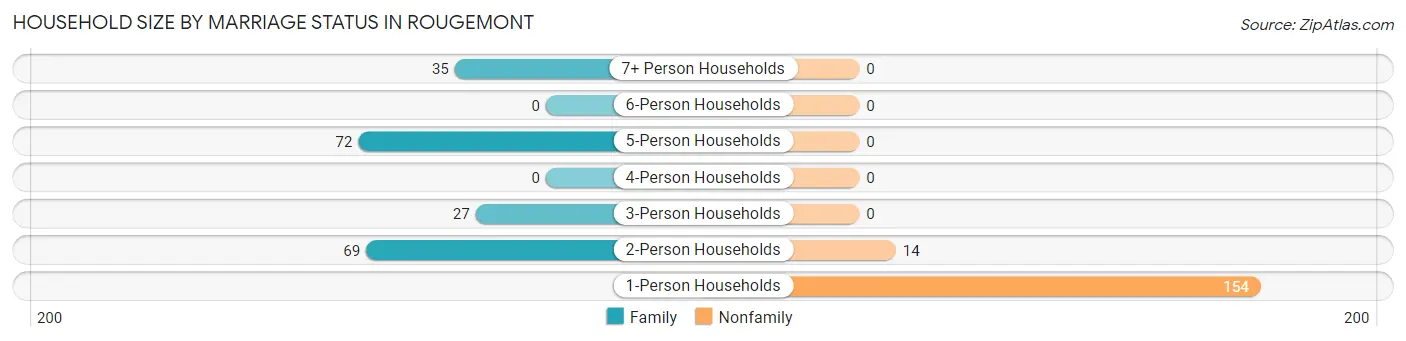
Household Size by Marriage Status in Rougemont
Out of a total of 371 households in Rougemont, 203 (54.7%) are family households, while 168 (45.3%) are nonfamily households. The most numerous type of family households are 5-person households, comprising 72, and the most common type of nonfamily households are 1-person households, comprising 154.
| Household Size | Family Households | Nonfamily Households |
| 1-Person Households | - | 154 (41.5%) |
| 2-Person Households | 69 (18.6%) | 14 (3.8%) |
| 3-Person Households | 27 (7.3%) | 0 (0.0%) |
| 4-Person Households | 0 (0.0%) | 0 (0.0%) |
| 5-Person Households | 72 (19.4%) | 0 (0.0%) |
| 6-Person Households | 0 (0.0%) | 0 (0.0%) |
| 7+ Person Households | 35 (9.4%) | 0 (0.0%) |
| Total | 203 (54.7%) | 168 (45.3%) |
Female Fertility in Rougemont
Fertility by Age in Rougemont
| Age Bracket | Women with Births | Births / 1,000 Women |
| 15 to 19 years | 0 (0.0%) | 0.0 |
| 20 to 34 years | 0 (0.0%) | 0.0 |
| 35 to 50 years | 0 (0.0%) | 0.0 |
| Total | 0 (0.0%) | 0.0 |
Fertility by Age by Marriage Status in Rougemont
| Age Bracket | Married | Unmarried |
| 15 to 19 years | 0 (0.0%) | 0 (0.0%) |
| 20 to 34 years | 0 (0.0%) | 0 (0.0%) |
| 35 to 50 years | 0 (0.0%) | 0 (0.0%) |
| Total | 0 (0.0%) | 0 (0.0%) |
Fertility by Education in Rougemont
| Educational Attainment | Women with Births | Births / 1,000 Women |
| Less than High School | 0 (0.0%) | 0.0 |
| High School Diploma | 0 (0.0%) | 0.0 |
| College or Associate's Degree | 0 (0.0%) | 0.0 |
| Bachelor's Degree | 0 (0.0%) | 0.0 |
| Graduate Degree | 0 (0.0%) | 0.0 |
| Total | 0 (0.0%) | 0.0 |
Fertility by Education by Marriage Status in Rougemont
| Educational Attainment | Married | Unmarried |
| Less than High School | 0 (0.0%) | 0 (0.0%) |
| High School Diploma | 0 (0.0%) | 0 (0.0%) |
| College or Associate's Degree | 0 (0.0%) | 0 (0.0%) |
| Bachelor's Degree | 0 (0.0%) | 0 (0.0%) |
| Graduate Degree | 0 (0.0%) | 0 (0.0%) |
| Total | 0 (0.0%) | 0 (0.0%) |
Employment Characteristics in Rougemont
Employment by Class of Employer in Rougemont
Among the 414 employed individuals in Rougemont, private company employees (306 | 73.9%), not-for-profit organizations (67 | 16.2%), and local government employees (25 | 6.0%) make up the most common classes of employment.
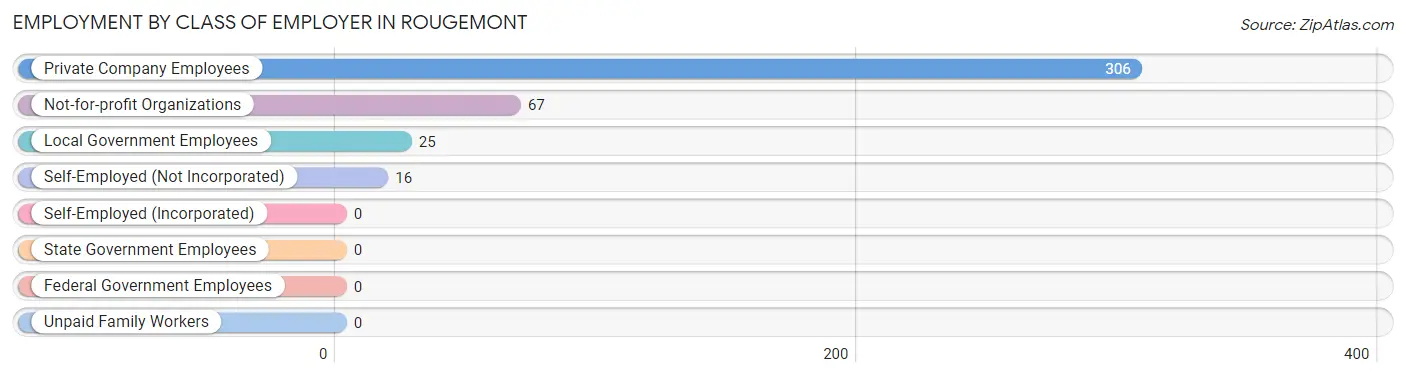
| Employer Class | # Employees | % Employees |
| Private Company Employees | 306 | 73.9% |
| Self-Employed (Incorporated) | 0 | 0.0% |
| Self-Employed (Not Incorporated) | 16 | 3.9% |
| Not-for-profit Organizations | 67 | 16.2% |
| Local Government Employees | 25 | 6.0% |
| State Government Employees | 0 | 0.0% |
| Federal Government Employees | 0 | 0.0% |
| Unpaid Family Workers | 0 | 0.0% |
| Total | 414 | 100.0% |
Employment Status by Age in Rougemont
According to the labor force statistics for Rougemont, out of the total population over 16 years of age (763), 56.7% or 433 individuals are in the labor force, with 4.4% or 19 of them unemployed. The age group with the highest labor force participation rate is 20 to 24 years, with 100.0% or 16 individuals in the labor force. Within the labor force, the 35 to 44 years age range has the highest percentage of unemployed individuals, with 17.1% or 19 of them being unemployed.
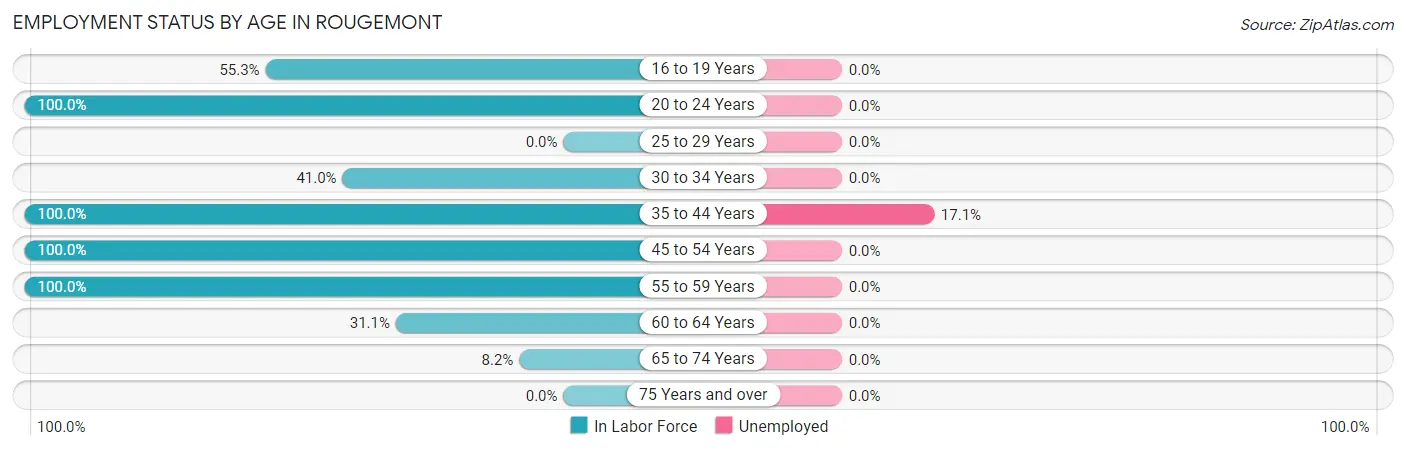
| Age Bracket | In Labor Force | Unemployed |
| 16 to 19 Years | 21 (55.3%) | 0 (0.0%) |
| 20 to 24 Years | 16 (100.0%) | 0 (0.0%) |
| 25 to 29 Years | 0 (0.0%) | 0 (0.0%) |
| 30 to 34 Years | 16 (41.0%) | 0 (0.0%) |
| 35 to 44 Years | 111 (100.0%) | 19 (17.1%) |
| 45 to 54 Years | 190 (100.0%) | 0 (0.0%) |
| 55 to 59 Years | 47 (100.0%) | 0 (0.0%) |
| 60 to 64 Years | 19 (31.1%) | 0 (0.0%) |
| 65 to 74 Years | 13 (8.2%) | 0 (0.0%) |
| 75 Years and over | 0 (0.0%) | 0 (0.0%) |
| Total | 433 (56.7%) | 19 (4.4%) |
Employment Status by Educational Attainment in Rougemont
According to labor force statistics for Rougemont, 85.5% of individuals (383) out of the total population between 25 and 64 years of age (448) are in the labor force, with 5.0% or 19 of them being unemployed. The group with the highest labor force participation rate are those with the educational attainment of college / associate degree, with 100.0% or 120 individuals in the labor force. Within the labor force, individuals with high school diploma education have the highest percentage of unemployment, with 16.2% or 19 of them being unemployed.
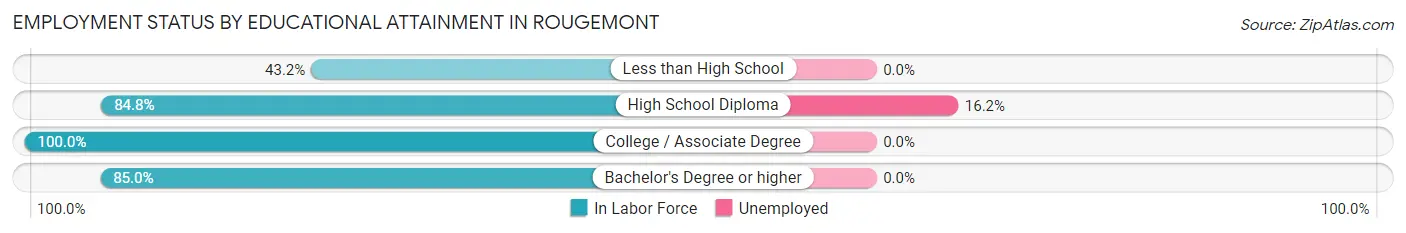
| Educational Attainment | In Labor Force | Unemployed |
| Less than High School | 16 (43.2%) | 0 (0.0%) |
| High School Diploma | 117 (84.8%) | 22 (16.2%) |
| College / Associate Degree | 120 (100.0%) | 0 (0.0%) |
| Bachelor's Degree or higher | 130 (85.0%) | 0 (0.0%) |
| Total | 383 (85.5%) | 22 (5.0%) |
Employment Occupations by Sex in Rougemont
Management, Business, Science and Arts Occupations
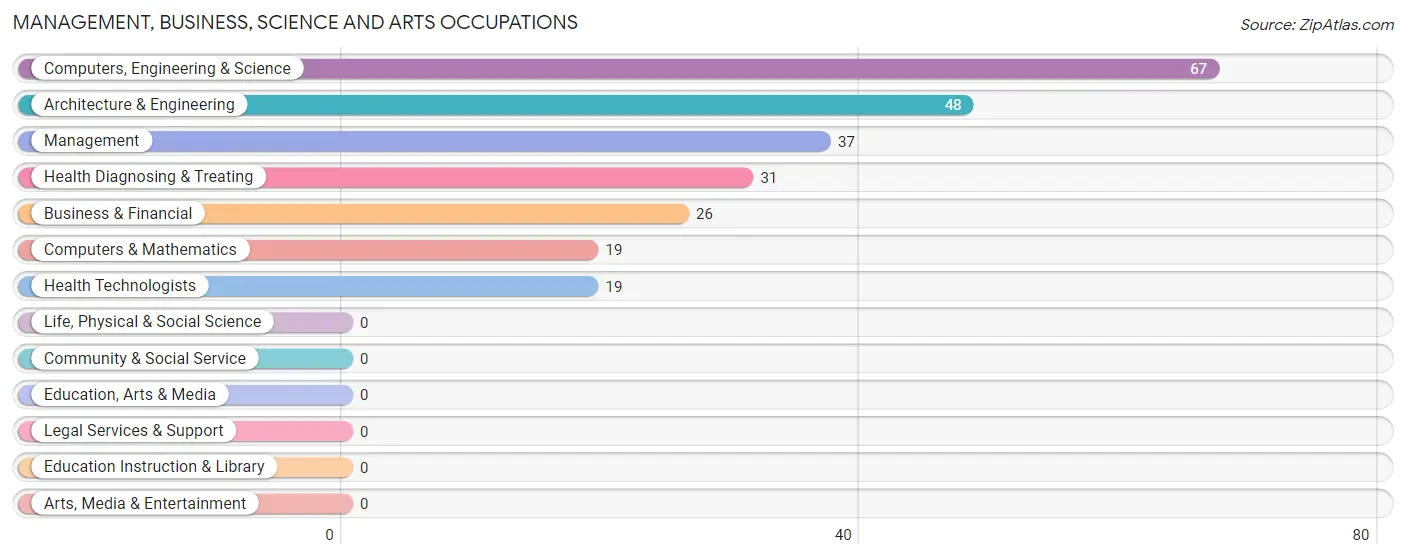
The most common Management, Business, Science and Arts occupations in Rougemont are Computers, Engineering & Science (67 | 16.2%), Architecture & Engineering (48 | 11.6%), Management (37 | 8.9%), Health Diagnosing & Treating (31 | 7.5%), and Business & Financial (26 | 6.3%).
Management, Business, Science and Arts Occupations by Sex
Within the Management, Business, Science and Arts occupations in Rougemont, the most male-oriented occupations are Business & Financial (100.0%), Computers & Mathematics (100.0%), and Management (32.4%), while the most female-oriented occupations are Architecture & Engineering (100.0%), Health Diagnosing & Treating (100.0%), and Health Technologists (100.0%).
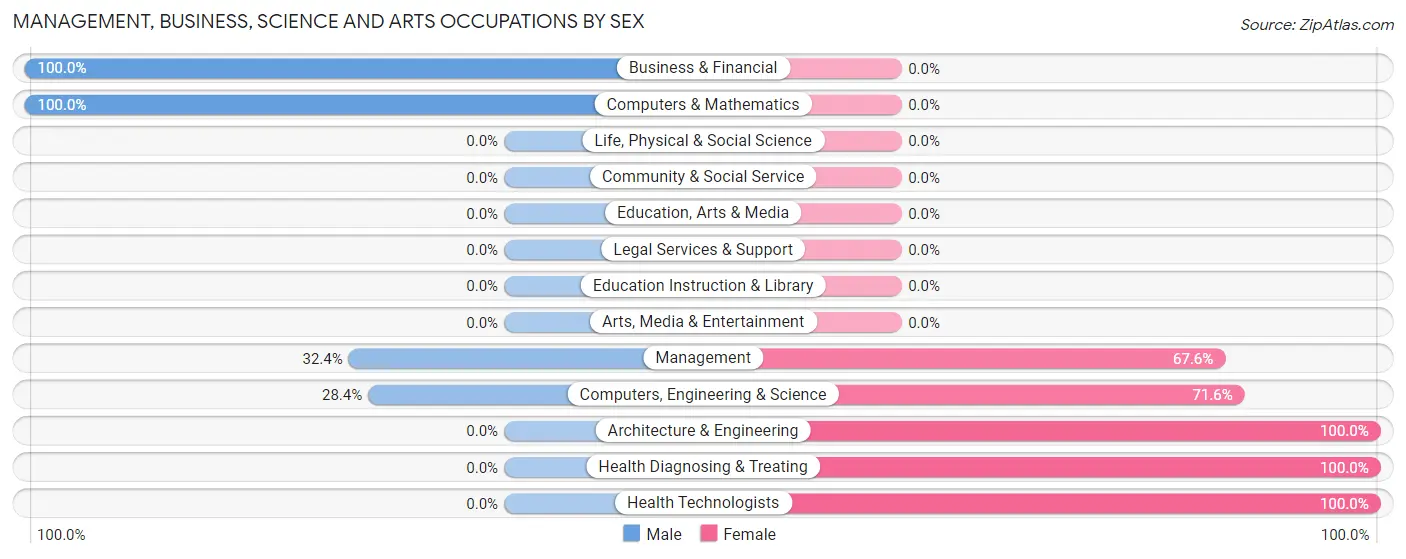
| Occupation | Male | Female |
| Management | 12 (32.4%) | 25 (67.6%) |
| Business & Financial | 26 (100.0%) | 0 (0.0%) |
| Computers, Engineering & Science | 19 (28.4%) | 48 (71.6%) |
| Computers & Mathematics | 19 (100.0%) | 0 (0.0%) |
| Architecture & Engineering | 0 (0.0%) | 48 (100.0%) |
| Life, Physical & Social Science | 0 (0.0%) | 0 (0.0%) |
| Community & Social Service | 0 (0.0%) | 0 (0.0%) |
| Education, Arts & Media | 0 (0.0%) | 0 (0.0%) |
| Legal Services & Support | 0 (0.0%) | 0 (0.0%) |
| Education Instruction & Library | 0 (0.0%) | 0 (0.0%) |
| Arts, Media & Entertainment | 0 (0.0%) | 0 (0.0%) |
| Health Diagnosing & Treating | 0 (0.0%) | 31 (100.0%) |
| Health Technologists | 0 (0.0%) | 19 (100.0%) |
| Total (Category) | 57 (35.4%) | 104 (64.6%) |
| Total (Overall) | 141 (34.1%) | 273 (65.9%) |
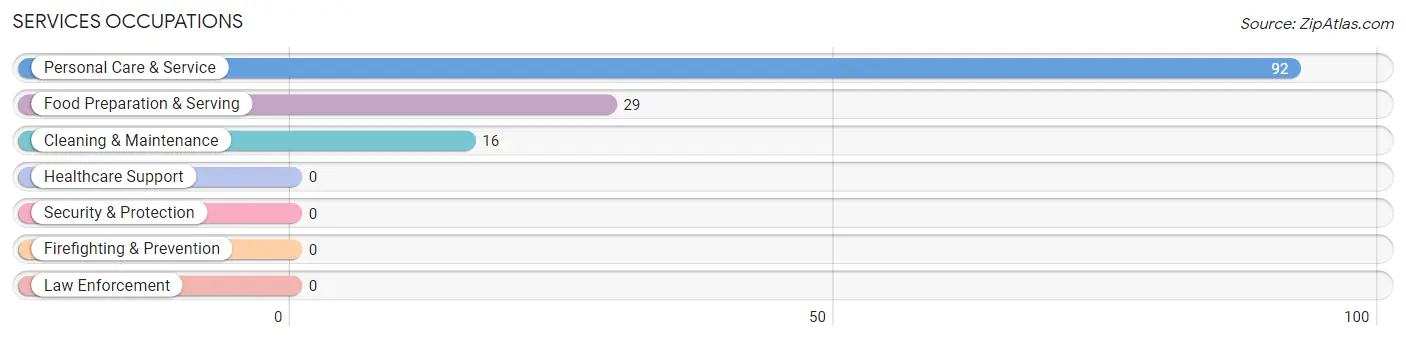
Services Occupations
The most common Services occupations in Rougemont are Personal Care & Service (92 | 22.2%), Food Preparation & Serving (29 | 7.0%), and Cleaning & Maintenance (16 | 3.9%).
Services Occupations by Sex
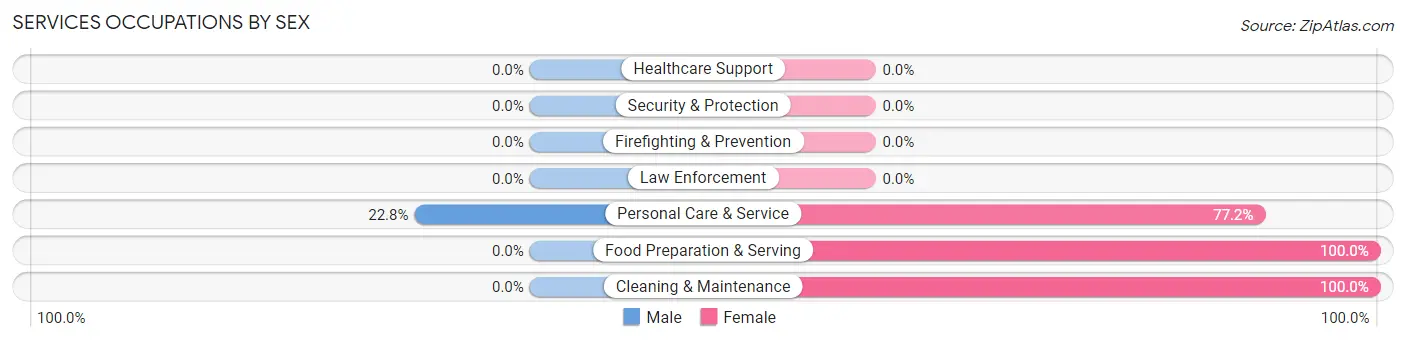
| Occupation | Male | Female |
| Healthcare Support | 0 (0.0%) | 0 (0.0%) |
| Security & Protection | 0 (0.0%) | 0 (0.0%) |
| Firefighting & Prevention | 0 (0.0%) | 0 (0.0%) |
| Law Enforcement | 0 (0.0%) | 0 (0.0%) |
| Food Preparation & Serving | 0 (0.0%) | 29 (100.0%) |
| Cleaning & Maintenance | 0 (0.0%) | 16 (100.0%) |
| Personal Care & Service | 21 (22.8%) | 71 (77.2%) |
| Total (Category) | 21 (15.3%) | 116 (84.7%) |
| Total (Overall) | 141 (34.1%) | 273 (65.9%) |
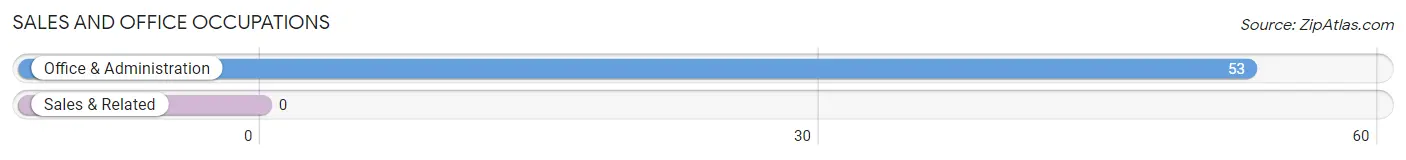
Sales and Office Occupations
The most common Sales and Office occupations in Rougemont are , and Office & Administration (53 | 12.8%).
Sales and Office Occupations by Sex
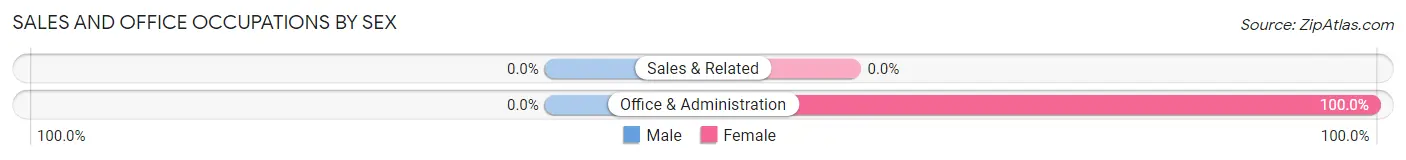
| Occupation | Male | Female |
| Sales & Related | 0 (0.0%) | 0 (0.0%) |
| Office & Administration | 0 (0.0%) | 53 (100.0%) |
| Total (Category) | 0 (0.0%) | 53 (100.0%) |
| Total (Overall) | 141 (34.1%) | 273 (65.9%) |
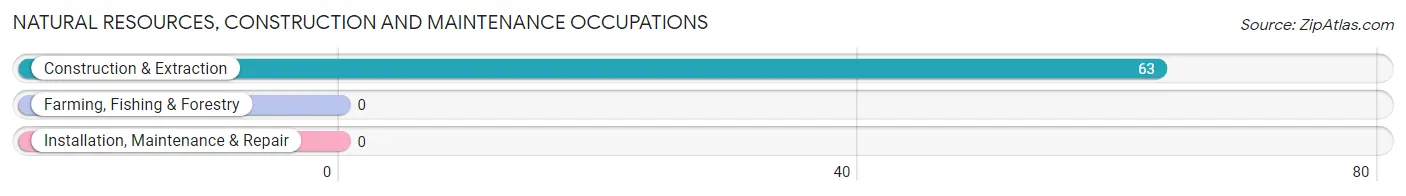
Natural Resources, Construction and Maintenance Occupations
The most common Natural Resources, Construction and Maintenance occupations in Rougemont are , and Construction & Extraction (63 | 15.2%).
Natural Resources, Construction and Maintenance Occupations by Sex
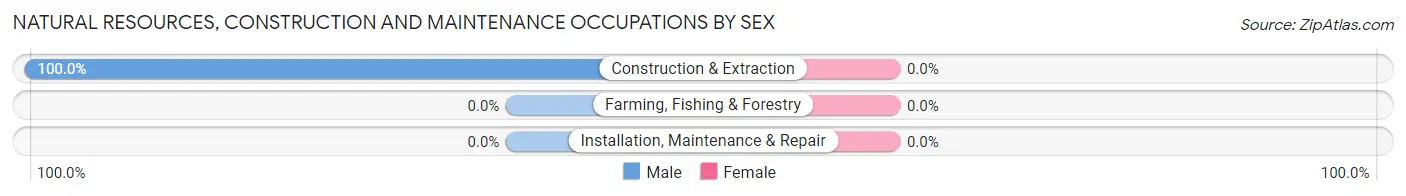
| Occupation | Male | Female |
| Farming, Fishing & Forestry | 0 (0.0%) | 0 (0.0%) |
| Construction & Extraction | 63 (100.0%) | 0 (0.0%) |
| Installation, Maintenance & Repair | 0 (0.0%) | 0 (0.0%) |
| Total (Category) | 63 (100.0%) | 0 (0.0%) |
| Total (Overall) | 141 (34.1%) | 273 (65.9%) |
Production, Transportation and Moving Occupations
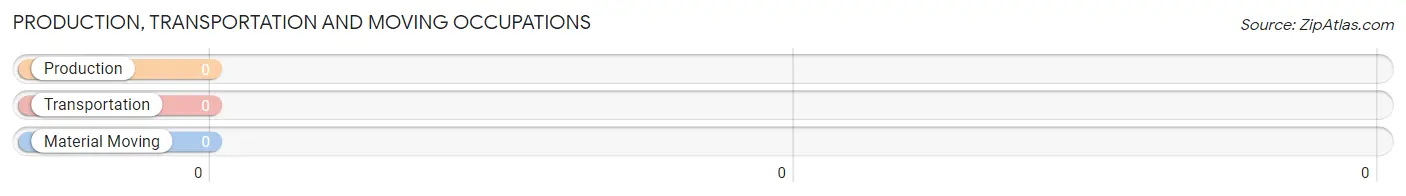
Production, Transportation and Moving Occupations by Sex
| Occupation | Male | Female |
| Production | 0 (0.0%) | 0 (0.0%) |
| Transportation | 0 (0.0%) | 0 (0.0%) |
| Material Moving | 0 (0.0%) | 0 (0.0%) |
| Total (Category) | 0 (0.0%) | 0 (0.0%) |
| Total (Overall) | 141 (34.1%) | 273 (65.9%) |
Employment Industries by Sex in Rougemont
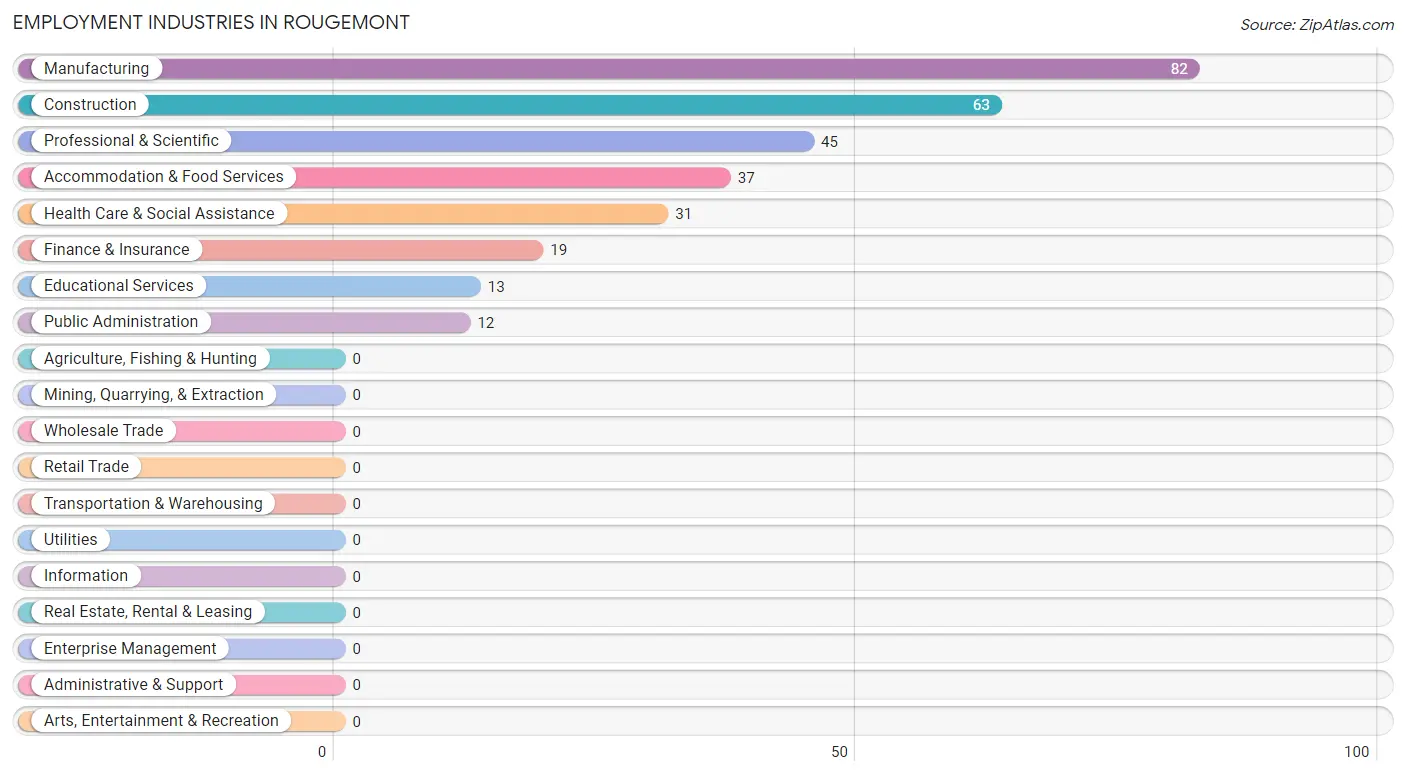
Employment Industries in Rougemont
The major employment industries in Rougemont include Manufacturing (82 | 19.8%), Construction (63 | 15.2%), Professional & Scientific (45 | 10.9%), Accommodation & Food Services (37 | 8.9%), and Health Care & Social Assistance (31 | 7.5%).
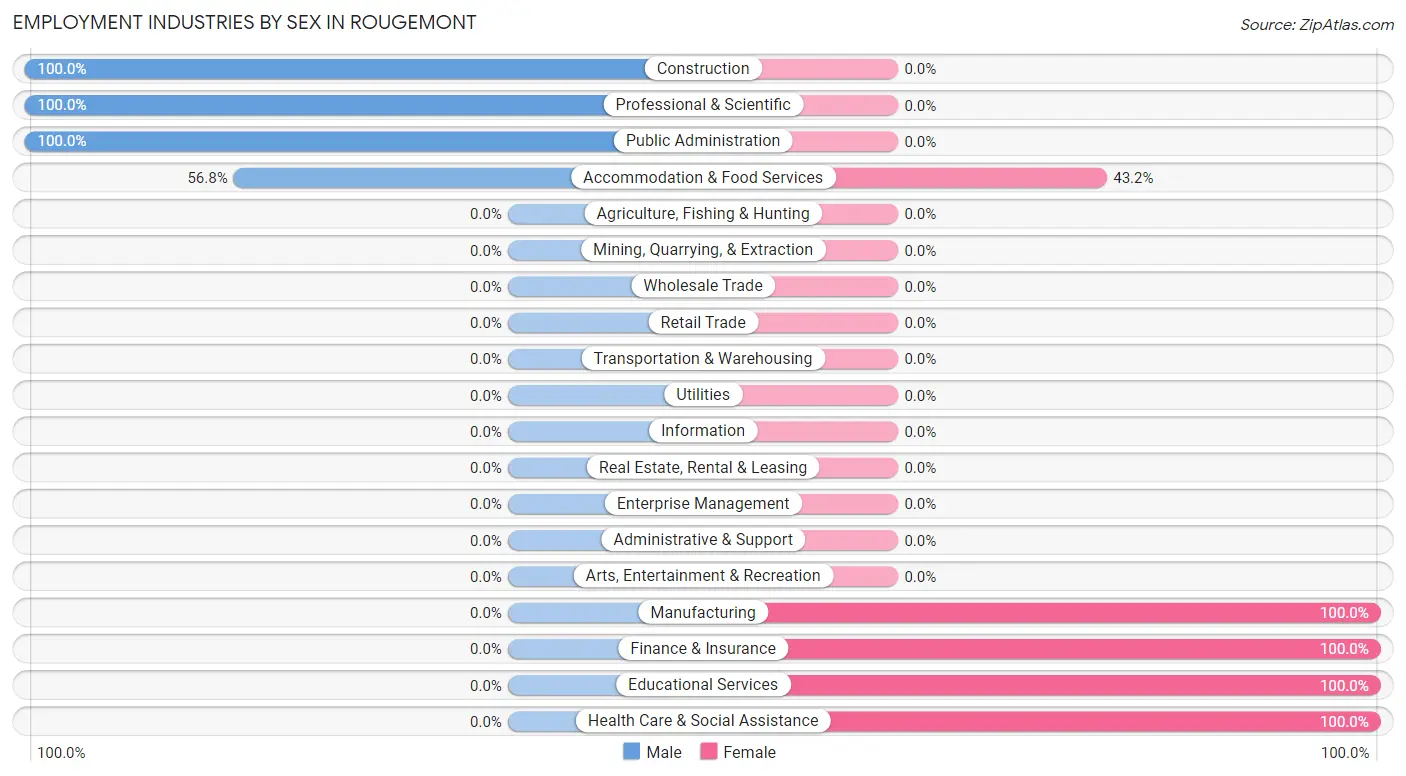
Employment Industries by Sex in Rougemont
The Rougemont industries that see more men than women are Construction (100.0%), Professional & Scientific (100.0%), and Public Administration (100.0%), whereas the industries that tend to have a higher number of women are Manufacturing (100.0%), Finance & Insurance (100.0%), and Educational Services (100.0%).
| Industry | Male | Female |
| Agriculture, Fishing & Hunting | 0 (0.0%) | 0 (0.0%) |
| Mining, Quarrying, & Extraction | 0 (0.0%) | 0 (0.0%) |
| Construction | 63 (100.0%) | 0 (0.0%) |
| Manufacturing | 0 (0.0%) | 82 (100.0%) |
| Wholesale Trade | 0 (0.0%) | 0 (0.0%) |
| Retail Trade | 0 (0.0%) | 0 (0.0%) |
| Transportation & Warehousing | 0 (0.0%) | 0 (0.0%) |
| Utilities | 0 (0.0%) | 0 (0.0%) |
| Information | 0 (0.0%) | 0 (0.0%) |
| Finance & Insurance | 0 (0.0%) | 19 (100.0%) |
| Real Estate, Rental & Leasing | 0 (0.0%) | 0 (0.0%) |
| Professional & Scientific | 45 (100.0%) | 0 (0.0%) |
| Enterprise Management | 0 (0.0%) | 0 (0.0%) |
| Administrative & Support | 0 (0.0%) | 0 (0.0%) |
| Educational Services | 0 (0.0%) | 13 (100.0%) |
| Health Care & Social Assistance | 0 (0.0%) | 31 (100.0%) |
| Arts, Entertainment & Recreation | 0 (0.0%) | 0 (0.0%) |
| Accommodation & Food Services | 21 (56.8%) | 16 (43.2%) |
| Public Administration | 12 (100.0%) | 0 (0.0%) |
| Total | 141 (34.1%) | 273 (65.9%) |
Education in Rougemont
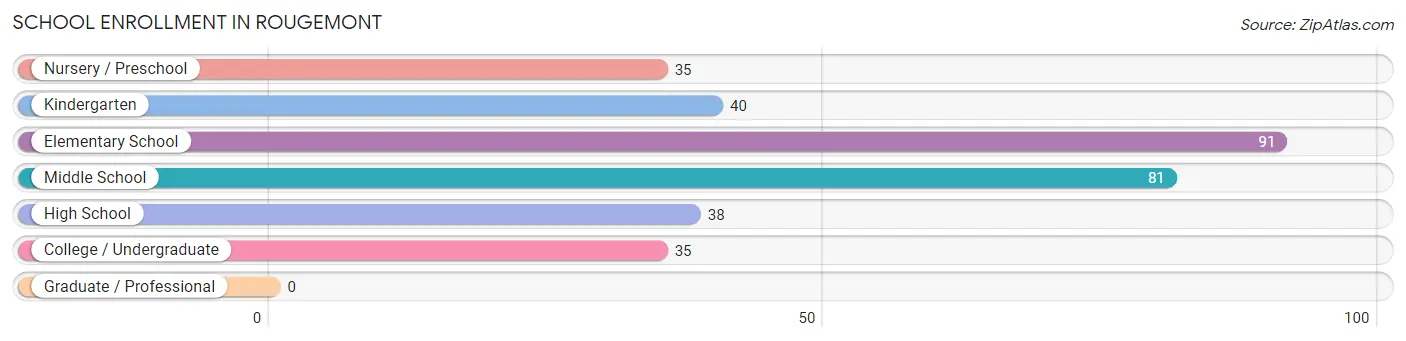
School Enrollment in Rougemont
The most common levels of schooling among the 320 students in Rougemont are elementary school (91 | 28.4%), middle school (81 | 25.3%), and kindergarten (40 | 12.5%).
| School Level | # Students | % Students |
| Nursery / Preschool | 35 | 10.9% |
| Kindergarten | 40 | 12.5% |
| Elementary School | 91 | 28.4% |
| Middle School | 81 | 25.3% |
| High School | 38 | 11.9% |
| College / Undergraduate | 35 | 10.9% |
| Graduate / Professional | 0 | 0.0% |
| Total | 320 | 100.0% |
School Enrollment by Age by Funding Source in Rougemont
Out of a total of 320 students who are enrolled in schools in Rougemont, 79 (24.7%) attend a private institution, while the remaining 241 (75.3%) are enrolled in public schools. The age group of 3 to 4 year olds has the highest likelihood of being enrolled in private schools, with 35 (100.0% in the age bracket) enrolled. Conversely, the age group of 10 to 14 year olds has the lowest likelihood of being enrolled in a private school, with 81 (100.0% in the age bracket) attending a public institution.
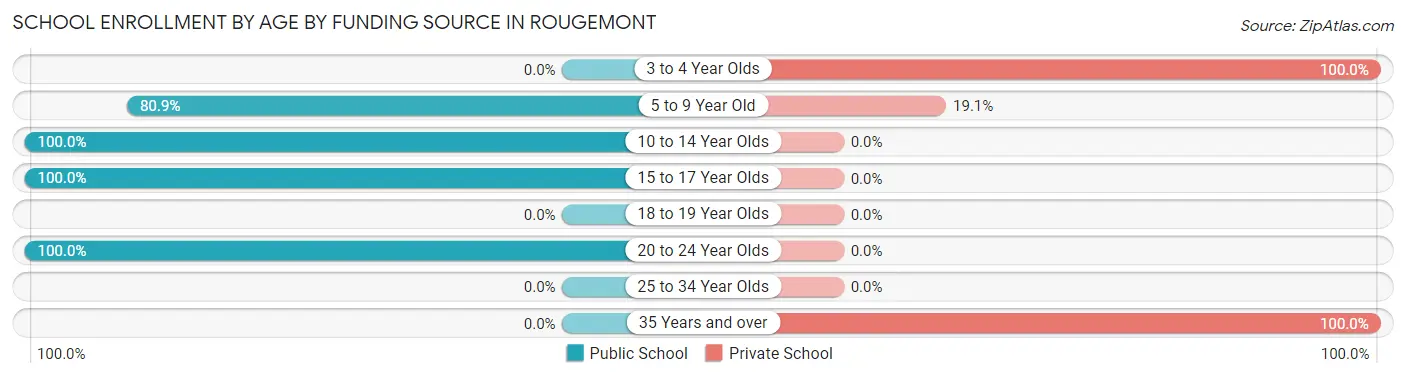
| Age Bracket | Public School | Private School |
| 3 to 4 Year Olds | 0 (0.0%) | 35 (100.0%) |
| 5 to 9 Year Old | 106 (80.9%) | 25 (19.1%) |
| 10 to 14 Year Olds | 81 (100.0%) | 0 (0.0%) |
| 15 to 17 Year Olds | 38 (100.0%) | 0 (0.0%) |
| 18 to 19 Year Olds | 0 (0.0%) | 0 (0.0%) |
| 20 to 24 Year Olds | 16 (100.0%) | 0 (0.0%) |
| 25 to 34 Year Olds | 0 (0.0%) | 0 (0.0%) |
| 35 Years and over | 0 (0.0%) | 19 (100.0%) |
| Total | 241 (75.3%) | 79 (24.7%) |
Educational Attainment by Field of Study in Rougemont
Engineering (62 | 34.3%), business (49 | 27.1%), science & technology (19 | 10.5%), communications (19 | 10.5%), and social sciences (18 | 9.9%) are the most common fields of study among 181 individuals in Rougemont who have obtained a bachelor's degree or higher.
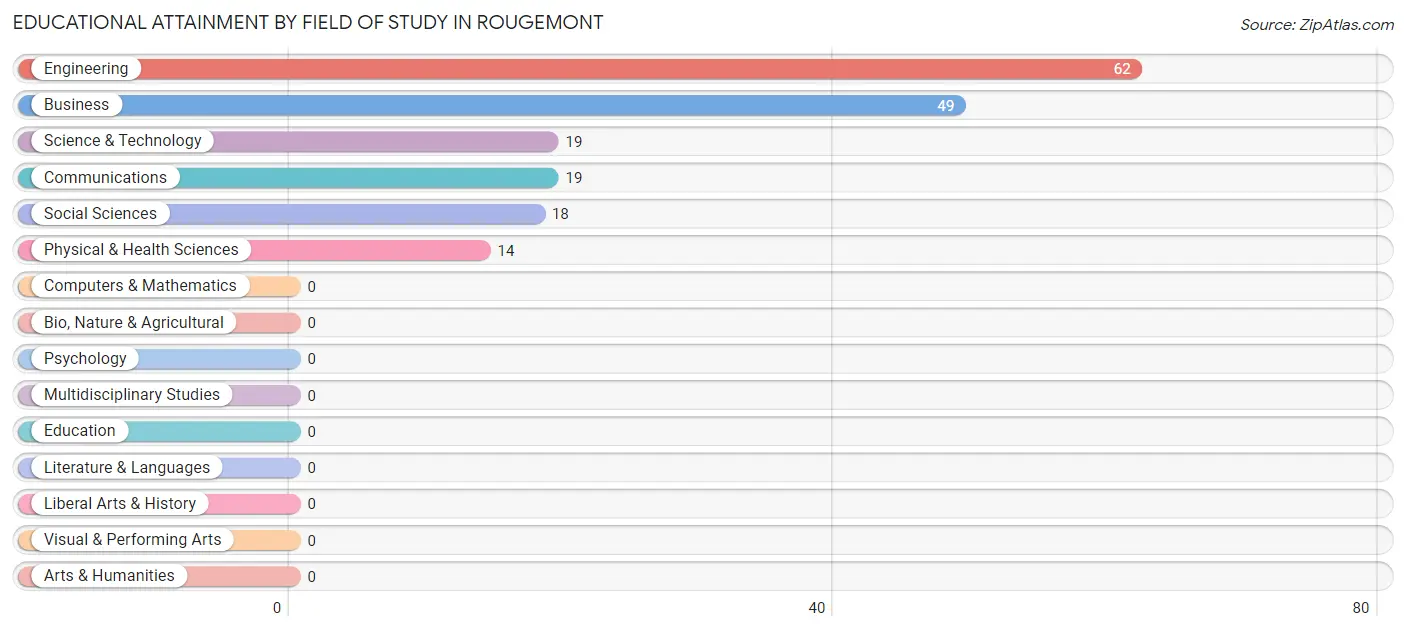
| Field of Study | # Graduates | % Graduates |
| Computers & Mathematics | 0 | 0.0% |
| Bio, Nature & Agricultural | 0 | 0.0% |
| Physical & Health Sciences | 14 | 7.7% |
| Psychology | 0 | 0.0% |
| Social Sciences | 18 | 9.9% |
| Engineering | 62 | 34.3% |
| Multidisciplinary Studies | 0 | 0.0% |
| Science & Technology | 19 | 10.5% |
| Business | 49 | 27.1% |
| Education | 0 | 0.0% |
| Literature & Languages | 0 | 0.0% |
| Liberal Arts & History | 0 | 0.0% |
| Visual & Performing Arts | 0 | 0.0% |
| Communications | 19 | 10.5% |
| Arts & Humanities | 0 | 0.0% |
| Total | 181 | 100.0% |
Transportation & Commute in Rougemont
Vehicle Availability by Sex in Rougemont
The most prevalent vehicle ownership categories in Rougemont are males with 4 vehicles (115, accounting for 81.6%) and females with 4 vehicles (119, making up 42.1%).
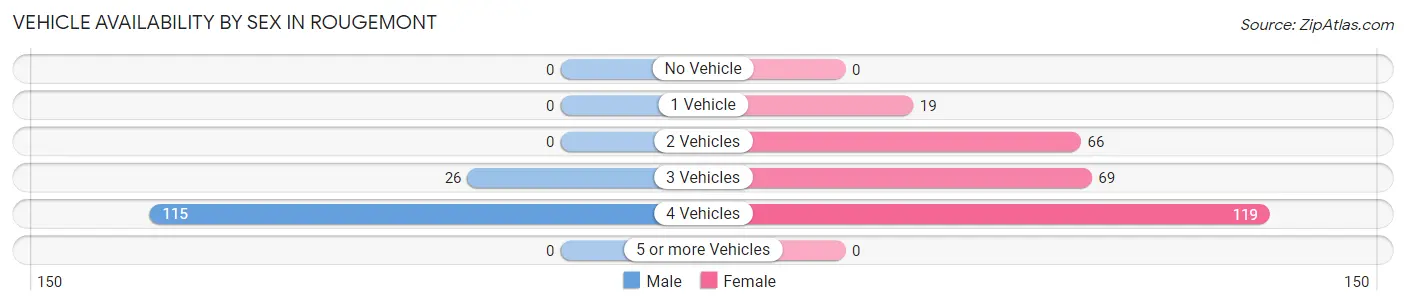
| Vehicles Available | Male | Female |
| No Vehicle | 0 (0.0%) | 0 (0.0%) |
| 1 Vehicle | 0 (0.0%) | 19 (7.0%) |
| 2 Vehicles | 0 (0.0%) | 66 (24.2%) |
| 3 Vehicles | 26 (18.4%) | 69 (25.3%) |
| 4 Vehicles | 115 (81.6%) | 119 (43.6%) |
| 5 or more Vehicles | 0 (0.0%) | 0 (0.0%) |
| Total | 141 (100.0%) | 273 (100.0%) |
Commute Time in Rougemont
The most frequently occuring commute durations in Rougemont are 25 to 29 minutes (112 commuters, 31.9%), 15 to 19 minutes (85 commuters, 24.2%), and 30 to 34 minutes (73 commuters, 20.8%).
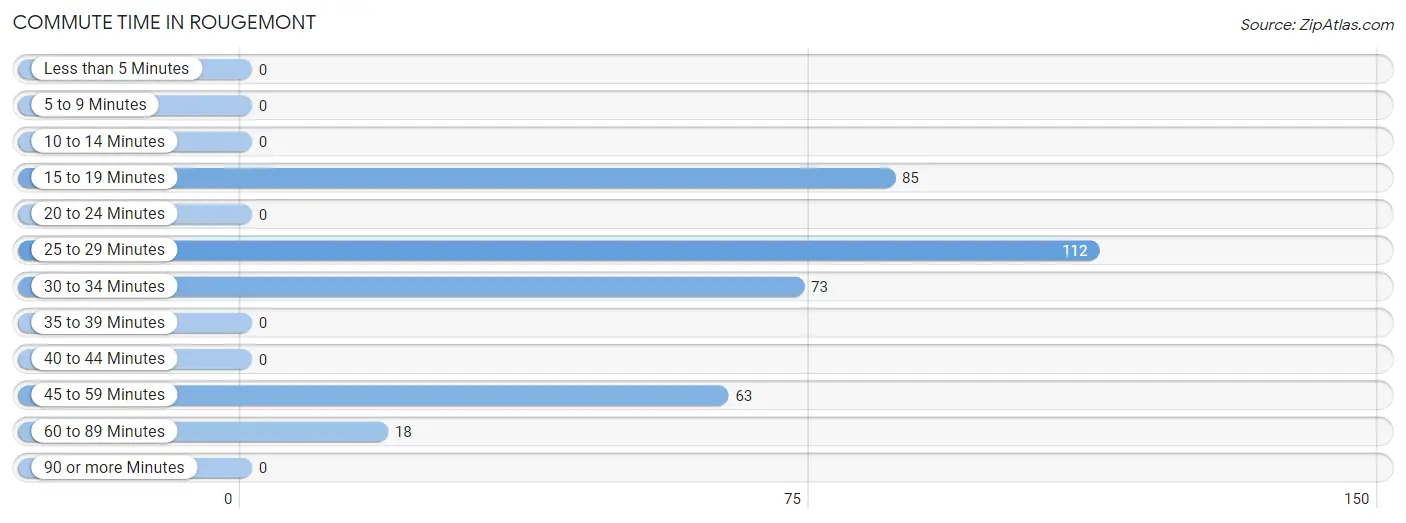
| Commute Time | # Commuters | % Commuters |
| Less than 5 Minutes | 0 | 0.0% |
| 5 to 9 Minutes | 0 | 0.0% |
| 10 to 14 Minutes | 0 | 0.0% |
| 15 to 19 Minutes | 85 | 24.2% |
| 20 to 24 Minutes | 0 | 0.0% |
| 25 to 29 Minutes | 112 | 31.9% |
| 30 to 34 Minutes | 73 | 20.8% |
| 35 to 39 Minutes | 0 | 0.0% |
| 40 to 44 Minutes | 0 | 0.0% |
| 45 to 59 Minutes | 63 | 17.9% |
| 60 to 89 Minutes | 18 | 5.1% |
| 90 or more Minutes | 0 | 0.0% |
Commute Time by Sex in Rougemont
The most common commute times in Rougemont are 25 to 29 minutes (96 commuters, 83.5%) for males and 15 to 19 minutes (85 commuters, 36.0%) for females.
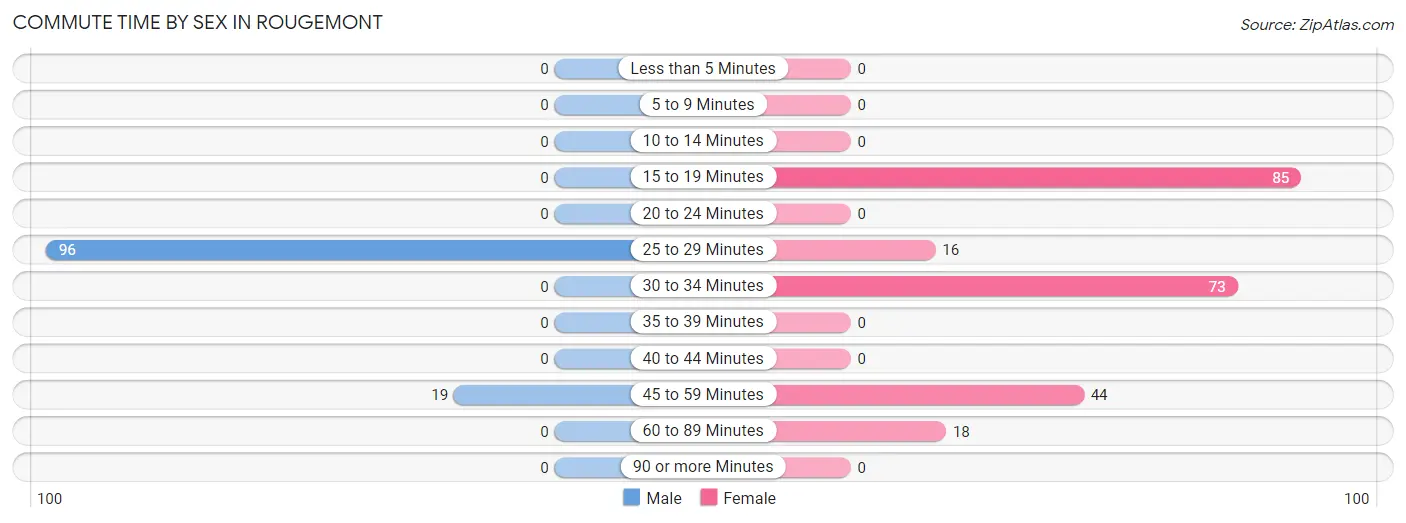
| Commute Time | Male | Female |
| Less than 5 Minutes | 0 (0.0%) | 0 (0.0%) |
| 5 to 9 Minutes | 0 (0.0%) | 0 (0.0%) |
| 10 to 14 Minutes | 0 (0.0%) | 0 (0.0%) |
| 15 to 19 Minutes | 0 (0.0%) | 85 (36.0%) |
| 20 to 24 Minutes | 0 (0.0%) | 0 (0.0%) |
| 25 to 29 Minutes | 96 (83.5%) | 16 (6.8%) |
| 30 to 34 Minutes | 0 (0.0%) | 73 (30.9%) |
| 35 to 39 Minutes | 0 (0.0%) | 0 (0.0%) |
| 40 to 44 Minutes | 0 (0.0%) | 0 (0.0%) |
| 45 to 59 Minutes | 19 (16.5%) | 44 (18.6%) |
| 60 to 89 Minutes | 0 (0.0%) | 18 (7.6%) |
| 90 or more Minutes | 0 (0.0%) | 0 (0.0%) |
Time of Departure to Work by Sex in Rougemont
The most frequent times of departure to work in Rougemont are 6:00 AM to 6:29 AM (75, 65.2%) for males and 10:00 AM to 10:59 AM (71, 30.1%) for females.
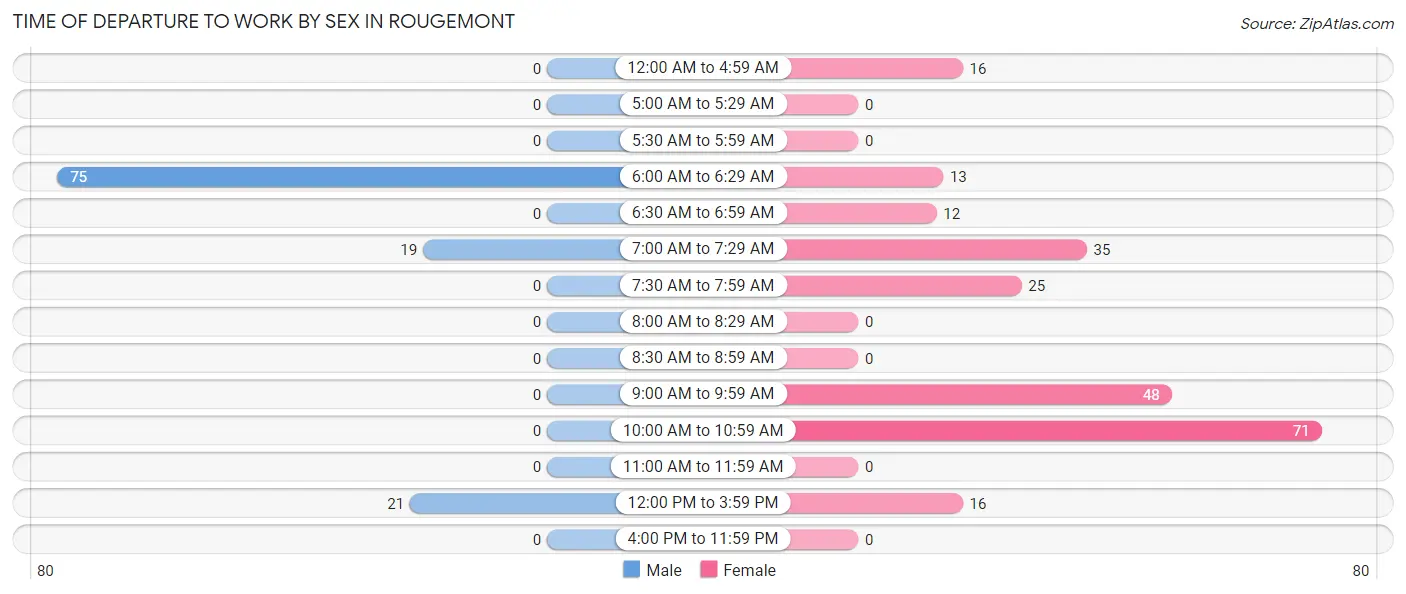
| Time of Departure | Male | Female |
| 12:00 AM to 4:59 AM | 0 (0.0%) | 16 (6.8%) |
| 5:00 AM to 5:29 AM | 0 (0.0%) | 0 (0.0%) |
| 5:30 AM to 5:59 AM | 0 (0.0%) | 0 (0.0%) |
| 6:00 AM to 6:29 AM | 75 (65.2%) | 13 (5.5%) |
| 6:30 AM to 6:59 AM | 0 (0.0%) | 12 (5.1%) |
| 7:00 AM to 7:29 AM | 19 (16.5%) | 35 (14.8%) |
| 7:30 AM to 7:59 AM | 0 (0.0%) | 25 (10.6%) |
| 8:00 AM to 8:29 AM | 0 (0.0%) | 0 (0.0%) |
| 8:30 AM to 8:59 AM | 0 (0.0%) | 0 (0.0%) |
| 9:00 AM to 9:59 AM | 0 (0.0%) | 48 (20.3%) |
| 10:00 AM to 10:59 AM | 0 (0.0%) | 71 (30.1%) |
| 11:00 AM to 11:59 AM | 0 (0.0%) | 0 (0.0%) |
| 12:00 PM to 3:59 PM | 21 (18.3%) | 16 (6.8%) |
| 4:00 PM to 11:59 PM | 0 (0.0%) | 0 (0.0%) |
| Total | 115 (100.0%) | 236 (100.0%) |
Housing Occupancy in Rougemont
Occupancy by Ownership in Rougemont
Of the total 371 dwellings in Rougemont, owner-occupied units account for 371 (100.0%), while renter-occupied units make up 0 (0.0%).
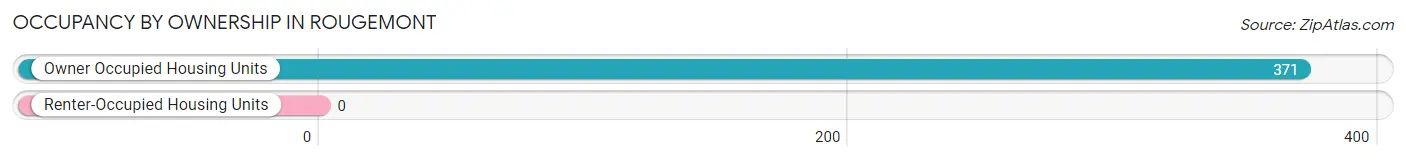
| Occupancy | # Housing Units | % Housing Units |
| Owner Occupied Housing Units | 371 | 100.0% |
| Renter-Occupied Housing Units | 0 | 0.0% |
| Total Occupied Housing Units | 371 | 100.0% |
Occupancy by Household Size in Rougemont
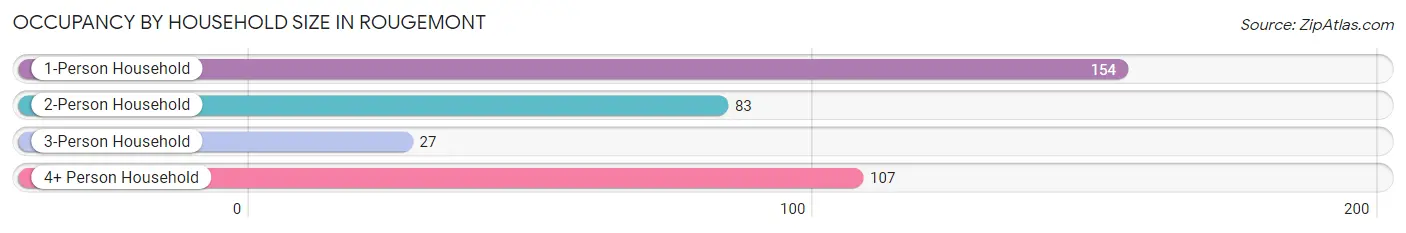
| Household Size | # Housing Units | % Housing Units |
| 1-Person Household | 154 | 41.5% |
| 2-Person Household | 83 | 22.4% |
| 3-Person Household | 27 | 7.3% |
| 4+ Person Household | 107 | 28.8% |
| Total Housing Units | 371 | 100.0% |
Occupancy by Ownership by Household Size in Rougemont
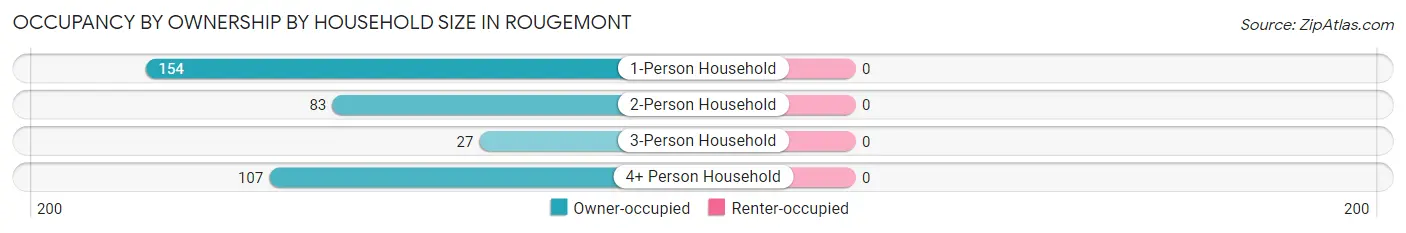
| Household Size | Owner-occupied | Renter-occupied |
| 1-Person Household | 154 (100.0%) | 0 (0.0%) |
| 2-Person Household | 83 (100.0%) | 0 (0.0%) |
| 3-Person Household | 27 (100.0%) | 0 (0.0%) |
| 4+ Person Household | 107 (100.0%) | 0 (0.0%) |
| Total Housing Units | 371 (100.0%) | 0 (0.0%) |
Occupancy by Educational Attainment in Rougemont
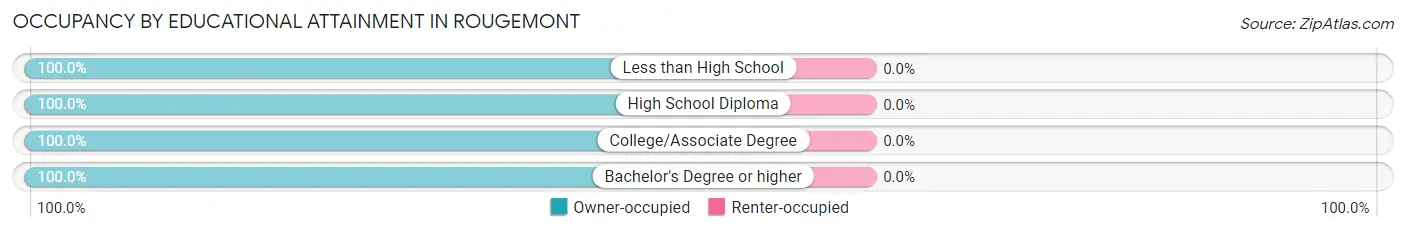
| Household Size | Owner-occupied | Renter-occupied |
| Less than High School | 53 (100.0%) | 0 (0.0%) |
| High School Diploma | 61 (100.0%) | 0 (0.0%) |
| College/Associate Degree | 187 (100.0%) | 0 (0.0%) |
| Bachelor's Degree or higher | 70 (100.0%) | 0 (0.0%) |
Occupancy by Age of Householder in Rougemont
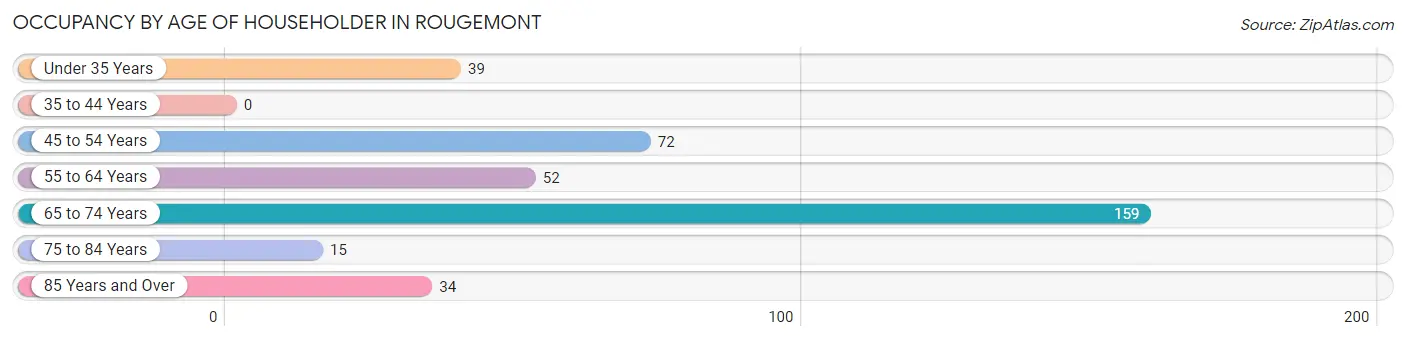
| Age Bracket | # Households | % Households |
| Under 35 Years | 39 | 10.5% |
| 35 to 44 Years | 0 | 0.0% |
| 45 to 54 Years | 72 | 19.4% |
| 55 to 64 Years | 52 | 14.0% |
| 65 to 74 Years | 159 | 42.9% |
| 75 to 84 Years | 15 | 4.0% |
| 85 Years and Over | 34 | 9.2% |
| Total | 371 | 100.0% |
Housing Finances in Rougemont
Median Income by Occupancy in Rougemont
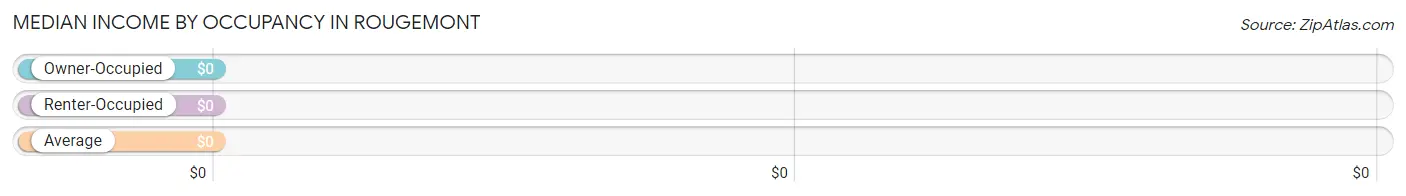
| Occupancy Type | # Households | Median Income |
| Owner-Occupied | 371 (100.0%) | $0 |
| Renter-Occupied | 0 (0.0%) | $0 |
| Average | 371 (100.0%) | $0 |
Occupancy by Householder Income Bracket in Rougemont
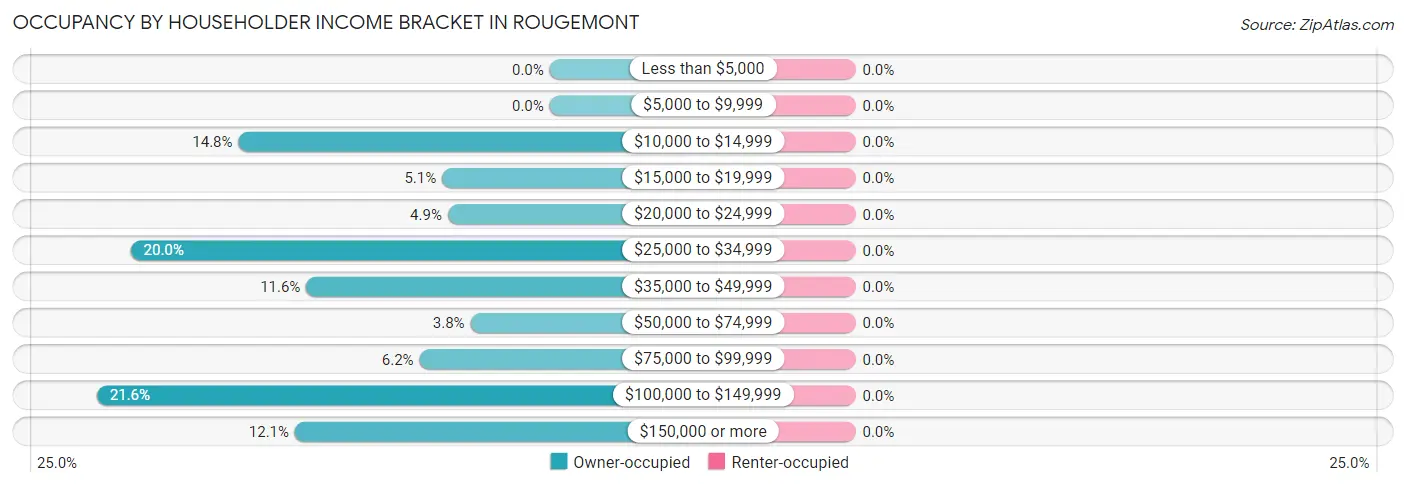
| Income Bracket | Owner-occupied | Renter-occupied |
| Less than $5,000 | 0 (0.0%) | 0 (0.0%) |
| $5,000 to $9,999 | 0 (0.0%) | 0 (0.0%) |
| $10,000 to $14,999 | 55 (14.8%) | 0 (0.0%) |
| $15,000 to $19,999 | 19 (5.1%) | 0 (0.0%) |
| $20,000 to $24,999 | 18 (4.9%) | 0 (0.0%) |
| $25,000 to $34,999 | 74 (20.0%) | 0 (0.0%) |
| $35,000 to $49,999 | 43 (11.6%) | 0 (0.0%) |
| $50,000 to $74,999 | 14 (3.8%) | 0 (0.0%) |
| $75,000 to $99,999 | 23 (6.2%) | 0 (0.0%) |
| $100,000 to $149,999 | 80 (21.6%) | 0 (0.0%) |
| $150,000 or more | 45 (12.1%) | 0 (0.0%) |
| Total | 371 (100.0%) | 0 (0.0%) |
Monthly Housing Cost Tiers in Rougemont
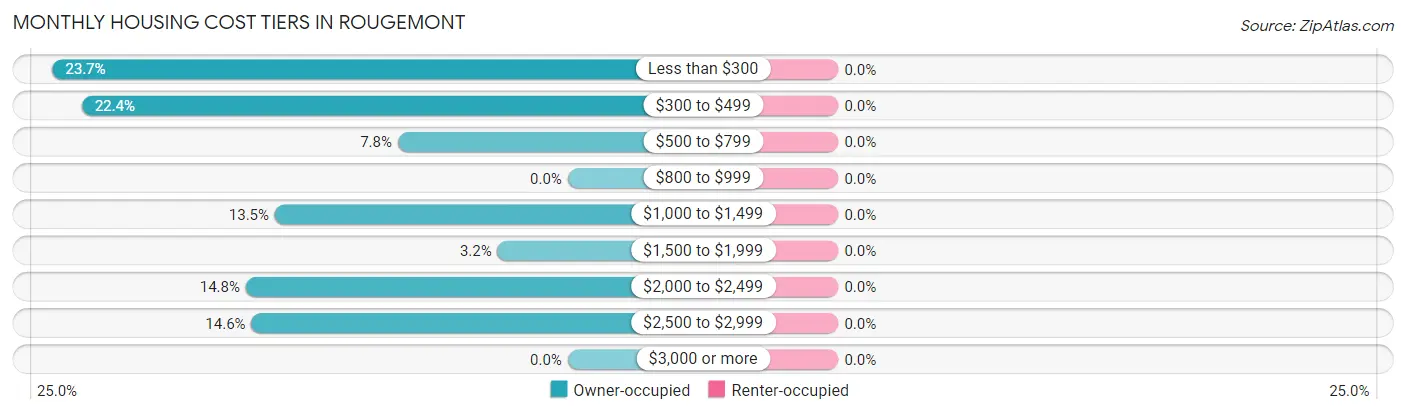
| Monthly Cost | Owner-occupied | Renter-occupied |
| Less than $300 | 88 (23.7%) | 0 (0.0%) |
| $300 to $499 | 83 (22.4%) | 0 (0.0%) |
| $500 to $799 | 29 (7.8%) | 0 (0.0%) |
| $800 to $999 | 0 (0.0%) | 0 (0.0%) |
| $1,000 to $1,499 | 50 (13.5%) | 0 (0.0%) |
| $1,500 to $1,999 | 12 (3.2%) | 0 (0.0%) |
| $2,000 to $2,499 | 55 (14.8%) | 0 (0.0%) |
| $2,500 to $2,999 | 54 (14.6%) | 0 (0.0%) |
| $3,000 or more | 0 (0.0%) | 0 (0.0%) |
| Total | 371 (100.0%) | 0 (0.0%) |
Physical Housing Characteristics in Rougemont
Housing Structures in Rougemont
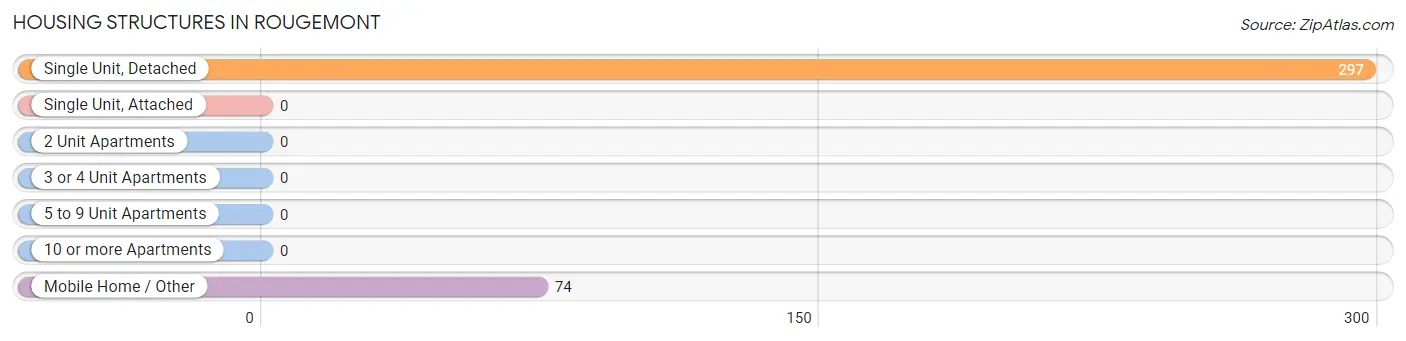
| Structure Type | # Housing Units | % Housing Units |
| Single Unit, Detached | 297 | 80.0% |
| Single Unit, Attached | 0 | 0.0% |
| 2 Unit Apartments | 0 | 0.0% |
| 3 or 4 Unit Apartments | 0 | 0.0% |
| 5 to 9 Unit Apartments | 0 | 0.0% |
| 10 or more Apartments | 0 | 0.0% |
| Mobile Home / Other | 74 | 20.0% |
| Total | 371 | 100.0% |
Housing Structures by Occupancy in Rougemont
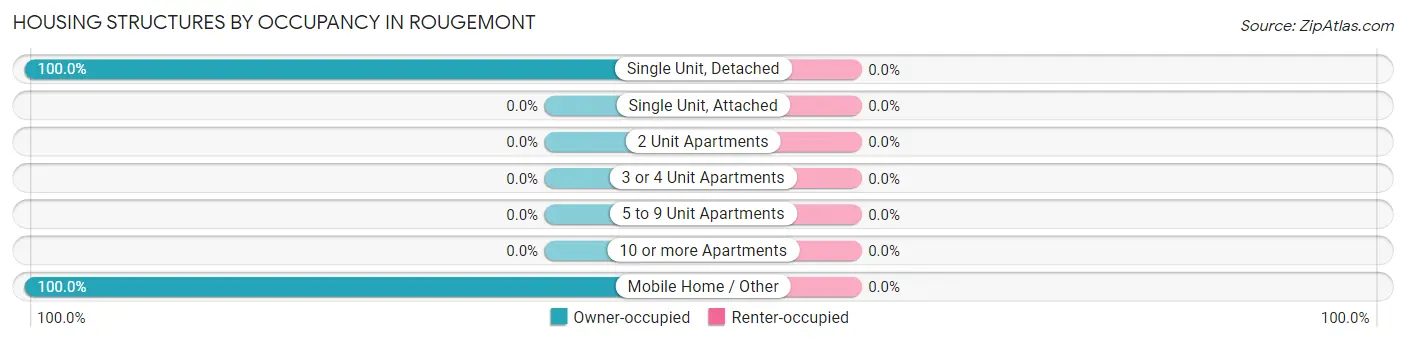
| Structure Type | Owner-occupied | Renter-occupied |
| Single Unit, Detached | 297 (100.0%) | 0 (0.0%) |
| Single Unit, Attached | 0 (0.0%) | 0 (0.0%) |
| 2 Unit Apartments | 0 (0.0%) | 0 (0.0%) |
| 3 or 4 Unit Apartments | 0 (0.0%) | 0 (0.0%) |
| 5 to 9 Unit Apartments | 0 (0.0%) | 0 (0.0%) |
| 10 or more Apartments | 0 (0.0%) | 0 (0.0%) |
| Mobile Home / Other | 74 (100.0%) | 0 (0.0%) |
| Total | 371 (100.0%) | 0 (0.0%) |
Housing Structures by Number of Rooms in Rougemont
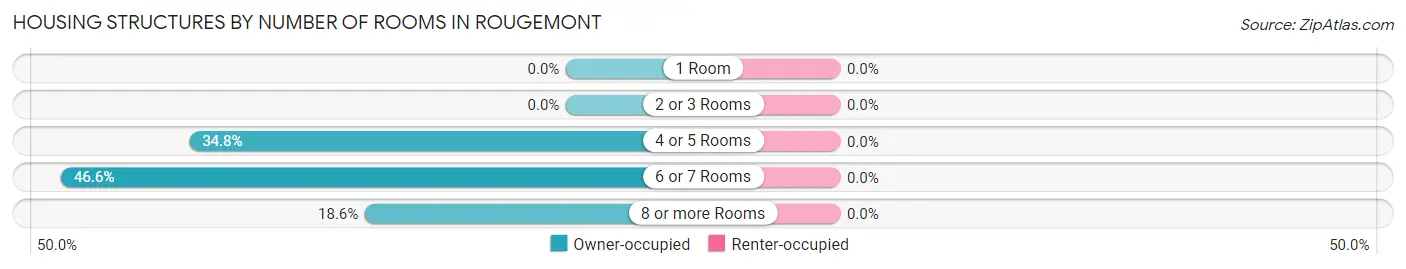
| Number of Rooms | Owner-occupied | Renter-occupied |
| 1 Room | 0 (0.0%) | 0 (0.0%) |
| 2 or 3 Rooms | 0 (0.0%) | 0 (0.0%) |
| 4 or 5 Rooms | 129 (34.8%) | 0 (0.0%) |
| 6 or 7 Rooms | 173 (46.6%) | 0 (0.0%) |
| 8 or more Rooms | 69 (18.6%) | 0 (0.0%) |
| Total | 371 (100.0%) | 0 (0.0%) |
Housing Structure by Heating Type in Rougemont
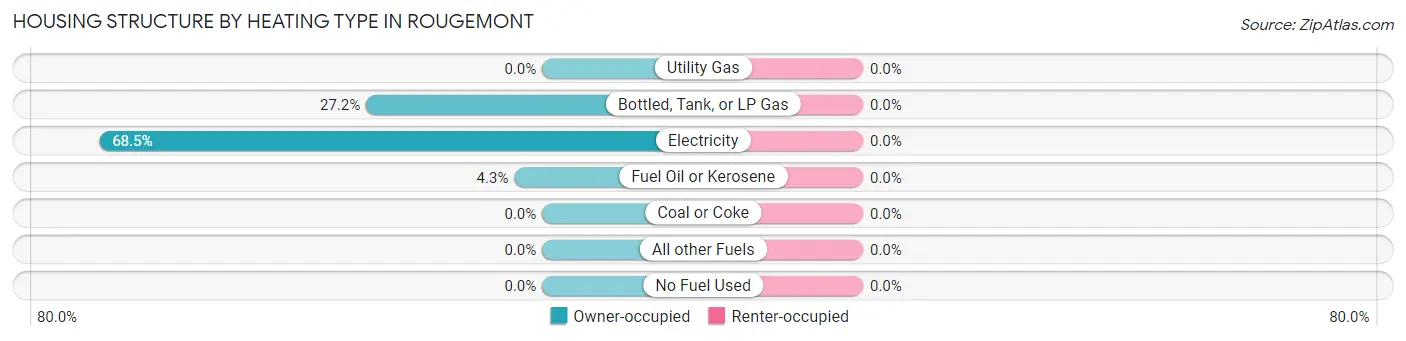
| Heating Type | Owner-occupied | Renter-occupied |
| Utility Gas | 0 (0.0%) | 0 (0.0%) |
| Bottled, Tank, or LP Gas | 101 (27.2%) | 0 (0.0%) |
| Electricity | 254 (68.5%) | 0 (0.0%) |
| Fuel Oil or Kerosene | 16 (4.3%) | 0 (0.0%) |
| Coal or Coke | 0 (0.0%) | 0 (0.0%) |
| All other Fuels | 0 (0.0%) | 0 (0.0%) |
| No Fuel Used | 0 (0.0%) | 0 (0.0%) |
| Total | 371 (100.0%) | 0 (0.0%) |
Household Vehicle Usage in Rougemont
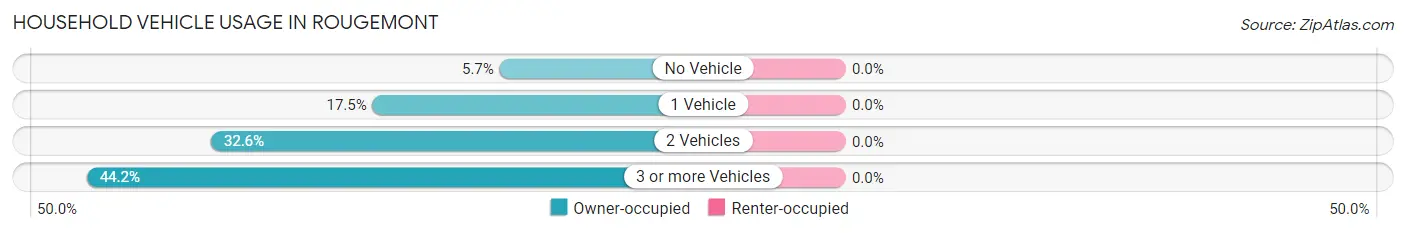
| Vehicles per Household | Owner-occupied | Renter-occupied |
| No Vehicle | 21 (5.7%) | 0 (0.0%) |
| 1 Vehicle | 65 (17.5%) | 0 (0.0%) |
| 2 Vehicles | 121 (32.6%) | 0 (0.0%) |
| 3 or more Vehicles | 164 (44.2%) | 0 (0.0%) |
| Total | 371 (100.0%) | 0 (0.0%) |
Real Estate & Mortgages in Rougemont
Real Estate and Mortgage Overview in Rougemont
| Characteristic | Without Mortgage | With Mortgage |
| Housing Units | 200 | 171 |
| Median Property Value | $160,900 | $301,600 |
| Median Household Income | $31,190 | $45 |
| Monthly Housing Costs | $370 | $0 |
| Real Estate Taxes | $1,203 | $0 |
Property Value by Mortgage Status in Rougemont
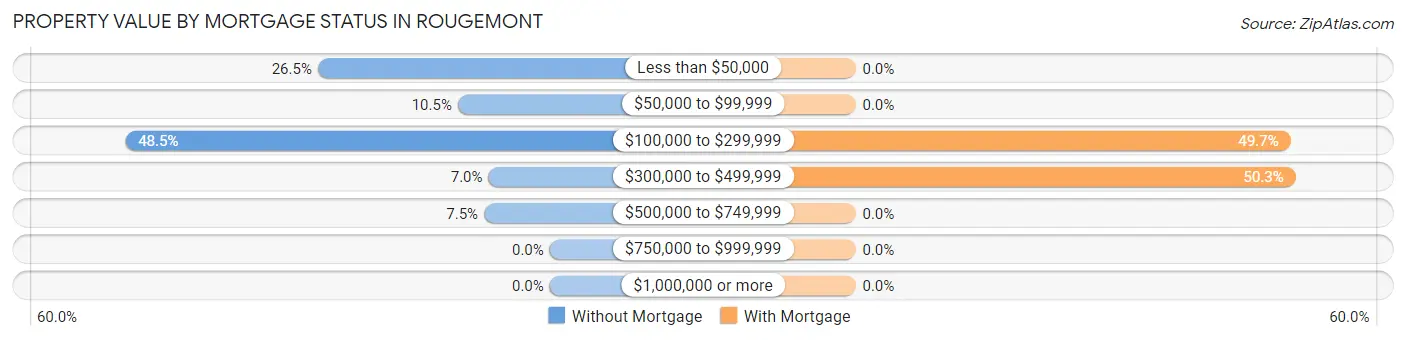
| Property Value | Without Mortgage | With Mortgage |
| Less than $50,000 | 53 (26.5%) | 0 (0.0%) |
| $50,000 to $99,999 | 21 (10.5%) | 0 (0.0%) |
| $100,000 to $299,999 | 97 (48.5%) | 85 (49.7%) |
| $300,000 to $499,999 | 14 (7.0%) | 86 (50.3%) |
| $500,000 to $749,999 | 15 (7.5%) | 0 (0.0%) |
| $750,000 to $999,999 | 0 (0.0%) | 0 (0.0%) |
| $1,000,000 or more | 0 (0.0%) | 0 (0.0%) |
| Total | 200 (100.0%) | 171 (100.0%) |
Household Income by Mortgage Status in Rougemont
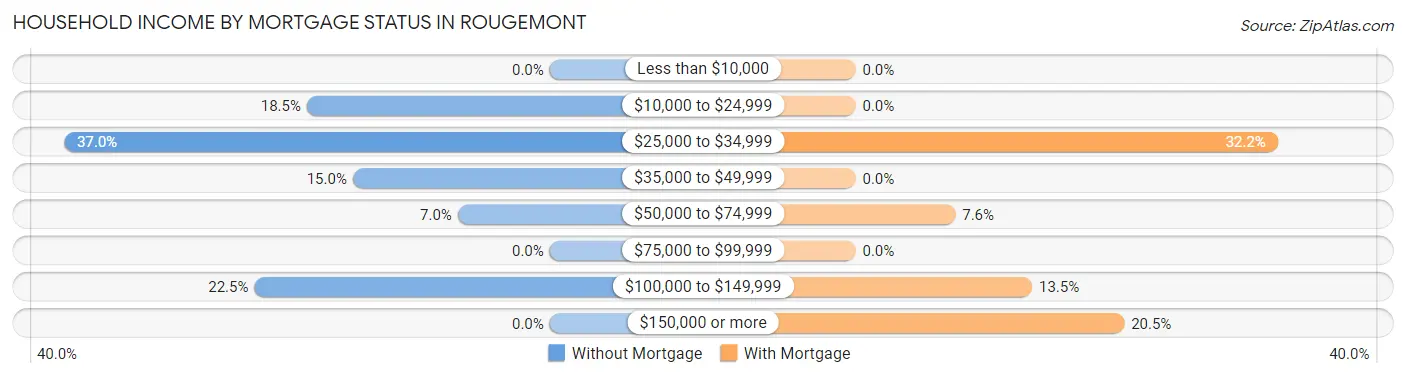
| Household Income | Without Mortgage | With Mortgage |
| Less than $10,000 | 0 (0.0%) | 0 (0.0%) |
| $10,000 to $24,999 | 37 (18.5%) | 0 (0.0%) |
| $25,000 to $34,999 | 74 (37.0%) | 55 (32.2%) |
| $35,000 to $49,999 | 30 (15.0%) | 0 (0.0%) |
| $50,000 to $74,999 | 14 (7.0%) | 13 (7.6%) |
| $75,000 to $99,999 | 0 (0.0%) | 0 (0.0%) |
| $100,000 to $149,999 | 45 (22.5%) | 23 (13.5%) |
| $150,000 or more | 0 (0.0%) | 35 (20.5%) |
| Total | 200 (100.0%) | 171 (100.0%) |
Property Value to Household Income Ratio in Rougemont
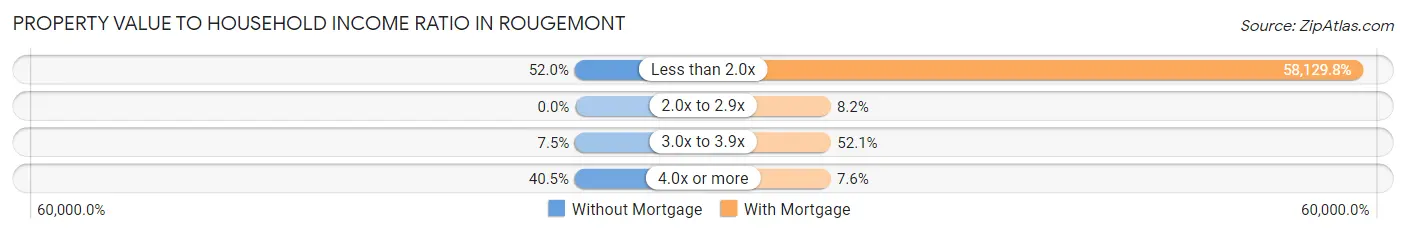
| Value-to-Income Ratio | Without Mortgage | With Mortgage |
| Less than 2.0x | 104 (52.0%) | 99,402 (58,129.8%) |
| 2.0x to 2.9x | 0 (0.0%) | 14 (8.2%) |
| 3.0x to 3.9x | 15 (7.5%) | 89 (52.0%) |
| 4.0x or more | 81 (40.5%) | 13 (7.6%) |
| Total | 200 (100.0%) | 171 (100.0%) |
Real Estate Taxes by Mortgage Status in Rougemont
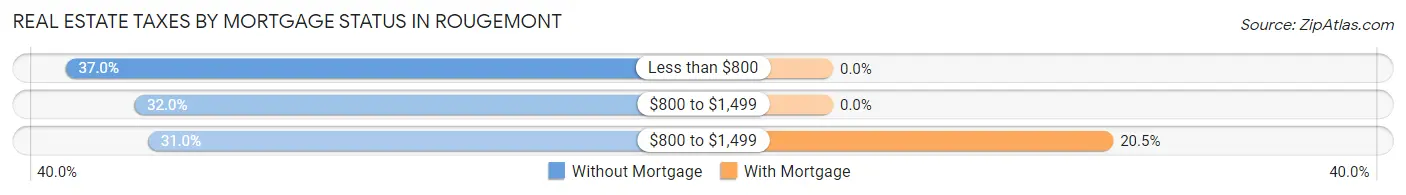
| Property Taxes | Without Mortgage | With Mortgage |
| Less than $800 | 74 (37.0%) | 0 (0.0%) |
| $800 to $1,499 | 64 (32.0%) | 0 (0.0%) |
| $800 to $1,499 | 62 (31.0%) | 35 (20.5%) |
| Total | 200 (100.0%) | 171 (100.0%) |
Health & Disability in Rougemont
Health Insurance Coverage by Age in Rougemont
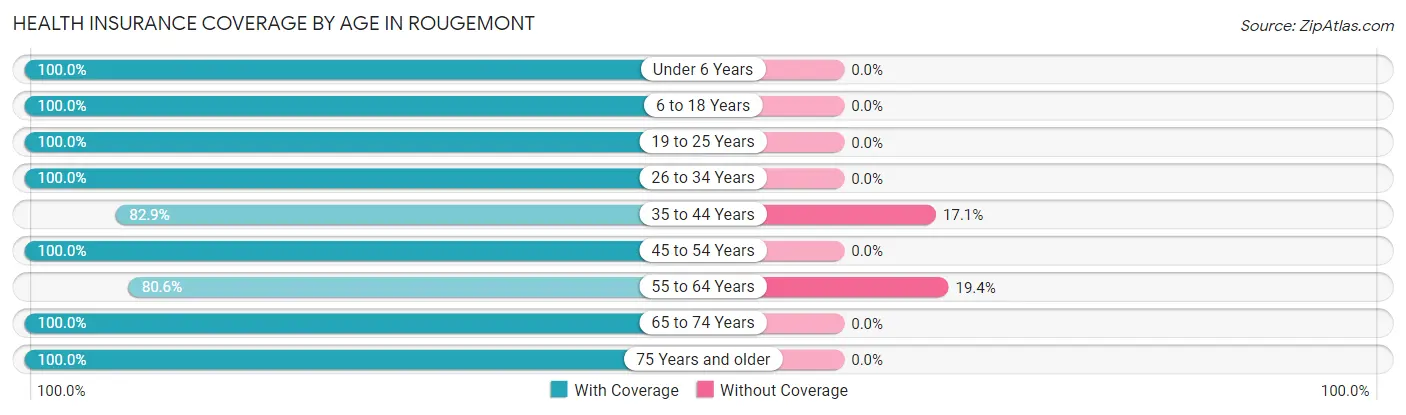
| Age Bracket | With Coverage | Without Coverage |
| Under 6 Years | 134 (100.0%) | 0 (0.0%) |
| 6 to 18 Years | 266 (100.0%) | 0 (0.0%) |
| 19 to 25 Years | 16 (100.0%) | 0 (0.0%) |
| 26 to 34 Years | 39 (100.0%) | 0 (0.0%) |
| 35 to 44 Years | 92 (82.9%) | 19 (17.1%) |
| 45 to 54 Years | 190 (100.0%) | 0 (0.0%) |
| 55 to 64 Years | 87 (80.6%) | 21 (19.4%) |
| 65 to 74 Years | 159 (100.0%) | 0 (0.0%) |
| 75 Years and older | 102 (100.0%) | 0 (0.0%) |
| Total | 1,085 (96.4%) | 40 (3.6%) |
Health Insurance Coverage by Citizenship Status in Rougemont
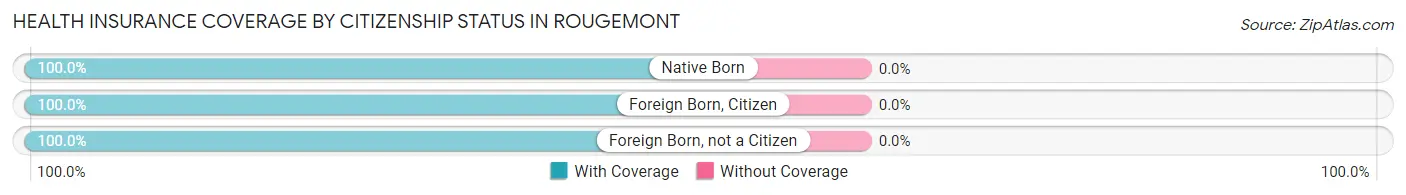
| Citizenship Status | With Coverage | Without Coverage |
| Native Born | 134 (100.0%) | 0 (0.0%) |
| Foreign Born, Citizen | 266 (100.0%) | 0 (0.0%) |
| Foreign Born, not a Citizen | 16 (100.0%) | 0 (0.0%) |
Health Insurance Coverage by Household Income in Rougemont
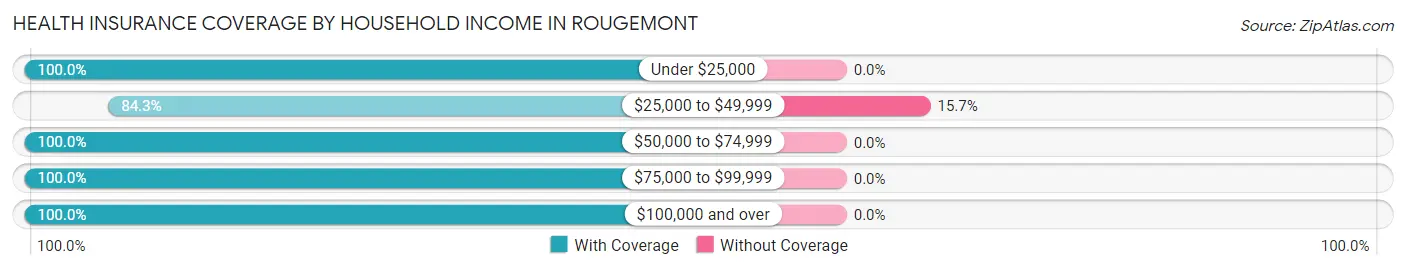
| Household Income | With Coverage | Without Coverage |
| Under $25,000 | 92 (100.0%) | 0 (0.0%) |
| $25,000 to $49,999 | 215 (84.3%) | 40 (15.7%) |
| $50,000 to $74,999 | 14 (100.0%) | 0 (0.0%) |
| $75,000 to $99,999 | 118 (100.0%) | 0 (0.0%) |
| $100,000 and over | 646 (100.0%) | 0 (0.0%) |
Public vs Private Health Insurance Coverage by Age in Rougemont
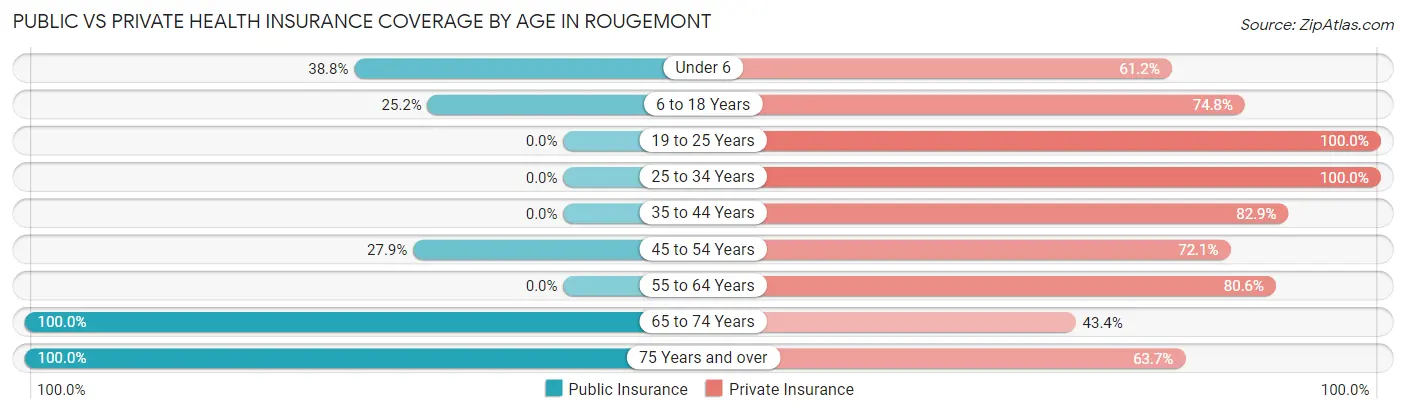
| Age Bracket | Public Insurance | Private Insurance |
| Under 6 | 52 (38.8%) | 82 (61.2%) |
| 6 to 18 Years | 67 (25.2%) | 199 (74.8%) |
| 19 to 25 Years | 0 (0.0%) | 16 (100.0%) |
| 25 to 34 Years | 0 (0.0%) | 39 (100.0%) |
| 35 to 44 Years | 0 (0.0%) | 92 (82.9%) |
| 45 to 54 Years | 53 (27.9%) | 137 (72.1%) |
| 55 to 64 Years | 0 (0.0%) | 87 (80.6%) |
| 65 to 74 Years | 159 (100.0%) | 69 (43.4%) |
| 75 Years and over | 102 (100.0%) | 65 (63.7%) |
| Total | 433 (38.5%) | 786 (69.9%) |
Disability Status by Sex by Age in Rougemont
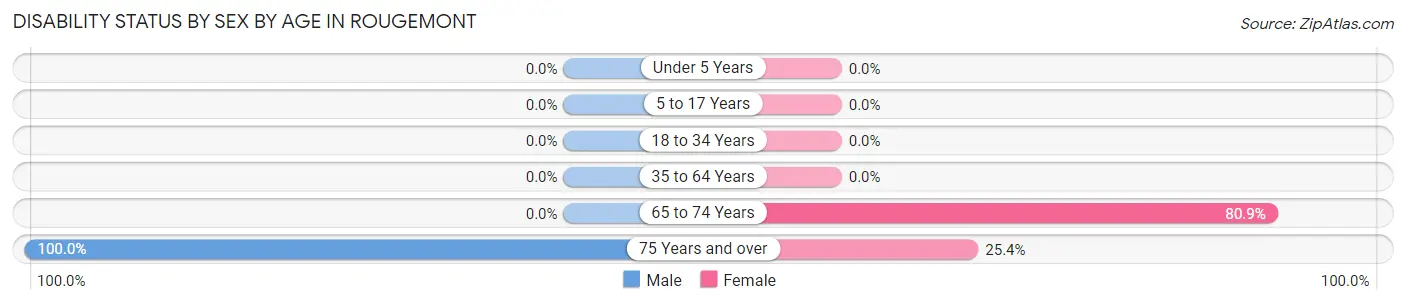
| Age Bracket | Male | Female |
| Under 5 Years | 0 (0.0%) | 0 (0.0%) |
| 5 to 17 Years | 0 (0.0%) | 0 (0.0%) |
| 18 to 34 Years | 0 (0.0%) | 0 (0.0%) |
| 35 to 64 Years | 0 (0.0%) | 0 (0.0%) |
| 65 to 74 Years | 0 (0.0%) | 55 (80.9%) |
| 75 Years and over | 31 (100.0%) | 18 (25.4%) |
Disability Class by Sex by Age in Rougemont
Disability Class: Hearing Difficulty
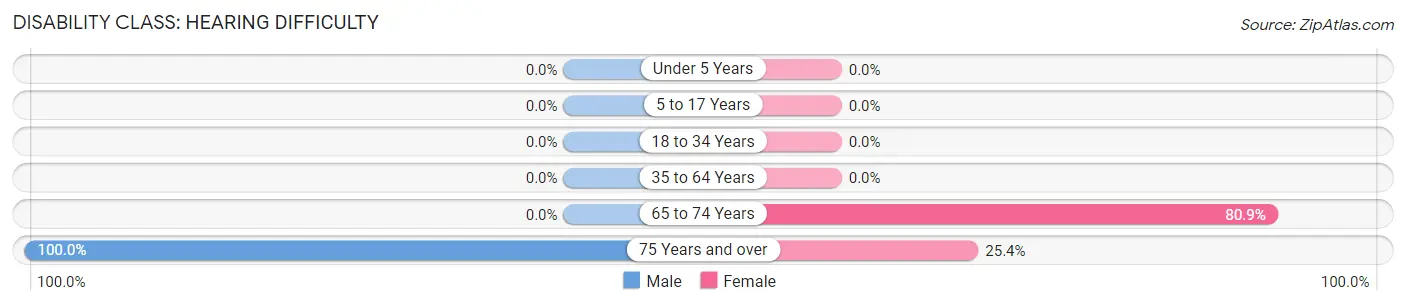
| Age Bracket | Male | Female |
| Under 5 Years | 0 (0.0%) | 0 (0.0%) |
| 5 to 17 Years | 0 (0.0%) | 0 (0.0%) |
| 18 to 34 Years | 0 (0.0%) | 0 (0.0%) |
| 35 to 64 Years | 0 (0.0%) | 0 (0.0%) |
| 65 to 74 Years | 0 (0.0%) | 55 (80.9%) |
| 75 Years and over | 31 (100.0%) | 18 (25.4%) |
Disability Class: Vision Difficulty
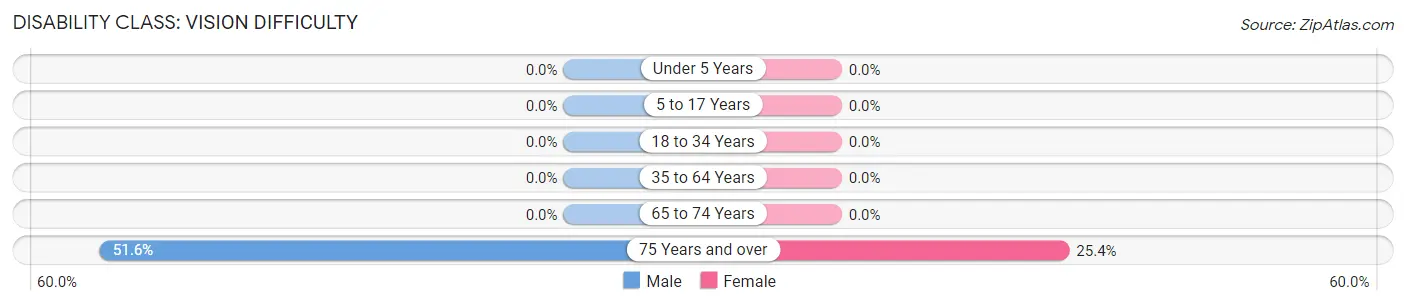
| Age Bracket | Male | Female |
| Under 5 Years | 0 (0.0%) | 0 (0.0%) |
| 5 to 17 Years | 0 (0.0%) | 0 (0.0%) |
| 18 to 34 Years | 0 (0.0%) | 0 (0.0%) |
| 35 to 64 Years | 0 (0.0%) | 0 (0.0%) |
| 65 to 74 Years | 0 (0.0%) | 0 (0.0%) |
| 75 Years and over | 16 (51.6%) | 18 (25.4%) |
Disability Class: Cognitive Difficulty
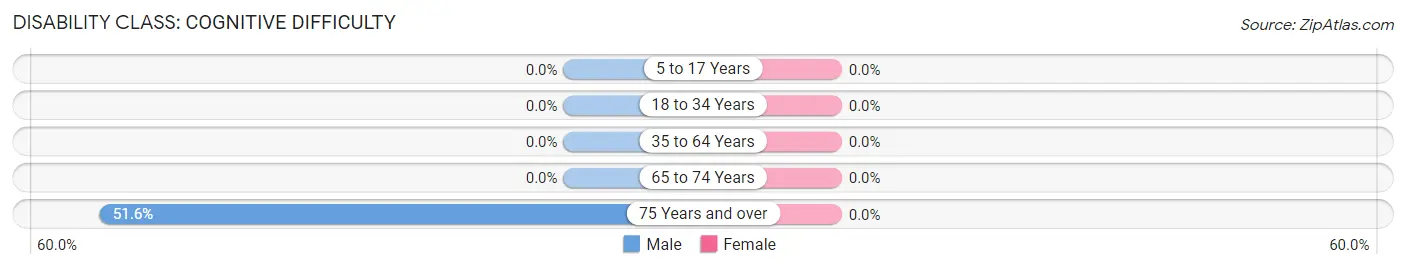
| Age Bracket | Male | Female |
| 5 to 17 Years | 0 (0.0%) | 0 (0.0%) |
| 18 to 34 Years | 0 (0.0%) | 0 (0.0%) |
| 35 to 64 Years | 0 (0.0%) | 0 (0.0%) |
| 65 to 74 Years | 0 (0.0%) | 0 (0.0%) |
| 75 Years and over | 16 (51.6%) | 0 (0.0%) |
Disability Class: Ambulatory Difficulty
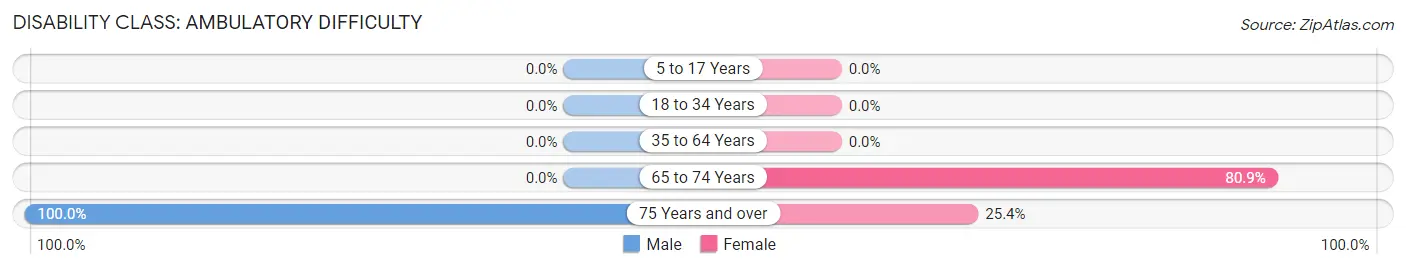
| Age Bracket | Male | Female |
| 5 to 17 Years | 0 (0.0%) | 0 (0.0%) |
| 18 to 34 Years | 0 (0.0%) | 0 (0.0%) |
| 35 to 64 Years | 0 (0.0%) | 0 (0.0%) |
| 65 to 74 Years | 0 (0.0%) | 55 (80.9%) |
| 75 Years and over | 31 (100.0%) | 18 (25.4%) |
Disability Class: Self-Care Difficulty
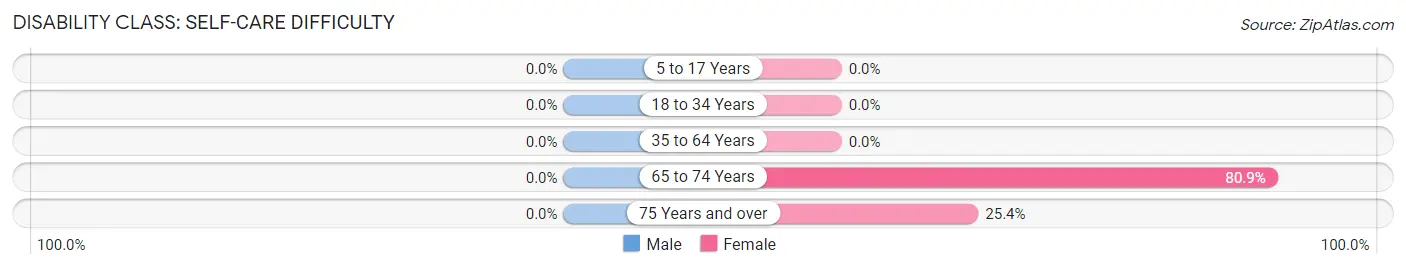
| Age Bracket | Male | Female |
| 5 to 17 Years | 0 (0.0%) | 0 (0.0%) |
| 18 to 34 Years | 0 (0.0%) | 0 (0.0%) |
| 35 to 64 Years | 0 (0.0%) | 0 (0.0%) |
| 65 to 74 Years | 0 (0.0%) | 55 (80.9%) |
| 75 Years and over | 0 (0.0%) | 18 (25.4%) |
Technology Access in Rougemont
Computing Device Access in Rougemont
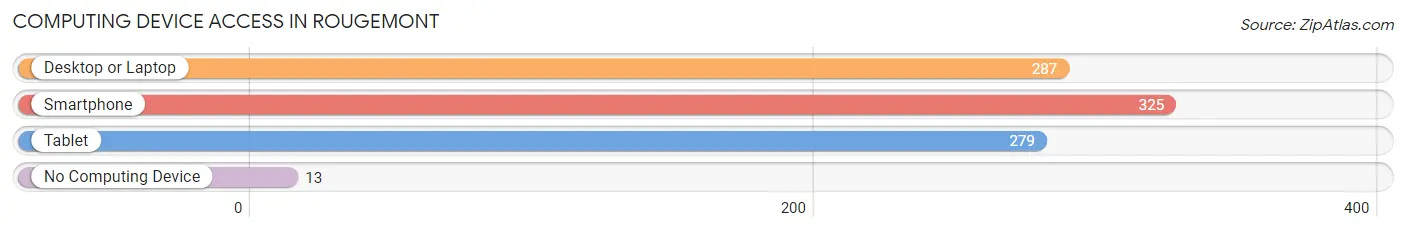
| Device Type | # Households | % Households |
| Desktop or Laptop | 287 | 77.4% |
| Smartphone | 325 | 87.6% |
| Tablet | 279 | 75.2% |
| No Computing Device | 13 | 3.5% |
| Total | 371 | 100.0% |
Internet Access in Rougemont
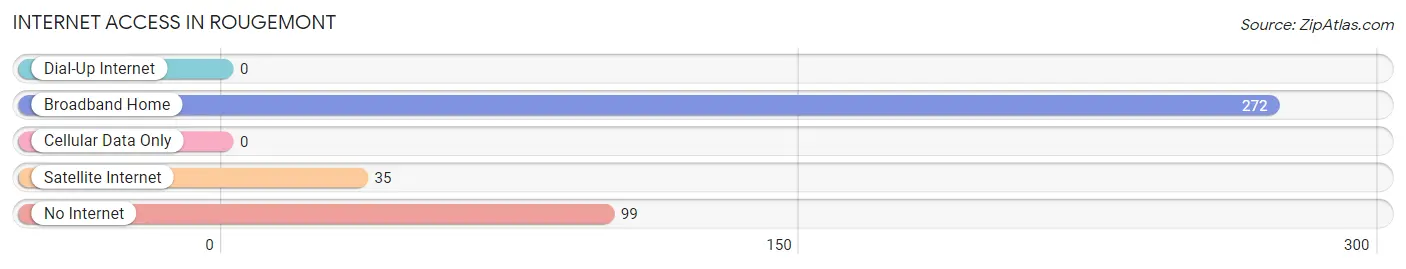
| Internet Type | # Households | % Households |
| Dial-Up Internet | 0 | 0.0% |
| Broadband Home | 272 | 73.3% |
| Cellular Data Only | 0 | 0.0% |
| Satellite Internet | 35 | 9.4% |
| No Internet | 99 | 26.7% |
| Total | 371 | 100.0% |
Rougemont Summary
Rougemont is a small unincorporated community located in Durham County, North Carolina. It is situated in the northern part of the county, approximately 20 miles north of Durham. The population of Rougemont was estimated to be 1,845 in 2019.
History
Rougemont was first settled in the late 1700s by a group of French Huguenots who had fled religious persecution in their homeland. The town was named after the French town of Rougemont, which was the birthplace of one of the settlers. The town was officially incorporated in 1887.
In the early 1900s, Rougemont was a thriving agricultural community. The town was home to several cotton mills, a grist mill, and a sawmill. The town also had a post office, a general store, and a school.
In the 1950s, Rougemont began to experience a decline in population as many of its residents moved away in search of better economic opportunities. The town's population has remained relatively stable since then, with a slight increase in recent years.
Geography
Rougemont is located in northern Durham County, approximately 20 miles north of Durham. The town is situated in the Piedmont region of North Carolina, which is characterized by rolling hills and fertile soil. The town is located near the Eno River, which provides a source of recreation for the town's residents.
The climate in Rougemont is humid subtropical, with hot, humid summers and mild winters. The average annual temperature is around 60 degrees Fahrenheit.
Economy
Rougemont's economy is largely based on agriculture. The town is home to several farms, which produce a variety of crops, including corn, soybeans, and tobacco. The town also has a few small businesses, including a general store and a gas station.
Demographics
Rougemont's population was estimated to be 1,845 in 2019. The town is predominantly white, with a small African American population. The median household income in Rougemont is $45,000, and the median home value is $150,000. The town has a low unemployment rate of 3.2%.
Conclusion
Rougemont is a small unincorporated community located in Durham County, North Carolina. It was first settled in the late 1700s by a group of French Huguenots and was officially incorporated in 1887. The town's economy is largely based on agriculture, and its population was estimated to be 1,845 in 2019. Rougemont has a humid subtropical climate, with hot, humid summers and mild winters. The town has a low unemployment rate of 3.2%, and the median household income is $45,000.
Common Questions
What is Per Capita Income in Rougemont?
Per Capita income in Rougemont is $26,019.
What is the Median Family Income in Rougemont?
Median Family Income in Rougemont is $115,679.
What is Inequality or Gini Index in Rougemont?
Inequality or Gini Index in Rougemont is 0.43.
What is the Total Population of Rougemont?
Total Population of Rougemont is 1,125.
What is the Total Male Population of Rougemont?
Total Male Population of Rougemont is 412.
What is the Total Female Population of Rougemont?
Total Female Population of Rougemont is 713.
What is the Ratio of Males per 100 Females in Rougemont?
There are 57.78 Males per 100 Females in Rougemont.
What is the Ratio of Females per 100 Males in Rougemont?
There are 173.06 Females per 100 Males in Rougemont.
What is the Median Population Age in Rougemont?
Median Population Age in Rougemont is 43.9 Years.
What is the Average Family Size in Rougemont
Average Family Size in Rougemont is 4.6 People.
What is the Average Household Size in Rougemont
Average Household Size in Rougemont is 3.0 People.
How Large is the Labor Force in Rougemont?
There are 433 People in the Labor Forcein in Rougemont.
What is the Percentage of People in the Labor Force in Rougemont?
56.7% of People are in the Labor Force in Rougemont.
What is the Unemployment Rate in Rougemont?
Unemployment Rate in Rougemont is 4.4%.