Ramseur, NC Map & Demographics
Ramseur Map
Ramseur Overview
$15,965
PER CAPITA INCOME
$32,800
AVG FAMILY INCOME
$32,964
AVG HOUSEHOLD INCOME
29.6%
WAGE / INCOME GAP [ % ]
70.4¢/ $1
WAGE / INCOME GAP [ $ ]
$19,415
FAMILY INCOME DEFICIT
0.45
INEQUALITY / GINI INDEX
1,877
TOTAL POPULATION
782
MALE POPULATION
1,095
FEMALE POPULATION
71.42
MALES / 100 FEMALES
140.03
FEMALES / 100 MALES
30.5
MEDIAN AGE
3.4
AVG FAMILY SIZE
2.8
AVG HOUSEHOLD SIZE
754
LABOR FORCE [ PEOPLE ]
58.8%
PERCENT IN LABOR FORCE
2.7%
UNEMPLOYMENT RATE
Ramseur Zip Codes
Ramseur Area Codes
Income in Ramseur
Income Overview in Ramseur
Per Capita Income in Ramseur is $15,965, while median incomes of families and households are $32,800 and $32,964 respectively.
| Characteristic | Number | Measure |
| Per Capita Income | 1,877 | $15,965 |
| Median Family Income | 442 | $32,800 |
| Mean Family Income | 442 | $44,676 |
| Median Household Income | 633 | $32,964 |
| Mean Household Income | 633 | $43,783 |
| Income Deficit | 442 | $19,415 |
| Wage / Income Gap (%) | 1,877 | 29.59% |
| Wage / Income Gap ($) | 1,877 | 70.41¢ per $1 |
| Gini / Inequality Index | 1,877 | 0.45 |
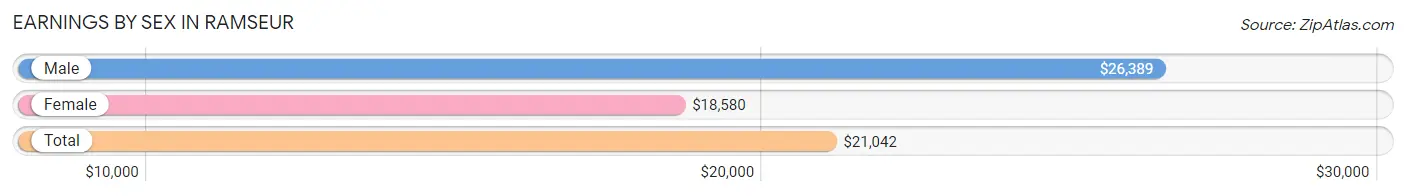
Earnings by Sex in Ramseur
Average Earnings in Ramseur are $21,042, $26,389 for men and $18,580 for women, a difference of 29.6%.
| Sex | Number | Average Earnings |
| Male | 332 (42.0%) | $26,389 |
| Female | 459 (58.0%) | $18,580 |
| Total | 791 (100.0%) | $21,042 |
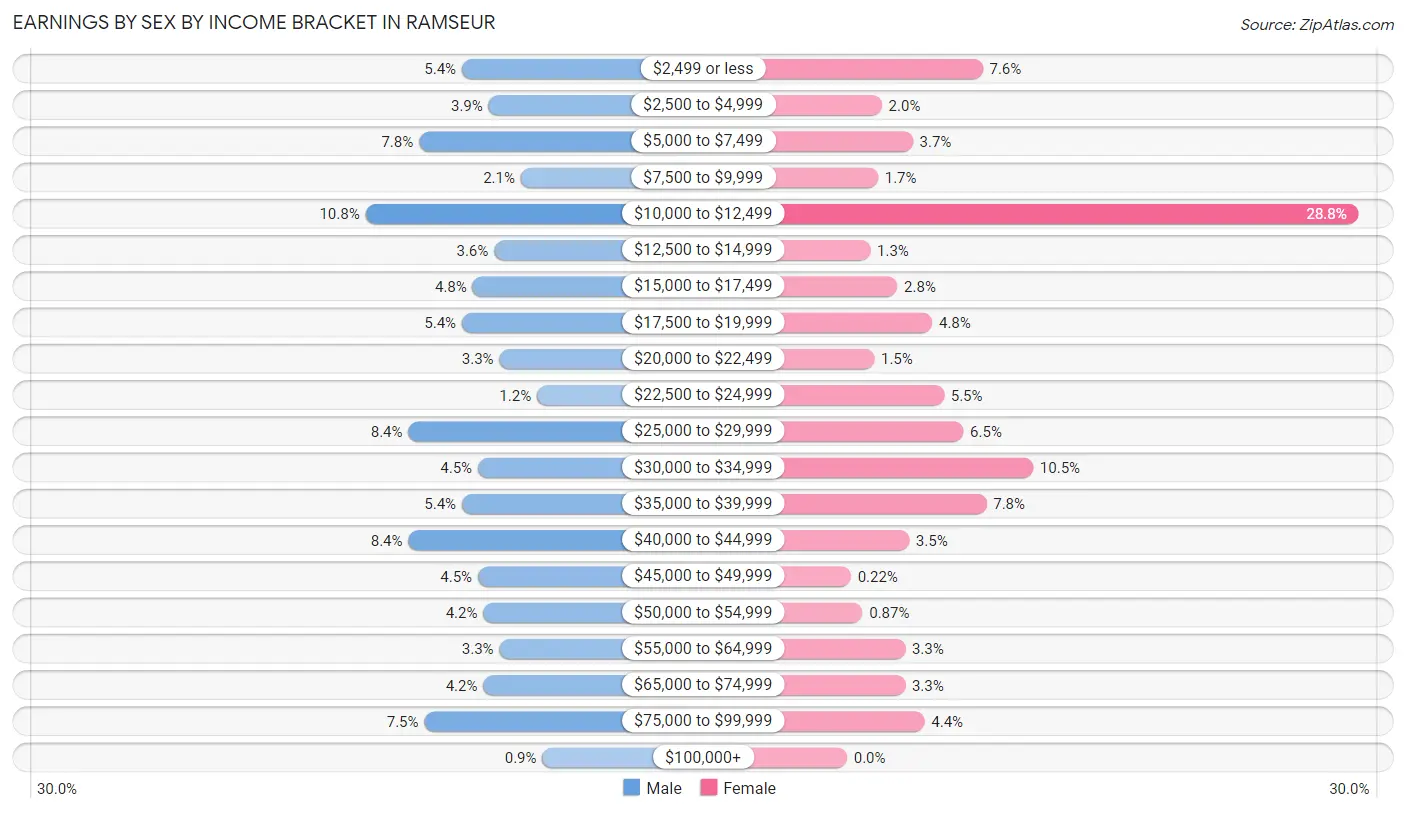
Earnings by Sex by Income Bracket in Ramseur
The most common earnings brackets in Ramseur are $10,000 to $12,499 for men (36 | 10.8%) and $10,000 to $12,499 for women (132 | 28.8%).
| Income | Male | Female |
| $2,499 or less | 18 (5.4%) | 35 (7.6%) |
| $2,500 to $4,999 | 13 (3.9%) | 9 (2.0%) |
| $5,000 to $7,499 | 26 (7.8%) | 17 (3.7%) |
| $7,500 to $9,999 | 7 (2.1%) | 8 (1.7%) |
| $10,000 to $12,499 | 36 (10.8%) | 132 (28.8%) |
| $12,500 to $14,999 | 12 (3.6%) | 6 (1.3%) |
| $15,000 to $17,499 | 16 (4.8%) | 13 (2.8%) |
| $17,500 to $19,999 | 18 (5.4%) | 22 (4.8%) |
| $20,000 to $22,499 | 11 (3.3%) | 7 (1.5%) |
| $22,500 to $24,999 | 4 (1.2%) | 25 (5.4%) |
| $25,000 to $29,999 | 28 (8.4%) | 30 (6.5%) |
| $30,000 to $34,999 | 15 (4.5%) | 48 (10.5%) |
| $35,000 to $39,999 | 18 (5.4%) | 36 (7.8%) |
| $40,000 to $44,999 | 28 (8.4%) | 16 (3.5%) |
| $45,000 to $49,999 | 15 (4.5%) | 1 (0.2%) |
| $50,000 to $54,999 | 14 (4.2%) | 4 (0.9%) |
| $55,000 to $64,999 | 11 (3.3%) | 15 (3.3%) |
| $65,000 to $74,999 | 14 (4.2%) | 15 (3.3%) |
| $75,000 to $99,999 | 25 (7.5%) | 20 (4.4%) |
| $100,000+ | 3 (0.9%) | 0 (0.0%) |
| Total | 332 (100.0%) | 459 (100.0%) |
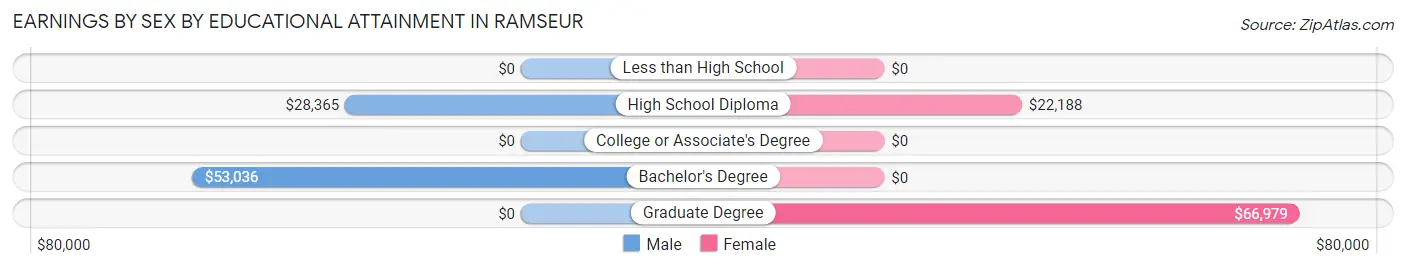
Earnings by Sex by Educational Attainment in Ramseur
Average earnings in Ramseur are $31,607 for men and $18,864 for women, a difference of 40.3%. Men with an educational attainment of bachelor's degree enjoy the highest average annual earnings of $53,036, while those with high school diploma education earn the least with $28,365. Women with an educational attainment of graduate degree earn the most with the average annual earnings of $66,979, while those with high school diploma education have the smallest earnings of $22,188.
| Educational Attainment | Male Income | Female Income |
| Less than High School | - | - |
| High School Diploma | $28,365 | $22,188 |
| College or Associate's Degree | - | - |
| Bachelor's Degree | $53,036 | $0 |
| Graduate Degree | - | - |
| Total | $31,607 | $18,864 |
Family Income in Ramseur
Family Income Brackets in Ramseur
According to the Ramseur family income data, there are 129 families falling into the $10,000 to $14,999 income range, which is the most common income bracket and makes up 29.2% of all families. Conversely, the $200,000+ income bracket is the least frequent group with only 3 families (0.7%) belonging to this category.
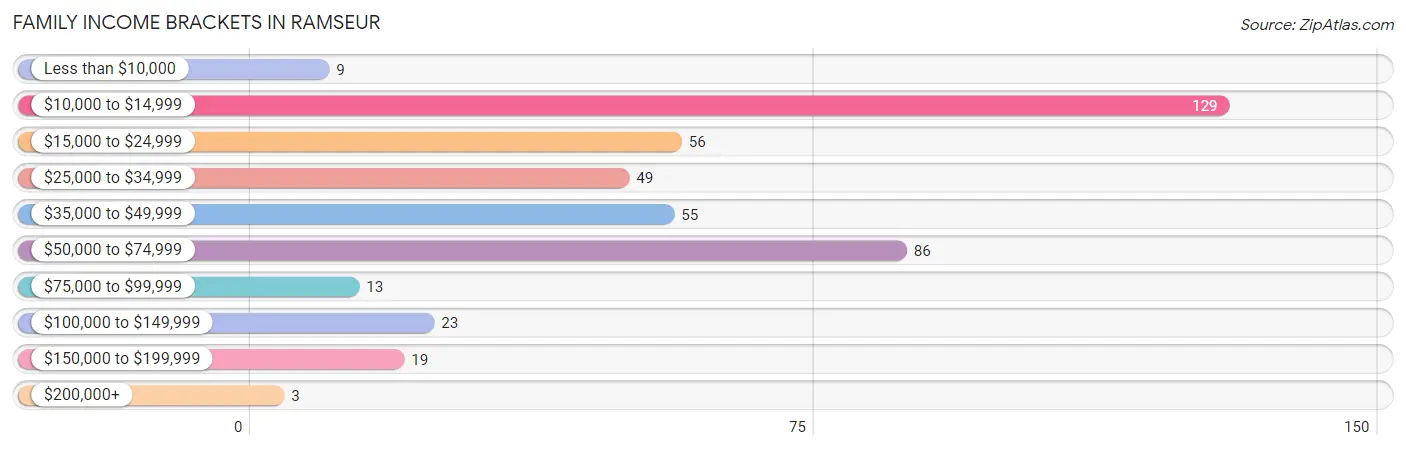
| Income Bracket | # Families | % Families |
| Less than $10,000 | 9 | 2.0% |
| $10,000 to $14,999 | 129 | 29.2% |
| $15,000 to $24,999 | 56 | 12.7% |
| $25,000 to $34,999 | 49 | 11.1% |
| $35,000 to $49,999 | 55 | 12.4% |
| $50,000 to $74,999 | 86 | 19.5% |
| $75,000 to $99,999 | 13 | 2.9% |
| $100,000 to $149,999 | 23 | 5.2% |
| $150,000 to $199,999 | 19 | 4.3% |
| $200,000+ | 3 | 0.7% |
Family Income by Famaliy Size in Ramseur
3-person families (84 | 19.0%) account for the highest median family income in Ramseur with $61,786 per family, while 3-person families (84 | 19.0%) have the highest median income of $20,595 per family member.
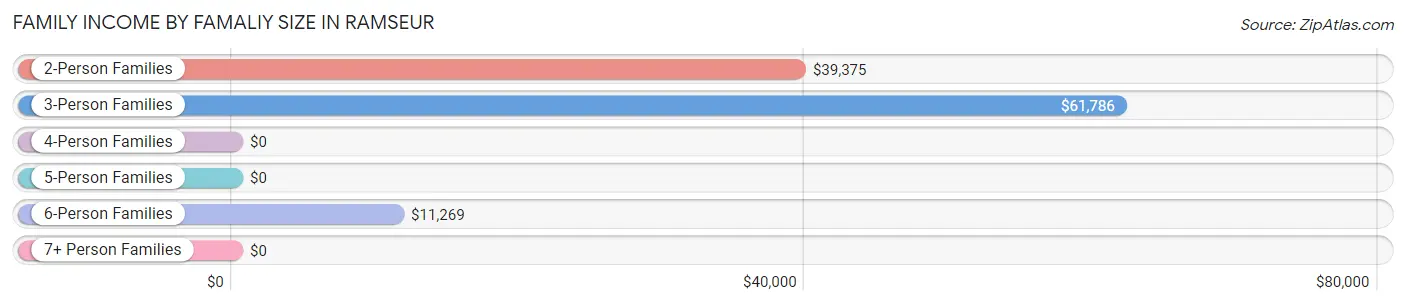
| Income Bracket | # Families | Median Income |
| 2-Person Families | 149 (33.7%) | $39,375 |
| 3-Person Families | 84 (19.0%) | $61,786 |
| 4-Person Families | 13 (2.9%) | $0 |
| 5-Person Families | 46 (10.4%) | $0 |
| 6-Person Families | 141 (31.9%) | $11,269 |
| 7+ Person Families | 9 (2.0%) | $0 |
| Total | 442 (100.0%) | $32,800 |
Family Income by Number of Earners in Ramseur
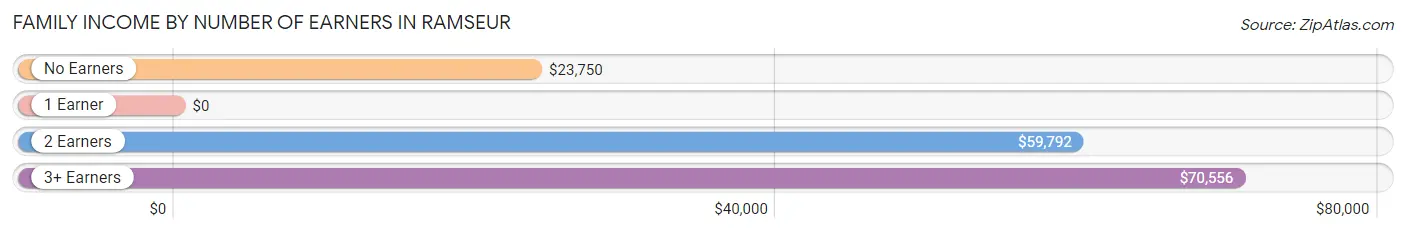
| Number of Earners | # Families | Median Income |
| No Earners | 55 (12.4%) | $23,750 |
| 1 Earner | 216 (48.9%) | $0 |
| 2 Earners | 145 (32.8%) | $59,792 |
| 3+ Earners | 26 (5.9%) | $70,556 |
| Total | 442 (100.0%) | $32,800 |
Household Income in Ramseur
Household Income Brackets in Ramseur
With 163 households falling in the category, the $10,000 to $14,999 income range is the most frequent in Ramseur, accounting for 25.8% of all households. In contrast, only 3 households (0.5%) fall into the $200,000+ income bracket, making it the least populous group.
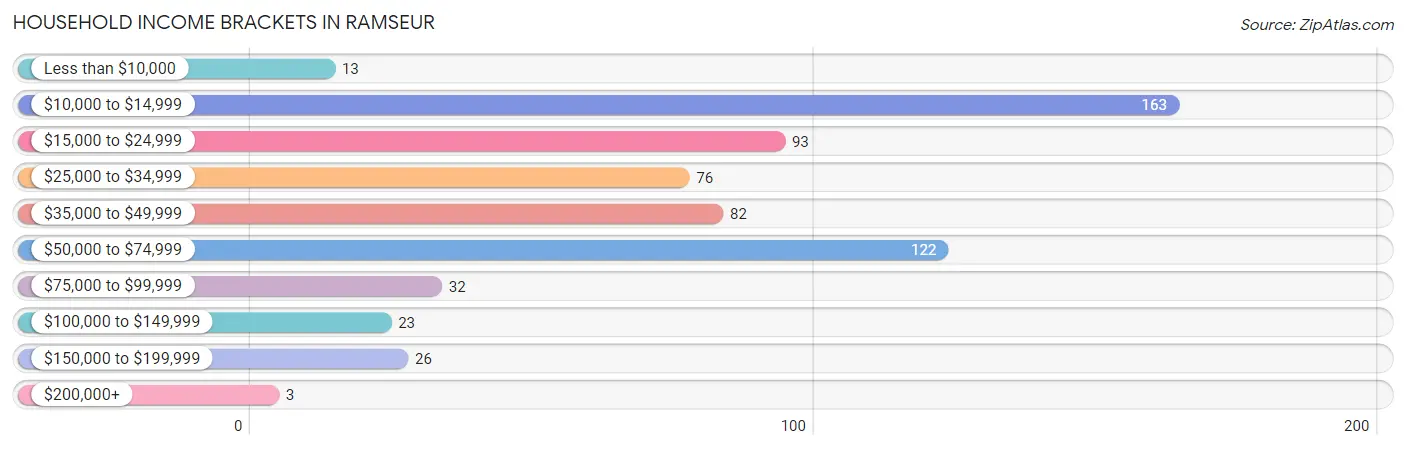
| Income Bracket | # Households | % Households |
| Less than $10,000 | 13 | 2.1% |
| $10,000 to $14,999 | 163 | 25.8% |
| $15,000 to $24,999 | 93 | 14.7% |
| $25,000 to $34,999 | 76 | 12.0% |
| $35,000 to $49,999 | 82 | 13.0% |
| $50,000 to $74,999 | 122 | 19.3% |
| $75,000 to $99,999 | 32 | 5.1% |
| $100,000 to $149,999 | 23 | 3.6% |
| $150,000 to $199,999 | 26 | 4.1% |
| $200,000+ | 3 | 0.5% |
Household Income by Householder Age in Ramseur
The median household income in Ramseur is $32,964, with the highest median household income of $51,250 found in the 45 to 64 years age bracket for the primary householder. A total of 174 households (27.5%) fall into this category. Meanwhile, the 15 to 24 years age bracket for the primary householder has the lowest median household income of $0, with 19 households (3.0%) in this group.
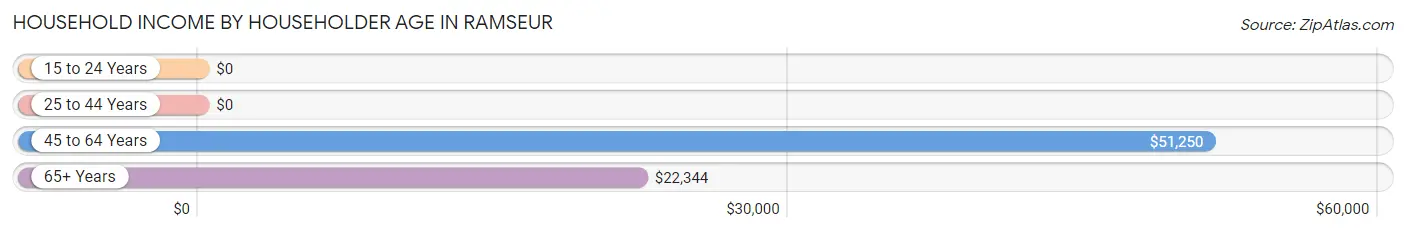
| Income Bracket | # Households | Median Income |
| 15 to 24 Years | 19 (3.0%) | $0 |
| 25 to 44 Years | 298 (47.1%) | $0 |
| 45 to 64 Years | 174 (27.5%) | $51,250 |
| 65+ Years | 142 (22.4%) | $22,344 |
| Total | 633 (100.0%) | $32,964 |
Poverty in Ramseur
Income Below Poverty by Sex and Age in Ramseur
With 39.6% poverty level for males and 49.5% for females among the residents of Ramseur, 5 year old males and 5 year old females are the most vulnerable to poverty, with 5 males (100.0%) and 17 females (100.0%) in their respective age groups living below the poverty level.
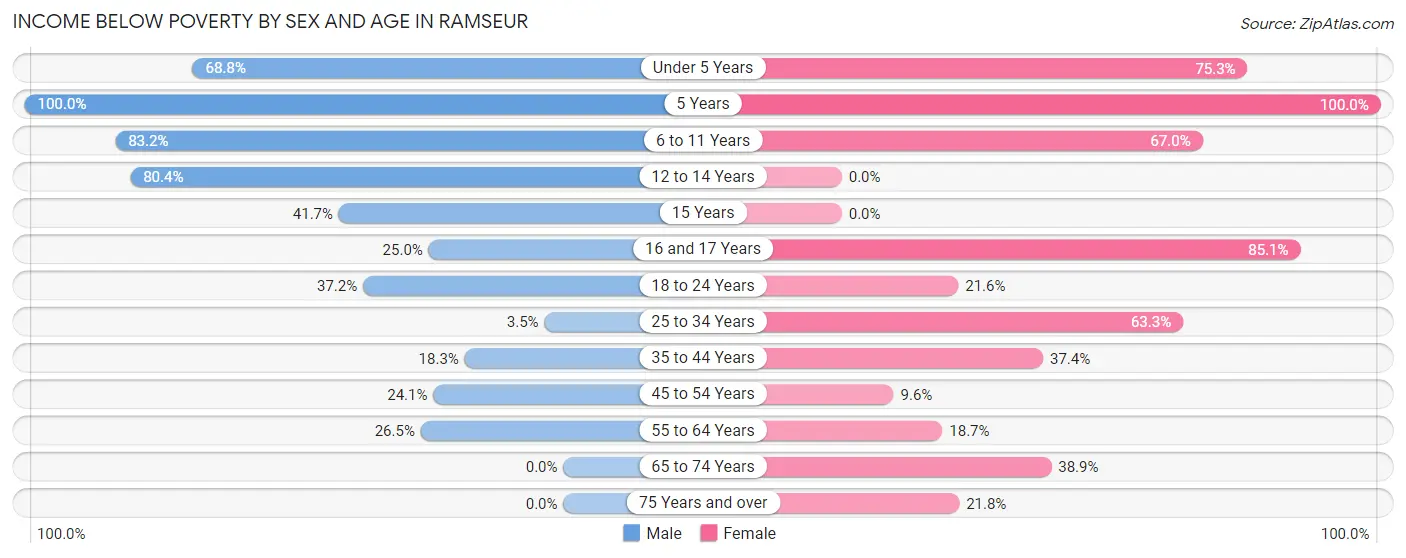
| Age Bracket | Male | Female |
| Under 5 Years | 64 (68.8%) | 131 (75.3%) |
| 5 Years | 5 (100.0%) | 17 (100.0%) |
| 6 to 11 Years | 89 (83.2%) | 75 (67.0%) |
| 12 to 14 Years | 41 (80.4%) | 0 (0.0%) |
| 15 Years | 5 (41.7%) | 0 (0.0%) |
| 16 and 17 Years | 7 (25.0%) | 40 (85.1%) |
| 18 to 24 Years | 29 (37.2%) | 8 (21.6%) |
| 25 to 34 Years | 2 (3.5%) | 145 (63.3%) |
| 35 to 44 Years | 24 (18.3%) | 31 (37.3%) |
| 45 to 54 Years | 14 (24.1%) | 10 (9.6%) |
| 55 to 64 Years | 18 (26.5%) | 14 (18.7%) |
| 65 to 74 Years | 0 (0.0%) | 21 (38.9%) |
| 75 Years and over | 0 (0.0%) | 17 (21.8%) |
| Total | 298 (39.6%) | 509 (49.5%) |
Income Above Poverty by Sex and Age in Ramseur
According to the poverty statistics in Ramseur, males aged 65 to 74 years and females aged 12 to 14 years are the age groups that are most secure financially, with 100.0% of males and 100.0% of females in these age groups living above the poverty line.
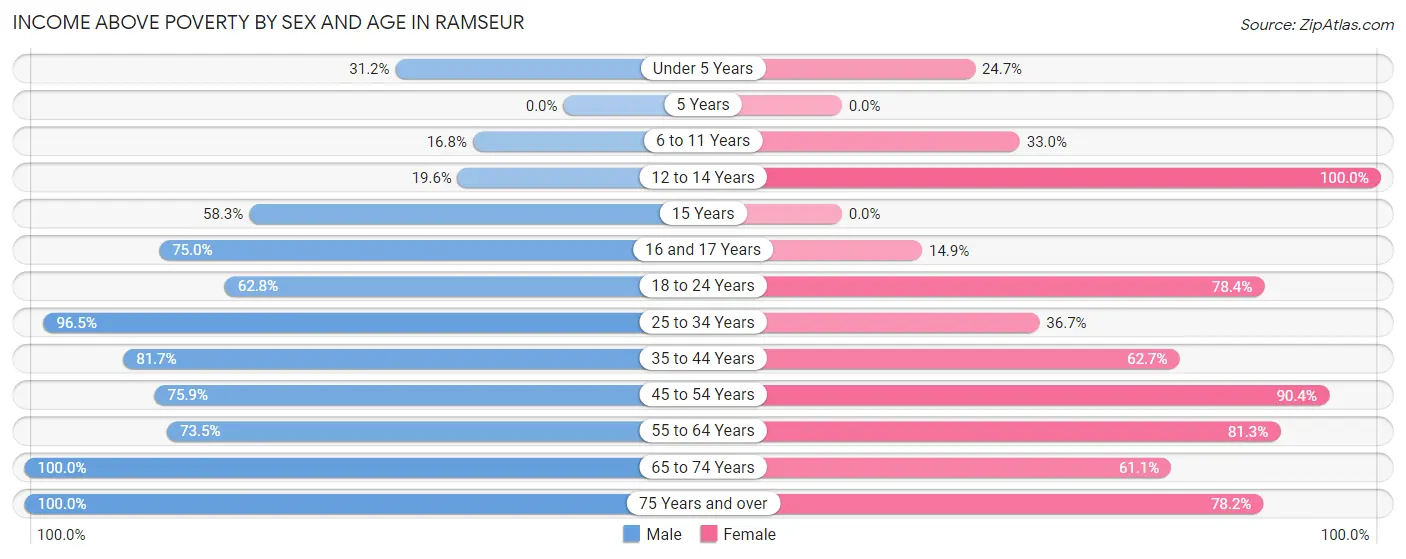
| Age Bracket | Male | Female |
| Under 5 Years | 29 (31.2%) | 43 (24.7%) |
| 5 Years | 0 (0.0%) | 0 (0.0%) |
| 6 to 11 Years | 18 (16.8%) | 37 (33.0%) |
| 12 to 14 Years | 10 (19.6%) | 19 (100.0%) |
| 15 Years | 7 (58.3%) | 0 (0.0%) |
| 16 and 17 Years | 21 (75.0%) | 7 (14.9%) |
| 18 to 24 Years | 49 (62.8%) | 29 (78.4%) |
| 25 to 34 Years | 55 (96.5%) | 84 (36.7%) |
| 35 to 44 Years | 107 (81.7%) | 52 (62.6%) |
| 45 to 54 Years | 44 (75.9%) | 94 (90.4%) |
| 55 to 64 Years | 50 (73.5%) | 61 (81.3%) |
| 65 to 74 Years | 28 (100.0%) | 33 (61.1%) |
| 75 Years and over | 37 (100.0%) | 61 (78.2%) |
| Total | 455 (60.4%) | 520 (50.5%) |
Income Below Poverty Among Married-Couple Families in Ramseur
The poverty statistics for married-couple families in Ramseur show that 19.4% or 46 of the total 237 families live below the poverty line. Families with 5 or more children have the highest poverty rate of 100.0%, comprising of 4 families. On the other hand, families with no children have the lowest poverty rate of 7.1%, which includes 9 families.
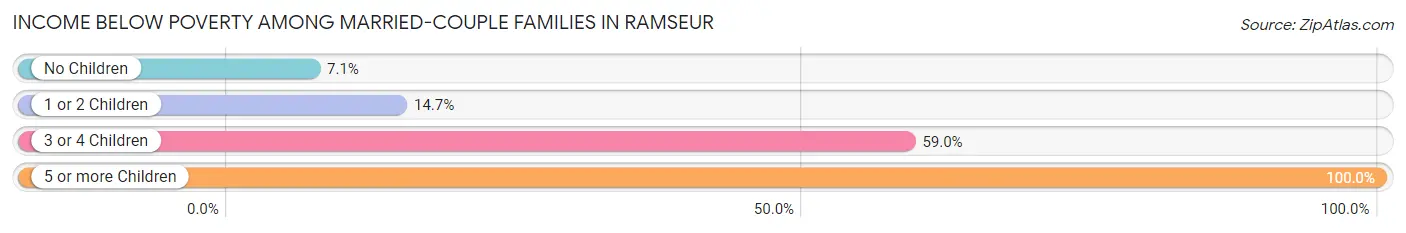
| Children | Above Poverty | Below Poverty |
| No Children | 117 (92.9%) | 9 (7.1%) |
| 1 or 2 Children | 58 (85.3%) | 10 (14.7%) |
| 3 or 4 Children | 16 (41.0%) | 23 (59.0%) |
| 5 or more Children | 0 (0.0%) | 4 (100.0%) |
| Total | 191 (80.6%) | 46 (19.4%) |
Income Below Poverty Among Single-Parent Households in Ramseur
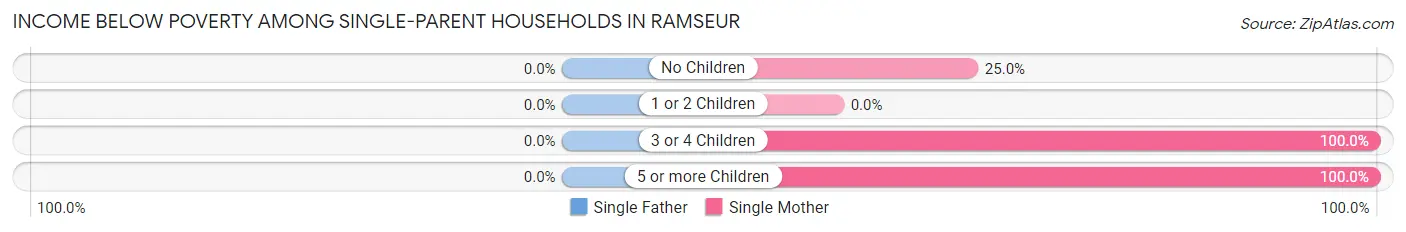
| Children | Single Father | Single Mother |
| No Children | 0 (0.0%) | 4 (25.0%) |
| 1 or 2 Children | 0 (0.0%) | 0 (0.0%) |
| 3 or 4 Children | 0 (0.0%) | 7 (100.0%) |
| 5 or more Children | 0 (0.0%) | 129 (100.0%) |
| Total | 0 (0.0%) | 140 (76.9%) |
Income Below Poverty Among Married-Couple vs Single-Parent Households in Ramseur
The poverty data for Ramseur shows that 46 of the married-couple family households (19.4%) and 140 of the single-parent households (68.3%) are living below the poverty level. Within the married-couple family households, those with 5 or more children have the highest poverty rate, with 4 households (100.0%) falling below the poverty line. Among the single-parent households, those with 3 or 4 children have the highest poverty rate, with 7 household (100.0%) living below poverty.
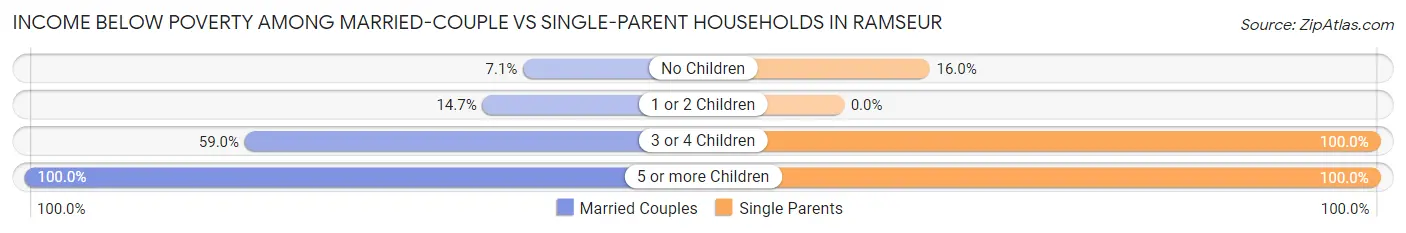
| Children | Married-Couple Families | Single-Parent Households |
| No Children | 9 (7.1%) | 4 (16.0%) |
| 1 or 2 Children | 10 (14.7%) | 0 (0.0%) |
| 3 or 4 Children | 23 (59.0%) | 7 (100.0%) |
| 5 or more Children | 4 (100.0%) | 129 (100.0%) |
| Total | 46 (19.4%) | 140 (68.3%) |
Race in Ramseur
The most populous races in Ramseur are White / Caucasian (1,196 | 63.7%), Hispanic or Latino (468 | 24.9%), and Two or more Races (400 | 21.3%).
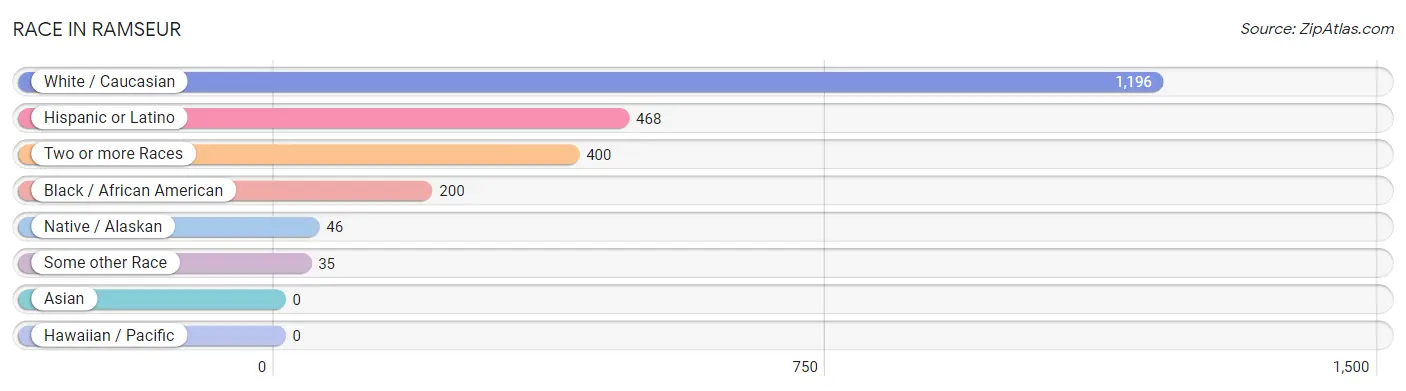
| Race | # Population | % Population |
| Asian | 0 | 0.0% |
| Black / African American | 200 | 10.7% |
| Hawaiian / Pacific | 0 | 0.0% |
| Hispanic or Latino | 468 | 24.9% |
| Native / Alaskan | 46 | 2.5% |
| White / Caucasian | 1,196 | 63.7% |
| Two or more Races | 400 | 21.3% |
| Some other Race | 35 | 1.9% |
| Total | 1,877 | 100.0% |
Ancestry in Ramseur
The most populous ancestries reported in Ramseur are Irish (523 | 27.9%), Mexican (439 | 23.4%), German (368 | 19.6%), American (109 | 5.8%), and English (108 | 5.8%), together accounting for 82.4% of all Ramseur residents.
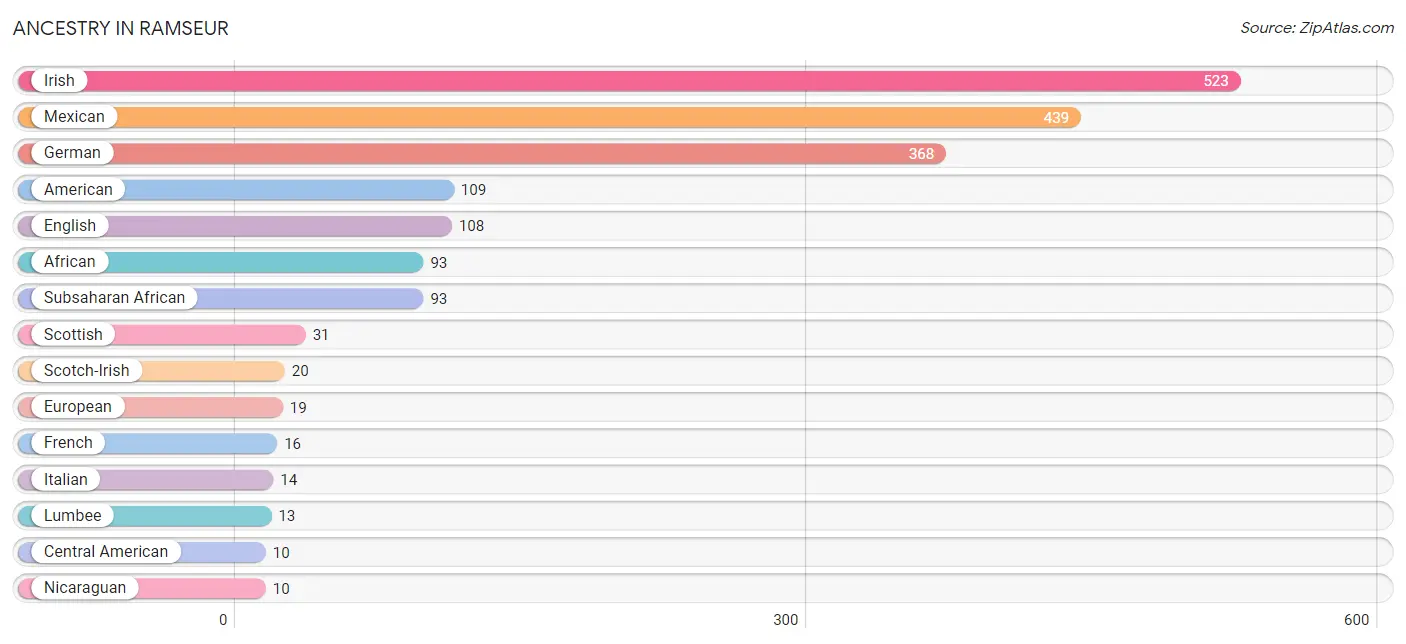
| Ancestry | # Population | % Population |
| African | 93 | 5.0% |
| American | 109 | 5.8% |
| Burmese | 7 | 0.4% |
| Central American | 10 | 0.5% |
| Chilean | 7 | 0.4% |
| Dutch | 5 | 0.3% |
| Eastern European | 9 | 0.5% |
| English | 108 | 5.8% |
| European | 19 | 1.0% |
| French | 16 | 0.9% |
| German | 368 | 19.6% |
| Greek | 2 | 0.1% |
| Irish | 523 | 27.9% |
| Italian | 14 | 0.7% |
| Jamaican | 3 | 0.2% |
| Lumbee | 13 | 0.7% |
| Mexican | 439 | 23.4% |
| Nicaraguan | 10 | 0.5% |
| Northern European | 9 | 0.5% |
| Norwegian | 2 | 0.1% |
| Polish | 3 | 0.2% |
| Puerto Rican | 9 | 0.5% |
| Scotch-Irish | 20 | 1.1% |
| Scottish | 31 | 1.7% |
| Slovene | 2 | 0.1% |
| South American | 7 | 0.4% |
| Spaniard | 3 | 0.2% |
| Subsaharan African | 93 | 5.0% |
| Swiss | 4 | 0.2% | View All 29 Rows |
Immigrants in Ramseur
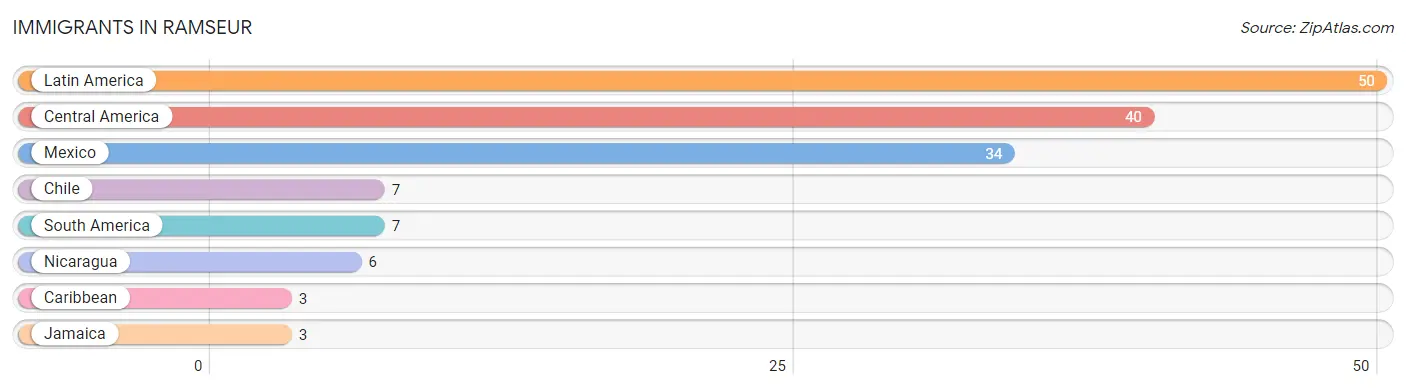
The most numerous immigrant groups reported in Ramseur came from Latin America (50 | 2.7%), Central America (40 | 2.1%), Mexico (34 | 1.8%), Chile (7 | 0.4%), and South America (7 | 0.4%), together accounting for 7.3% of all Ramseur residents.
| Immigration Origin | # Population | % Population |
| Caribbean | 3 | 0.2% |
| Central America | 40 | 2.1% |
| Chile | 7 | 0.4% |
| Jamaica | 3 | 0.2% |
| Latin America | 50 | 2.7% |
| Mexico | 34 | 1.8% |
| Nicaragua | 6 | 0.3% |
| South America | 7 | 0.4% | View All 8 Rows |
Sex and Age in Ramseur
Sex and Age in Ramseur
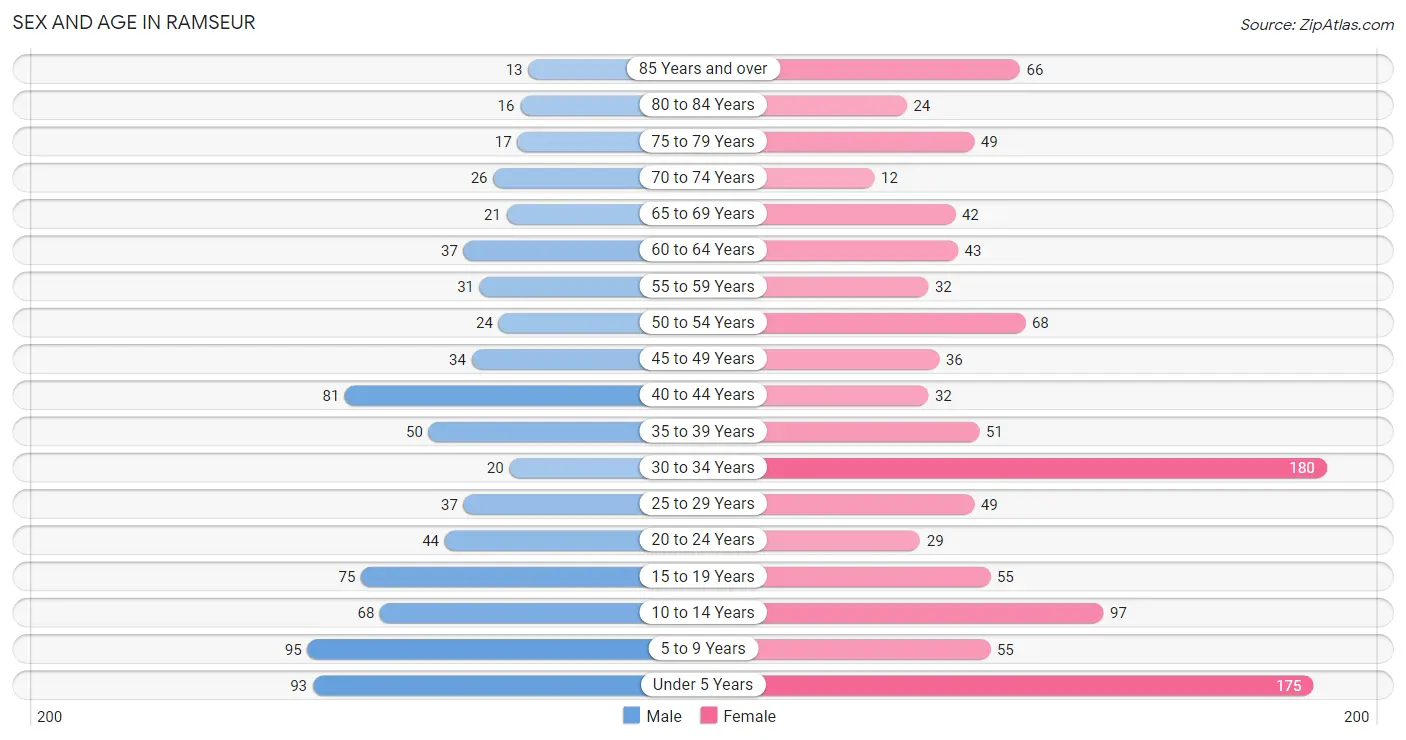
The most populous age groups in Ramseur are 5 to 9 Years (95 | 12.1%) for men and 30 to 34 Years (180 | 16.4%) for women.
| Age Bracket | Male | Female |
| Under 5 Years | 93 (11.9%) | 175 (16.0%) |
| 5 to 9 Years | 95 (12.1%) | 55 (5.0%) |
| 10 to 14 Years | 68 (8.7%) | 97 (8.9%) |
| 15 to 19 Years | 75 (9.6%) | 55 (5.0%) |
| 20 to 24 Years | 44 (5.6%) | 29 (2.6%) |
| 25 to 29 Years | 37 (4.7%) | 49 (4.5%) |
| 30 to 34 Years | 20 (2.6%) | 180 (16.4%) |
| 35 to 39 Years | 50 (6.4%) | 51 (4.7%) |
| 40 to 44 Years | 81 (10.4%) | 32 (2.9%) |
| 45 to 49 Years | 34 (4.3%) | 36 (3.3%) |
| 50 to 54 Years | 24 (3.1%) | 68 (6.2%) |
| 55 to 59 Years | 31 (4.0%) | 32 (2.9%) |
| 60 to 64 Years | 37 (4.7%) | 43 (3.9%) |
| 65 to 69 Years | 21 (2.7%) | 42 (3.8%) |
| 70 to 74 Years | 26 (3.3%) | 12 (1.1%) |
| 75 to 79 Years | 17 (2.2%) | 49 (4.5%) |
| 80 to 84 Years | 16 (2.1%) | 24 (2.2%) |
| 85 Years and over | 13 (1.7%) | 66 (6.0%) |
| Total | 782 (100.0%) | 1,095 (100.0%) |
Families and Households in Ramseur
Median Family Size in Ramseur
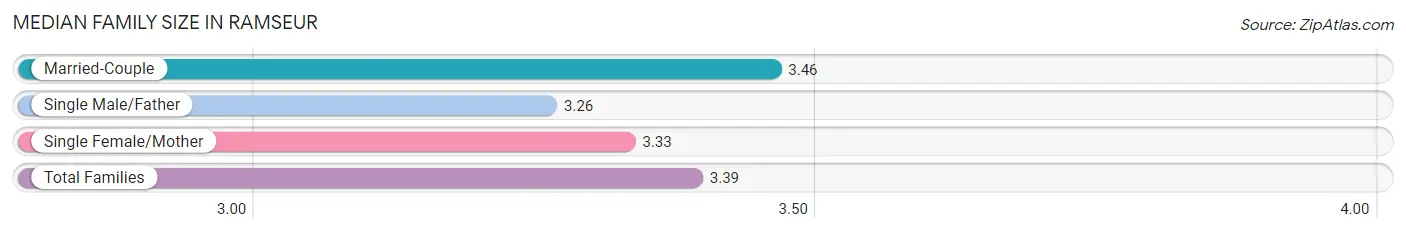
The median family size in Ramseur is 3.39 persons per family, with married-couple families (237 | 53.6%) accounting for the largest median family size of 3.46 persons per family. On the other hand, single male/father families (23 | 5.2%) represent the smallest median family size with 3.26 persons per family.
| Family Type | # Families | Family Size |
| Married-Couple | 237 (53.6%) | 3.46 |
| Single Male/Father | 23 (5.2%) | 3.26 |
| Single Female/Mother | 182 (41.2%) | 3.33 |
| Total Families | 442 (100.0%) | 3.39 |
Median Household Size in Ramseur
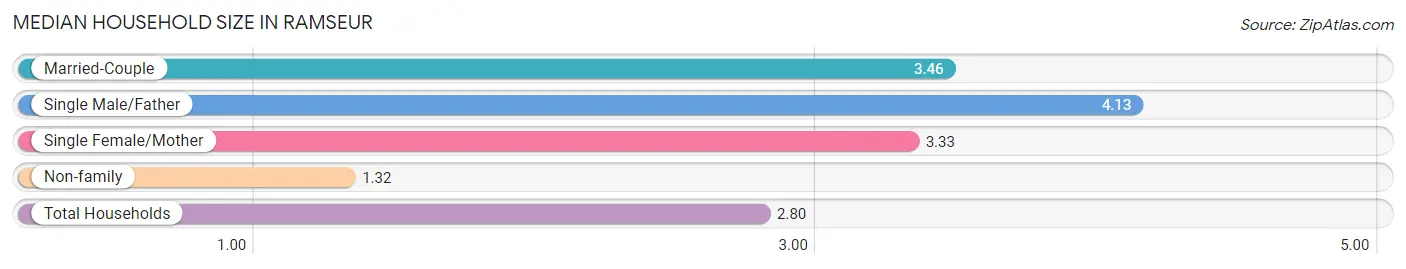
The median household size in Ramseur is 2.80 persons per household, with single male/father households (23 | 3.6%) accounting for the largest median household size of 4.13 persons per household. non-family households (191 | 30.2%) represent the smallest median household size with 1.32 persons per household.
| Household Type | # Households | Household Size |
| Married-Couple | 237 (37.4%) | 3.46 |
| Single Male/Father | 23 (3.6%) | 4.13 |
| Single Female/Mother | 182 (28.7%) | 3.33 |
| Non-family | 191 (30.2%) | 1.32 |
| Total Households | 633 (100.0%) | 2.80 |
Household Size by Marriage Status in Ramseur
Out of a total of 633 households in Ramseur, 442 (69.8%) are family households, while 191 (30.2%) are nonfamily households. The most numerous type of family households are 2-person households, comprising 142, and the most common type of nonfamily households are 1-person households, comprising 145.
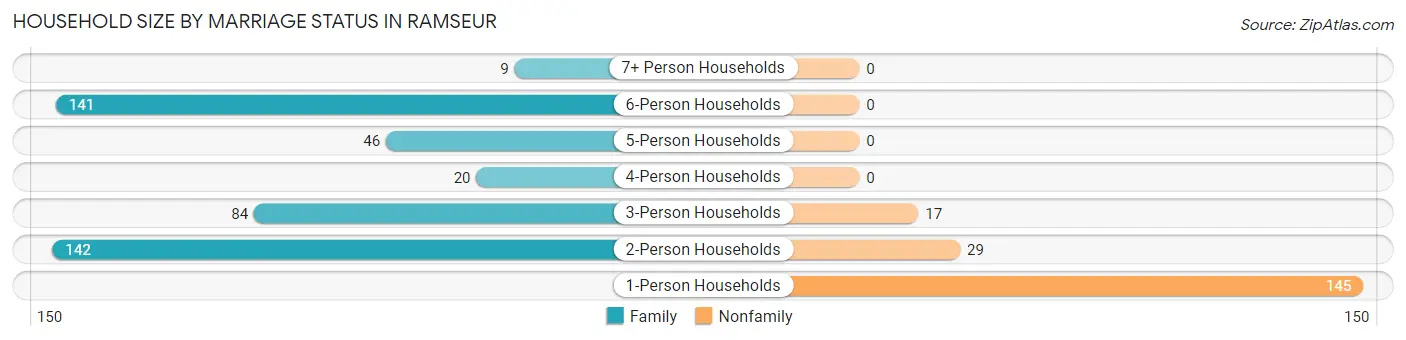
| Household Size | Family Households | Nonfamily Households |
| 1-Person Households | - | 145 (22.9%) |
| 2-Person Households | 142 (22.4%) | 29 (4.6%) |
| 3-Person Households | 84 (13.3%) | 17 (2.7%) |
| 4-Person Households | 20 (3.2%) | 0 (0.0%) |
| 5-Person Households | 46 (7.3%) | 0 (0.0%) |
| 6-Person Households | 141 (22.3%) | 0 (0.0%) |
| 7+ Person Households | 9 (1.4%) | 0 (0.0%) |
| Total | 442 (69.8%) | 191 (30.2%) |
Female Fertility in Ramseur
Fertility by Age in Ramseur
Average fertility rate in Ramseur is 324.0 births per 1,000 women. Women in the age bracket of 20 to 34 years have the highest fertility rate with 547.0 births per 1,000 women. Women in the age bracket of 20 to 34 years acount for 100.0% of all women with births.
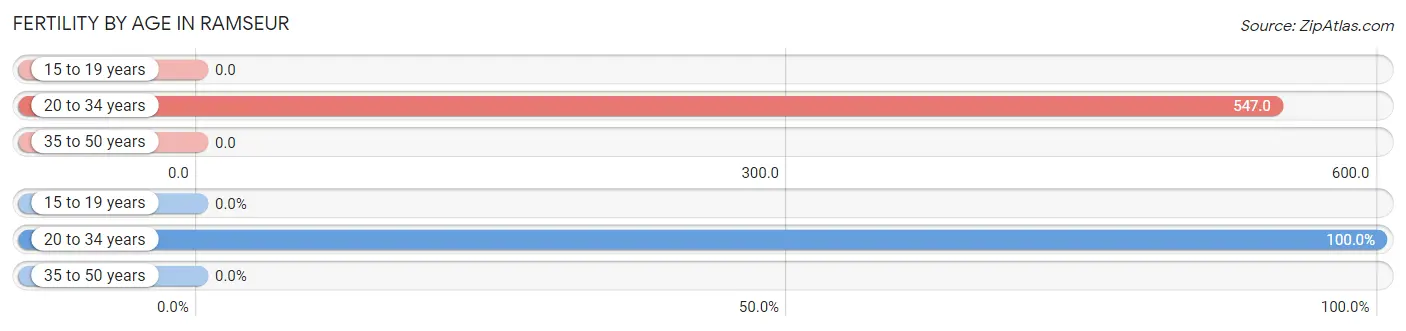
| Age Bracket | Women with Births | Births / 1,000 Women |
| 15 to 19 years | 0 (0.0%) | 0.0 |
| 20 to 34 years | 141 (100.0%) | 547.0 |
| 35 to 50 years | 0 (0.0%) | 0.0 |
| Total | 141 (100.0%) | 324.0 |
Fertility by Age by Marriage Status in Ramseur
5.0% of women with births (141) in Ramseur are married. The highest percentage of unmarried women with births falls into 20 to 34 years age bracket with 95.0% of them unmarried at the time of birth, while the lowest percentage of unmarried women with births belong to 20 to 34 years age bracket with 95.0% of them unmarried.
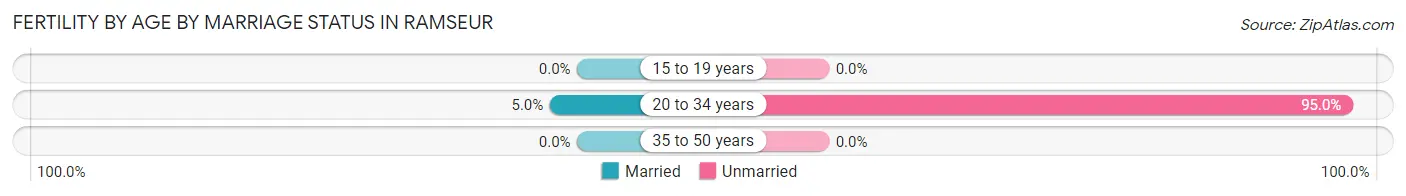
| Age Bracket | Married | Unmarried |
| 15 to 19 years | 0 (0.0%) | 0 (0.0%) |
| 20 to 34 years | 7 (5.0%) | 134 (95.0%) |
| 35 to 50 years | 0 (0.0%) | 0 (0.0%) |
| Total | 7 (5.0%) | 134 (95.0%) |
Fertility by Education in Ramseur
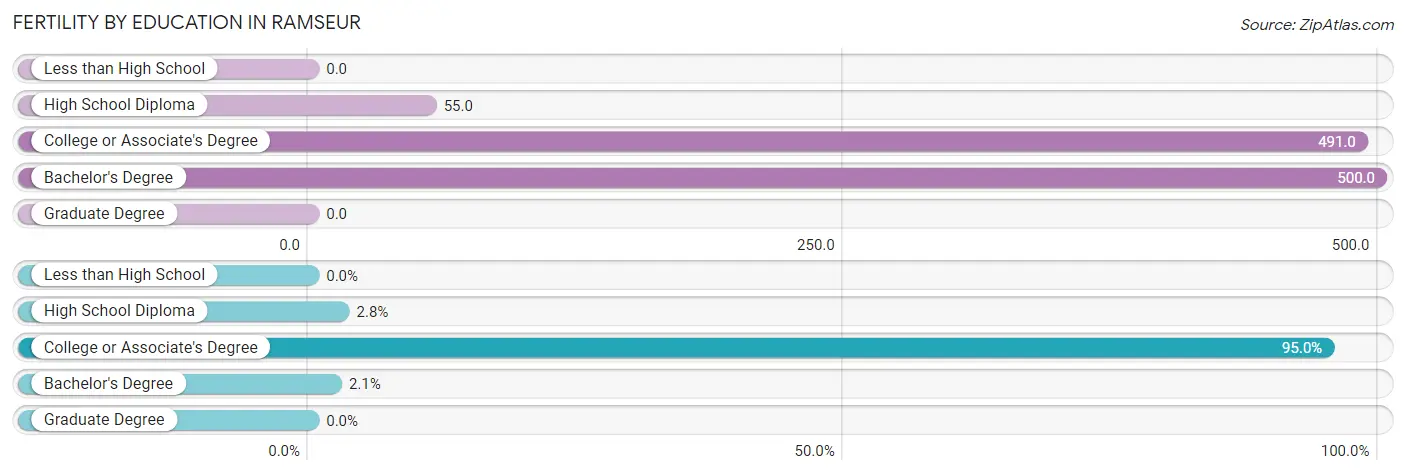
| Educational Attainment | Women with Births | Births / 1,000 Women |
| Less than High School | 0 (0.0%) | 0.0 |
| High School Diploma | 4 (2.8%) | 55.0 |
| College or Associate's Degree | 134 (95.0%) | 491.0 |
| Bachelor's Degree | 3 (2.1%) | 500.0 |
| Graduate Degree | 0 (0.0%) | 0.0 |
| Total | 141 (100.0%) | 324.0 |
Fertility by Education by Marriage Status in Ramseur
95.0% of women with births in Ramseur are unmarried. Women with the educational attainment of high school diploma are most likely to be married with 100.0% of them married at childbirth, while women with the educational attainment of college or associate's degree are least likely to be married with 100.0% of them unmarried at childbirth.
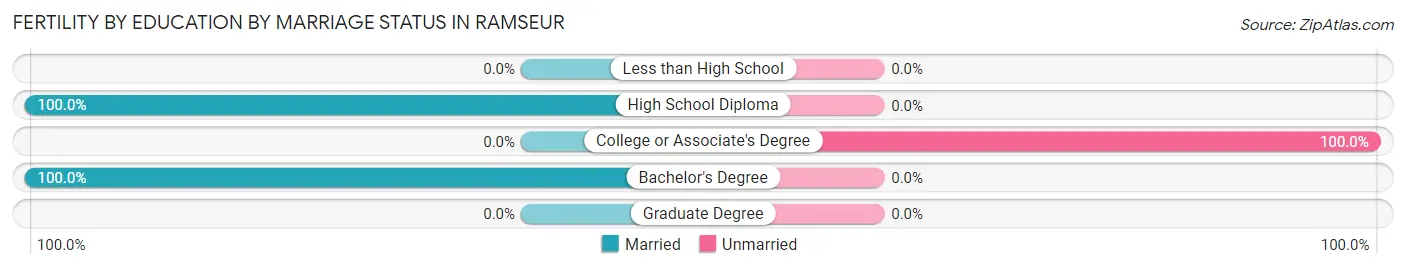
| Educational Attainment | Married | Unmarried |
| Less than High School | 0 (0.0%) | 0 (0.0%) |
| High School Diploma | 4 (100.0%) | 0 (0.0%) |
| College or Associate's Degree | 0 (0.0%) | 134 (100.0%) |
| Bachelor's Degree | 3 (100.0%) | 0 (0.0%) |
| Graduate Degree | 0 (0.0%) | 0 (0.0%) |
| Total | 7 (5.0%) | 134 (95.0%) |
Employment Characteristics in Ramseur
Employment by Class of Employer in Ramseur
Among the 603 employed individuals in Ramseur, private company employees (434 | 72.0%), state government employees (40 | 6.6%), and not-for-profit organizations (33 | 5.5%) make up the most common classes of employment.
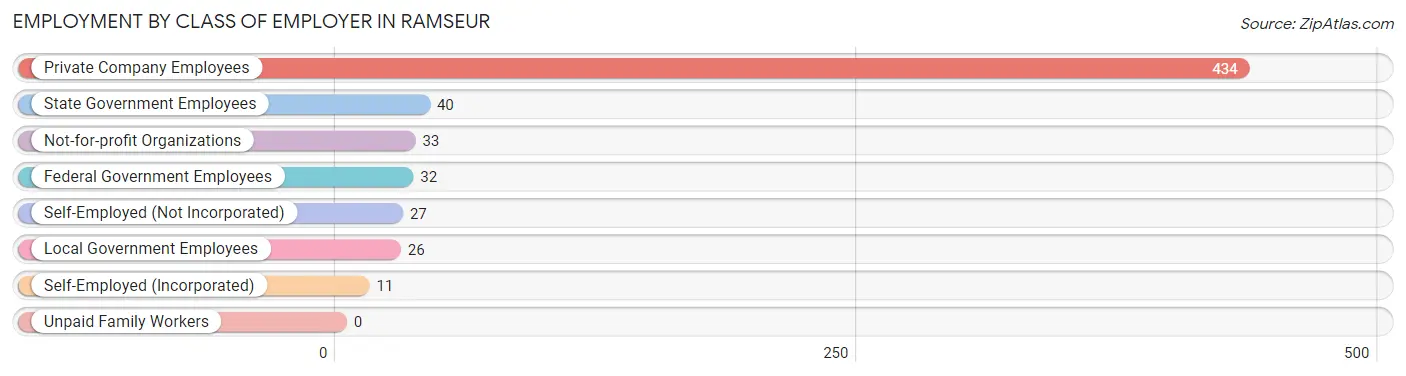
| Employer Class | # Employees | % Employees |
| Private Company Employees | 434 | 72.0% |
| Self-Employed (Incorporated) | 11 | 1.8% |
| Self-Employed (Not Incorporated) | 27 | 4.5% |
| Not-for-profit Organizations | 33 | 5.5% |
| Local Government Employees | 26 | 4.3% |
| State Government Employees | 40 | 6.6% |
| Federal Government Employees | 32 | 5.3% |
| Unpaid Family Workers | 0 | 0.0% |
| Total | 603 | 100.0% |
Employment Status by Age in Ramseur
According to the labor force statistics for Ramseur, out of the total population over 16 years of age (1,282), 58.8% or 754 individuals are in the labor force, with 2.7% or 20 of them unemployed. The age group with the highest labor force participation rate is 30 to 34 years, with 95.5% or 191 individuals in the labor force. Within the labor force, the 16 to 19 years age range has the highest percentage of unemployed individuals, with 14.3% or 8 of them being unemployed.
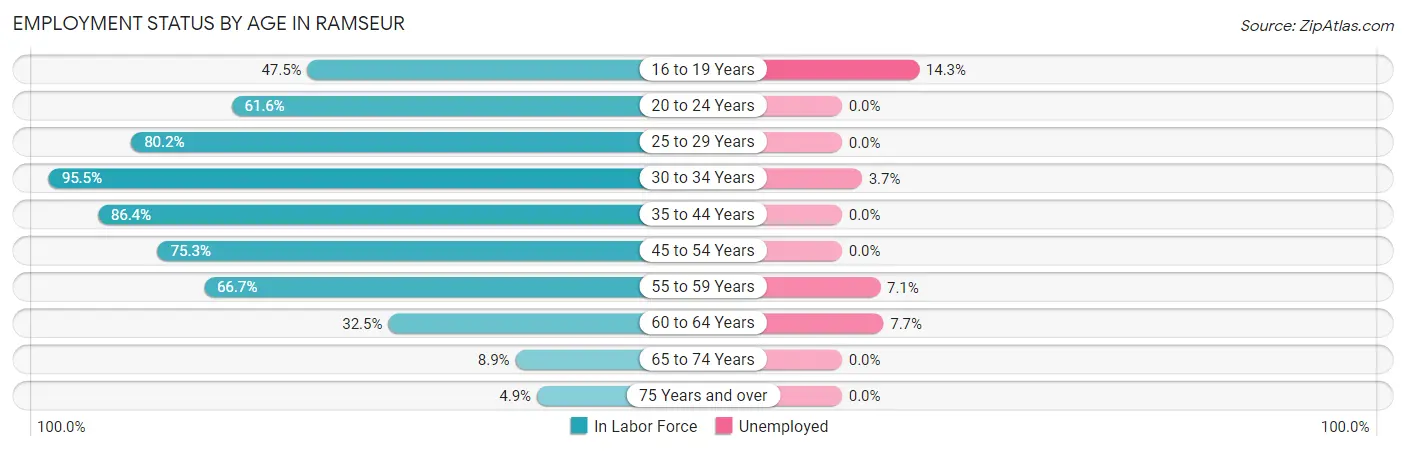
| Age Bracket | In Labor Force | Unemployed |
| 16 to 19 Years | 56 (47.5%) | 8 (14.3%) |
| 20 to 24 Years | 45 (61.6%) | 0 (0.0%) |
| 25 to 29 Years | 69 (80.2%) | 0 (0.0%) |
| 30 to 34 Years | 191 (95.5%) | 7 (3.7%) |
| 35 to 44 Years | 185 (86.4%) | 0 (0.0%) |
| 45 to 54 Years | 122 (75.3%) | 0 (0.0%) |
| 55 to 59 Years | 42 (66.7%) | 3 (7.1%) |
| 60 to 64 Years | 26 (32.5%) | 2 (7.7%) |
| 65 to 74 Years | 9 (8.9%) | 0 (0.0%) |
| 75 Years and over | 9 (4.9%) | 0 (0.0%) |
| Total | 754 (58.8%) | 20 (2.7%) |
Employment Status by Educational Attainment in Ramseur
According to labor force statistics for Ramseur, 78.9% of individuals (635) out of the total population between 25 and 64 years of age (805) are in the labor force, with 1.9% or 12 of them being unemployed. The group with the highest labor force participation rate are those with the educational attainment of college / associate degree, with 87.4% or 347 individuals in the labor force. Within the labor force, individuals with less than high school education have the highest percentage of unemployment, with 8.2% or 4 of them being unemployed.
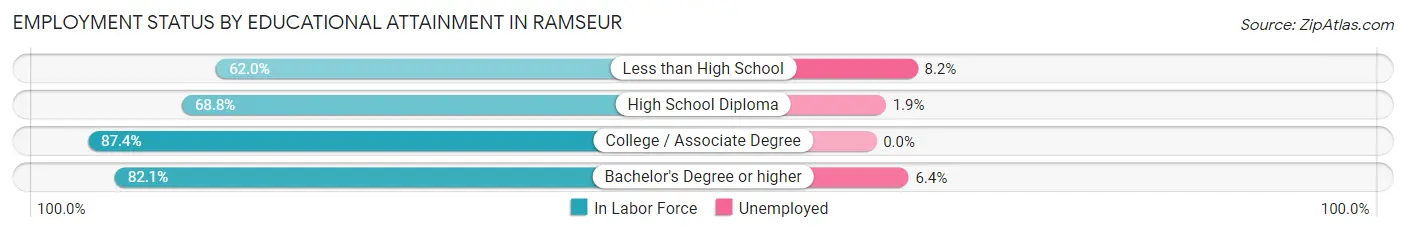
| Educational Attainment | In Labor Force | Unemployed |
| Less than High School | 49 (62.0%) | 6 (8.2%) |
| High School Diploma | 161 (68.8%) | 4 (1.9%) |
| College / Associate Degree | 347 (87.4%) | 0 (0.0%) |
| Bachelor's Degree or higher | 78 (82.1%) | 6 (6.4%) |
| Total | 635 (78.9%) | 15 (1.9%) |
Employment Occupations by Sex in Ramseur
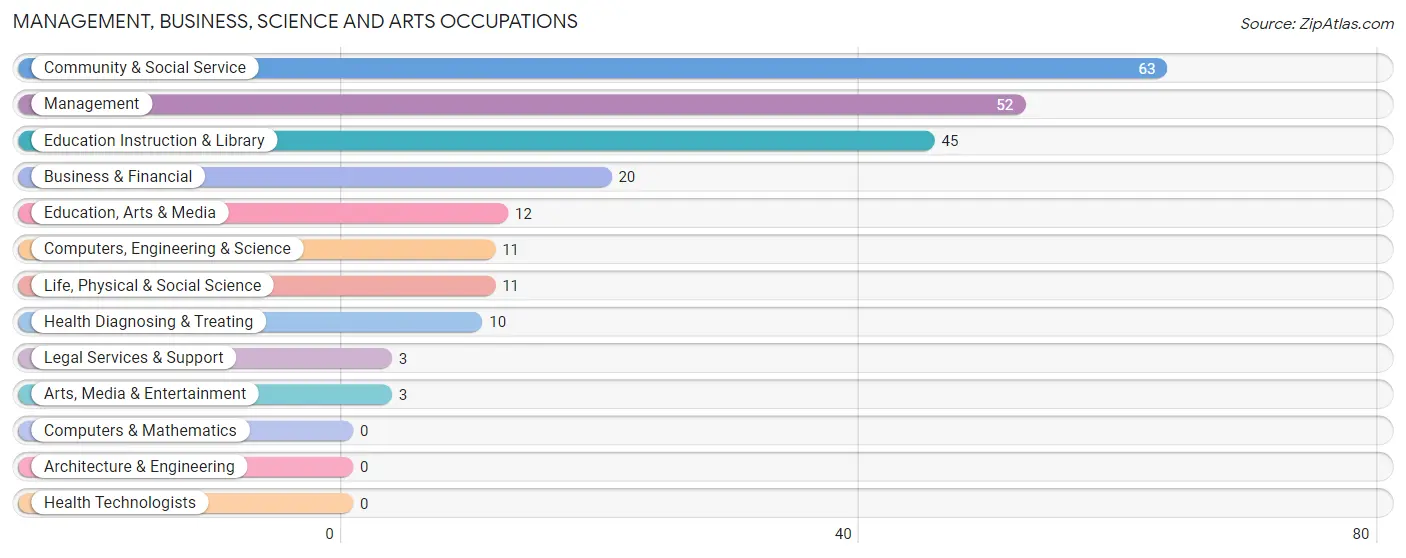
Management, Business, Science and Arts Occupations
The most common Management, Business, Science and Arts occupations in Ramseur are Community & Social Service (63 | 8.6%), Management (52 | 7.1%), Education Instruction & Library (45 | 6.1%), Business & Financial (20 | 2.7%), and Education, Arts & Media (12 | 1.6%).
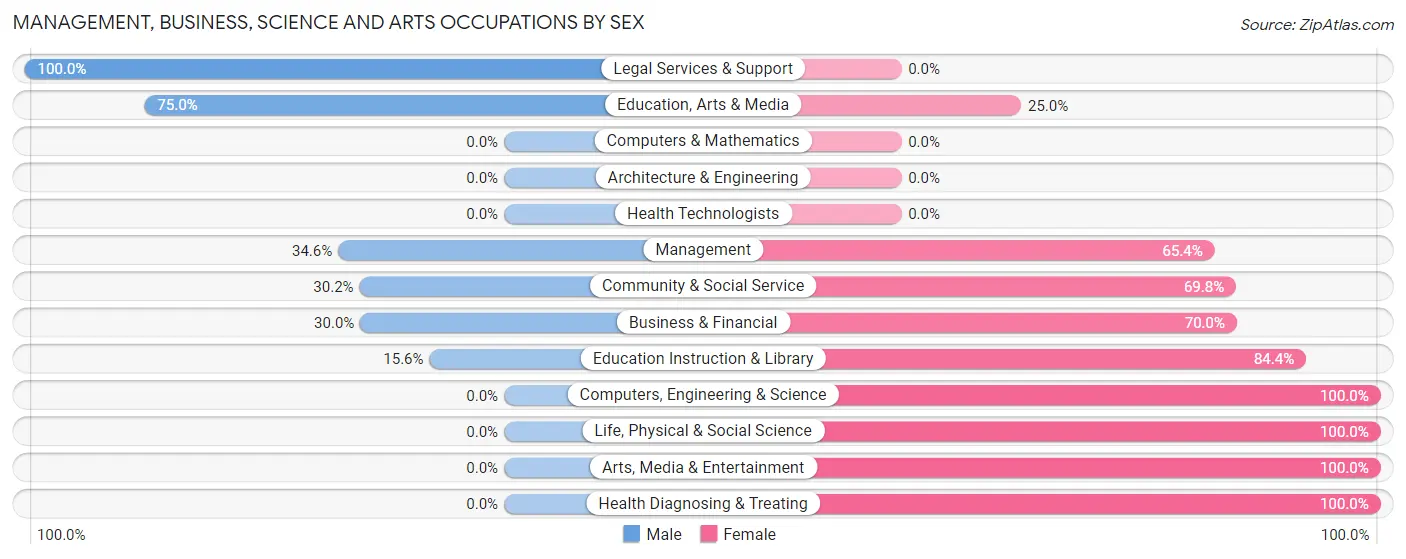
Management, Business, Science and Arts Occupations by Sex
Within the Management, Business, Science and Arts occupations in Ramseur, the most male-oriented occupations are Legal Services & Support (100.0%), Education, Arts & Media (75.0%), and Management (34.6%), while the most female-oriented occupations are Computers, Engineering & Science (100.0%), Life, Physical & Social Science (100.0%), and Arts, Media & Entertainment (100.0%).
| Occupation | Male | Female |
| Management | 18 (34.6%) | 34 (65.4%) |
| Business & Financial | 6 (30.0%) | 14 (70.0%) |
| Computers, Engineering & Science | 0 (0.0%) | 11 (100.0%) |
| Computers & Mathematics | 0 (0.0%) | 0 (0.0%) |
| Architecture & Engineering | 0 (0.0%) | 0 (0.0%) |
| Life, Physical & Social Science | 0 (0.0%) | 11 (100.0%) |
| Community & Social Service | 19 (30.2%) | 44 (69.8%) |
| Education, Arts & Media | 9 (75.0%) | 3 (25.0%) |
| Legal Services & Support | 3 (100.0%) | 0 (0.0%) |
| Education Instruction & Library | 7 (15.6%) | 38 (84.4%) |
| Arts, Media & Entertainment | 0 (0.0%) | 3 (100.0%) |
| Health Diagnosing & Treating | 0 (0.0%) | 10 (100.0%) |
| Health Technologists | 0 (0.0%) | 0 (0.0%) |
| Total (Category) | 43 (27.6%) | 113 (72.4%) |
| Total (Overall) | 305 (41.5%) | 429 (58.5%) |
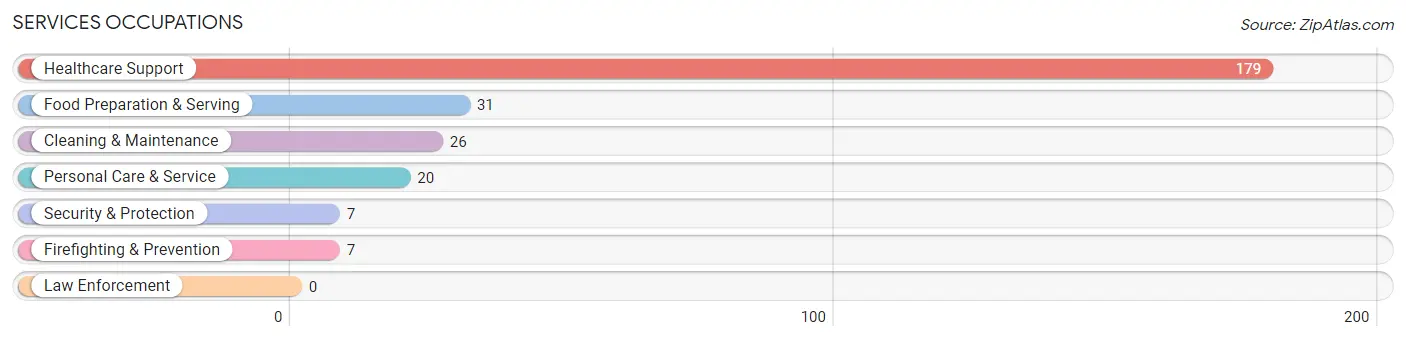
Services Occupations
The most common Services occupations in Ramseur are Healthcare Support (179 | 24.4%), Food Preparation & Serving (31 | 4.2%), Cleaning & Maintenance (26 | 3.5%), Personal Care & Service (20 | 2.7%), and Security & Protection (7 | 0.9%).
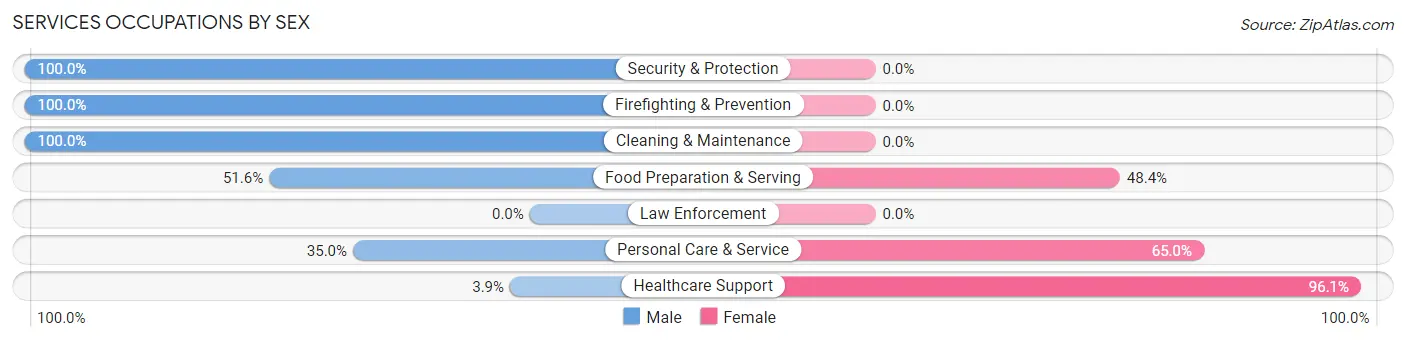
Services Occupations by Sex
Within the Services occupations in Ramseur, the most male-oriented occupations are Security & Protection (100.0%), Firefighting & Prevention (100.0%), and Cleaning & Maintenance (100.0%), while the most female-oriented occupations are Healthcare Support (96.1%), Personal Care & Service (65.0%), and Food Preparation & Serving (48.4%).
| Occupation | Male | Female |
| Healthcare Support | 7 (3.9%) | 172 (96.1%) |
| Security & Protection | 7 (100.0%) | 0 (0.0%) |
| Firefighting & Prevention | 7 (100.0%) | 0 (0.0%) |
| Law Enforcement | 0 (0.0%) | 0 (0.0%) |
| Food Preparation & Serving | 16 (51.6%) | 15 (48.4%) |
| Cleaning & Maintenance | 26 (100.0%) | 0 (0.0%) |
| Personal Care & Service | 7 (35.0%) | 13 (65.0%) |
| Total (Category) | 63 (23.9%) | 200 (76.0%) |
| Total (Overall) | 305 (41.5%) | 429 (58.5%) |
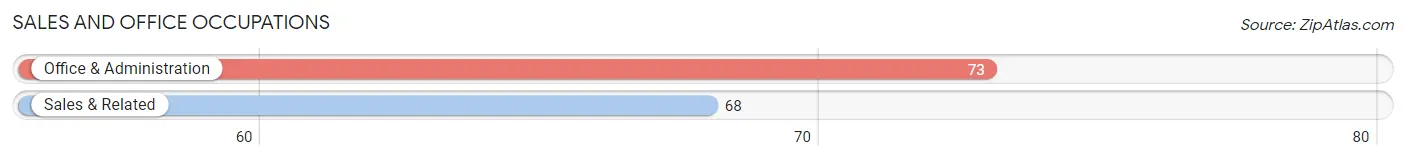
Sales and Office Occupations
The most common Sales and Office occupations in Ramseur are Office & Administration (73 | 10.0%), and Sales & Related (68 | 9.3%).
Sales and Office Occupations by Sex
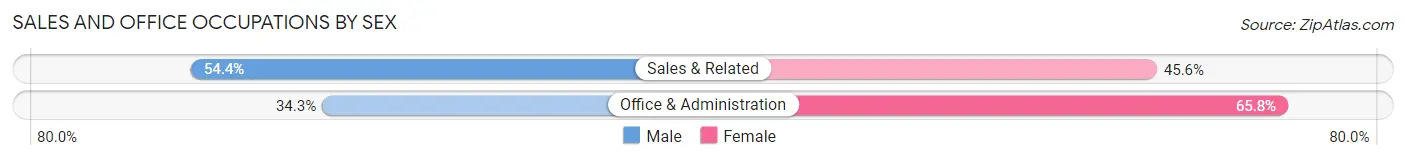
| Occupation | Male | Female |
| Sales & Related | 37 (54.4%) | 31 (45.6%) |
| Office & Administration | 25 (34.3%) | 48 (65.7%) |
| Total (Category) | 62 (44.0%) | 79 (56.0%) |
| Total (Overall) | 305 (41.5%) | 429 (58.5%) |
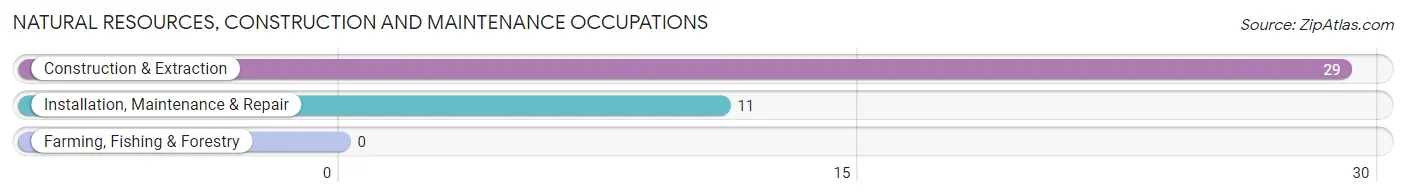
Natural Resources, Construction and Maintenance Occupations
The most common Natural Resources, Construction and Maintenance occupations in Ramseur are Construction & Extraction (29 | 4.0%), and Installation, Maintenance & Repair (11 | 1.5%).
Natural Resources, Construction and Maintenance Occupations by Sex
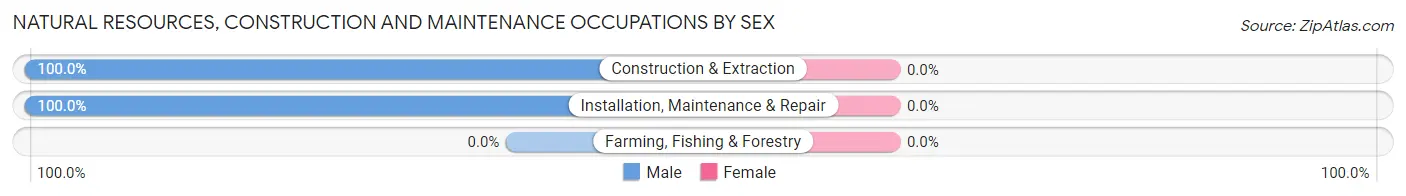
| Occupation | Male | Female |
| Farming, Fishing & Forestry | 0 (0.0%) | 0 (0.0%) |
| Construction & Extraction | 29 (100.0%) | 0 (0.0%) |
| Installation, Maintenance & Repair | 11 (100.0%) | 0 (0.0%) |
| Total (Category) | 40 (100.0%) | 0 (0.0%) |
| Total (Overall) | 305 (41.5%) | 429 (58.5%) |
Production, Transportation and Moving Occupations
The most common Production, Transportation and Moving occupations in Ramseur are Production (97 | 13.2%), Transportation (24 | 3.3%), and Material Moving (13 | 1.8%).
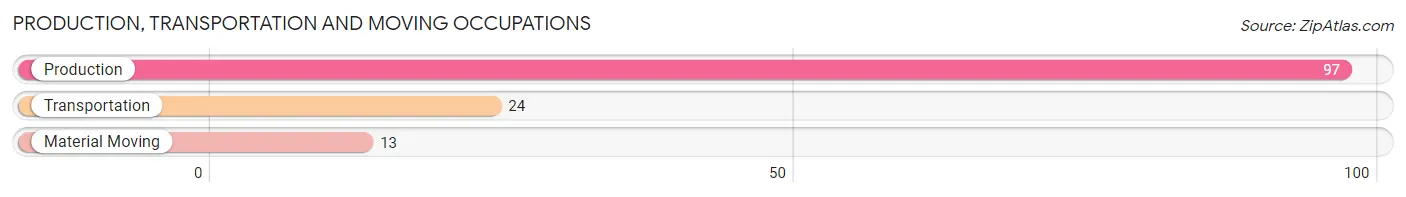
Production, Transportation and Moving Occupations by Sex
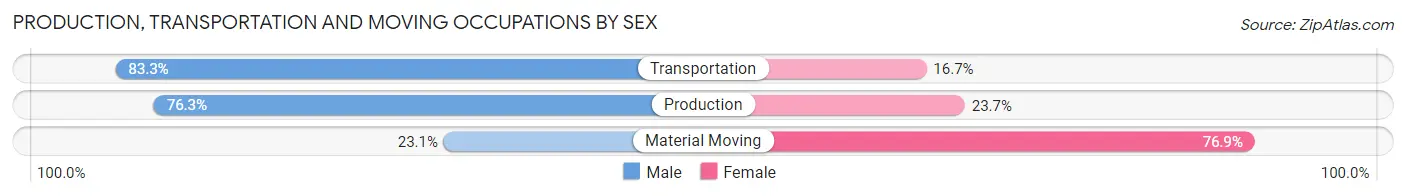
| Occupation | Male | Female |
| Production | 74 (76.3%) | 23 (23.7%) |
| Transportation | 20 (83.3%) | 4 (16.7%) |
| Material Moving | 3 (23.1%) | 10 (76.9%) |
| Total (Category) | 97 (72.4%) | 37 (27.6%) |
| Total (Overall) | 305 (41.5%) | 429 (58.5%) |
Employment Industries by Sex in Ramseur
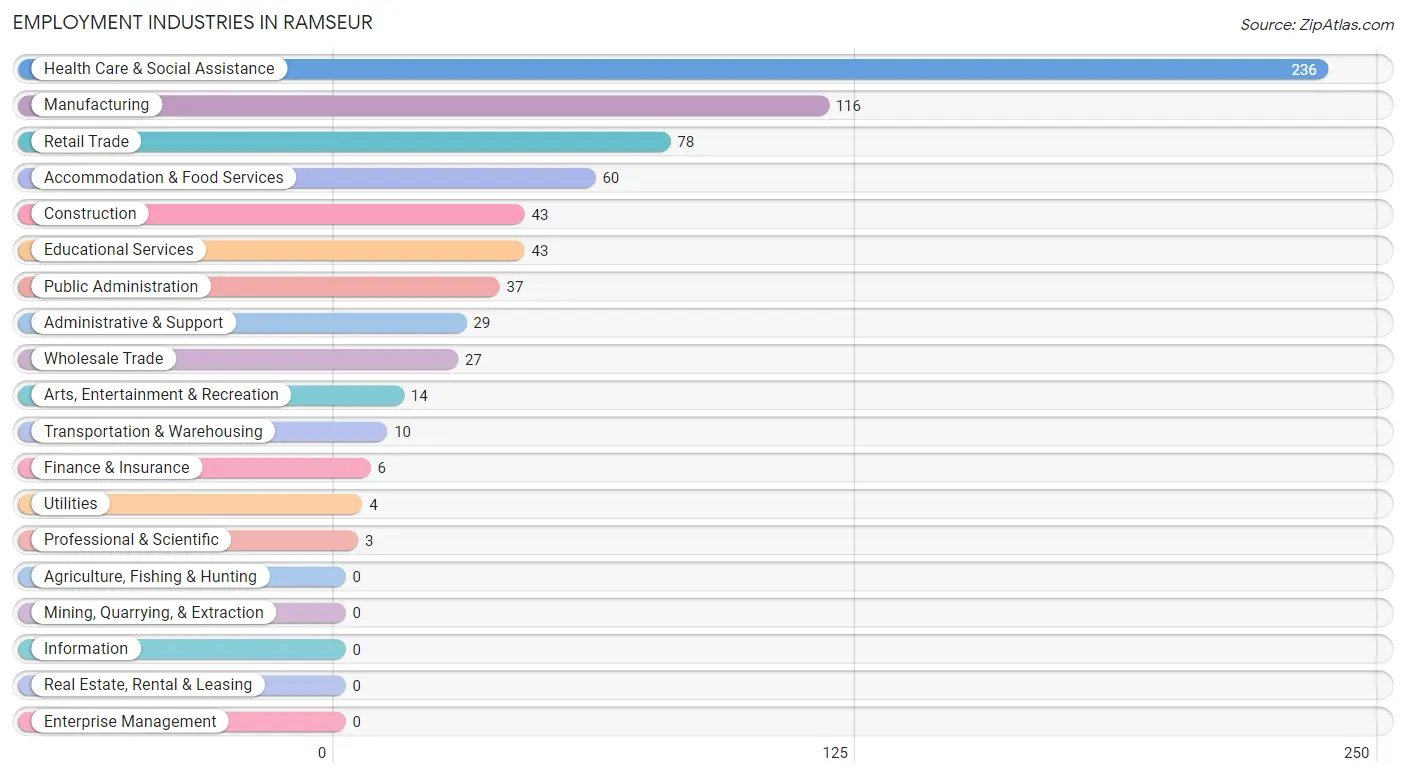
Employment Industries in Ramseur
The major employment industries in Ramseur include Health Care & Social Assistance (236 | 32.2%), Manufacturing (116 | 15.8%), Retail Trade (78 | 10.6%), Accommodation & Food Services (60 | 8.2%), and Construction (43 | 5.9%).
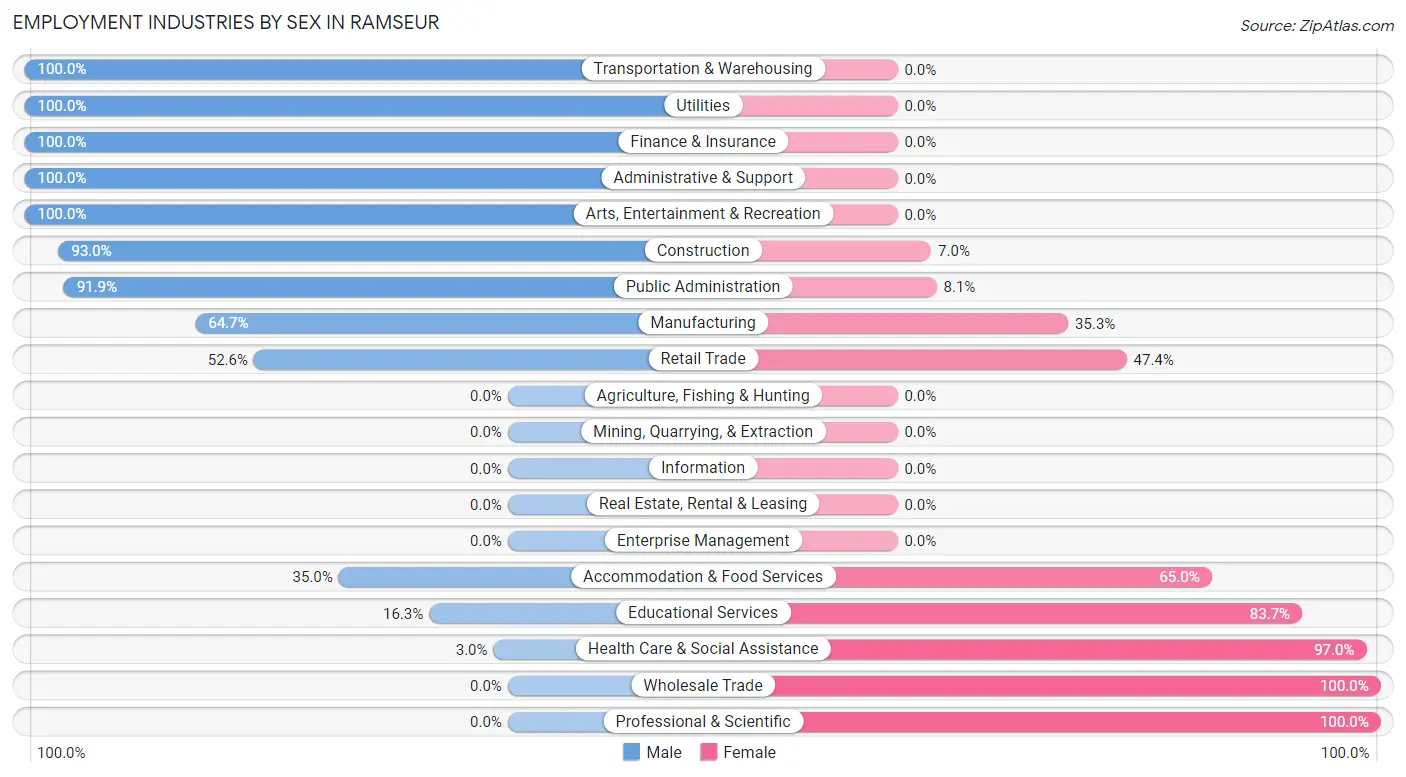
Employment Industries by Sex in Ramseur
The Ramseur industries that see more men than women are Transportation & Warehousing (100.0%), Utilities (100.0%), and Finance & Insurance (100.0%), whereas the industries that tend to have a higher number of women are Wholesale Trade (100.0%), Professional & Scientific (100.0%), and Health Care & Social Assistance (97.0%).
| Industry | Male | Female |
| Agriculture, Fishing & Hunting | 0 (0.0%) | 0 (0.0%) |
| Mining, Quarrying, & Extraction | 0 (0.0%) | 0 (0.0%) |
| Construction | 40 (93.0%) | 3 (7.0%) |
| Manufacturing | 75 (64.7%) | 41 (35.3%) |
| Wholesale Trade | 0 (0.0%) | 27 (100.0%) |
| Retail Trade | 41 (52.6%) | 37 (47.4%) |
| Transportation & Warehousing | 10 (100.0%) | 0 (0.0%) |
| Utilities | 4 (100.0%) | 0 (0.0%) |
| Information | 0 (0.0%) | 0 (0.0%) |
| Finance & Insurance | 6 (100.0%) | 0 (0.0%) |
| Real Estate, Rental & Leasing | 0 (0.0%) | 0 (0.0%) |
| Professional & Scientific | 0 (0.0%) | 3 (100.0%) |
| Enterprise Management | 0 (0.0%) | 0 (0.0%) |
| Administrative & Support | 29 (100.0%) | 0 (0.0%) |
| Educational Services | 7 (16.3%) | 36 (83.7%) |
| Health Care & Social Assistance | 7 (3.0%) | 229 (97.0%) |
| Arts, Entertainment & Recreation | 14 (100.0%) | 0 (0.0%) |
| Accommodation & Food Services | 21 (35.0%) | 39 (65.0%) |
| Public Administration | 34 (91.9%) | 3 (8.1%) |
| Total | 305 (41.5%) | 429 (58.5%) |
Education in Ramseur
School Enrollment in Ramseur
The most common levels of schooling among the 592 students in Ramseur are nursery / preschool (163 | 27.5%), elementary school (144 | 24.3%), and high school (110 | 18.6%).
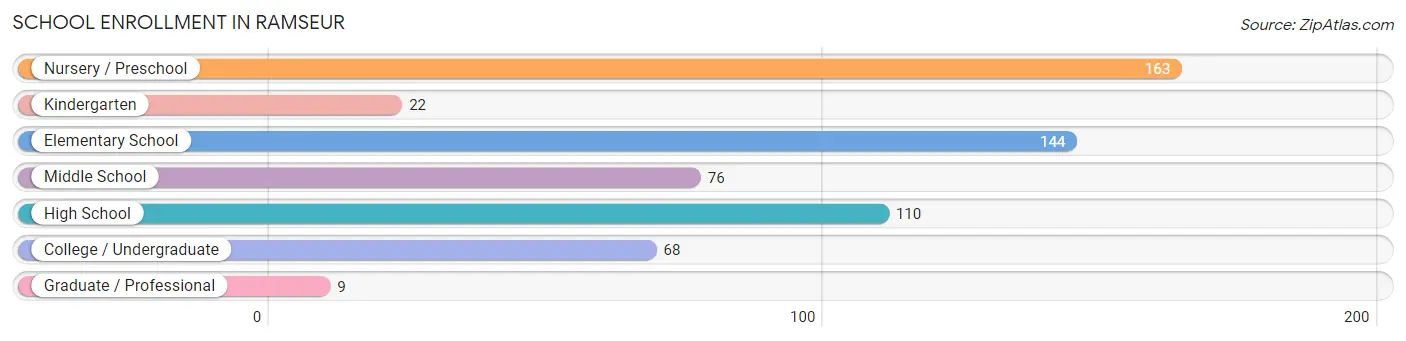
| School Level | # Students | % Students |
| Nursery / Preschool | 163 | 27.5% |
| Kindergarten | 22 | 3.7% |
| Elementary School | 144 | 24.3% |
| Middle School | 76 | 12.8% |
| High School | 110 | 18.6% |
| College / Undergraduate | 68 | 11.5% |
| Graduate / Professional | 9 | 1.5% |
| Total | 592 | 100.0% |
School Enrollment by Age by Funding Source in Ramseur
Out of a total of 592 students who are enrolled in schools in Ramseur, 39 (6.6%) attend a private institution, while the remaining 553 (93.4%) are enrolled in public schools. The age group of 35 years and over has the highest likelihood of being enrolled in private schools, with 9 (37.5% in the age bracket) enrolled. Conversely, the age group of 15 to 17 year olds has the lowest likelihood of being enrolled in a private school, with 73 (100.0% in the age bracket) attending a public institution.
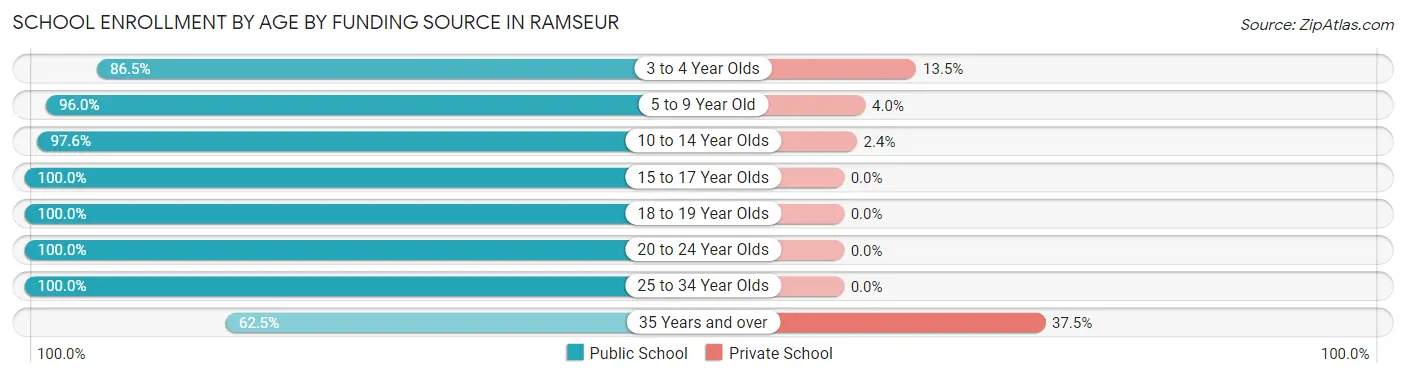
| Age Bracket | Public School | Private School |
| 3 to 4 Year Olds | 141 (86.5%) | 22 (13.5%) |
| 5 to 9 Year Old | 96 (96.0%) | 4 (4.0%) |
| 10 to 14 Year Olds | 161 (97.6%) | 4 (2.4%) |
| 15 to 17 Year Olds | 73 (100.0%) | 0 (0.0%) |
| 18 to 19 Year Olds | 32 (100.0%) | 0 (0.0%) |
| 20 to 24 Year Olds | 24 (100.0%) | 0 (0.0%) |
| 25 to 34 Year Olds | 11 (100.0%) | 0 (0.0%) |
| 35 Years and over | 15 (62.5%) | 9 (37.5%) |
| Total | 553 (93.4%) | 39 (6.6%) |
Educational Attainment by Field of Study in Ramseur
Education (37 | 29.4%), business (17 | 13.5%), engineering (14 | 11.1%), liberal arts & history (12 | 9.5%), and multidisciplinary studies (10 | 7.9%) are the most common fields of study among 126 individuals in Ramseur who have obtained a bachelor's degree or higher.
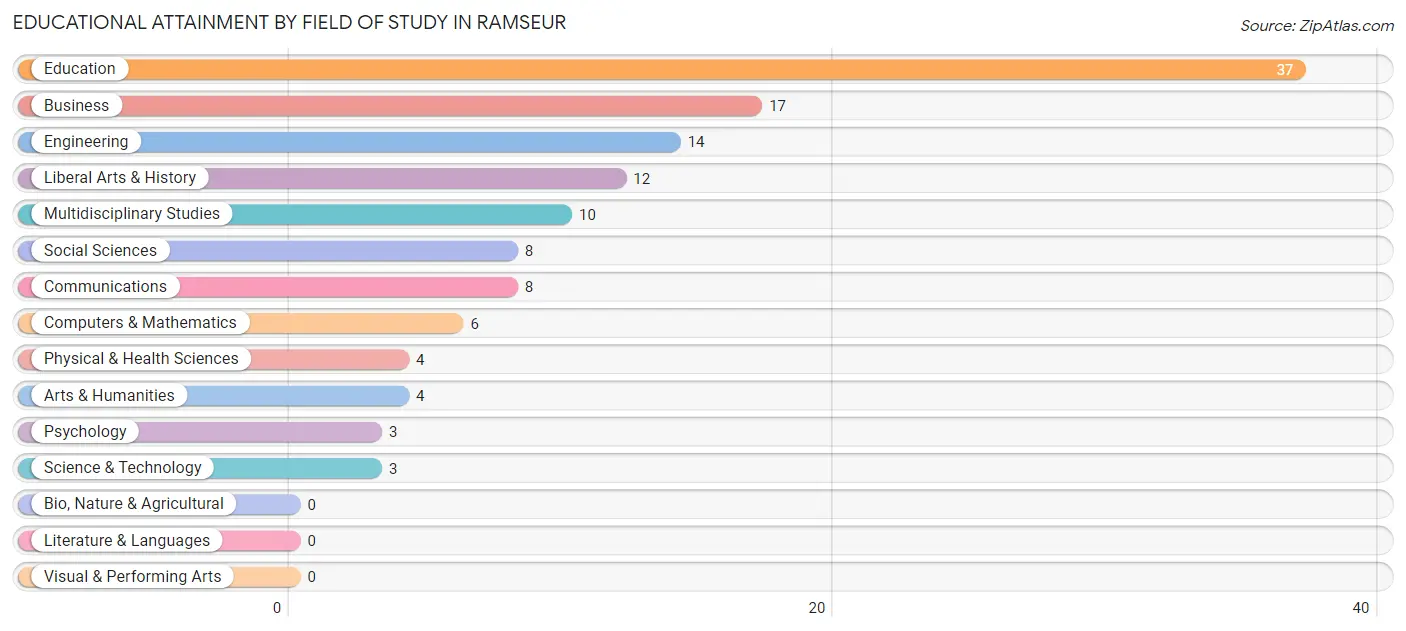
| Field of Study | # Graduates | % Graduates |
| Computers & Mathematics | 6 | 4.8% |
| Bio, Nature & Agricultural | 0 | 0.0% |
| Physical & Health Sciences | 4 | 3.2% |
| Psychology | 3 | 2.4% |
| Social Sciences | 8 | 6.4% |
| Engineering | 14 | 11.1% |
| Multidisciplinary Studies | 10 | 7.9% |
| Science & Technology | 3 | 2.4% |
| Business | 17 | 13.5% |
| Education | 37 | 29.4% |
| Literature & Languages | 0 | 0.0% |
| Liberal Arts & History | 12 | 9.5% |
| Visual & Performing Arts | 0 | 0.0% |
| Communications | 8 | 6.4% |
| Arts & Humanities | 4 | 3.2% |
| Total | 126 | 100.0% |
Transportation & Commute in Ramseur
Vehicle Availability by Sex in Ramseur
The most prevalent vehicle ownership categories in Ramseur are males with 2 vehicles (154, accounting for 50.8%) and females with 2 vehicles (156, making up 51.3%).
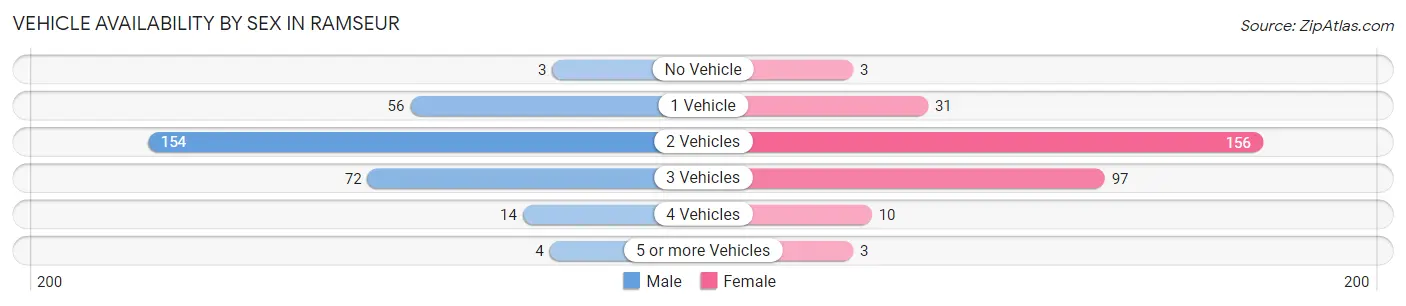
| Vehicles Available | Male | Female |
| No Vehicle | 3 (1.0%) | 3 (1.0%) |
| 1 Vehicle | 56 (18.5%) | 31 (10.3%) |
| 2 Vehicles | 154 (50.8%) | 156 (52.0%) |
| 3 Vehicles | 72 (23.8%) | 97 (32.3%) |
| 4 Vehicles | 14 (4.6%) | 10 (3.3%) |
| 5 or more Vehicles | 4 (1.3%) | 3 (1.0%) |
| Total | 303 (100.0%) | 300 (100.0%) |
Commute Time in Ramseur
The most frequently occuring commute durations in Ramseur are 20 to 24 minutes (130 commuters, 22.5%), 15 to 19 minutes (98 commuters, 16.9%), and 25 to 29 minutes (58 commuters, 10.0%).
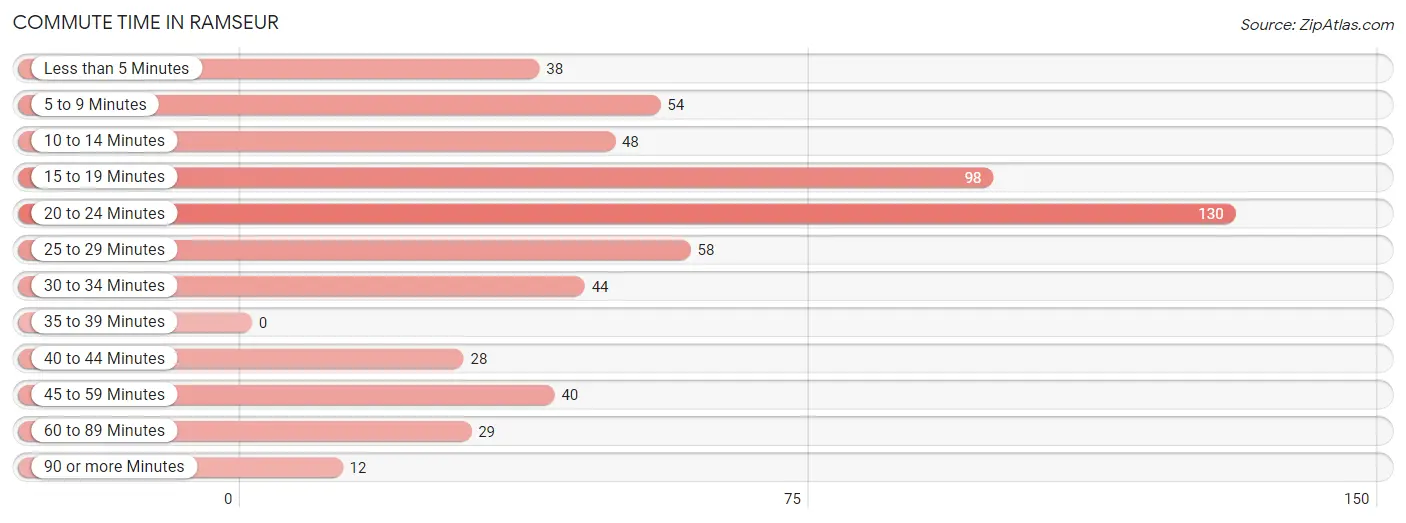
| Commute Time | # Commuters | % Commuters |
| Less than 5 Minutes | 38 | 6.6% |
| 5 to 9 Minutes | 54 | 9.3% |
| 10 to 14 Minutes | 48 | 8.3% |
| 15 to 19 Minutes | 98 | 16.9% |
| 20 to 24 Minutes | 130 | 22.5% |
| 25 to 29 Minutes | 58 | 10.0% |
| 30 to 34 Minutes | 44 | 7.6% |
| 35 to 39 Minutes | 0 | 0.0% |
| 40 to 44 Minutes | 28 | 4.8% |
| 45 to 59 Minutes | 40 | 6.9% |
| 60 to 89 Minutes | 29 | 5.0% |
| 90 or more Minutes | 12 | 2.1% |
Commute Time by Sex in Ramseur
The most common commute times in Ramseur are 20 to 24 minutes (66 commuters, 22.0%) for males and 20 to 24 minutes (64 commuters, 22.9%) for females.
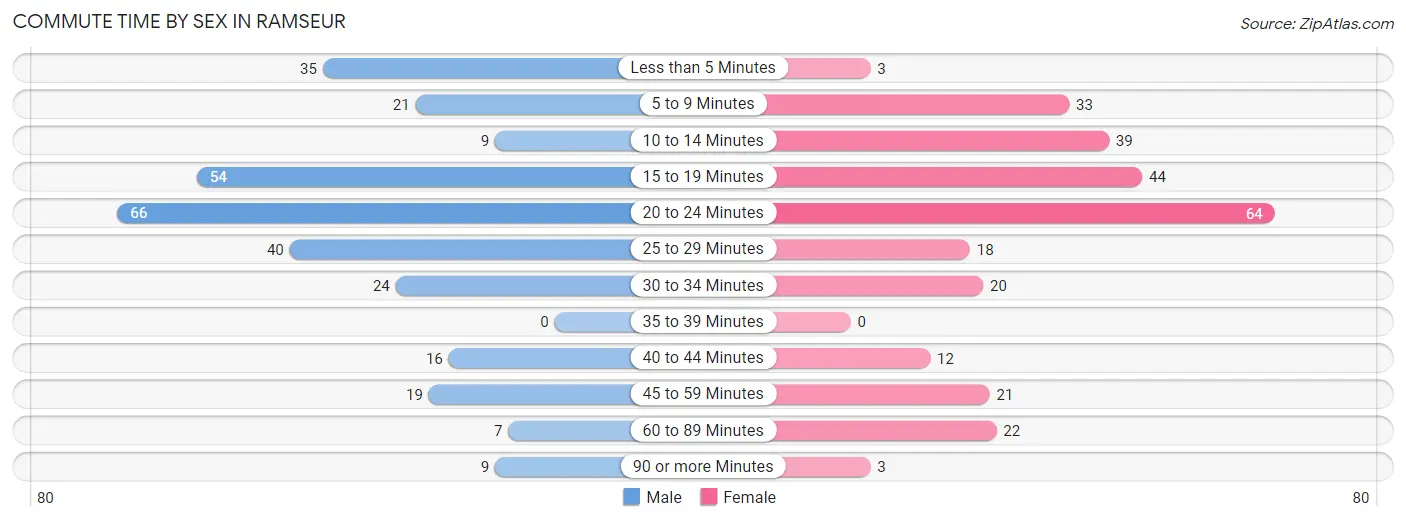
| Commute Time | Male | Female |
| Less than 5 Minutes | 35 (11.7%) | 3 (1.1%) |
| 5 to 9 Minutes | 21 (7.0%) | 33 (11.8%) |
| 10 to 14 Minutes | 9 (3.0%) | 39 (14.0%) |
| 15 to 19 Minutes | 54 (18.0%) | 44 (15.8%) |
| 20 to 24 Minutes | 66 (22.0%) | 64 (22.9%) |
| 25 to 29 Minutes | 40 (13.3%) | 18 (6.5%) |
| 30 to 34 Minutes | 24 (8.0%) | 20 (7.2%) |
| 35 to 39 Minutes | 0 (0.0%) | 0 (0.0%) |
| 40 to 44 Minutes | 16 (5.3%) | 12 (4.3%) |
| 45 to 59 Minutes | 19 (6.3%) | 21 (7.5%) |
| 60 to 89 Minutes | 7 (2.3%) | 22 (7.9%) |
| 90 or more Minutes | 9 (3.0%) | 3 (1.1%) |
Time of Departure to Work by Sex in Ramseur
The most frequent times of departure to work in Ramseur are 6:00 AM to 6:29 AM (58, 19.3%) for males and 7:00 AM to 7:29 AM (83, 29.7%) for females.
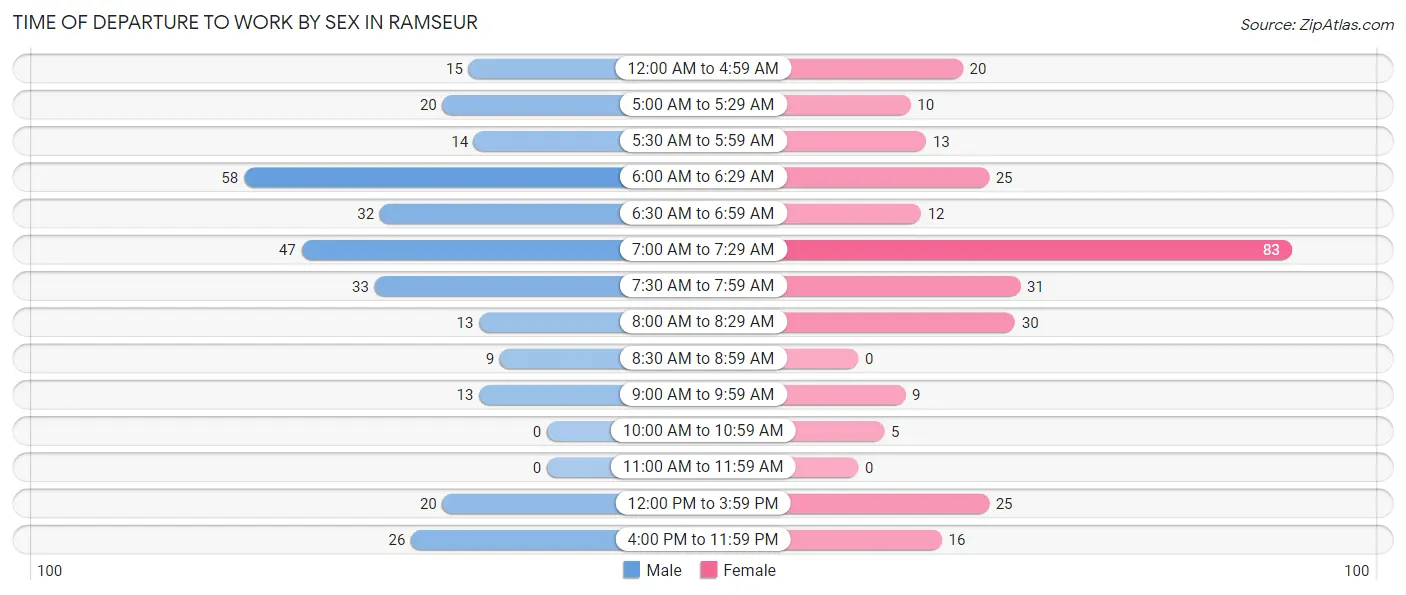
| Time of Departure | Male | Female |
| 12:00 AM to 4:59 AM | 15 (5.0%) | 20 (7.2%) |
| 5:00 AM to 5:29 AM | 20 (6.7%) | 10 (3.6%) |
| 5:30 AM to 5:59 AM | 14 (4.7%) | 13 (4.7%) |
| 6:00 AM to 6:29 AM | 58 (19.3%) | 25 (9.0%) |
| 6:30 AM to 6:59 AM | 32 (10.7%) | 12 (4.3%) |
| 7:00 AM to 7:29 AM | 47 (15.7%) | 83 (29.7%) |
| 7:30 AM to 7:59 AM | 33 (11.0%) | 31 (11.1%) |
| 8:00 AM to 8:29 AM | 13 (4.3%) | 30 (10.7%) |
| 8:30 AM to 8:59 AM | 9 (3.0%) | 0 (0.0%) |
| 9:00 AM to 9:59 AM | 13 (4.3%) | 9 (3.2%) |
| 10:00 AM to 10:59 AM | 0 (0.0%) | 5 (1.8%) |
| 11:00 AM to 11:59 AM | 0 (0.0%) | 0 (0.0%) |
| 12:00 PM to 3:59 PM | 20 (6.7%) | 25 (9.0%) |
| 4:00 PM to 11:59 PM | 26 (8.7%) | 16 (5.7%) |
| Total | 300 (100.0%) | 279 (100.0%) |
Housing Occupancy in Ramseur
Occupancy by Ownership in Ramseur
Of the total 633 dwellings in Ramseur, owner-occupied units account for 265 (41.9%), while renter-occupied units make up 368 (58.1%).
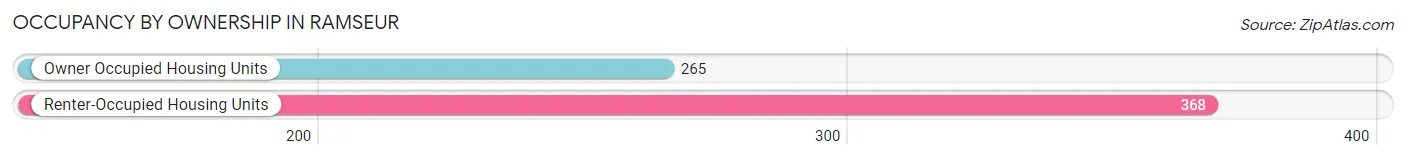
| Occupancy | # Housing Units | % Housing Units |
| Owner Occupied Housing Units | 265 | 41.9% |
| Renter-Occupied Housing Units | 368 | 58.1% |
| Total Occupied Housing Units | 633 | 100.0% |
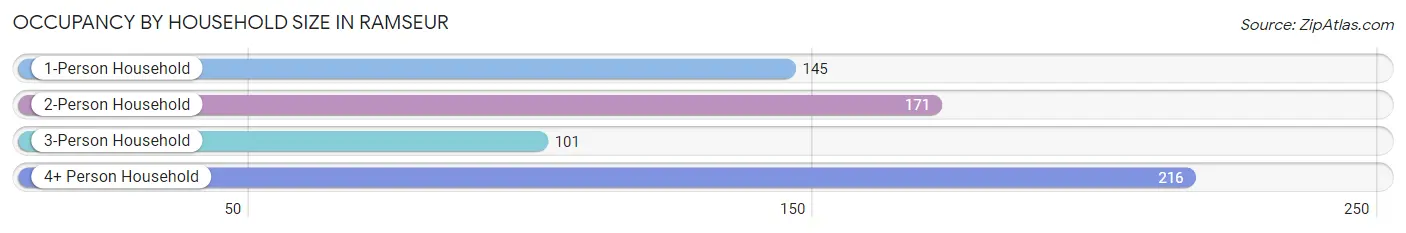
Occupancy by Household Size in Ramseur
| Household Size | # Housing Units | % Housing Units |
| 1-Person Household | 145 | 22.9% |
| 2-Person Household | 171 | 27.0% |
| 3-Person Household | 101 | 16.0% |
| 4+ Person Household | 216 | 34.1% |
| Total Housing Units | 633 | 100.0% |
Occupancy by Ownership by Household Size in Ramseur
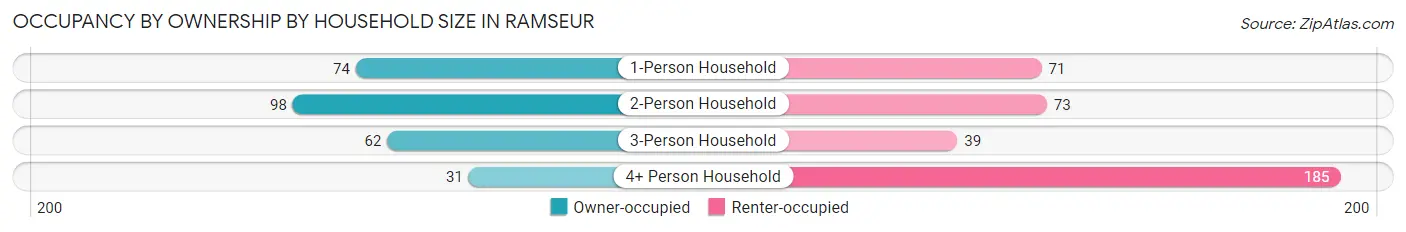
| Household Size | Owner-occupied | Renter-occupied |
| 1-Person Household | 74 (51.0%) | 71 (49.0%) |
| 2-Person Household | 98 (57.3%) | 73 (42.7%) |
| 3-Person Household | 62 (61.4%) | 39 (38.6%) |
| 4+ Person Household | 31 (14.3%) | 185 (85.7%) |
| Total Housing Units | 265 (41.9%) | 368 (58.1%) |
Occupancy by Educational Attainment in Ramseur
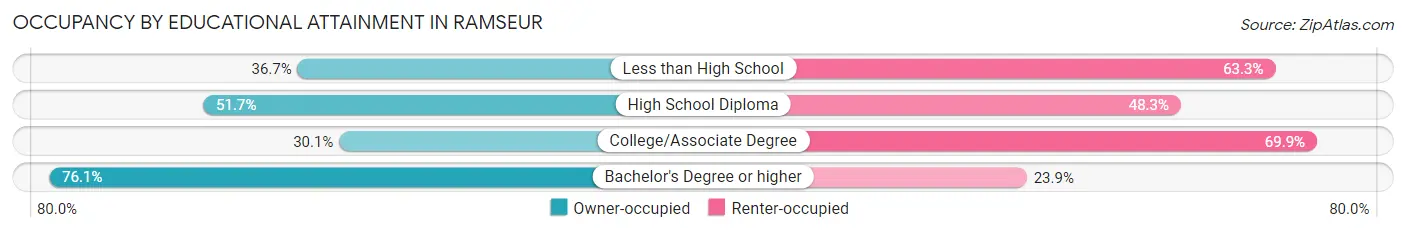
| Household Size | Owner-occupied | Renter-occupied |
| Less than High School | 29 (36.7%) | 50 (63.3%) |
| High School Diploma | 92 (51.7%) | 86 (48.3%) |
| College/Associate Degree | 93 (30.1%) | 216 (69.9%) |
| Bachelor's Degree or higher | 51 (76.1%) | 16 (23.9%) |
Occupancy by Age of Householder in Ramseur
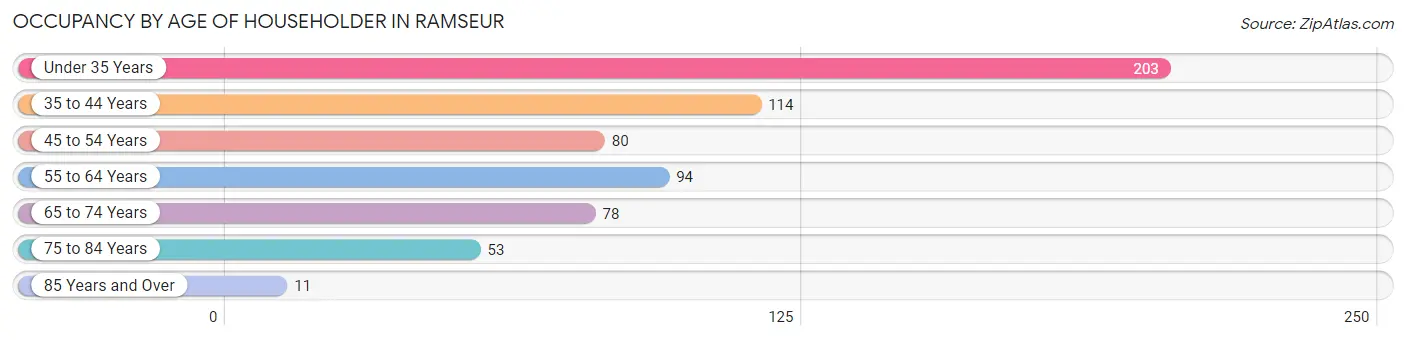
| Age Bracket | # Households | % Households |
| Under 35 Years | 203 | 32.1% |
| 35 to 44 Years | 114 | 18.0% |
| 45 to 54 Years | 80 | 12.6% |
| 55 to 64 Years | 94 | 14.8% |
| 65 to 74 Years | 78 | 12.3% |
| 75 to 84 Years | 53 | 8.4% |
| 85 Years and Over | 11 | 1.7% |
| Total | 633 | 100.0% |
Housing Finances in Ramseur
Median Income by Occupancy in Ramseur
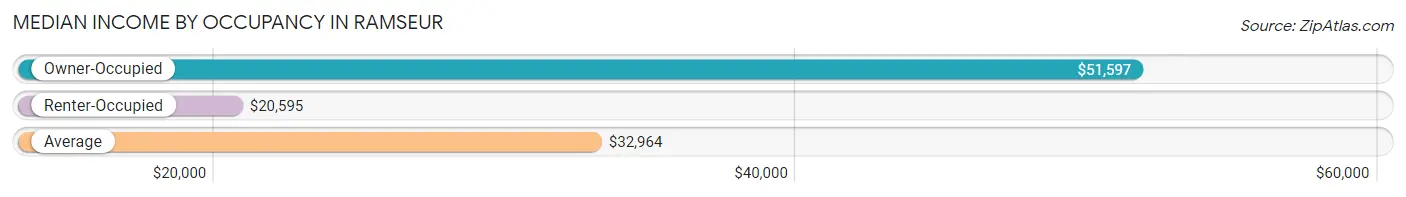
| Occupancy Type | # Households | Median Income |
| Owner-Occupied | 265 (41.9%) | $51,597 |
| Renter-Occupied | 368 (58.1%) | $20,595 |
| Average | 633 (100.0%) | $32,964 |
Occupancy by Householder Income Bracket in Ramseur
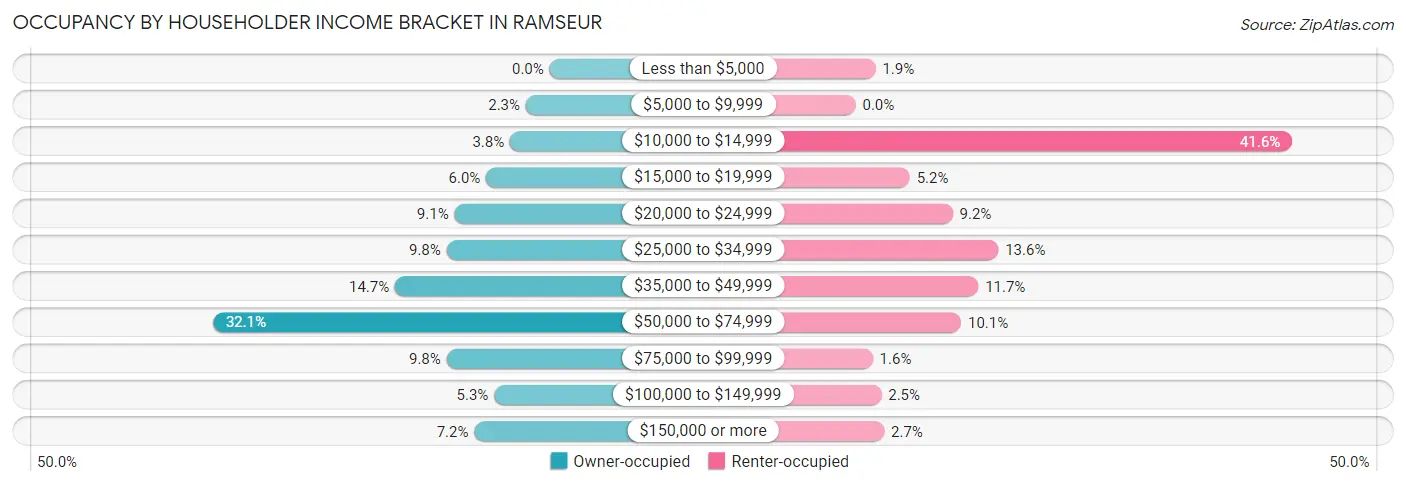
| Income Bracket | Owner-occupied | Renter-occupied |
| Less than $5,000 | 0 (0.0%) | 7 (1.9%) |
| $5,000 to $9,999 | 6 (2.3%) | 0 (0.0%) |
| $10,000 to $14,999 | 10 (3.8%) | 153 (41.6%) |
| $15,000 to $19,999 | 16 (6.0%) | 19 (5.2%) |
| $20,000 to $24,999 | 24 (9.1%) | 34 (9.2%) |
| $25,000 to $34,999 | 26 (9.8%) | 50 (13.6%) |
| $35,000 to $49,999 | 39 (14.7%) | 43 (11.7%) |
| $50,000 to $74,999 | 85 (32.1%) | 37 (10.1%) |
| $75,000 to $99,999 | 26 (9.8%) | 6 (1.6%) |
| $100,000 to $149,999 | 14 (5.3%) | 9 (2.5%) |
| $150,000 or more | 19 (7.2%) | 10 (2.7%) |
| Total | 265 (100.0%) | 368 (100.0%) |
Monthly Housing Cost Tiers in Ramseur
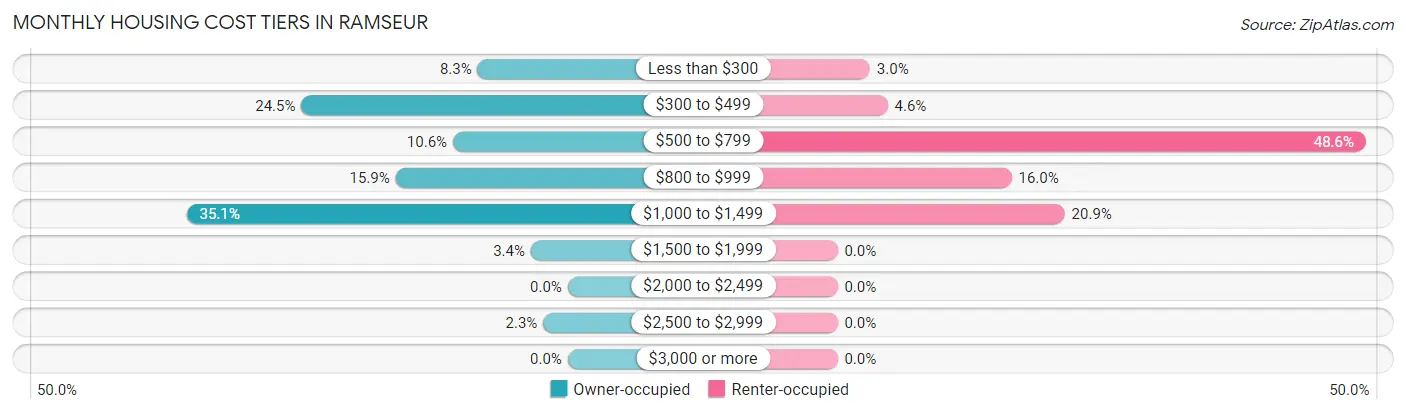
| Monthly Cost | Owner-occupied | Renter-occupied |
| Less than $300 | 22 (8.3%) | 11 (3.0%) |
| $300 to $499 | 65 (24.5%) | 17 (4.6%) |
| $500 to $799 | 28 (10.6%) | 179 (48.6%) |
| $800 to $999 | 42 (15.9%) | 59 (16.0%) |
| $1,000 to $1,499 | 93 (35.1%) | 77 (20.9%) |
| $1,500 to $1,999 | 9 (3.4%) | 0 (0.0%) |
| $2,000 to $2,499 | 0 (0.0%) | 0 (0.0%) |
| $2,500 to $2,999 | 6 (2.3%) | 0 (0.0%) |
| $3,000 or more | 0 (0.0%) | 0 (0.0%) |
| Total | 265 (100.0%) | 368 (100.0%) |
Physical Housing Characteristics in Ramseur
Housing Structures in Ramseur
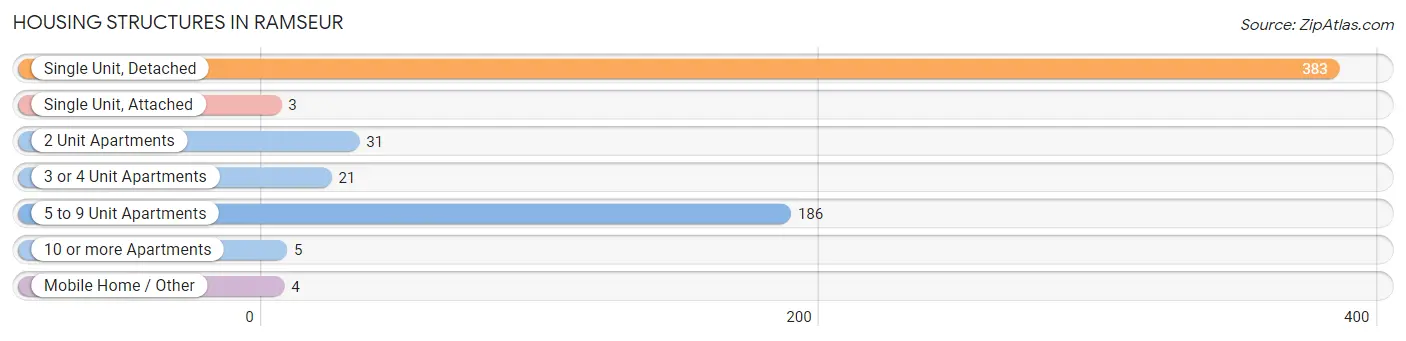
| Structure Type | # Housing Units | % Housing Units |
| Single Unit, Detached | 383 | 60.5% |
| Single Unit, Attached | 3 | 0.5% |
| 2 Unit Apartments | 31 | 4.9% |
| 3 or 4 Unit Apartments | 21 | 3.3% |
| 5 to 9 Unit Apartments | 186 | 29.4% |
| 10 or more Apartments | 5 | 0.8% |
| Mobile Home / Other | 4 | 0.6% |
| Total | 633 | 100.0% |
Housing Structures by Occupancy in Ramseur
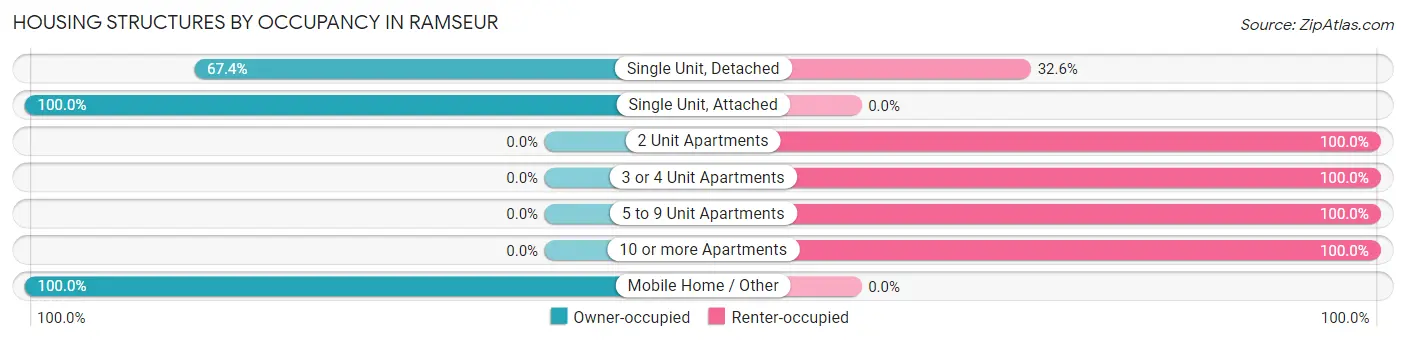
| Structure Type | Owner-occupied | Renter-occupied |
| Single Unit, Detached | 258 (67.4%) | 125 (32.6%) |
| Single Unit, Attached | 3 (100.0%) | 0 (0.0%) |
| 2 Unit Apartments | 0 (0.0%) | 31 (100.0%) |
| 3 or 4 Unit Apartments | 0 (0.0%) | 21 (100.0%) |
| 5 to 9 Unit Apartments | 0 (0.0%) | 186 (100.0%) |
| 10 or more Apartments | 0 (0.0%) | 5 (100.0%) |
| Mobile Home / Other | 4 (100.0%) | 0 (0.0%) |
| Total | 265 (41.9%) | 368 (58.1%) |
Housing Structures by Number of Rooms in Ramseur
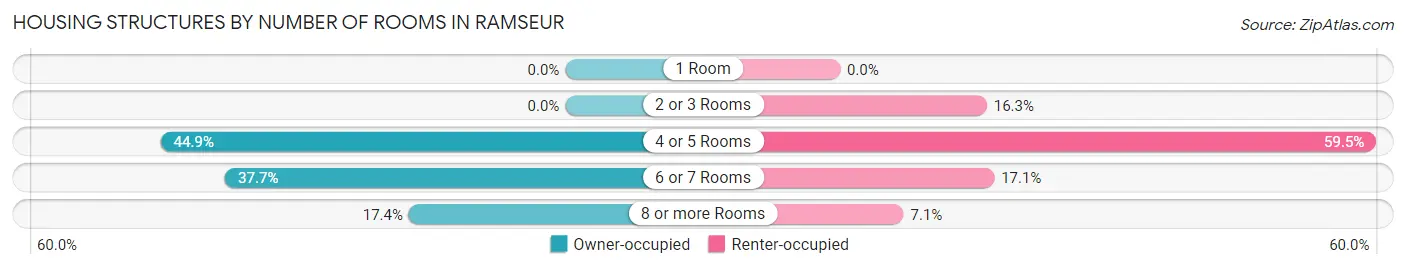
| Number of Rooms | Owner-occupied | Renter-occupied |
| 1 Room | 0 (0.0%) | 0 (0.0%) |
| 2 or 3 Rooms | 0 (0.0%) | 60 (16.3%) |
| 4 or 5 Rooms | 119 (44.9%) | 219 (59.5%) |
| 6 or 7 Rooms | 100 (37.7%) | 63 (17.1%) |
| 8 or more Rooms | 46 (17.4%) | 26 (7.1%) |
| Total | 265 (100.0%) | 368 (100.0%) |
Housing Structure by Heating Type in Ramseur
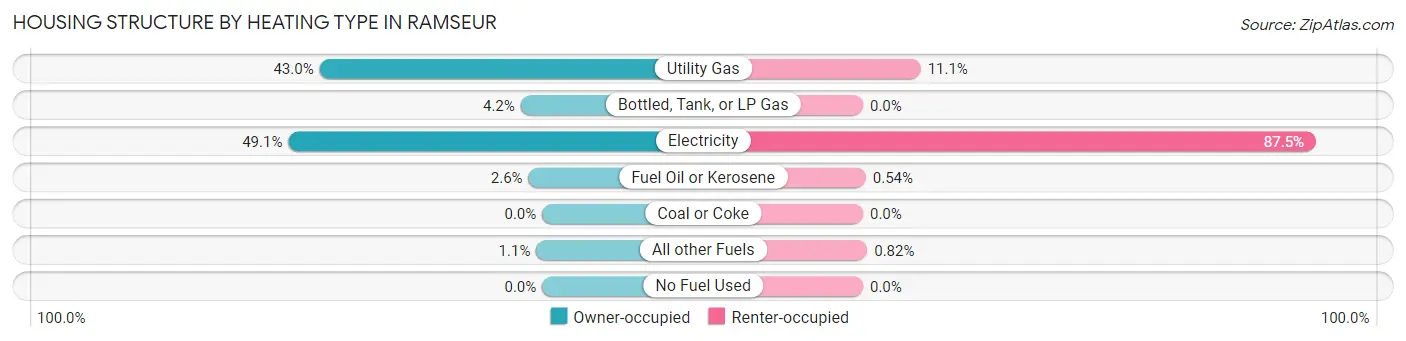
| Heating Type | Owner-occupied | Renter-occupied |
| Utility Gas | 114 (43.0%) | 41 (11.1%) |
| Bottled, Tank, or LP Gas | 11 (4.2%) | 0 (0.0%) |
| Electricity | 130 (49.1%) | 322 (87.5%) |
| Fuel Oil or Kerosene | 7 (2.6%) | 2 (0.5%) |
| Coal or Coke | 0 (0.0%) | 0 (0.0%) |
| All other Fuels | 3 (1.1%) | 3 (0.8%) |
| No Fuel Used | 0 (0.0%) | 0 (0.0%) |
| Total | 265 (100.0%) | 368 (100.0%) |
Household Vehicle Usage in Ramseur
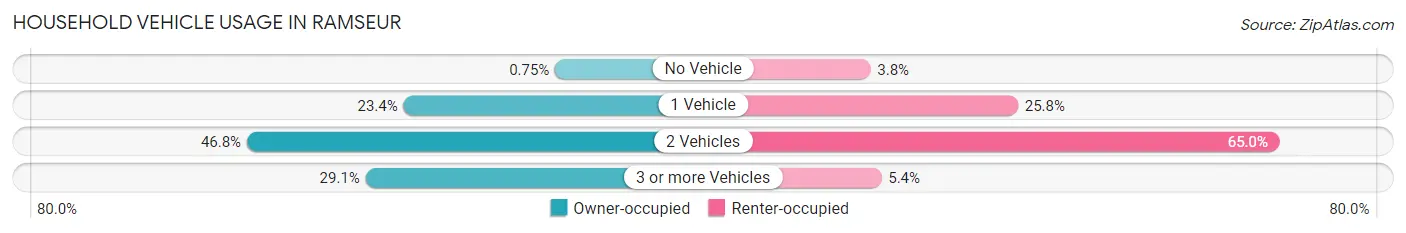
| Vehicles per Household | Owner-occupied | Renter-occupied |
| No Vehicle | 2 (0.7%) | 14 (3.8%) |
| 1 Vehicle | 62 (23.4%) | 95 (25.8%) |
| 2 Vehicles | 124 (46.8%) | 239 (64.9%) |
| 3 or more Vehicles | 77 (29.1%) | 20 (5.4%) |
| Total | 265 (100.0%) | 368 (100.0%) |
Real Estate & Mortgages in Ramseur
Real Estate and Mortgage Overview in Ramseur
| Characteristic | Without Mortgage | With Mortgage |
| Housing Units | 98 | 167 |
| Median Property Value | $97,500 | $123,200 |
| Median Household Income | $37,500 | $16 |
| Monthly Housing Costs | $345 | $0 |
| Real Estate Taxes | $1,063 | $0 |
Property Value by Mortgage Status in Ramseur
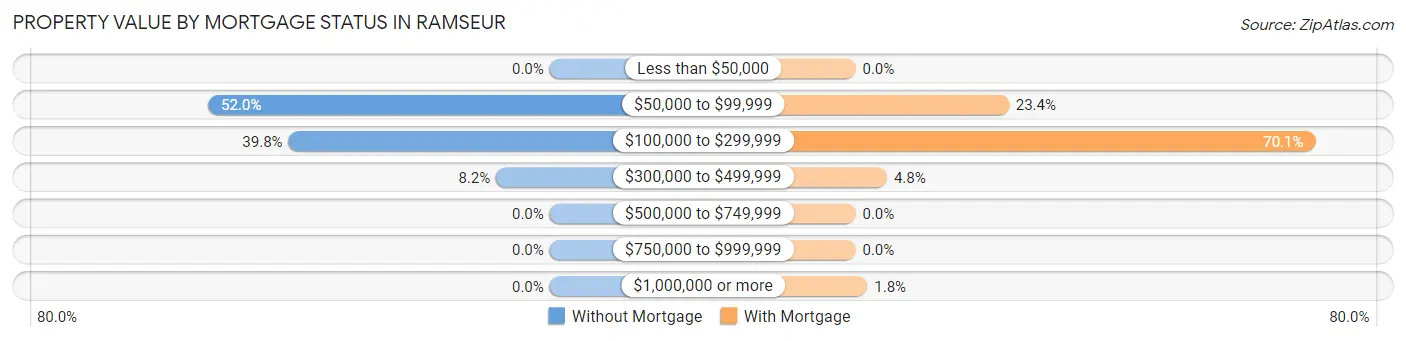
| Property Value | Without Mortgage | With Mortgage |
| Less than $50,000 | 0 (0.0%) | 0 (0.0%) |
| $50,000 to $99,999 | 51 (52.0%) | 39 (23.4%) |
| $100,000 to $299,999 | 39 (39.8%) | 117 (70.1%) |
| $300,000 to $499,999 | 8 (8.2%) | 8 (4.8%) |
| $500,000 to $749,999 | 0 (0.0%) | 0 (0.0%) |
| $750,000 to $999,999 | 0 (0.0%) | 0 (0.0%) |
| $1,000,000 or more | 0 (0.0%) | 3 (1.8%) |
| Total | 98 (100.0%) | 167 (100.0%) |
Household Income by Mortgage Status in Ramseur
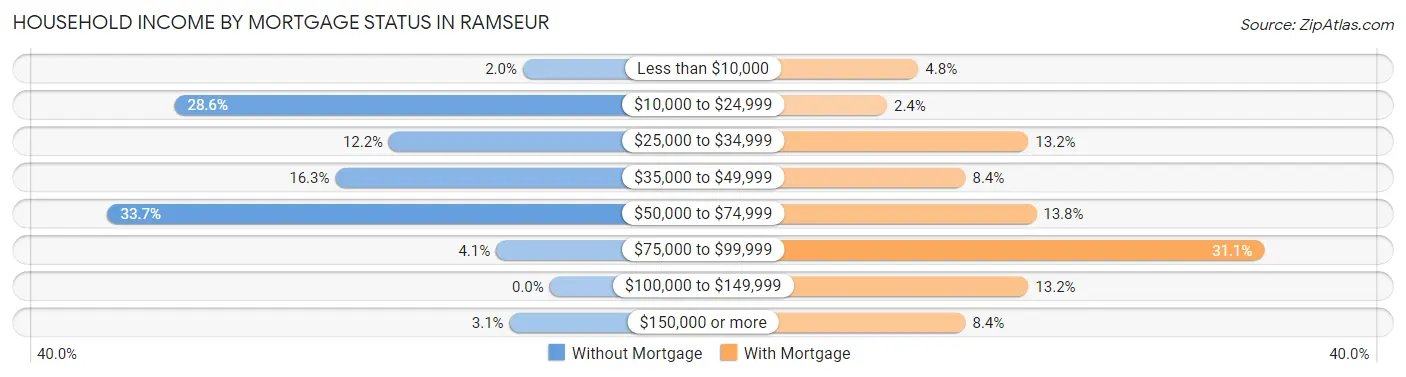
| Household Income | Without Mortgage | With Mortgage |
| Less than $10,000 | 2 (2.0%) | 8 (4.8%) |
| $10,000 to $24,999 | 28 (28.6%) | 4 (2.4%) |
| $25,000 to $34,999 | 12 (12.2%) | 22 (13.2%) |
| $35,000 to $49,999 | 16 (16.3%) | 14 (8.4%) |
| $50,000 to $74,999 | 33 (33.7%) | 23 (13.8%) |
| $75,000 to $99,999 | 4 (4.1%) | 52 (31.1%) |
| $100,000 to $149,999 | 0 (0.0%) | 22 (13.2%) |
| $150,000 or more | 3 (3.1%) | 14 (8.4%) |
| Total | 98 (100.0%) | 167 (100.0%) |
Property Value to Household Income Ratio in Ramseur
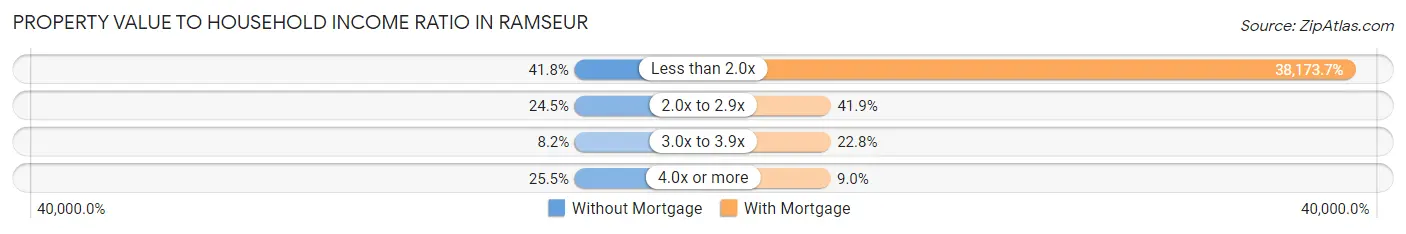
| Value-to-Income Ratio | Without Mortgage | With Mortgage |
| Less than 2.0x | 41 (41.8%) | 63,750 (38,173.6%) |
| 2.0x to 2.9x | 24 (24.5%) | 70 (41.9%) |
| 3.0x to 3.9x | 8 (8.2%) | 38 (22.8%) |
| 4.0x or more | 25 (25.5%) | 15 (9.0%) |
| Total | 98 (100.0%) | 167 (100.0%) |
Real Estate Taxes by Mortgage Status in Ramseur
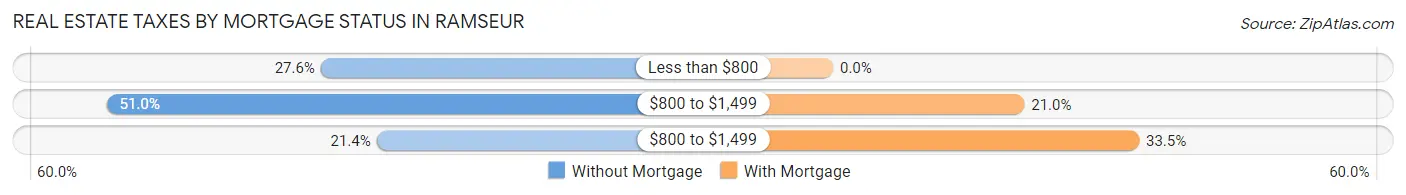
| Property Taxes | Without Mortgage | With Mortgage |
| Less than $800 | 27 (27.6%) | 0 (0.0%) |
| $800 to $1,499 | 50 (51.0%) | 35 (21.0%) |
| $800 to $1,499 | 21 (21.4%) | 56 (33.5%) |
| Total | 98 (100.0%) | 167 (100.0%) |
Health & Disability in Ramseur
Health Insurance Coverage by Age in Ramseur
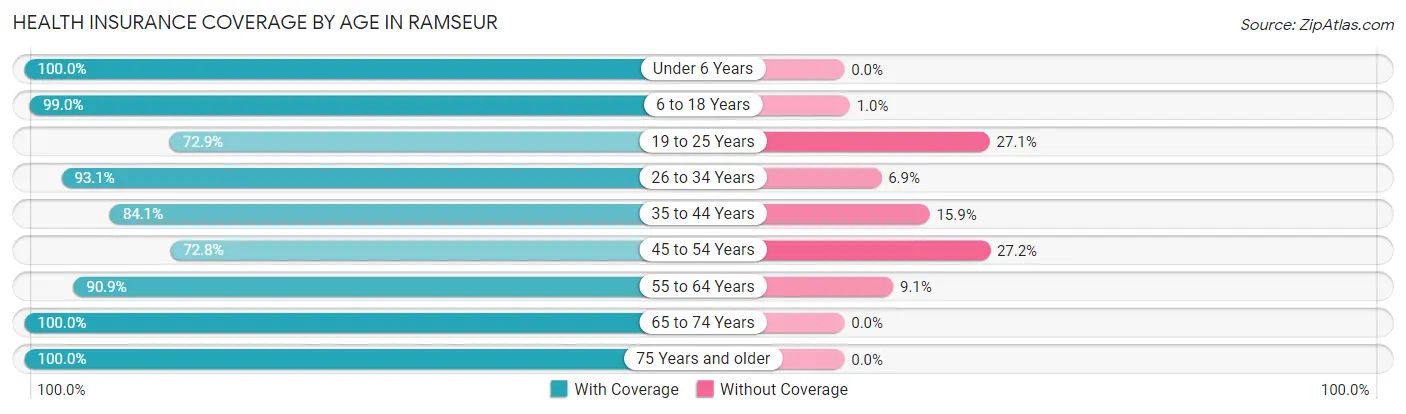
| Age Bracket | With Coverage | Without Coverage |
| Under 6 Years | 289 (100.0%) | 0 (0.0%) |
| 6 to 18 Years | 394 (99.0%) | 4 (1.0%) |
| 19 to 25 Years | 78 (72.9%) | 29 (27.1%) |
| 26 to 34 Years | 257 (93.1%) | 19 (6.9%) |
| 35 to 44 Years | 180 (84.1%) | 34 (15.9%) |
| 45 to 54 Years | 118 (72.8%) | 44 (27.2%) |
| 55 to 64 Years | 130 (90.9%) | 13 (9.1%) |
| 65 to 74 Years | 82 (100.0%) | 0 (0.0%) |
| 75 Years and older | 115 (100.0%) | 0 (0.0%) |
| Total | 1,643 (92.0%) | 143 (8.0%) |
Health Insurance Coverage by Citizenship Status in Ramseur
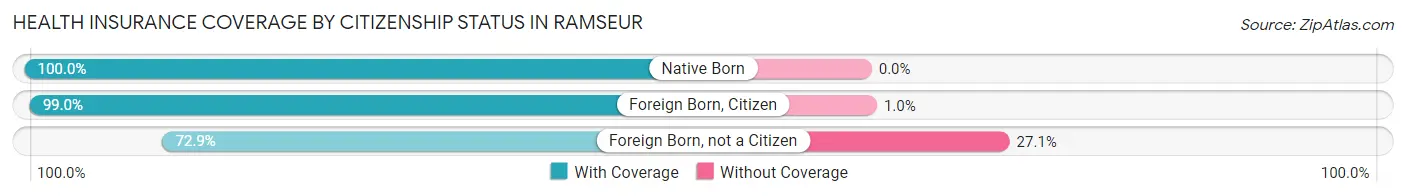
| Citizenship Status | With Coverage | Without Coverage |
| Native Born | 289 (100.0%) | 0 (0.0%) |
| Foreign Born, Citizen | 394 (99.0%) | 4 (1.0%) |
| Foreign Born, not a Citizen | 78 (72.9%) | 29 (27.1%) |
Health Insurance Coverage by Household Income in Ramseur
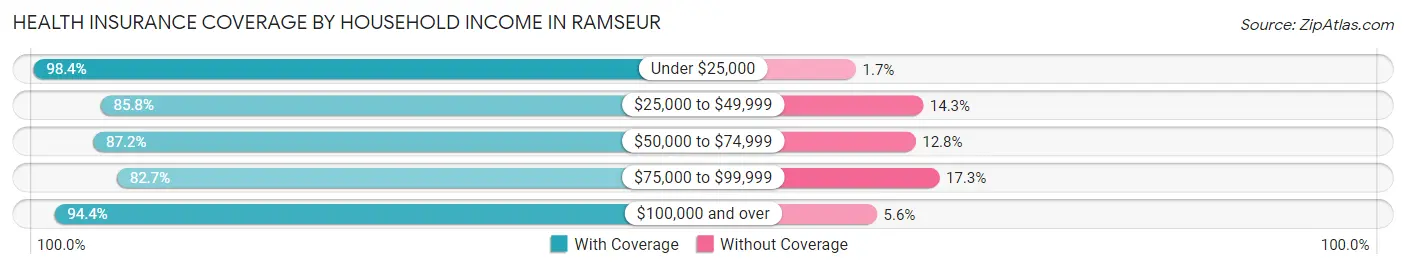
| Household Income | With Coverage | Without Coverage |
| Under $25,000 | 717 (98.4%) | 12 (1.7%) |
| $25,000 to $49,999 | 385 (85.8%) | 64 (14.2%) |
| $50,000 to $74,999 | 292 (87.2%) | 43 (12.8%) |
| $75,000 to $99,999 | 67 (82.7%) | 14 (17.3%) |
| $100,000 and over | 169 (94.4%) | 10 (5.6%) |
Public vs Private Health Insurance Coverage by Age in Ramseur
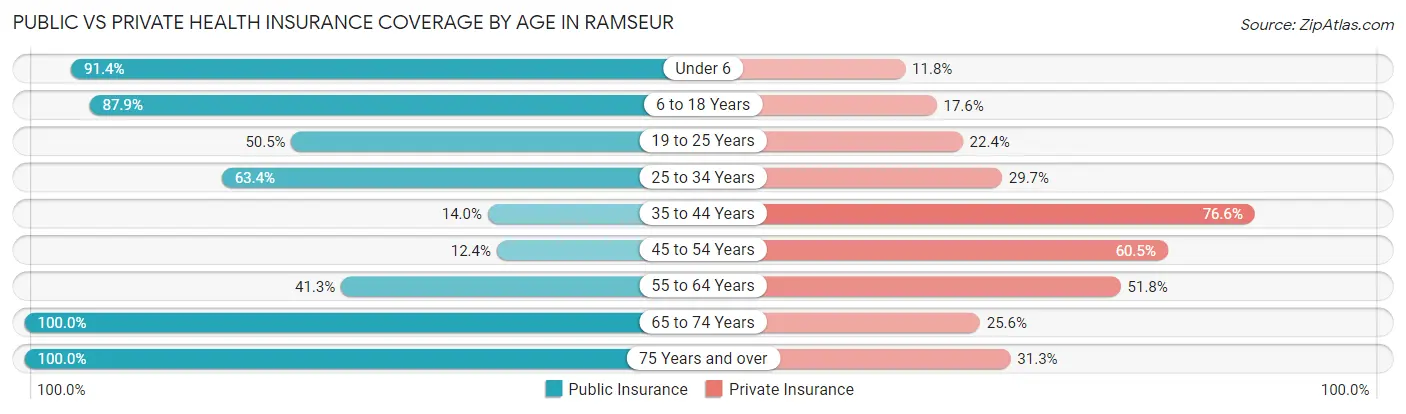
| Age Bracket | Public Insurance | Private Insurance |
| Under 6 | 264 (91.3%) | 34 (11.8%) |
| 6 to 18 Years | 350 (87.9%) | 70 (17.6%) |
| 19 to 25 Years | 54 (50.5%) | 24 (22.4%) |
| 25 to 34 Years | 175 (63.4%) | 82 (29.7%) |
| 35 to 44 Years | 30 (14.0%) | 164 (76.6%) |
| 45 to 54 Years | 20 (12.3%) | 98 (60.5%) |
| 55 to 64 Years | 59 (41.3%) | 74 (51.7%) |
| 65 to 74 Years | 82 (100.0%) | 21 (25.6%) |
| 75 Years and over | 115 (100.0%) | 36 (31.3%) |
| Total | 1,149 (64.3%) | 603 (33.8%) |
Disability Status by Sex by Age in Ramseur
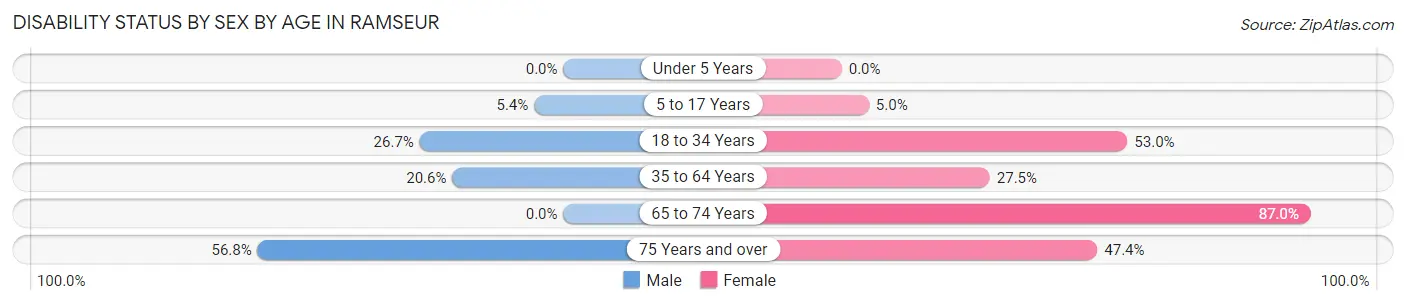
| Age Bracket | Male | Female |
| Under 5 Years | 0 (0.0%) | 0 (0.0%) |
| 5 to 17 Years | 11 (5.4%) | 10 (5.0%) |
| 18 to 34 Years | 36 (26.7%) | 141 (53.0%) |
| 35 to 64 Years | 53 (20.6%) | 72 (27.5%) |
| 65 to 74 Years | 0 (0.0%) | 47 (87.0%) |
| 75 Years and over | 21 (56.8%) | 37 (47.4%) |
Disability Class by Sex by Age in Ramseur
Disability Class: Hearing Difficulty
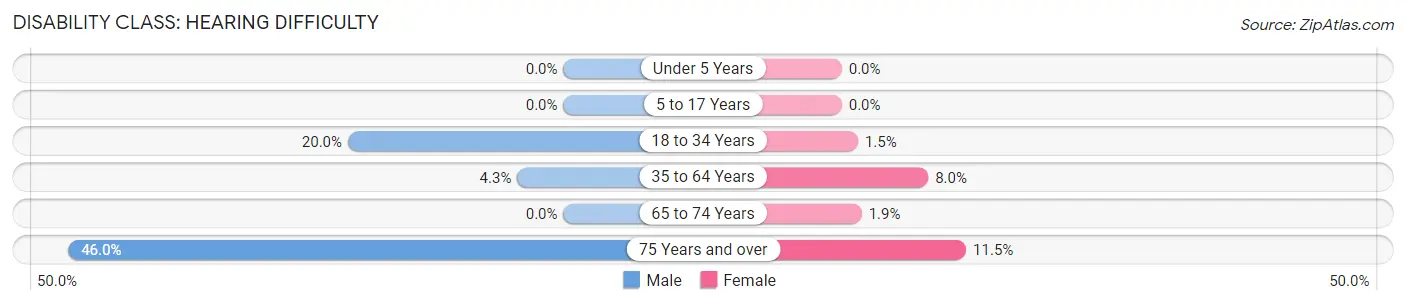
| Age Bracket | Male | Female |
| Under 5 Years | 0 (0.0%) | 0 (0.0%) |
| 5 to 17 Years | 0 (0.0%) | 0 (0.0%) |
| 18 to 34 Years | 27 (20.0%) | 4 (1.5%) |
| 35 to 64 Years | 11 (4.3%) | 21 (8.0%) |
| 65 to 74 Years | 0 (0.0%) | 1 (1.8%) |
| 75 Years and over | 17 (46.0%) | 9 (11.5%) |
Disability Class: Vision Difficulty
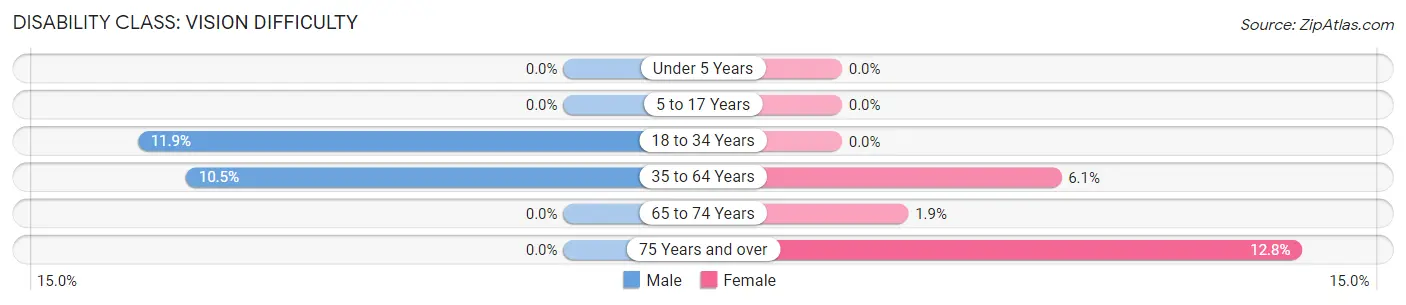
| Age Bracket | Male | Female |
| Under 5 Years | 0 (0.0%) | 0 (0.0%) |
| 5 to 17 Years | 0 (0.0%) | 0 (0.0%) |
| 18 to 34 Years | 16 (11.8%) | 0 (0.0%) |
| 35 to 64 Years | 27 (10.5%) | 16 (6.1%) |
| 65 to 74 Years | 0 (0.0%) | 1 (1.8%) |
| 75 Years and over | 0 (0.0%) | 10 (12.8%) |
Disability Class: Cognitive Difficulty
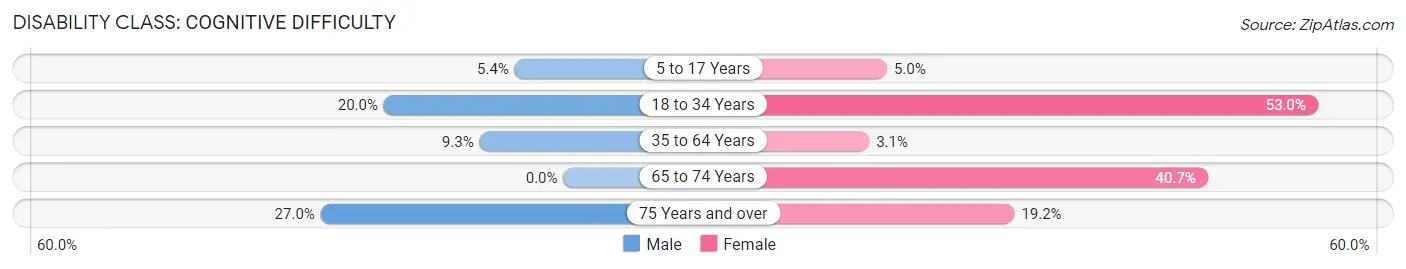
| Age Bracket | Male | Female |
| 5 to 17 Years | 11 (5.4%) | 10 (5.0%) |
| 18 to 34 Years | 27 (20.0%) | 141 (53.0%) |
| 35 to 64 Years | 24 (9.3%) | 8 (3.0%) |
| 65 to 74 Years | 0 (0.0%) | 22 (40.7%) |
| 75 Years and over | 10 (27.0%) | 15 (19.2%) |
Disability Class: Ambulatory Difficulty
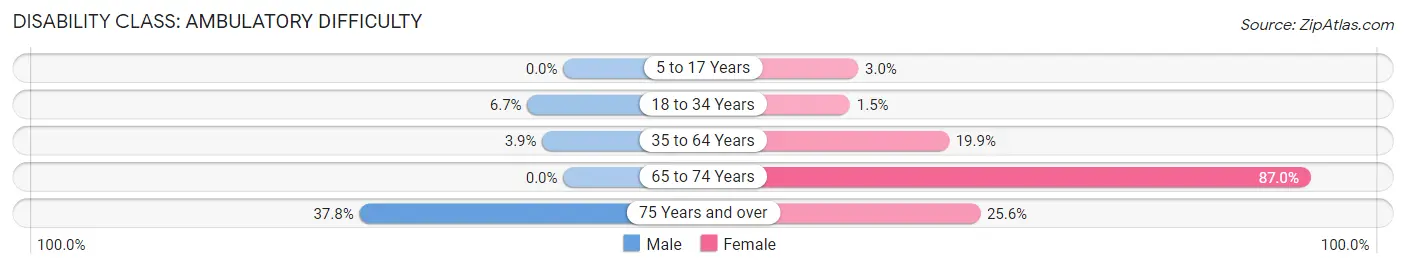
| Age Bracket | Male | Female |
| 5 to 17 Years | 0 (0.0%) | 6 (3.0%) |
| 18 to 34 Years | 9 (6.7%) | 4 (1.5%) |
| 35 to 64 Years | 10 (3.9%) | 52 (19.9%) |
| 65 to 74 Years | 0 (0.0%) | 47 (87.0%) |
| 75 Years and over | 14 (37.8%) | 20 (25.6%) |
Disability Class: Self-Care Difficulty
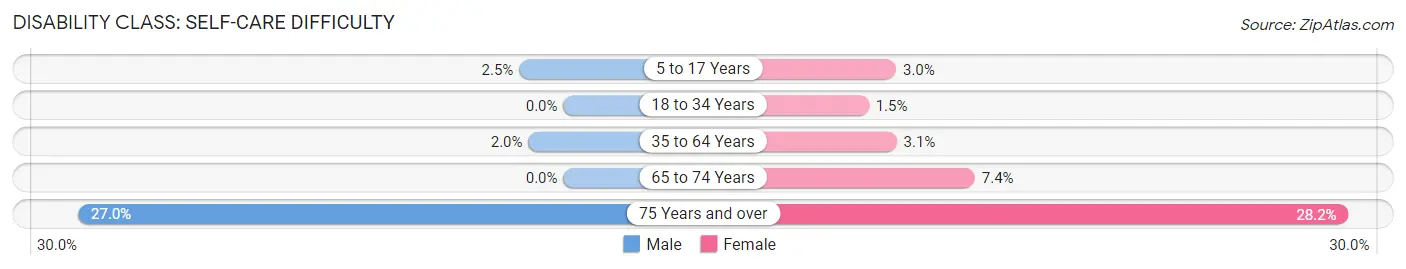
| Age Bracket | Male | Female |
| 5 to 17 Years | 5 (2.5%) | 6 (3.0%) |
| 18 to 34 Years | 0 (0.0%) | 4 (1.5%) |
| 35 to 64 Years | 5 (1.9%) | 8 (3.0%) |
| 65 to 74 Years | 0 (0.0%) | 4 (7.4%) |
| 75 Years and over | 10 (27.0%) | 22 (28.2%) |
Technology Access in Ramseur
Computing Device Access in Ramseur
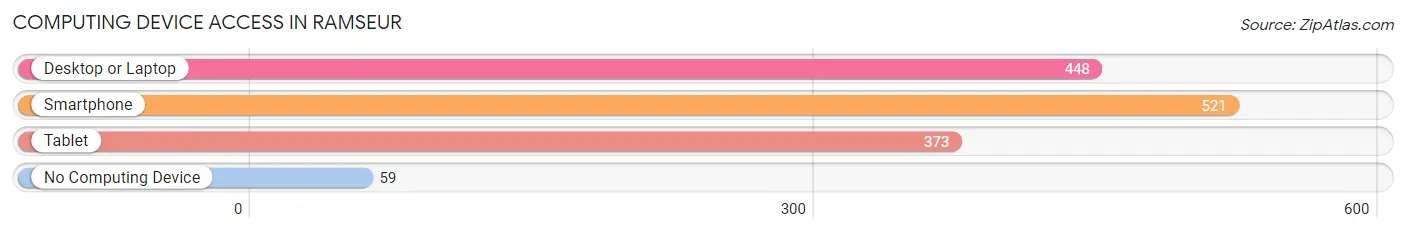
| Device Type | # Households | % Households |
| Desktop or Laptop | 448 | 70.8% |
| Smartphone | 521 | 82.3% |
| Tablet | 373 | 58.9% |
| No Computing Device | 59 | 9.3% |
| Total | 633 | 100.0% |
Internet Access in Ramseur
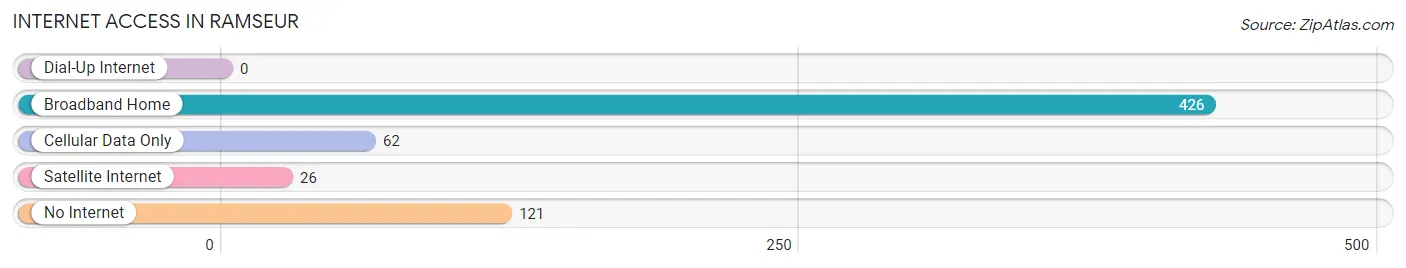
| Internet Type | # Households | % Households |
| Dial-Up Internet | 0 | 0.0% |
| Broadband Home | 426 | 67.3% |
| Cellular Data Only | 62 | 9.8% |
| Satellite Internet | 26 | 4.1% |
| No Internet | 121 | 19.1% |
| Total | 633 | 100.0% |
Ramseur Summary
Ramseur, North Carolina is a small town located in Randolph County, in the central part of the state. It is situated in the Uwharrie Mountains, and is part of the Piedmont Triad region. The town has a population of 1,845 people, according to the 2010 census.
History
Ramseur was founded in 1883 by the Ramseur family, who had moved to the area from Virginia. The town was named after the family, and was originally known as Ramseurville. The town was incorporated in 1887, and the first post office was established in 1888.
The town grew slowly, but steadily, and by the early 1900s, it had become a thriving community. The town was home to several businesses, including a cotton mill, a furniture factory, and a brickyard. The town also had a railroad station, which connected it to other towns in the area.
In the early 1900s, the town was home to a large African-American population, and several African-American churches were established in the area. The town also had a thriving African-American business district, which included several stores, restaurants, and other businesses.
Geography
Ramseur is located in the Uwharrie Mountains, in the central part of North Carolina. The town is situated in Randolph County, and is part of the Piedmont Triad region. The town is located about 25 miles south of Greensboro, and about 50 miles west of Raleigh.
The town is situated at an elevation of 845 feet above sea level, and is surrounded by rolling hills and forests. The town is located near the Uwharrie National Forest, which is a popular destination for outdoor activities such as camping, hiking, and fishing.
Economy
The economy of Ramseur is largely based on agriculture and manufacturing. The town is home to several farms, which produce a variety of crops, including corn, soybeans, and tobacco. The town is also home to several manufacturing companies, which produce a variety of products, including furniture, textiles, and automotive parts.
The town is also home to several small businesses, including restaurants, retail stores, and service providers. The town is also home to several churches, which provide a variety of services to the community.
Demographics
According to the 2010 census, the population of Ramseur was 1,845 people. The town has a median household income of $37,941, and a median age of 39.7 years. The town is predominantly white, with a population that is 88.3% white, 8.2% African-American, and 1.5% Hispanic or Latino.
The town is home to several churches, including Baptist, Methodist, and Presbyterian churches. The town is also home to several schools, including Ramseur Elementary School, Ramseur Middle School, and Ramseur High School.
Conclusion
Ramseur, North Carolina is a small town located in Randolph County, in the central part of the state. The town has a population of 1,845 people, according to the 2010 census. The town was founded in 1883 by the Ramseur family, and was originally known as Ramseurville. The town is situated in the Uwharrie Mountains, and is part of the Piedmont Triad region. The economy of Ramseur is largely based on agriculture and manufacturing, and the town is home to several small businesses, churches, and schools. The town is predominantly white, with a population that is 88.3% white, 8.2% African-American, and 1.5% Hispanic or Latino.
Common Questions
What is Per Capita Income in Ramseur?
Per Capita income in Ramseur is $15,965.
What is the Median Family Income in Ramseur?
Median Family Income in Ramseur is $32,800.
What is the Median Household income in Ramseur?
Median Household Income in Ramseur is $32,964.
What is Income or Wage Gap in Ramseur?
Income or Wage Gap in Ramseur is 29.6%.
Women in Ramseur earn 70.4 cents for every dollar earned by a man.
What is Family Income Deficit in Ramseur?
Family Income Deficit in Ramseur is $19,415.
Families that are below poverty line in Ramseur earn $19,415 less on average than the poverty threshold level.
What is Inequality or Gini Index in Ramseur?
Inequality or Gini Index in Ramseur is 0.45.
What is the Total Population of Ramseur?
Total Population of Ramseur is 1,877.
What is the Total Male Population of Ramseur?
Total Male Population of Ramseur is 782.
What is the Total Female Population of Ramseur?
Total Female Population of Ramseur is 1,095.
What is the Ratio of Males per 100 Females in Ramseur?
There are 71.42 Males per 100 Females in Ramseur.
What is the Ratio of Females per 100 Males in Ramseur?
There are 140.03 Females per 100 Males in Ramseur.
What is the Median Population Age in Ramseur?
Median Population Age in Ramseur is 30.5 Years.
What is the Average Family Size in Ramseur
Average Family Size in Ramseur is 3.4 People.
What is the Average Household Size in Ramseur
Average Household Size in Ramseur is 2.8 People.
How Large is the Labor Force in Ramseur?
There are 754 People in the Labor Forcein in Ramseur.
What is the Percentage of People in the Labor Force in Ramseur?
58.8% of People are in the Labor Force in Ramseur.
What is the Unemployment Rate in Ramseur?
Unemployment Rate in Ramseur is 2.7%.