Cleveland, NC Map & Demographics
Cleveland Map
Cleveland Overview
$26,817
PER CAPITA INCOME
$82,727
AVG FAMILY INCOME
$56,250
AVG HOUSEHOLD INCOME
38.5%
WAGE / INCOME GAP [ % ]
61.5¢/ $1
WAGE / INCOME GAP [ $ ]
0.42
INEQUALITY / GINI INDEX
1,244
TOTAL POPULATION
586
MALE POPULATION
658
FEMALE POPULATION
89.06
MALES / 100 FEMALES
112.29
FEMALES / 100 MALES
29.6
MEDIAN AGE
3.4
AVG FAMILY SIZE
2.8
AVG HOUSEHOLD SIZE
561
LABOR FORCE [ PEOPLE ]
63.1%
PERCENT IN LABOR FORCE
8.0%
UNEMPLOYMENT RATE
Cleveland Zip Codes
Income in Cleveland
Income Overview in Cleveland
Per Capita Income in Cleveland is $26,817, while median incomes of families and households are $82,727 and $56,250 respectively.
| Characteristic | Number | Measure |
| Per Capita Income | 1,244 | $26,817 |
| Median Family Income | 324 | $82,727 |
| Mean Family Income | 324 | $85,617 |
| Median Household Income | 444 | $56,250 |
| Mean Household Income | 444 | $73,089 |
| Income Deficit | 324 | $0 |
| Wage / Income Gap (%) | 1,244 | 38.46% |
| Wage / Income Gap ($) | 1,244 | 61.54¢ per $1 |
| Gini / Inequality Index | 1,244 | 0.42 |
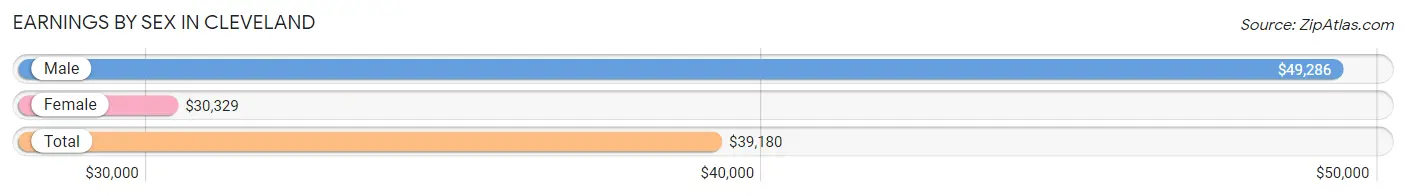
Earnings by Sex in Cleveland
Average Earnings in Cleveland are $39,180, $49,286 for men and $30,329 for women, a difference of 38.5%.
| Sex | Number | Average Earnings |
| Male | 266 (45.0%) | $49,286 |
| Female | 325 (55.0%) | $30,329 |
| Total | 591 (100.0%) | $39,180 |
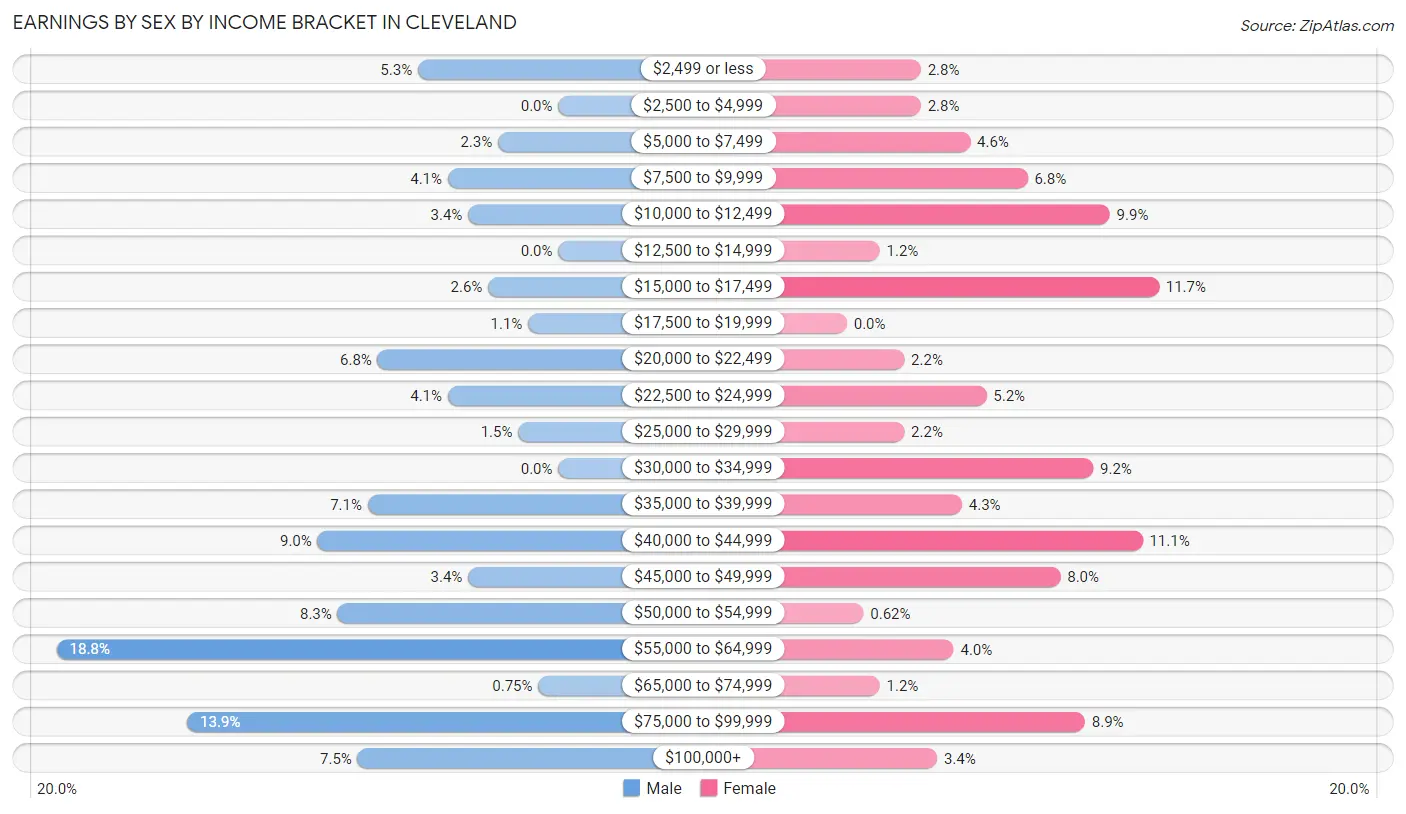
Earnings by Sex by Income Bracket in Cleveland
The most common earnings brackets in Cleveland are $55,000 to $64,999 for men (50 | 18.8%) and $15,000 to $17,499 for women (38 | 11.7%).
| Income | Male | Female |
| $2,499 or less | 14 (5.3%) | 9 (2.8%) |
| $2,500 to $4,999 | 0 (0.0%) | 9 (2.8%) |
| $5,000 to $7,499 | 6 (2.3%) | 15 (4.6%) |
| $7,500 to $9,999 | 11 (4.1%) | 22 (6.8%) |
| $10,000 to $12,499 | 9 (3.4%) | 32 (9.9%) |
| $12,500 to $14,999 | 0 (0.0%) | 4 (1.2%) |
| $15,000 to $17,499 | 7 (2.6%) | 38 (11.7%) |
| $17,500 to $19,999 | 3 (1.1%) | 0 (0.0%) |
| $20,000 to $22,499 | 18 (6.8%) | 7 (2.1%) |
| $22,500 to $24,999 | 11 (4.1%) | 17 (5.2%) |
| $25,000 to $29,999 | 4 (1.5%) | 7 (2.1%) |
| $30,000 to $34,999 | 0 (0.0%) | 30 (9.2%) |
| $35,000 to $39,999 | 19 (7.1%) | 14 (4.3%) |
| $40,000 to $44,999 | 24 (9.0%) | 36 (11.1%) |
| $45,000 to $49,999 | 9 (3.4%) | 26 (8.0%) |
| $50,000 to $54,999 | 22 (8.3%) | 2 (0.6%) |
| $55,000 to $64,999 | 50 (18.8%) | 13 (4.0%) |
| $65,000 to $74,999 | 2 (0.7%) | 4 (1.2%) |
| $75,000 to $99,999 | 37 (13.9%) | 29 (8.9%) |
| $100,000+ | 20 (7.5%) | 11 (3.4%) |
| Total | 266 (100.0%) | 325 (100.0%) |
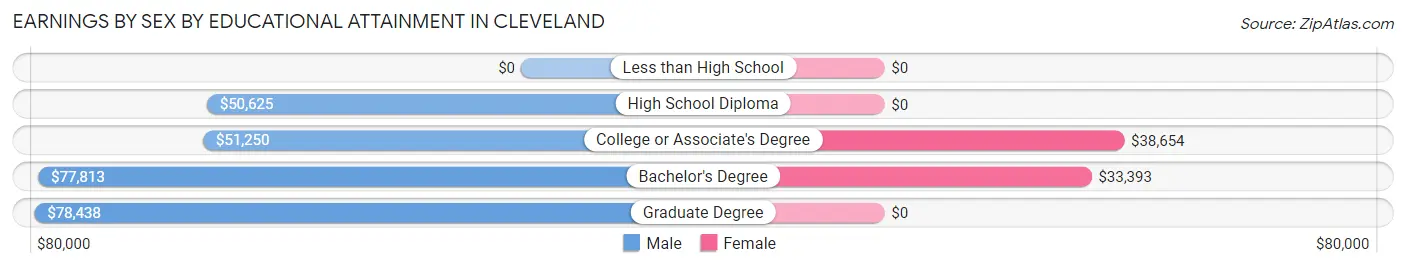
Earnings by Sex by Educational Attainment in Cleveland
Average earnings in Cleveland are $58,750 for men and $31,316 for women, a difference of 46.7%. Men with an educational attainment of graduate degree enjoy the highest average annual earnings of $78,438, while those with high school diploma education earn the least with $50,625. Women with an educational attainment of college or associate's degree earn the most with the average annual earnings of $38,654, while those with bachelor's degree education have the smallest earnings of $33,393.
| Educational Attainment | Male Income | Female Income |
| Less than High School | - | - |
| High School Diploma | $50,625 | $0 |
| College or Associate's Degree | $51,250 | $38,654 |
| Bachelor's Degree | $77,813 | $33,393 |
| Graduate Degree | $78,438 | $0 |
| Total | $58,750 | $31,316 |
Family Income in Cleveland
Family Income Brackets in Cleveland
According to the Cleveland family income data, there are 77 families falling into the $100,000 to $149,999 income range, which is the most common income bracket and makes up 23.8% of all families. Conversely, the $25,000 to $34,999 income bracket is the least frequent group with only 7 families (2.2%) belonging to this category.
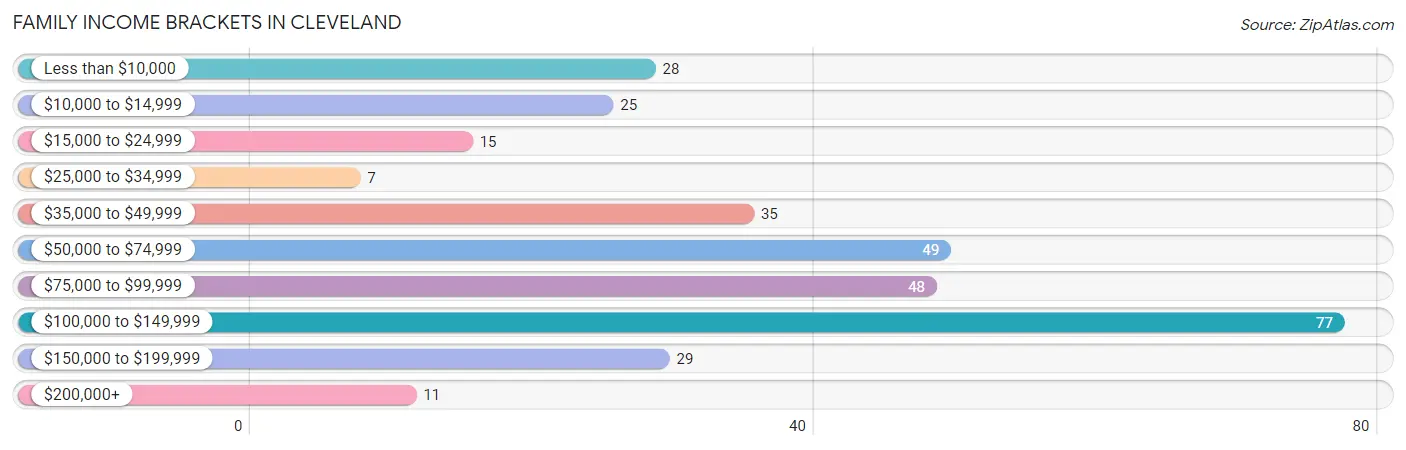
| Income Bracket | # Families | % Families |
| Less than $10,000 | 28 | 8.6% |
| $10,000 to $14,999 | 25 | 7.7% |
| $15,000 to $24,999 | 15 | 4.6% |
| $25,000 to $34,999 | 7 | 2.2% |
| $35,000 to $49,999 | 35 | 10.8% |
| $50,000 to $74,999 | 49 | 15.1% |
| $75,000 to $99,999 | 48 | 14.8% |
| $100,000 to $149,999 | 77 | 23.8% |
| $150,000 to $199,999 | 29 | 9.0% |
| $200,000+ | 11 | 3.4% |
Family Income by Famaliy Size in Cleveland
4-person families (69 | 21.3%) account for the highest median family income in Cleveland with $140,694 per family, while 2-person families (126 | 38.9%) have the highest median income of $36,562 per family member.
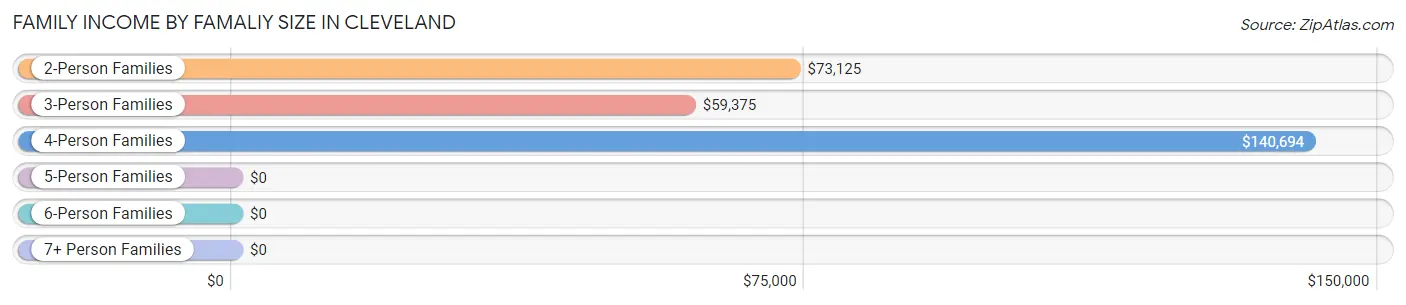
| Income Bracket | # Families | Median Income |
| 2-Person Families | 126 (38.9%) | $73,125 |
| 3-Person Families | 80 (24.7%) | $59,375 |
| 4-Person Families | 69 (21.3%) | $140,694 |
| 5-Person Families | 17 (5.2%) | $0 |
| 6-Person Families | 24 (7.4%) | $0 |
| 7+ Person Families | 8 (2.5%) | $0 |
| Total | 324 (100.0%) | $82,727 |
Family Income by Number of Earners in Cleveland
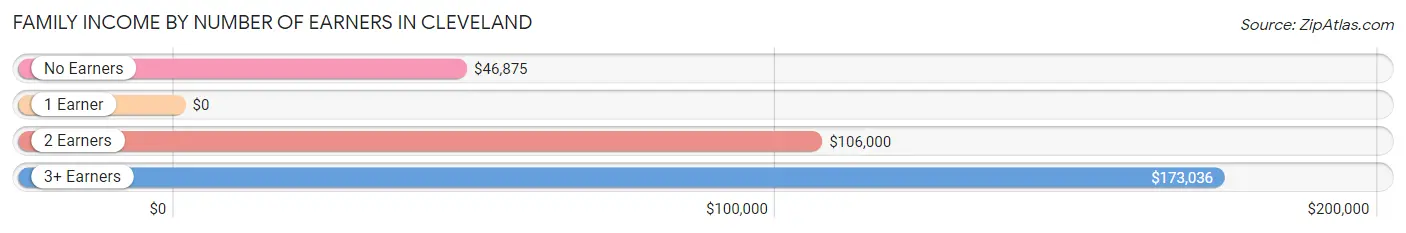
| Number of Earners | # Families | Median Income |
| No Earners | 28 (8.6%) | $46,875 |
| 1 Earner | 127 (39.2%) | $0 |
| 2 Earners | 118 (36.4%) | $106,000 |
| 3+ Earners | 51 (15.7%) | $173,036 |
| Total | 324 (100.0%) | $82,727 |
Household Income in Cleveland
Household Income Brackets in Cleveland
With 96 households falling in the category, the $35,000 to $49,999 income range is the most frequent in Cleveland, accounting for 21.6% of all households. In contrast, only 10 households (2.2%) fall into the $25,000 to $34,999 income bracket, making it the least populous group.
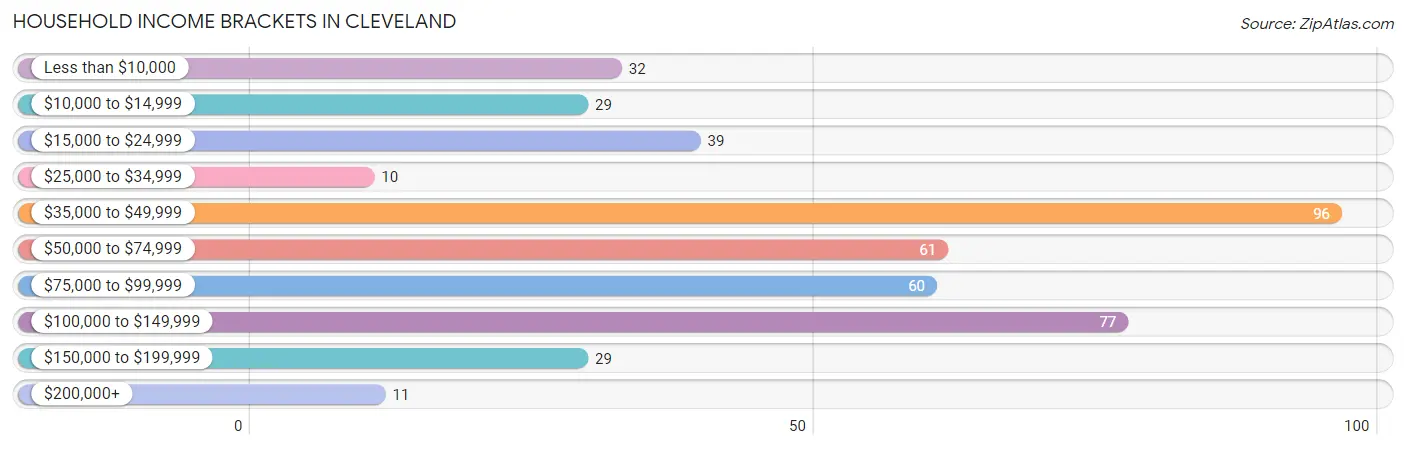
| Income Bracket | # Households | % Households |
| Less than $10,000 | 32 | 7.2% |
| $10,000 to $14,999 | 29 | 6.5% |
| $15,000 to $24,999 | 39 | 8.8% |
| $25,000 to $34,999 | 10 | 2.3% |
| $35,000 to $49,999 | 96 | 21.6% |
| $50,000 to $74,999 | 61 | 13.7% |
| $75,000 to $99,999 | 60 | 13.5% |
| $100,000 to $149,999 | 77 | 17.3% |
| $150,000 to $199,999 | 29 | 6.5% |
| $200,000+ | 11 | 2.5% |
Household Income by Householder Age in Cleveland
The median household income in Cleveland is $56,250, with the highest median household income of $85,500 found in the 25 to 44 years age bracket for the primary householder. A total of 168 households (37.8%) fall into this category. Meanwhile, the 15 to 24 years age bracket for the primary householder has the lowest median household income of $0, with 17 households (3.8%) in this group.
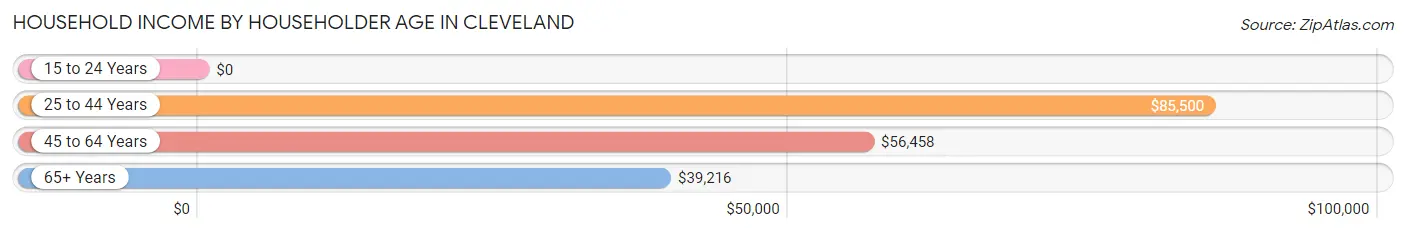
| Income Bracket | # Households | Median Income |
| 15 to 24 Years | 17 (3.8%) | $0 |
| 25 to 44 Years | 168 (37.8%) | $85,500 |
| 45 to 64 Years | 133 (29.9%) | $56,458 |
| 65+ Years | 126 (28.4%) | $39,216 |
| Total | 444 (100.0%) | $56,250 |
Poverty in Cleveland
Income Below Poverty by Sex and Age in Cleveland
With 20.5% poverty level for males and 17.4% for females among the residents of Cleveland, 16 and 17 year old males and under 5 year old females are the most vulnerable to poverty, with 24 males (82.8%) and 22 females (33.9%) in their respective age groups living below the poverty level.
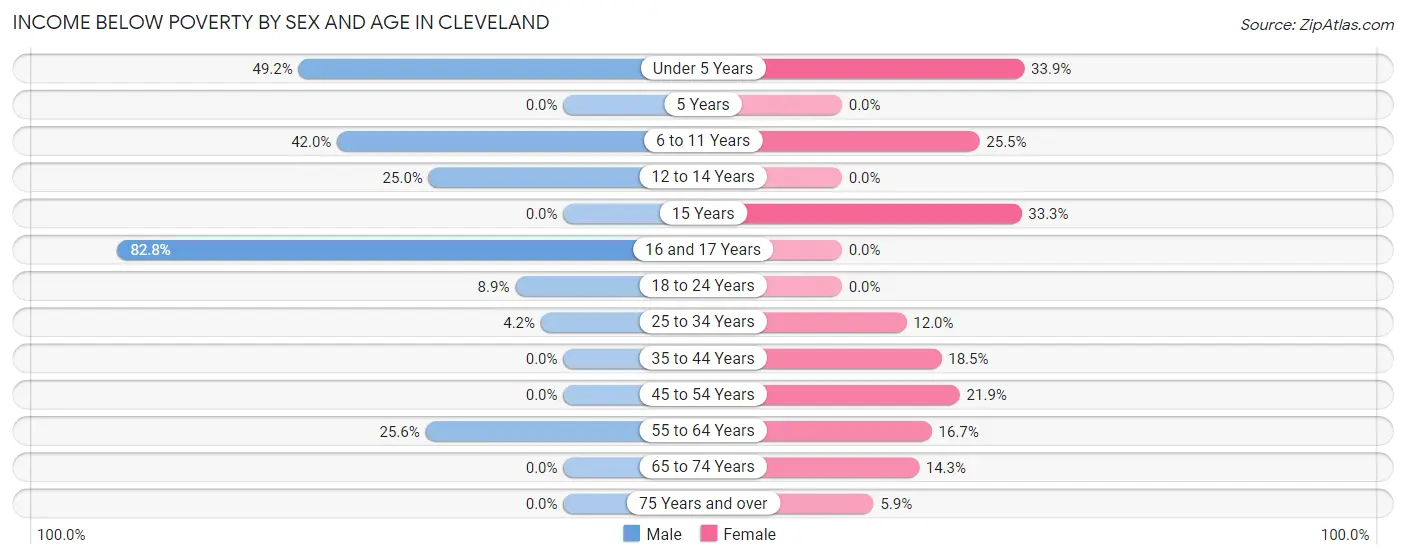
| Age Bracket | Male | Female |
| Under 5 Years | 29 (49.1%) | 22 (33.9%) |
| 5 Years | 0 (0.0%) | 0 (0.0%) |
| 6 to 11 Years | 34 (42.0%) | 12 (25.5%) |
| 12 to 14 Years | 13 (25.0%) | 0 (0.0%) |
| 15 Years | 0 (0.0%) | 9 (33.3%) |
| 16 and 17 Years | 24 (82.8%) | 0 (0.0%) |
| 18 to 24 Years | 5 (8.9%) | 0 (0.0%) |
| 25 to 34 Years | 4 (4.2%) | 20 (12.0%) |
| 35 to 44 Years | 0 (0.0%) | 12 (18.5%) |
| 45 to 54 Years | 0 (0.0%) | 21 (21.9%) |
| 55 to 64 Years | 11 (25.6%) | 10 (16.7%) |
| 65 to 74 Years | 0 (0.0%) | 4 (14.3%) |
| 75 Years and over | 0 (0.0%) | 4 (5.9%) |
| Total | 120 (20.5%) | 114 (17.4%) |
Income Above Poverty by Sex and Age in Cleveland
According to the poverty statistics in Cleveland, males aged 5 years and females aged 5 years are the age groups that are most secure financially, with 100.0% of males and 100.0% of females in these age groups living above the poverty line.
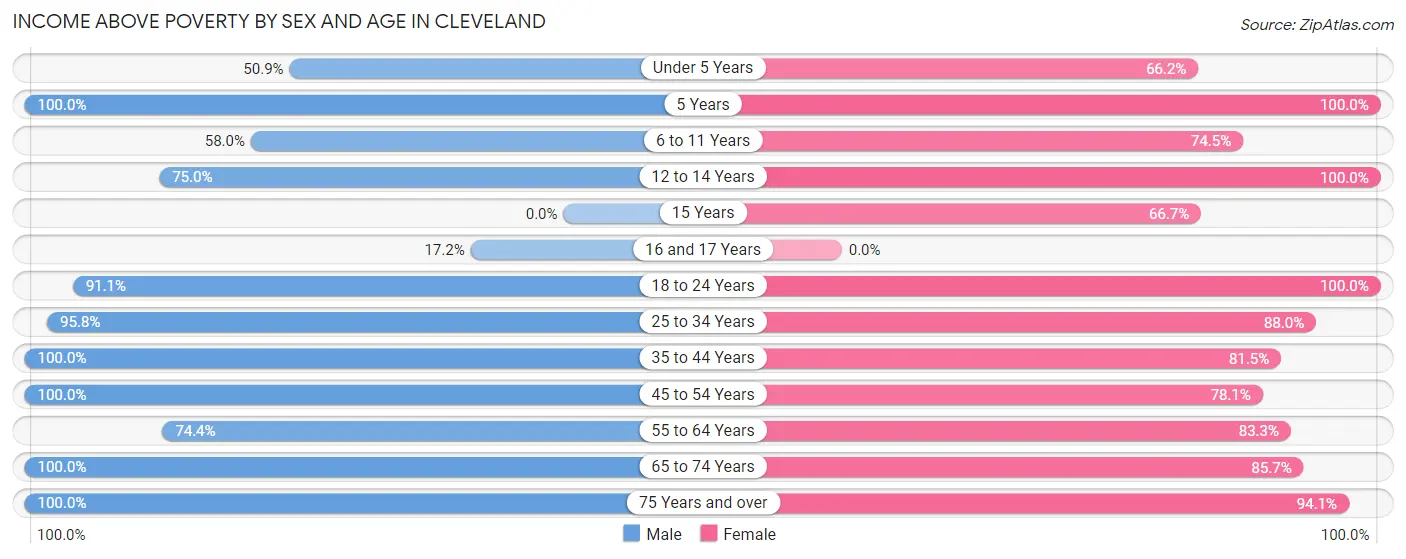
| Age Bracket | Male | Female |
| Under 5 Years | 30 (50.8%) | 43 (66.1%) |
| 5 Years | 6 (100.0%) | 7 (100.0%) |
| 6 to 11 Years | 47 (58.0%) | 35 (74.5%) |
| 12 to 14 Years | 39 (75.0%) | 9 (100.0%) |
| 15 Years | 0 (0.0%) | 18 (66.7%) |
| 16 and 17 Years | 5 (17.2%) | 0 (0.0%) |
| 18 to 24 Years | 51 (91.1%) | 17 (100.0%) |
| 25 to 34 Years | 92 (95.8%) | 147 (88.0%) |
| 35 to 44 Years | 58 (100.0%) | 53 (81.5%) |
| 45 to 54 Years | 45 (100.0%) | 75 (78.1%) |
| 55 to 64 Years | 32 (74.4%) | 50 (83.3%) |
| 65 to 74 Years | 54 (100.0%) | 24 (85.7%) |
| 75 Years and over | 7 (100.0%) | 64 (94.1%) |
| Total | 466 (79.5%) | 542 (82.6%) |
Income Below Poverty Among Married-Couple Families in Cleveland
The poverty statistics for married-couple families in Cleveland show that 5.1% or 10 of the total 198 families live below the poverty line. Families with 3 or 4 children have the highest poverty rate of 28.6%, comprising of 10 families. On the other hand, families with no children have the lowest poverty rate of 0.0%, which includes 0 families.
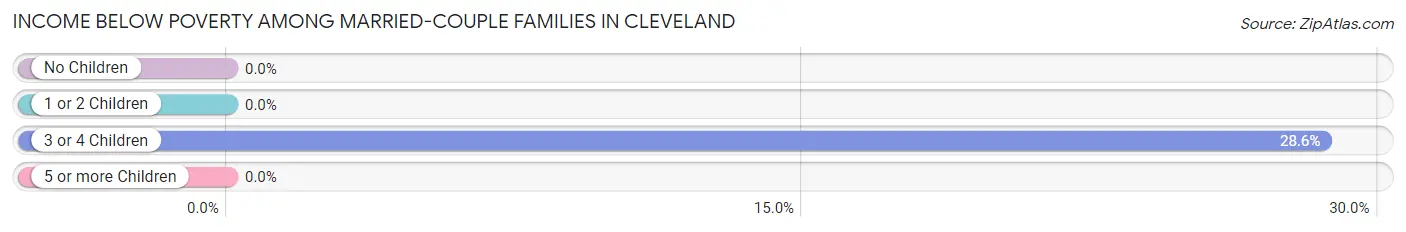
| Children | Above Poverty | Below Poverty |
| No Children | 96 (100.0%) | 0 (0.0%) |
| 1 or 2 Children | 59 (100.0%) | 0 (0.0%) |
| 3 or 4 Children | 25 (71.4%) | 10 (28.6%) |
| 5 or more Children | 8 (100.0%) | 0 (0.0%) |
| Total | 188 (95.0%) | 10 (5.1%) |
Income Below Poverty Among Single-Parent Households in Cleveland
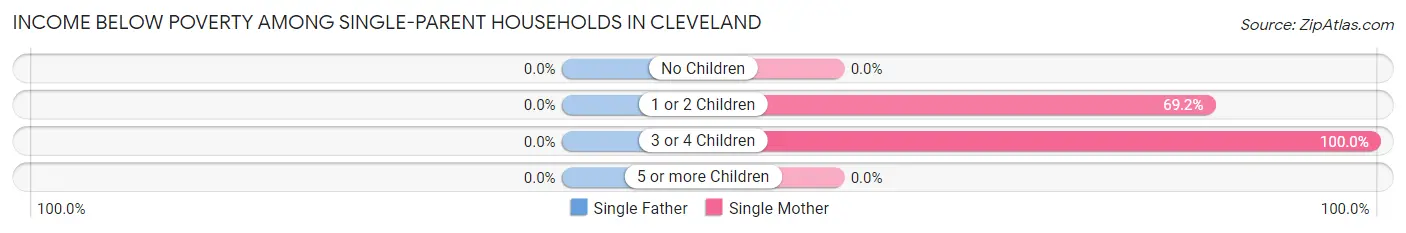
| Children | Single Father | Single Mother |
| No Children | 0 (0.0%) | 0 (0.0%) |
| 1 or 2 Children | 0 (0.0%) | 45 (69.2%) |
| 3 or 4 Children | 0 (0.0%) | 8 (100.0%) |
| 5 or more Children | 0 (0.0%) | 0 (0.0%) |
| Total | 0 (0.0%) | 53 (45.7%) |
Income Below Poverty Among Married-Couple vs Single-Parent Households in Cleveland
The poverty data for Cleveland shows that 10 of the married-couple family households (5.1%) and 53 of the single-parent households (42.1%) are living below the poverty level. Within the married-couple family households, those with 3 or 4 children have the highest poverty rate, with 10 households (28.6%) falling below the poverty line. Among the single-parent households, those with 3 or 4 children have the highest poverty rate, with 8 household (100.0%) living below poverty.
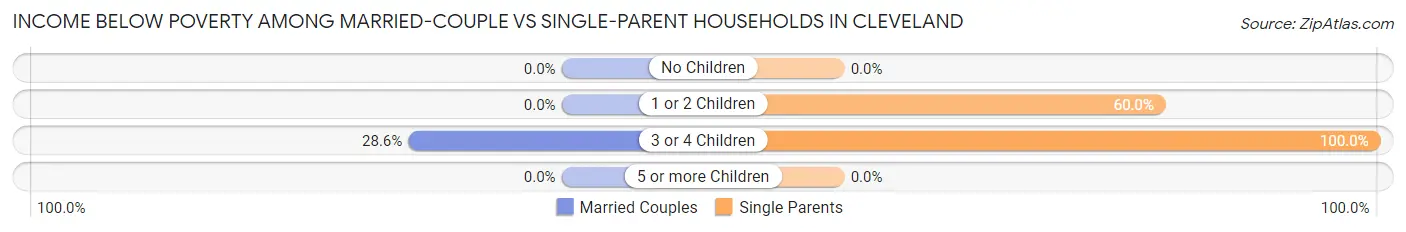
| Children | Married-Couple Families | Single-Parent Households |
| No Children | 0 (0.0%) | 0 (0.0%) |
| 1 or 2 Children | 0 (0.0%) | 45 (60.0%) |
| 3 or 4 Children | 10 (28.6%) | 8 (100.0%) |
| 5 or more Children | 0 (0.0%) | 0 (0.0%) |
| Total | 10 (5.1%) | 53 (42.1%) |
Race in Cleveland
The most populous races in Cleveland are White / Caucasian (792 | 63.7%), Black / African American (373 | 30.0%), and Hispanic or Latino (138 | 11.1%).
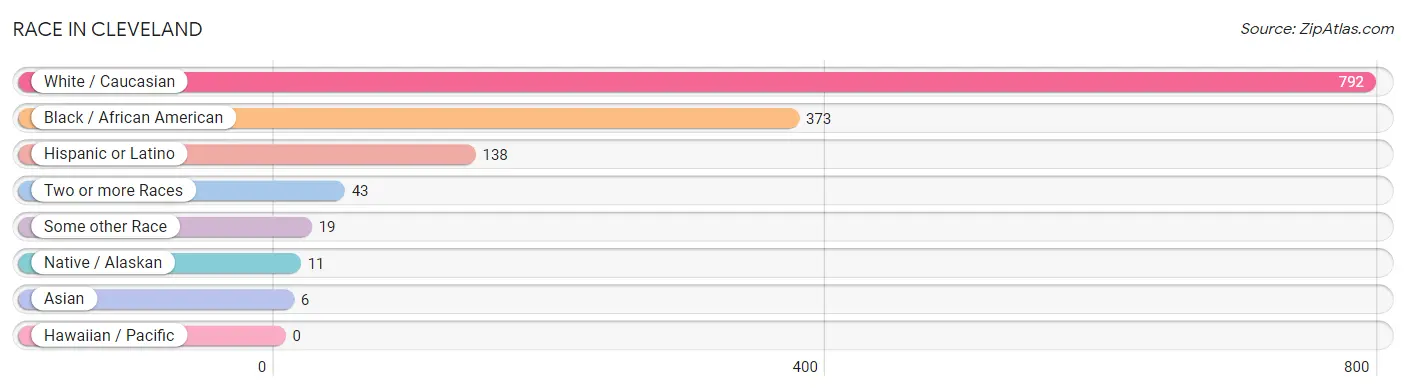
| Race | # Population | % Population |
| Asian | 6 | 0.5% |
| Black / African American | 373 | 30.0% |
| Hawaiian / Pacific | 0 | 0.0% |
| Hispanic or Latino | 138 | 11.1% |
| Native / Alaskan | 11 | 0.9% |
| White / Caucasian | 792 | 63.7% |
| Two or more Races | 43 | 3.5% |
| Some other Race | 19 | 1.5% |
| Total | 1,244 | 100.0% |
Ancestry in Cleveland
The most populous ancestries reported in Cleveland are American (170 | 13.7%), German (152 | 12.2%), Mexican (120 | 9.7%), English (116 | 9.3%), and Irish (105 | 8.4%), together accounting for 53.3% of all Cleveland residents.
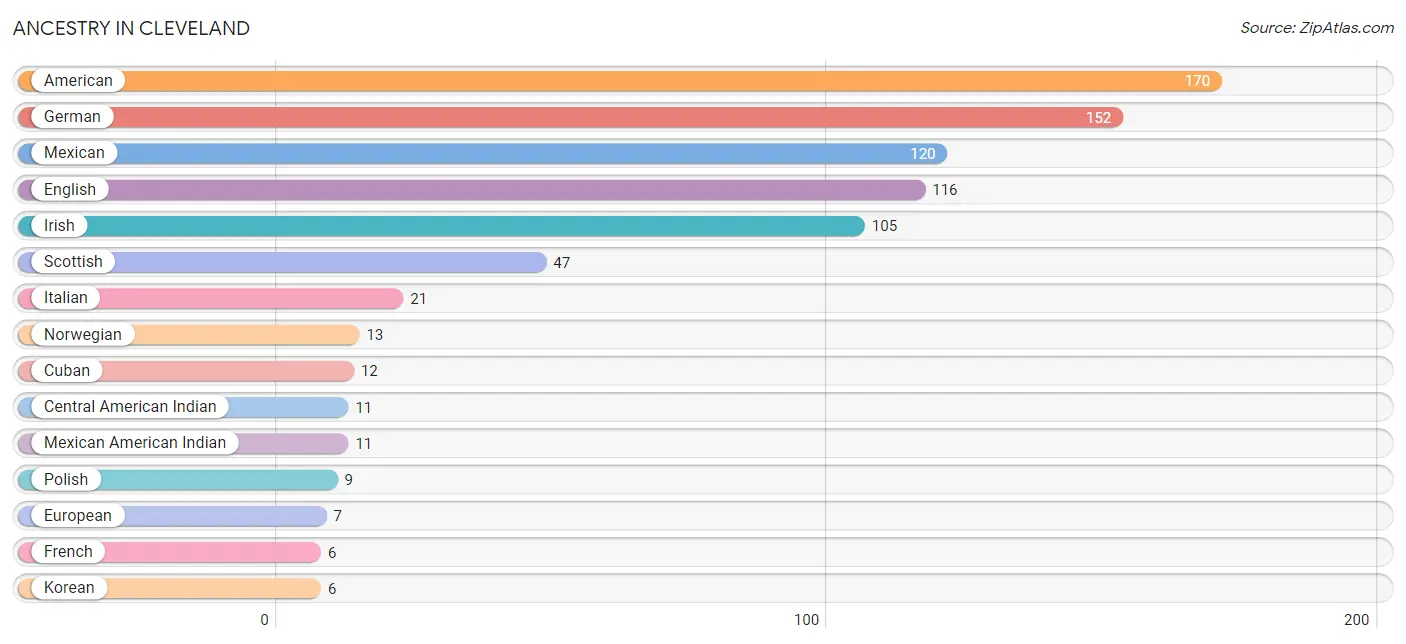
| Ancestry | # Population | % Population |
| American | 170 | 13.7% |
| Central American Indian | 11 | 0.9% |
| Cuban | 12 | 1.0% |
| Danish | 3 | 0.2% |
| English | 116 | 9.3% |
| European | 7 | 0.6% |
| French | 6 | 0.5% |
| German | 152 | 12.2% |
| Irish | 105 | 8.4% |
| Italian | 21 | 1.7% |
| Korean | 6 | 0.5% |
| Mexican | 120 | 9.7% |
| Mexican American Indian | 11 | 0.9% |
| Norwegian | 13 | 1.1% |
| Polish | 9 | 0.7% |
| Puerto Rican | 4 | 0.3% |
| Scandinavian | 1 | 0.1% |
| Scotch-Irish | 1 | 0.1% |
| Scottish | 47 | 3.8% |
| Thai | 5 | 0.4% |
| Welsh | 1 | 0.1% | View All 21 Rows |
Immigrants in Cleveland
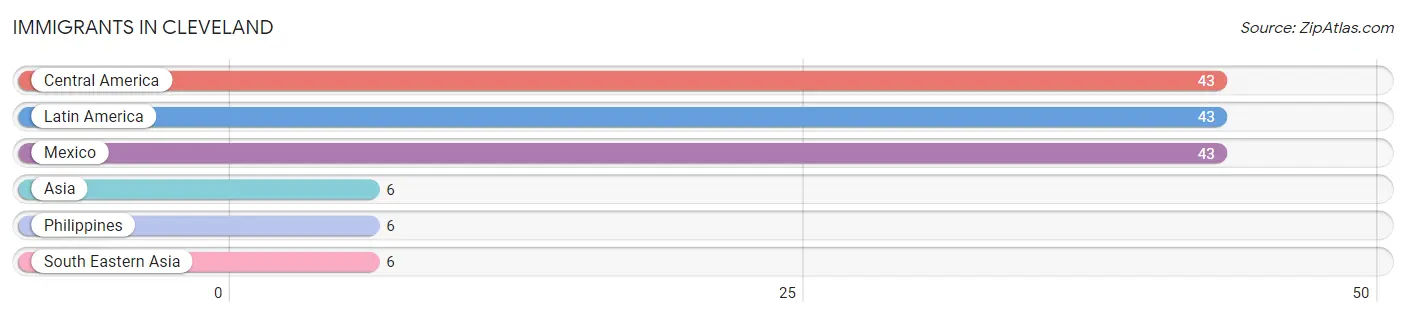
The most numerous immigrant groups reported in Cleveland came from Central America (43 | 3.5%), Latin America (43 | 3.5%), Mexico (43 | 3.5%), Asia (6 | 0.5%), and Philippines (6 | 0.5%), together accounting for 11.3% of all Cleveland residents.
| Immigration Origin | # Population | % Population |
| Asia | 6 | 0.5% |
| Central America | 43 | 3.5% |
| Latin America | 43 | 3.5% |
| Mexico | 43 | 3.5% |
| Philippines | 6 | 0.5% |
| South Eastern Asia | 6 | 0.5% | View All 6 Rows |
Sex and Age in Cleveland
Sex and Age in Cleveland
The most populous age groups in Cleveland are 10 to 14 Years (97 | 16.6%) for men and 25 to 29 Years (122 | 18.5%) for women.
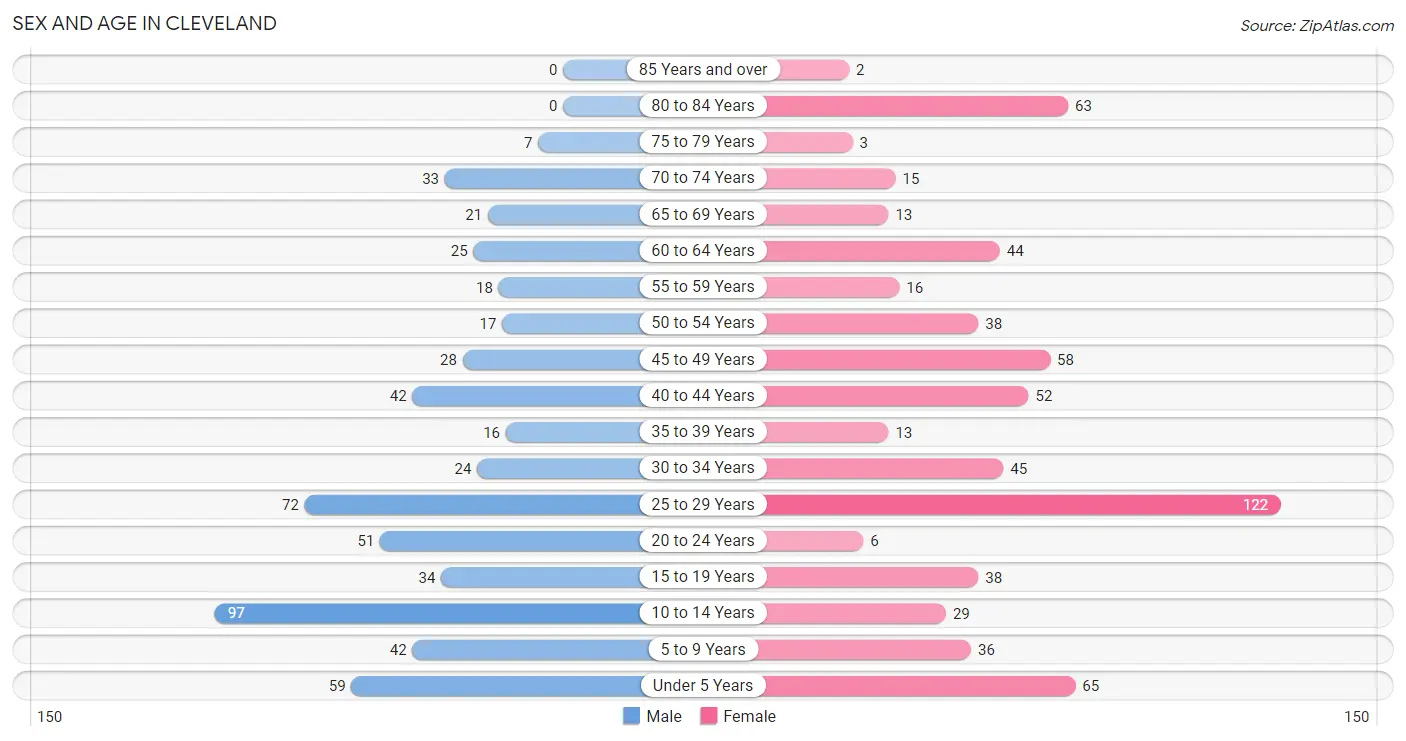
| Age Bracket | Male | Female |
| Under 5 Years | 59 (10.1%) | 65 (9.9%) |
| 5 to 9 Years | 42 (7.2%) | 36 (5.5%) |
| 10 to 14 Years | 97 (16.6%) | 29 (4.4%) |
| 15 to 19 Years | 34 (5.8%) | 38 (5.8%) |
| 20 to 24 Years | 51 (8.7%) | 6 (0.9%) |
| 25 to 29 Years | 72 (12.3%) | 122 (18.5%) |
| 30 to 34 Years | 24 (4.1%) | 45 (6.8%) |
| 35 to 39 Years | 16 (2.7%) | 13 (2.0%) |
| 40 to 44 Years | 42 (7.2%) | 52 (7.9%) |
| 45 to 49 Years | 28 (4.8%) | 58 (8.8%) |
| 50 to 54 Years | 17 (2.9%) | 38 (5.8%) |
| 55 to 59 Years | 18 (3.1%) | 16 (2.4%) |
| 60 to 64 Years | 25 (4.3%) | 44 (6.7%) |
| 65 to 69 Years | 21 (3.6%) | 13 (2.0%) |
| 70 to 74 Years | 33 (5.6%) | 15 (2.3%) |
| 75 to 79 Years | 7 (1.2%) | 3 (0.5%) |
| 80 to 84 Years | 0 (0.0%) | 63 (9.6%) |
| 85 Years and over | 0 (0.0%) | 2 (0.3%) |
| Total | 586 (100.0%) | 658 (100.0%) |
Families and Households in Cleveland
Median Family Size in Cleveland
The median family size in Cleveland is 3.43 persons per family, with single male/father families (10 | 3.1%) accounting for the largest median family size of 3.7 persons per family. On the other hand, single female/mother families (116 | 35.8%) represent the smallest median family size with 3.28 persons per family.
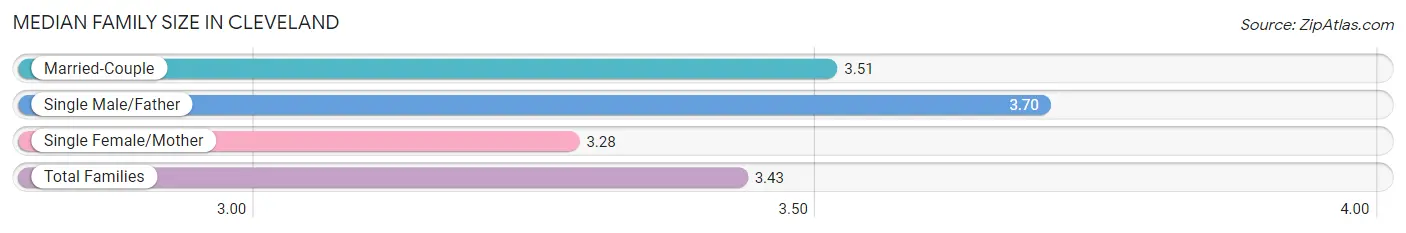
| Family Type | # Families | Family Size |
| Married-Couple | 198 (61.1%) | 3.51 |
| Single Male/Father | 10 (3.1%) | 3.70 |
| Single Female/Mother | 116 (35.8%) | 3.28 |
| Total Families | 324 (100.0%) | 3.43 |
Median Household Size in Cleveland
The median household size in Cleveland is 2.80 persons per household, with single male/father households (10 | 2.2%) accounting for the largest median household size of 3.7 persons per household. non-family households (120 | 27.0%) represent the smallest median household size with 1.09 persons per household.
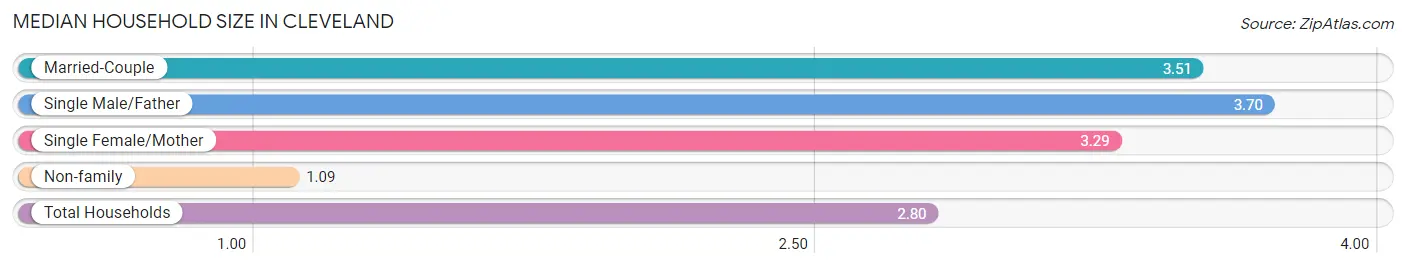
| Household Type | # Households | Household Size |
| Married-Couple | 198 (44.6%) | 3.51 |
| Single Male/Father | 10 (2.2%) | 3.70 |
| Single Female/Mother | 116 (26.1%) | 3.29 |
| Non-family | 120 (27.0%) | 1.09 |
| Total Households | 444 (100.0%) | 2.80 |
Household Size by Marriage Status in Cleveland
Out of a total of 444 households in Cleveland, 324 (73.0%) are family households, while 120 (27.0%) are nonfamily households. The most numerous type of family households are 2-person households, comprising 126, and the most common type of nonfamily households are 1-person households, comprising 112.
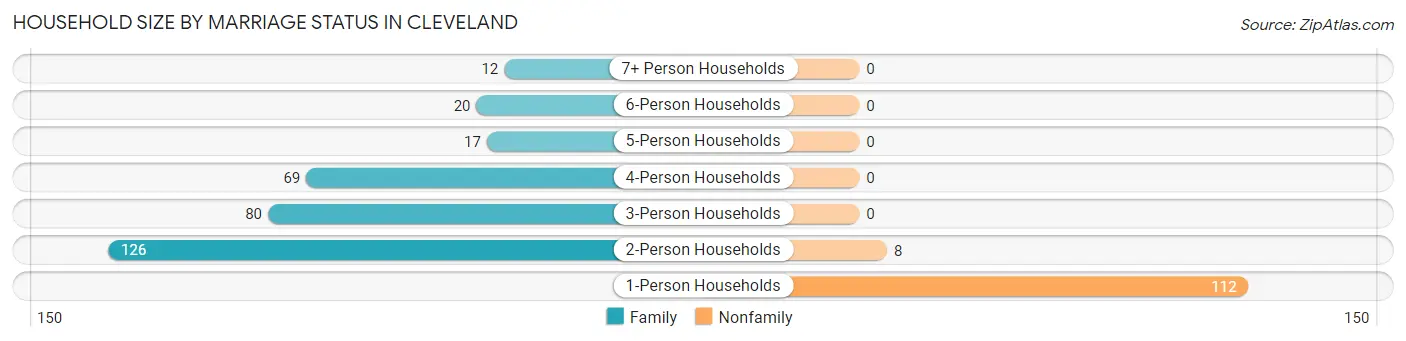
| Household Size | Family Households | Nonfamily Households |
| 1-Person Households | - | 112 (25.2%) |
| 2-Person Households | 126 (28.4%) | 8 (1.8%) |
| 3-Person Households | 80 (18.0%) | 0 (0.0%) |
| 4-Person Households | 69 (15.5%) | 0 (0.0%) |
| 5-Person Households | 17 (3.8%) | 0 (0.0%) |
| 6-Person Households | 20 (4.5%) | 0 (0.0%) |
| 7+ Person Households | 12 (2.7%) | 0 (0.0%) |
| Total | 324 (73.0%) | 120 (27.0%) |
Female Fertility in Cleveland
Fertility by Age in Cleveland
Average fertility rate in Cleveland is 42.0 births per 1,000 women. Women in the age bracket of 35 to 50 years have the highest fertility rate with 64.0 births per 1,000 women. Women in the age bracket of 35 to 50 years acount for 57.1% of all women with births.
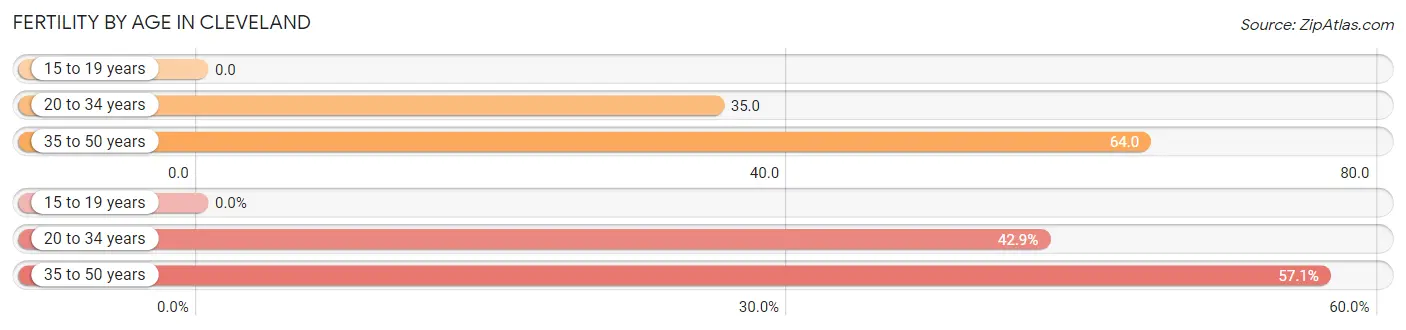
| Age Bracket | Women with Births | Births / 1,000 Women |
| 15 to 19 years | 0 (0.0%) | 0.0 |
| 20 to 34 years | 6 (42.9%) | 35.0 |
| 35 to 50 years | 8 (57.1%) | 64.0 |
| Total | 14 (100.0%) | 42.0 |
Fertility by Age by Marriage Status in Cleveland
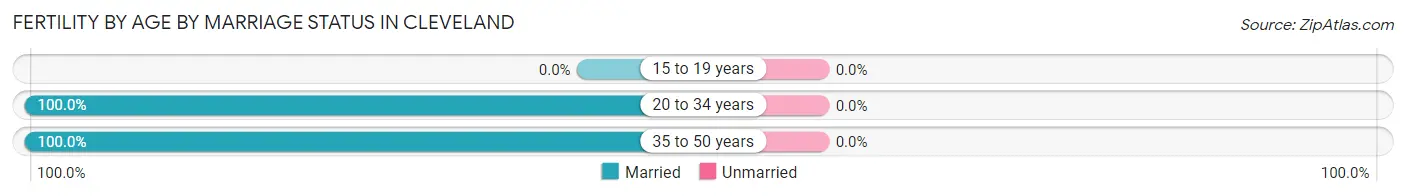
| Age Bracket | Married | Unmarried |
| 15 to 19 years | 0 (0.0%) | 0 (0.0%) |
| 20 to 34 years | 6 (100.0%) | 0 (0.0%) |
| 35 to 50 years | 8 (100.0%) | 0 (0.0%) |
| Total | 14 (100.0%) | 0 (0.0%) |
Fertility by Education in Cleveland
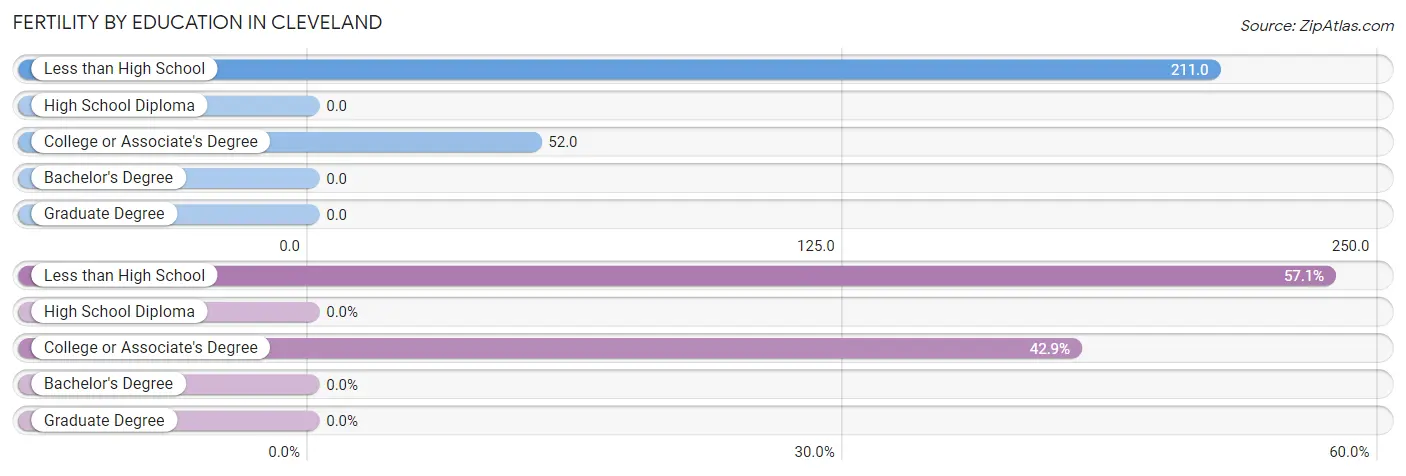
| Educational Attainment | Women with Births | Births / 1,000 Women |
| Less than High School | 8 (57.1%) | 211.0 |
| High School Diploma | 0 (0.0%) | 0.0 |
| College or Associate's Degree | 6 (42.9%) | 52.0 |
| Bachelor's Degree | 0 (0.0%) | 0.0 |
| Graduate Degree | 0 (0.0%) | 0.0 |
| Total | 14 (100.0%) | 42.0 |
Fertility by Education by Marriage Status in Cleveland
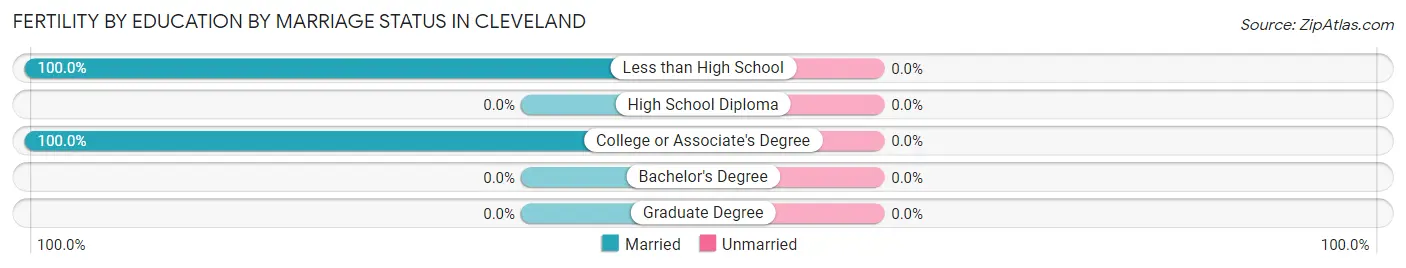
| Educational Attainment | Married | Unmarried |
| Less than High School | 8 (100.0%) | 0 (0.0%) |
| High School Diploma | 0 (0.0%) | 0 (0.0%) |
| College or Associate's Degree | 6 (100.0%) | 0 (0.0%) |
| Bachelor's Degree | 0 (0.0%) | 0 (0.0%) |
| Graduate Degree | 0 (0.0%) | 0 (0.0%) |
| Total | 14 (100.0%) | 0 (0.0%) |
Employment Characteristics in Cleveland
Employment by Class of Employer in Cleveland
Among the 505 employed individuals in Cleveland, private company employees (382 | 75.6%), not-for-profit organizations (44 | 8.7%), and local government employees (21 | 4.2%) make up the most common classes of employment.
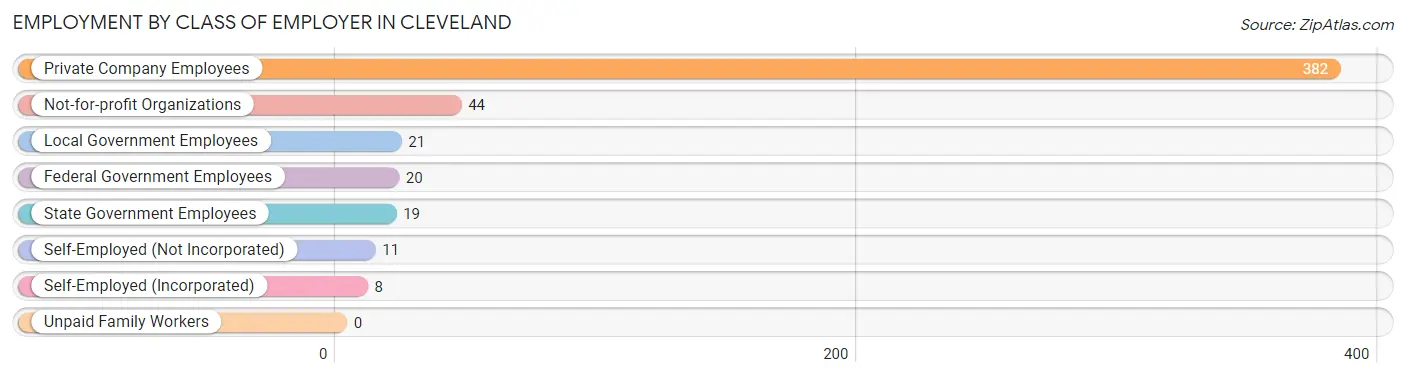
| Employer Class | # Employees | % Employees |
| Private Company Employees | 382 | 75.6% |
| Self-Employed (Incorporated) | 8 | 1.6% |
| Self-Employed (Not Incorporated) | 11 | 2.2% |
| Not-for-profit Organizations | 44 | 8.7% |
| Local Government Employees | 21 | 4.2% |
| State Government Employees | 19 | 3.8% |
| Federal Government Employees | 20 | 4.0% |
| Unpaid Family Workers | 0 | 0.0% |
| Total | 505 | 100.0% |
Employment Status by Age in Cleveland
According to the labor force statistics for Cleveland, out of the total population over 16 years of age (889), 63.1% or 561 individuals are in the labor force, with 8.0% or 45 of them unemployed. The age group with the highest labor force participation rate is 20 to 24 years, with 91.2% or 52 individuals in the labor force. Within the labor force, the 20 to 24 years age range has the highest percentage of unemployed individuals, with 28.8% or 15 of them being unemployed.
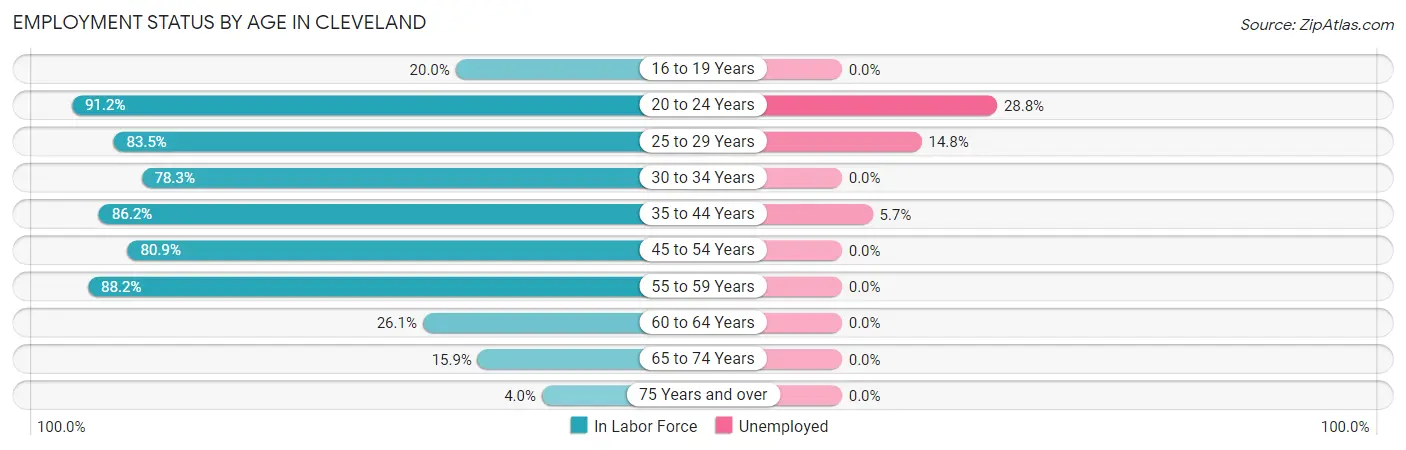
| Age Bracket | In Labor Force | Unemployed |
| 16 to 19 Years | 9 (20.0%) | 0 (0.0%) |
| 20 to 24 Years | 52 (91.2%) | 15 (28.8%) |
| 25 to 29 Years | 162 (83.5%) | 24 (14.8%) |
| 30 to 34 Years | 54 (78.3%) | 0 (0.0%) |
| 35 to 44 Years | 106 (86.2%) | 6 (5.7%) |
| 45 to 54 Years | 114 (80.9%) | 0 (0.0%) |
| 55 to 59 Years | 30 (88.2%) | 0 (0.0%) |
| 60 to 64 Years | 18 (26.1%) | 0 (0.0%) |
| 65 to 74 Years | 13 (15.9%) | 0 (0.0%) |
| 75 Years and over | 3 (4.0%) | 0 (0.0%) |
| Total | 561 (63.1%) | 45 (8.0%) |
Employment Status by Educational Attainment in Cleveland
According to labor force statistics for Cleveland, 76.8% of individuals (484) out of the total population between 25 and 64 years of age (630) are in the labor force, with 6.2% or 30 of them being unemployed. The group with the highest labor force participation rate are those with the educational attainment of bachelor's degree or higher, with 93.6% or 176 individuals in the labor force. Within the labor force, individuals with college / associate degree education have the highest percentage of unemployment, with 11.6% or 20 of them being unemployed.
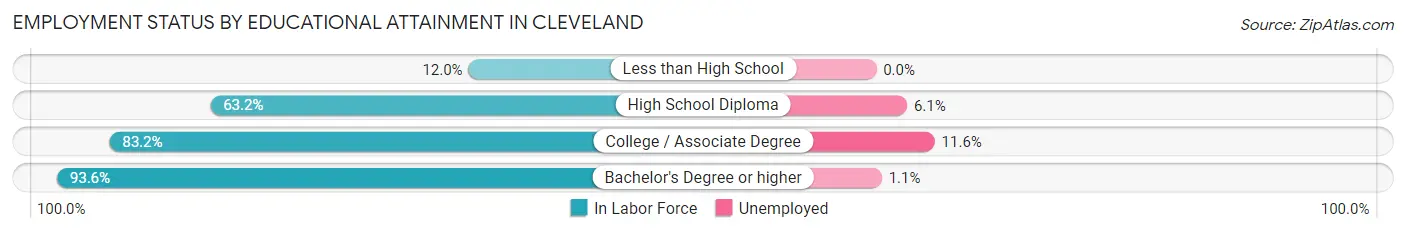
| Educational Attainment | In Labor Force | Unemployed |
| Less than High School | 3 (12.0%) | 0 (0.0%) |
| High School Diploma | 132 (63.2%) | 13 (6.1%) |
| College / Associate Degree | 173 (83.2%) | 24 (11.6%) |
| Bachelor's Degree or higher | 176 (93.6%) | 2 (1.1%) |
| Total | 484 (76.8%) | 39 (6.2%) |
Employment Occupations by Sex in Cleveland
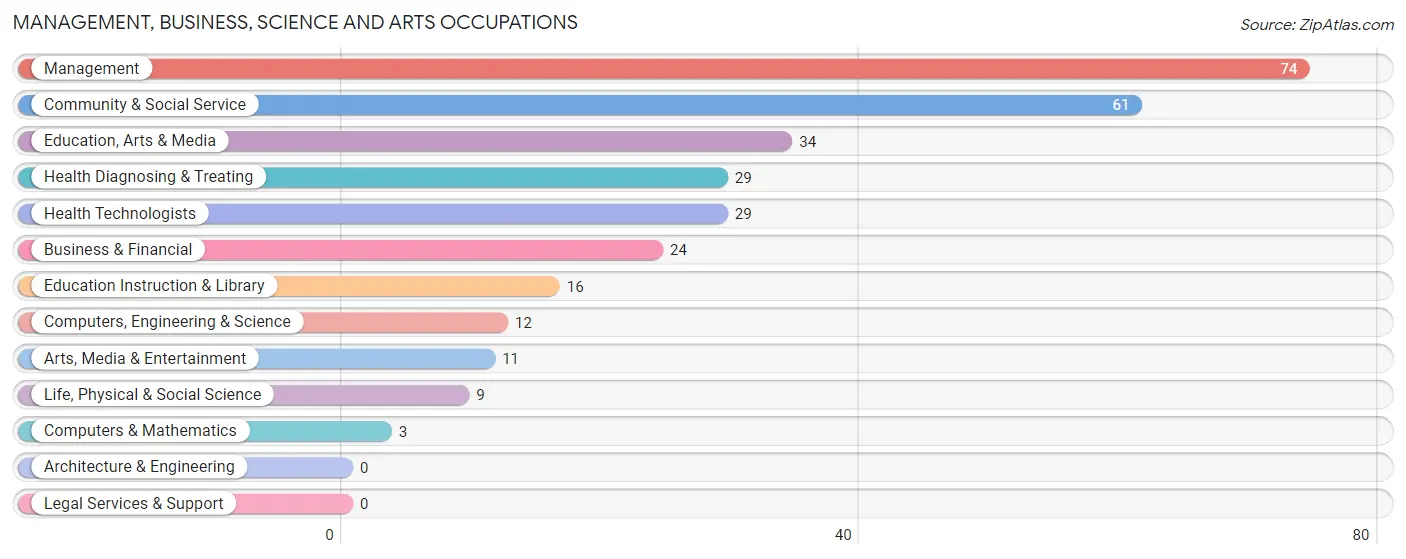
Management, Business, Science and Arts Occupations
The most common Management, Business, Science and Arts occupations in Cleveland are Management (74 | 14.3%), Community & Social Service (61 | 11.8%), Education, Arts & Media (34 | 6.6%), Health Diagnosing & Treating (29 | 5.6%), and Health Technologists (29 | 5.6%).
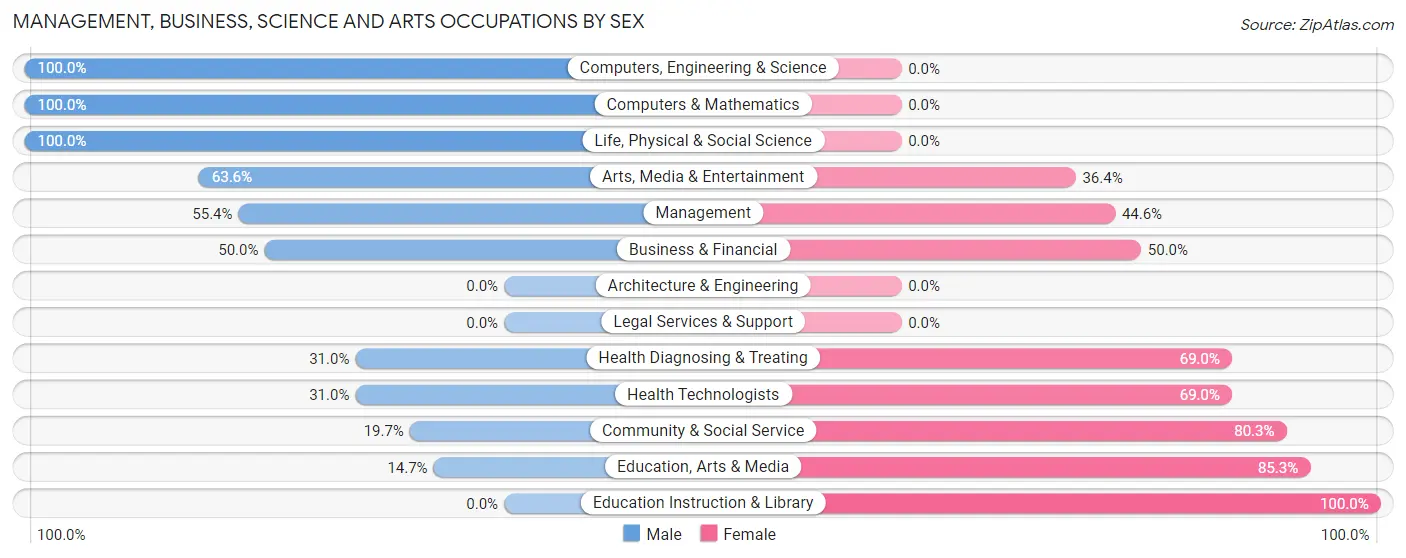
Management, Business, Science and Arts Occupations by Sex
Within the Management, Business, Science and Arts occupations in Cleveland, the most male-oriented occupations are Computers, Engineering & Science (100.0%), Computers & Mathematics (100.0%), and Life, Physical & Social Science (100.0%), while the most female-oriented occupations are Education Instruction & Library (100.0%), Education, Arts & Media (85.3%), and Community & Social Service (80.3%).
| Occupation | Male | Female |
| Management | 41 (55.4%) | 33 (44.6%) |
| Business & Financial | 12 (50.0%) | 12 (50.0%) |
| Computers, Engineering & Science | 12 (100.0%) | 0 (0.0%) |
| Computers & Mathematics | 3 (100.0%) | 0 (0.0%) |
| Architecture & Engineering | 0 (0.0%) | 0 (0.0%) |
| Life, Physical & Social Science | 9 (100.0%) | 0 (0.0%) |
| Community & Social Service | 12 (19.7%) | 49 (80.3%) |
| Education, Arts & Media | 5 (14.7%) | 29 (85.3%) |
| Legal Services & Support | 0 (0.0%) | 0 (0.0%) |
| Education Instruction & Library | 0 (0.0%) | 16 (100.0%) |
| Arts, Media & Entertainment | 7 (63.6%) | 4 (36.4%) |
| Health Diagnosing & Treating | 9 (31.0%) | 20 (69.0%) |
| Health Technologists | 9 (31.0%) | 20 (69.0%) |
| Total (Category) | 86 (43.0%) | 114 (57.0%) |
| Total (Overall) | 242 (46.9%) | 274 (53.1%) |
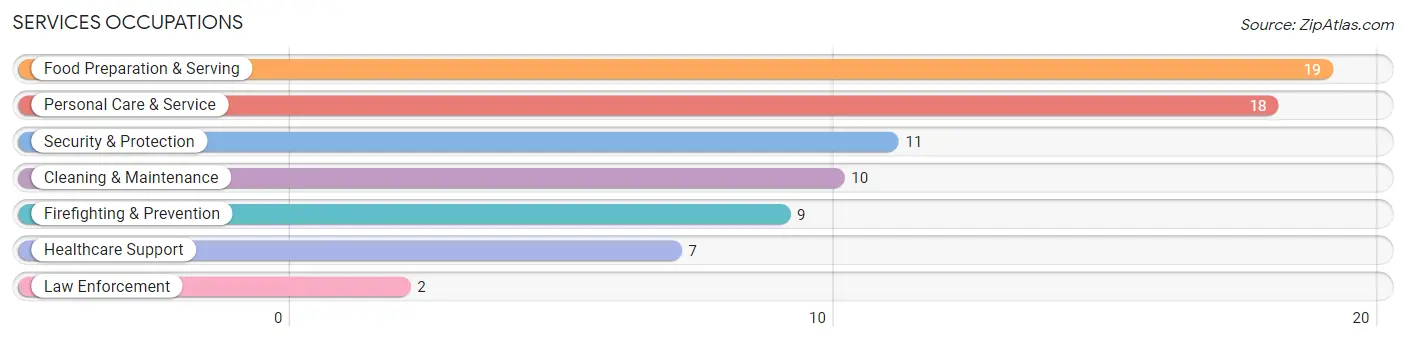
Services Occupations
The most common Services occupations in Cleveland are Food Preparation & Serving (19 | 3.7%), Personal Care & Service (18 | 3.5%), Security & Protection (11 | 2.1%), Cleaning & Maintenance (10 | 1.9%), and Firefighting & Prevention (9 | 1.7%).
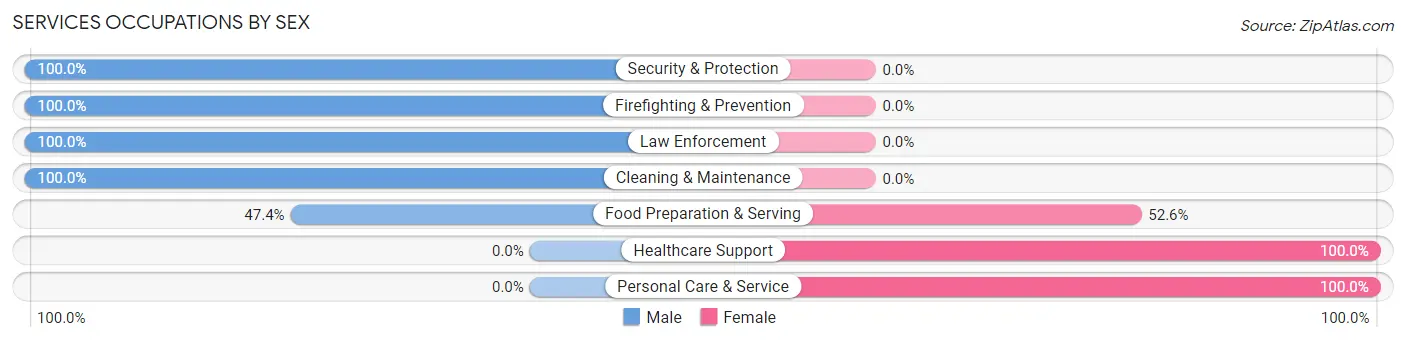
Services Occupations by Sex
Within the Services occupations in Cleveland, the most male-oriented occupations are Security & Protection (100.0%), Firefighting & Prevention (100.0%), and Law Enforcement (100.0%), while the most female-oriented occupations are Healthcare Support (100.0%), Personal Care & Service (100.0%), and Food Preparation & Serving (52.6%).
| Occupation | Male | Female |
| Healthcare Support | 0 (0.0%) | 7 (100.0%) |
| Security & Protection | 11 (100.0%) | 0 (0.0%) |
| Firefighting & Prevention | 9 (100.0%) | 0 (0.0%) |
| Law Enforcement | 2 (100.0%) | 0 (0.0%) |
| Food Preparation & Serving | 9 (47.4%) | 10 (52.6%) |
| Cleaning & Maintenance | 10 (100.0%) | 0 (0.0%) |
| Personal Care & Service | 0 (0.0%) | 18 (100.0%) |
| Total (Category) | 30 (46.2%) | 35 (53.8%) |
| Total (Overall) | 242 (46.9%) | 274 (53.1%) |
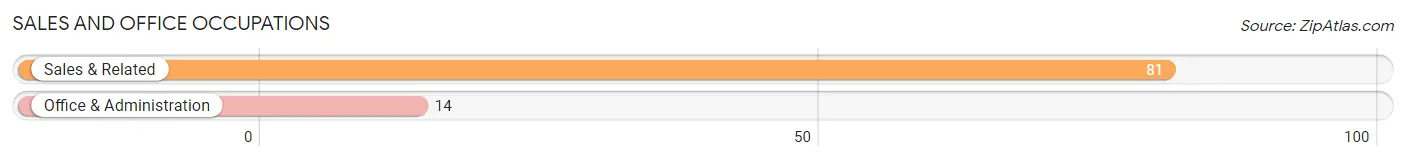
Sales and Office Occupations
The most common Sales and Office occupations in Cleveland are Sales & Related (81 | 15.7%), and Office & Administration (14 | 2.7%).
Sales and Office Occupations by Sex
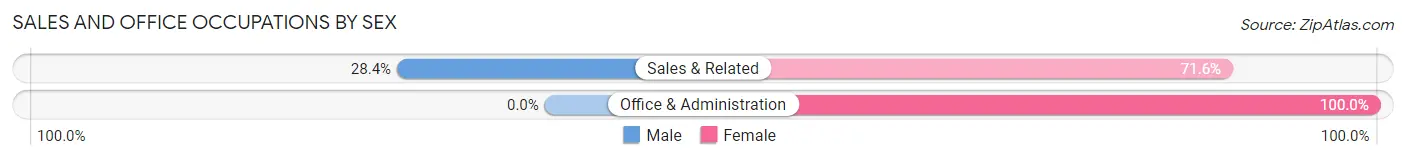
| Occupation | Male | Female |
| Sales & Related | 23 (28.4%) | 58 (71.6%) |
| Office & Administration | 0 (0.0%) | 14 (100.0%) |
| Total (Category) | 23 (24.2%) | 72 (75.8%) |
| Total (Overall) | 242 (46.9%) | 274 (53.1%) |
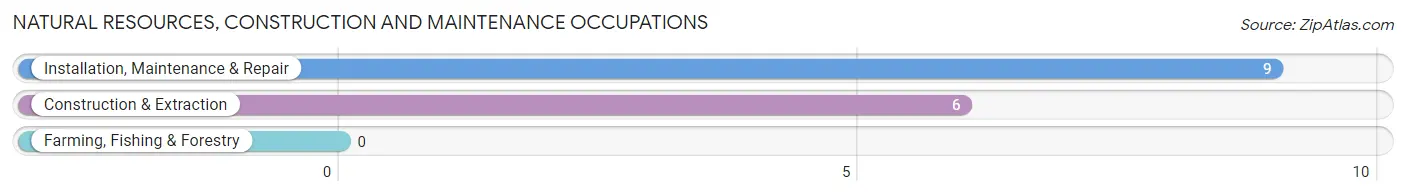
Natural Resources, Construction and Maintenance Occupations
The most common Natural Resources, Construction and Maintenance occupations in Cleveland are Installation, Maintenance & Repair (9 | 1.7%), and Construction & Extraction (6 | 1.2%).
Natural Resources, Construction and Maintenance Occupations by Sex
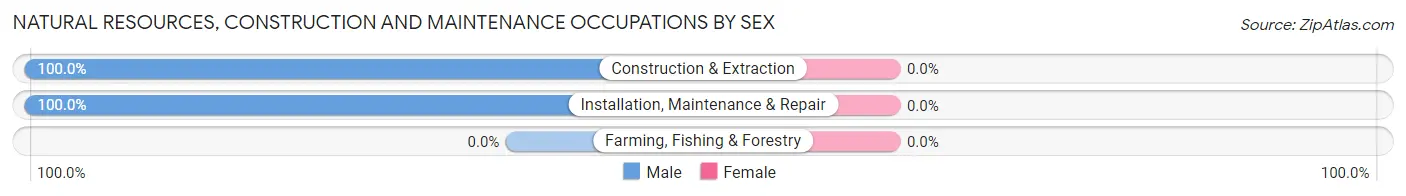
| Occupation | Male | Female |
| Farming, Fishing & Forestry | 0 (0.0%) | 0 (0.0%) |
| Construction & Extraction | 6 (100.0%) | 0 (0.0%) |
| Installation, Maintenance & Repair | 9 (100.0%) | 0 (0.0%) |
| Total (Category) | 15 (100.0%) | 0 (0.0%) |
| Total (Overall) | 242 (46.9%) | 274 (53.1%) |
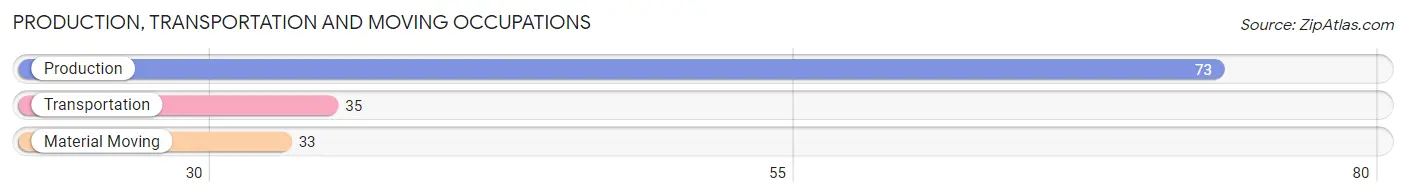
Production, Transportation and Moving Occupations
The most common Production, Transportation and Moving occupations in Cleveland are Production (73 | 14.1%), Transportation (35 | 6.8%), and Material Moving (33 | 6.4%).
Production, Transportation and Moving Occupations by Sex
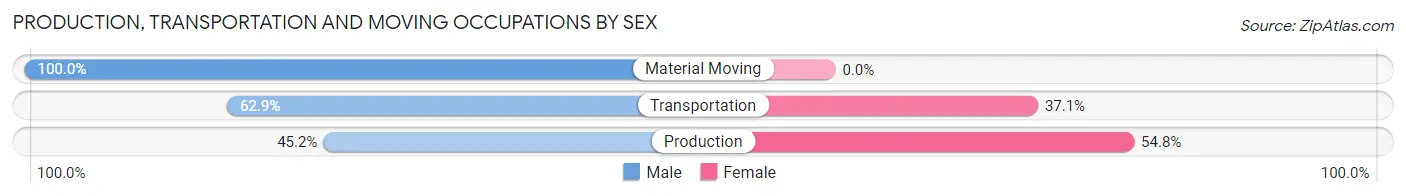
| Occupation | Male | Female |
| Production | 33 (45.2%) | 40 (54.8%) |
| Transportation | 22 (62.9%) | 13 (37.1%) |
| Material Moving | 33 (100.0%) | 0 (0.0%) |
| Total (Category) | 88 (62.4%) | 53 (37.6%) |
| Total (Overall) | 242 (46.9%) | 274 (53.1%) |
Employment Industries by Sex in Cleveland
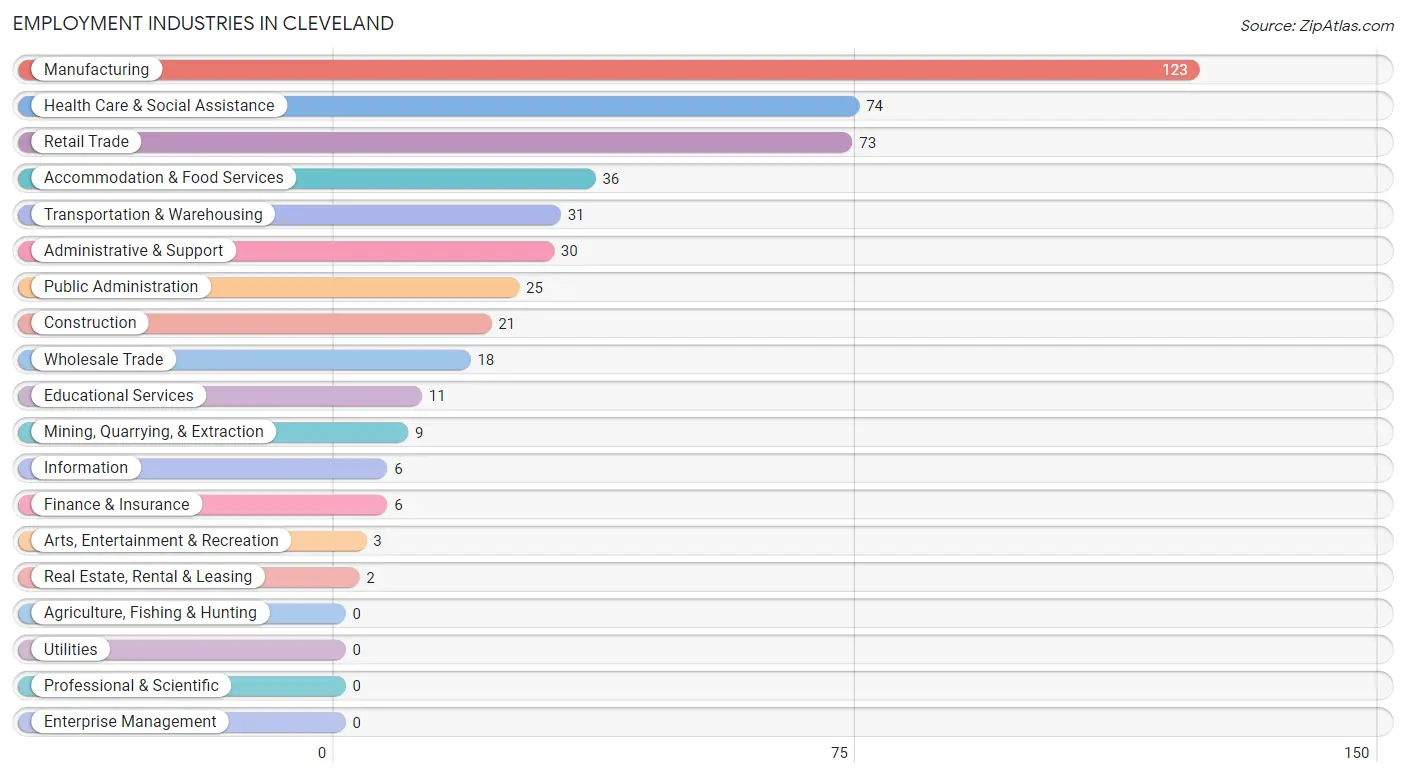
Employment Industries in Cleveland
The major employment industries in Cleveland include Manufacturing (123 | 23.8%), Health Care & Social Assistance (74 | 14.3%), Retail Trade (73 | 14.1%), Accommodation & Food Services (36 | 7.0%), and Transportation & Warehousing (31 | 6.0%).
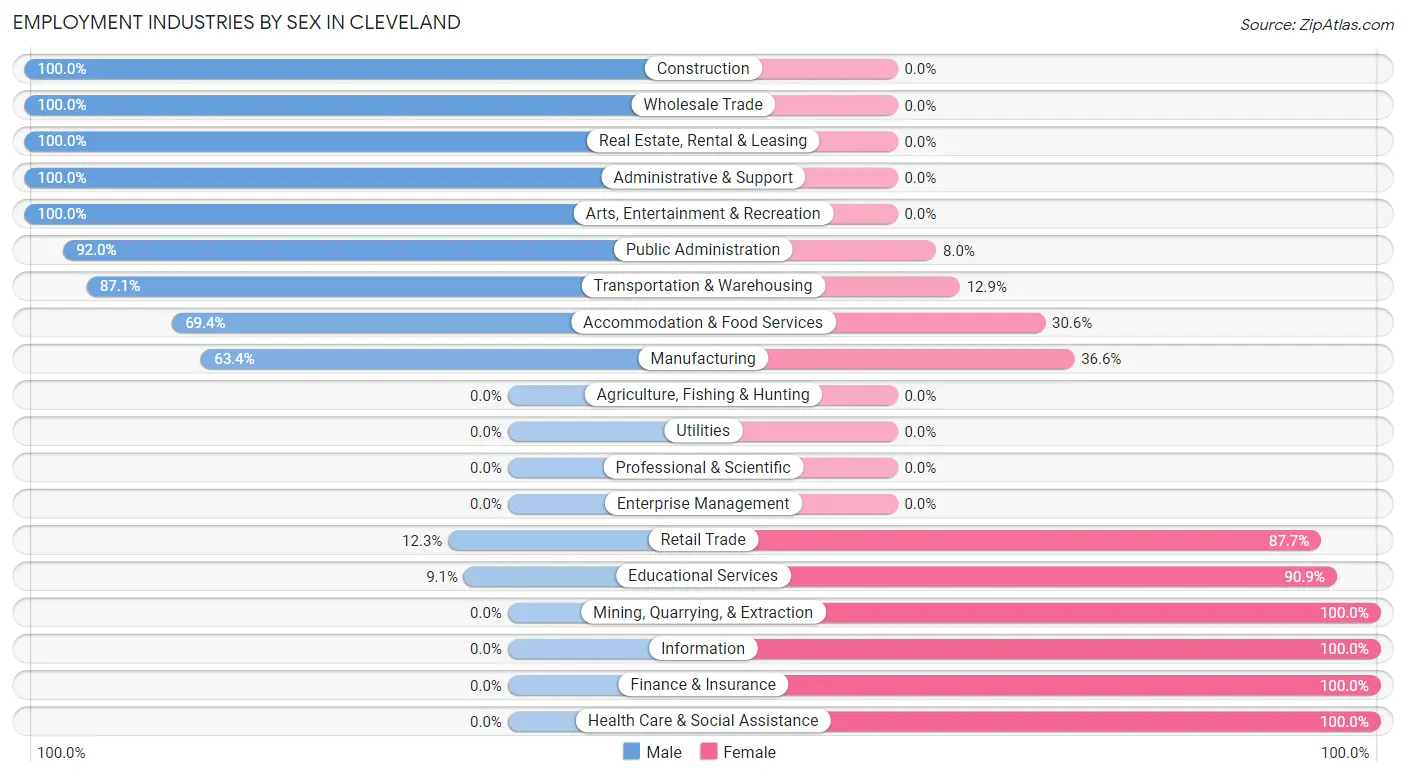
Employment Industries by Sex in Cleveland
The Cleveland industries that see more men than women are Construction (100.0%), Wholesale Trade (100.0%), and Real Estate, Rental & Leasing (100.0%), whereas the industries that tend to have a higher number of women are Mining, Quarrying, & Extraction (100.0%), Information (100.0%), and Finance & Insurance (100.0%).
| Industry | Male | Female |
| Agriculture, Fishing & Hunting | 0 (0.0%) | 0 (0.0%) |
| Mining, Quarrying, & Extraction | 0 (0.0%) | 9 (100.0%) |
| Construction | 21 (100.0%) | 0 (0.0%) |
| Manufacturing | 78 (63.4%) | 45 (36.6%) |
| Wholesale Trade | 18 (100.0%) | 0 (0.0%) |
| Retail Trade | 9 (12.3%) | 64 (87.7%) |
| Transportation & Warehousing | 27 (87.1%) | 4 (12.9%) |
| Utilities | 0 (0.0%) | 0 (0.0%) |
| Information | 0 (0.0%) | 6 (100.0%) |
| Finance & Insurance | 0 (0.0%) | 6 (100.0%) |
| Real Estate, Rental & Leasing | 2 (100.0%) | 0 (0.0%) |
| Professional & Scientific | 0 (0.0%) | 0 (0.0%) |
| Enterprise Management | 0 (0.0%) | 0 (0.0%) |
| Administrative & Support | 30 (100.0%) | 0 (0.0%) |
| Educational Services | 1 (9.1%) | 10 (90.9%) |
| Health Care & Social Assistance | 0 (0.0%) | 74 (100.0%) |
| Arts, Entertainment & Recreation | 3 (100.0%) | 0 (0.0%) |
| Accommodation & Food Services | 25 (69.4%) | 11 (30.6%) |
| Public Administration | 23 (92.0%) | 2 (8.0%) |
| Total | 242 (46.9%) | 274 (53.1%) |
Education in Cleveland
School Enrollment in Cleveland
The most common levels of schooling among the 370 students in Cleveland are middle school (107 | 28.9%), elementary school (84 | 22.7%), and nursery / preschool (62 | 16.8%).
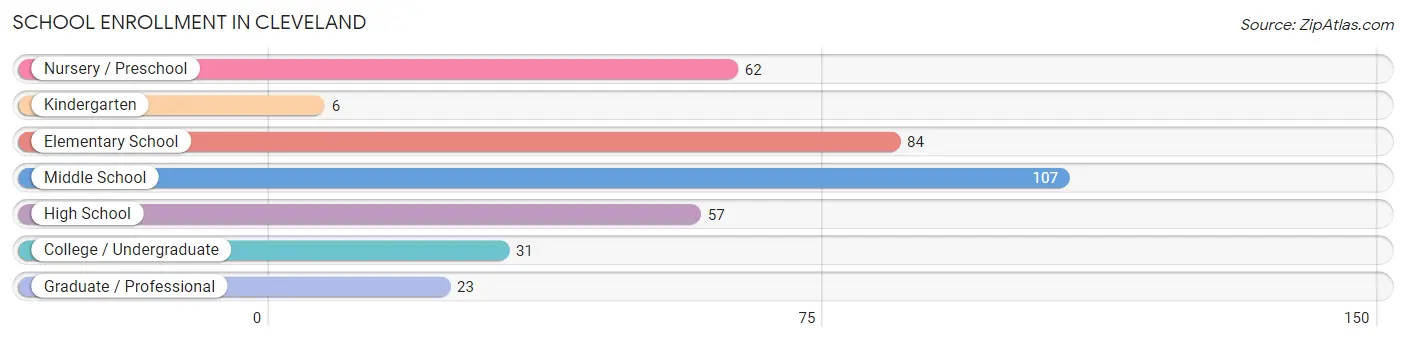
| School Level | # Students | % Students |
| Nursery / Preschool | 62 | 16.8% |
| Kindergarten | 6 | 1.6% |
| Elementary School | 84 | 22.7% |
| Middle School | 107 | 28.9% |
| High School | 57 | 15.4% |
| College / Undergraduate | 31 | 8.4% |
| Graduate / Professional | 23 | 6.2% |
| Total | 370 | 100.0% |
School Enrollment by Age by Funding Source in Cleveland
Out of a total of 370 students who are enrolled in schools in Cleveland, 43 (11.6%) attend a private institution, while the remaining 327 (88.4%) are enrolled in public schools. The age group of 25 to 34 year olds has the highest likelihood of being enrolled in private schools, with 12 (92.3% in the age bracket) enrolled. Conversely, the age group of 3 to 4 year olds has the lowest likelihood of being enrolled in a private school, with 55 (100.0% in the age bracket) attending a public institution.
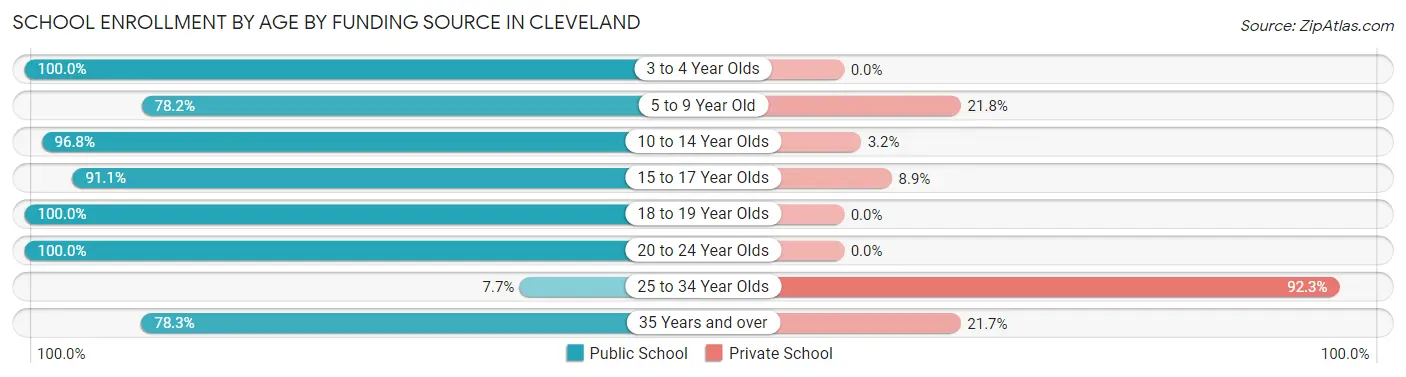
| Age Bracket | Public School | Private School |
| 3 to 4 Year Olds | 55 (100.0%) | 0 (0.0%) |
| 5 to 9 Year Old | 61 (78.2%) | 17 (21.8%) |
| 10 to 14 Year Olds | 122 (96.8%) | 4 (3.2%) |
| 15 to 17 Year Olds | 51 (91.1%) | 5 (8.9%) |
| 18 to 19 Year Olds | 16 (100.0%) | 0 (0.0%) |
| 20 to 24 Year Olds | 3 (100.0%) | 0 (0.0%) |
| 25 to 34 Year Olds | 1 (7.7%) | 12 (92.3%) |
| 35 Years and over | 18 (78.3%) | 5 (21.7%) |
| Total | 327 (88.4%) | 43 (11.6%) |
Educational Attainment by Field of Study in Cleveland
Business (53 | 22.8%), arts & humanities (42 | 18.0%), communications (31 | 13.3%), literature & languages (24 | 10.3%), and computers & mathematics (16 | 6.9%) are the most common fields of study among 233 individuals in Cleveland who have obtained a bachelor's degree or higher.
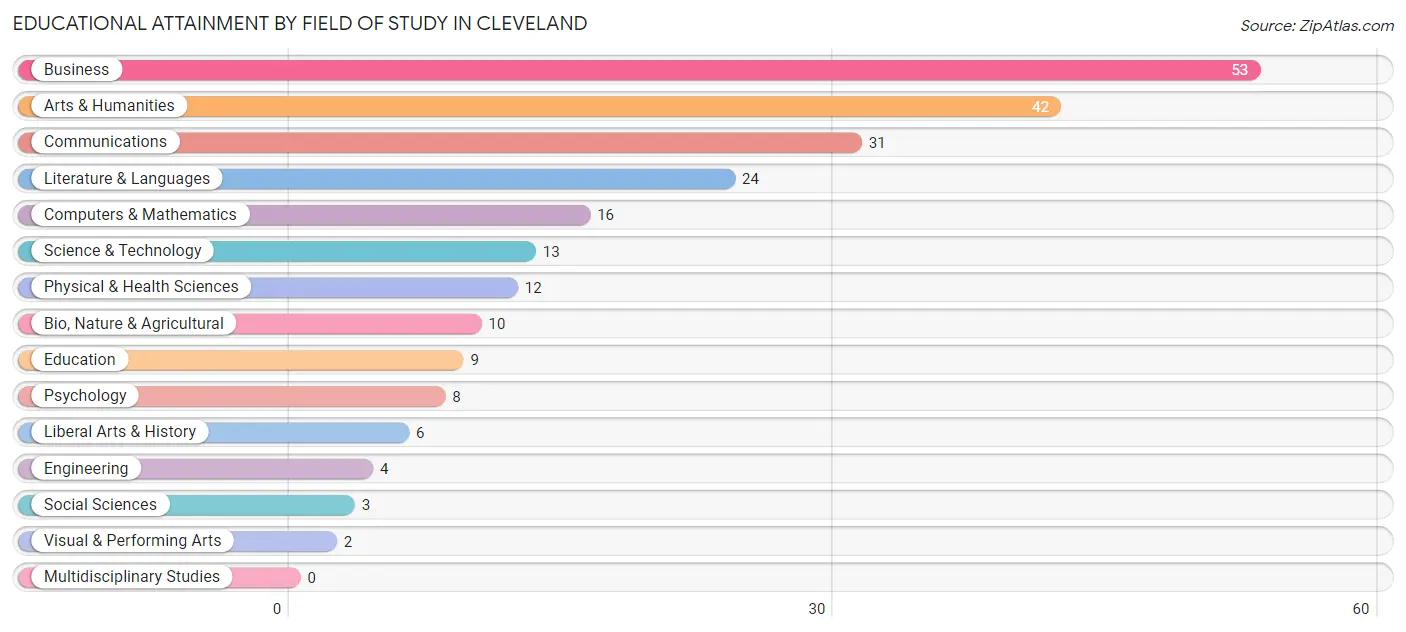
| Field of Study | # Graduates | % Graduates |
| Computers & Mathematics | 16 | 6.9% |
| Bio, Nature & Agricultural | 10 | 4.3% |
| Physical & Health Sciences | 12 | 5.1% |
| Psychology | 8 | 3.4% |
| Social Sciences | 3 | 1.3% |
| Engineering | 4 | 1.7% |
| Multidisciplinary Studies | 0 | 0.0% |
| Science & Technology | 13 | 5.6% |
| Business | 53 | 22.8% |
| Education | 9 | 3.9% |
| Literature & Languages | 24 | 10.3% |
| Liberal Arts & History | 6 | 2.6% |
| Visual & Performing Arts | 2 | 0.9% |
| Communications | 31 | 13.3% |
| Arts & Humanities | 42 | 18.0% |
| Total | 233 | 100.0% |
Transportation & Commute in Cleveland
Vehicle Availability by Sex in Cleveland
The most prevalent vehicle ownership categories in Cleveland are males with 3 vehicles (85, accounting for 36.2%) and females with 3 vehicles (66, making up 31.5%).
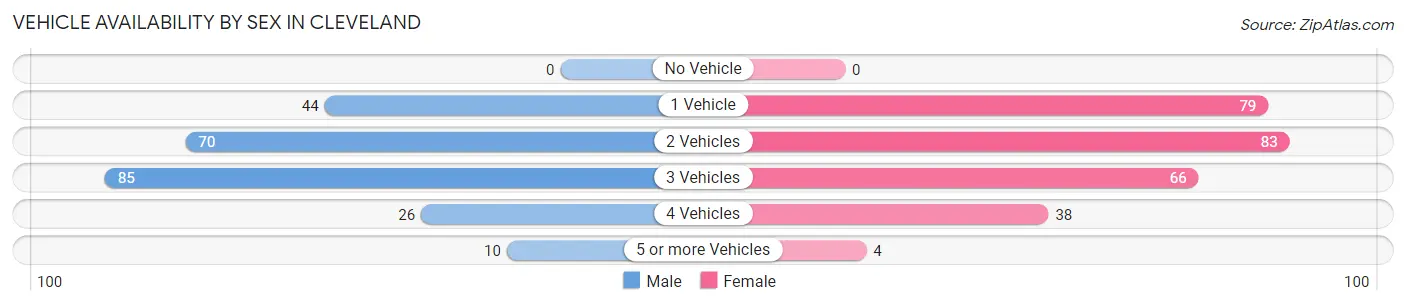
| Vehicles Available | Male | Female |
| No Vehicle | 0 (0.0%) | 0 (0.0%) |
| 1 Vehicle | 44 (18.7%) | 79 (29.3%) |
| 2 Vehicles | 70 (29.8%) | 83 (30.7%) |
| 3 Vehicles | 85 (36.2%) | 66 (24.4%) |
| 4 Vehicles | 26 (11.1%) | 38 (14.1%) |
| 5 or more Vehicles | 10 (4.3%) | 4 (1.5%) |
| Total | 235 (100.0%) | 270 (100.0%) |
Commute Time in Cleveland
The most frequently occuring commute durations in Cleveland are 45 to 59 minutes (130 commuters, 26.3%), 20 to 24 minutes (106 commuters, 21.5%), and 25 to 29 minutes (50 commuters, 10.1%).
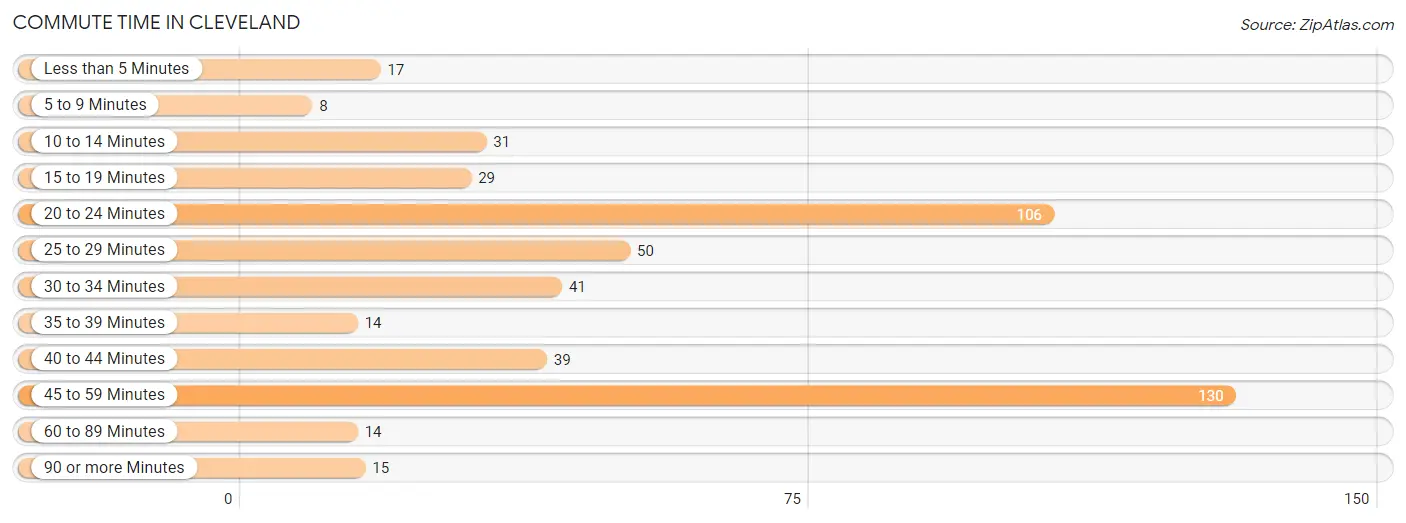
| Commute Time | # Commuters | % Commuters |
| Less than 5 Minutes | 17 | 3.4% |
| 5 to 9 Minutes | 8 | 1.6% |
| 10 to 14 Minutes | 31 | 6.3% |
| 15 to 19 Minutes | 29 | 5.9% |
| 20 to 24 Minutes | 106 | 21.5% |
| 25 to 29 Minutes | 50 | 10.1% |
| 30 to 34 Minutes | 41 | 8.3% |
| 35 to 39 Minutes | 14 | 2.8% |
| 40 to 44 Minutes | 39 | 7.9% |
| 45 to 59 Minutes | 130 | 26.3% |
| 60 to 89 Minutes | 14 | 2.8% |
| 90 or more Minutes | 15 | 3.0% |
Commute Time by Sex in Cleveland
The most common commute times in Cleveland are 45 to 59 minutes (57 commuters, 24.3%) for males and 45 to 59 minutes (73 commuters, 28.2%) for females.
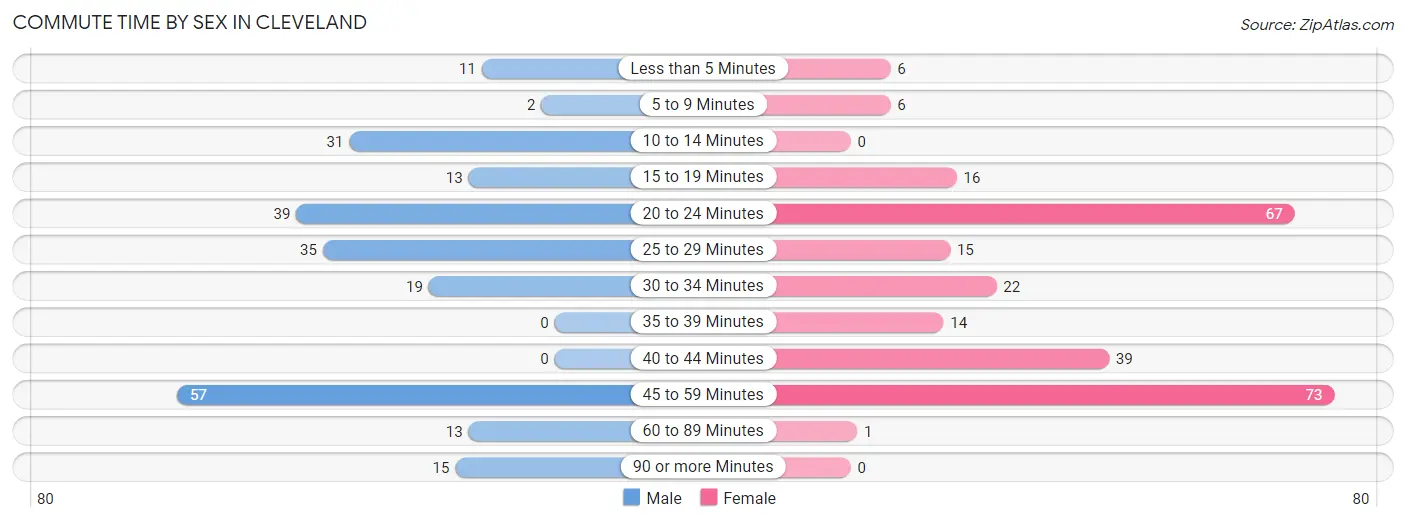
| Commute Time | Male | Female |
| Less than 5 Minutes | 11 (4.7%) | 6 (2.3%) |
| 5 to 9 Minutes | 2 (0.9%) | 6 (2.3%) |
| 10 to 14 Minutes | 31 (13.2%) | 0 (0.0%) |
| 15 to 19 Minutes | 13 (5.5%) | 16 (6.2%) |
| 20 to 24 Minutes | 39 (16.6%) | 67 (25.9%) |
| 25 to 29 Minutes | 35 (14.9%) | 15 (5.8%) |
| 30 to 34 Minutes | 19 (8.1%) | 22 (8.5%) |
| 35 to 39 Minutes | 0 (0.0%) | 14 (5.4%) |
| 40 to 44 Minutes | 0 (0.0%) | 39 (15.1%) |
| 45 to 59 Minutes | 57 (24.3%) | 73 (28.2%) |
| 60 to 89 Minutes | 13 (5.5%) | 1 (0.4%) |
| 90 or more Minutes | 15 (6.4%) | 0 (0.0%) |
Time of Departure to Work by Sex in Cleveland
The most frequent times of departure to work in Cleveland are 6:00 AM to 6:29 AM (35, 14.9%) for males and 8:00 AM to 8:29 AM (71, 27.4%) for females.
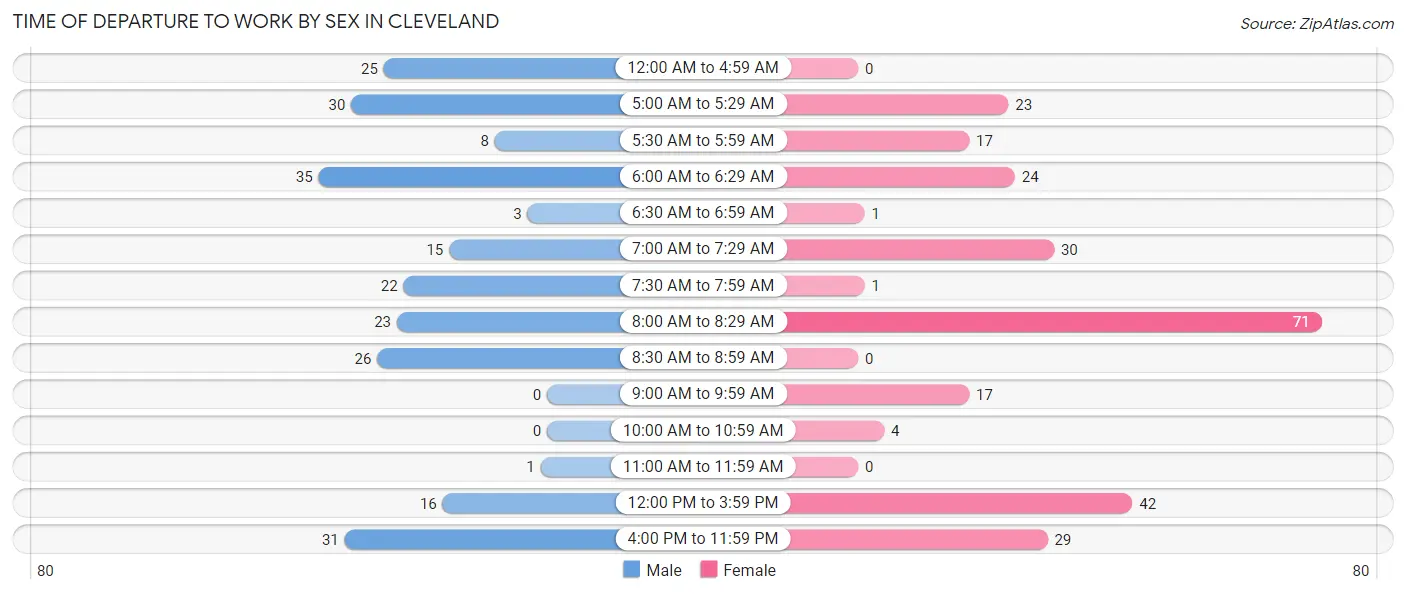
| Time of Departure | Male | Female |
| 12:00 AM to 4:59 AM | 25 (10.6%) | 0 (0.0%) |
| 5:00 AM to 5:29 AM | 30 (12.8%) | 23 (8.9%) |
| 5:30 AM to 5:59 AM | 8 (3.4%) | 17 (6.6%) |
| 6:00 AM to 6:29 AM | 35 (14.9%) | 24 (9.3%) |
| 6:30 AM to 6:59 AM | 3 (1.3%) | 1 (0.4%) |
| 7:00 AM to 7:29 AM | 15 (6.4%) | 30 (11.6%) |
| 7:30 AM to 7:59 AM | 22 (9.4%) | 1 (0.4%) |
| 8:00 AM to 8:29 AM | 23 (9.8%) | 71 (27.4%) |
| 8:30 AM to 8:59 AM | 26 (11.1%) | 0 (0.0%) |
| 9:00 AM to 9:59 AM | 0 (0.0%) | 17 (6.6%) |
| 10:00 AM to 10:59 AM | 0 (0.0%) | 4 (1.5%) |
| 11:00 AM to 11:59 AM | 1 (0.4%) | 0 (0.0%) |
| 12:00 PM to 3:59 PM | 16 (6.8%) | 42 (16.2%) |
| 4:00 PM to 11:59 PM | 31 (13.2%) | 29 (11.2%) |
| Total | 235 (100.0%) | 259 (100.0%) |
Housing Occupancy in Cleveland
Occupancy by Ownership in Cleveland
Of the total 444 dwellings in Cleveland, owner-occupied units account for 305 (68.7%), while renter-occupied units make up 139 (31.3%).
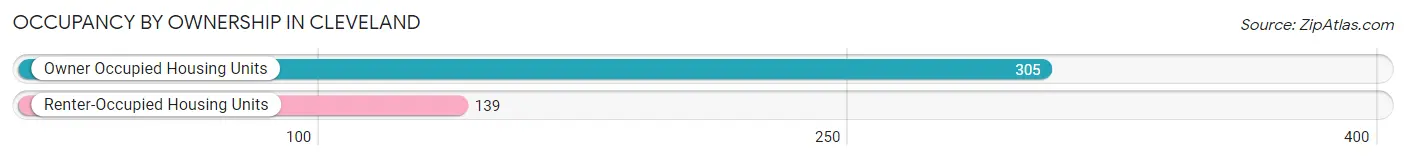
| Occupancy | # Housing Units | % Housing Units |
| Owner Occupied Housing Units | 305 | 68.7% |
| Renter-Occupied Housing Units | 139 | 31.3% |
| Total Occupied Housing Units | 444 | 100.0% |
Occupancy by Household Size in Cleveland
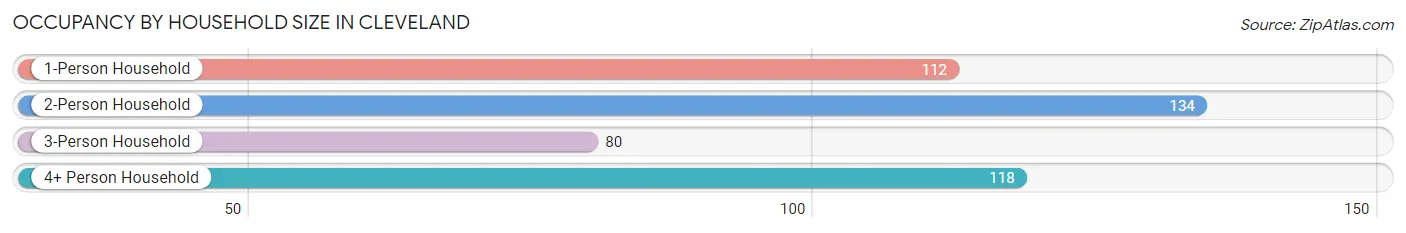
| Household Size | # Housing Units | % Housing Units |
| 1-Person Household | 112 | 25.2% |
| 2-Person Household | 134 | 30.2% |
| 3-Person Household | 80 | 18.0% |
| 4+ Person Household | 118 | 26.6% |
| Total Housing Units | 444 | 100.0% |
Occupancy by Ownership by Household Size in Cleveland
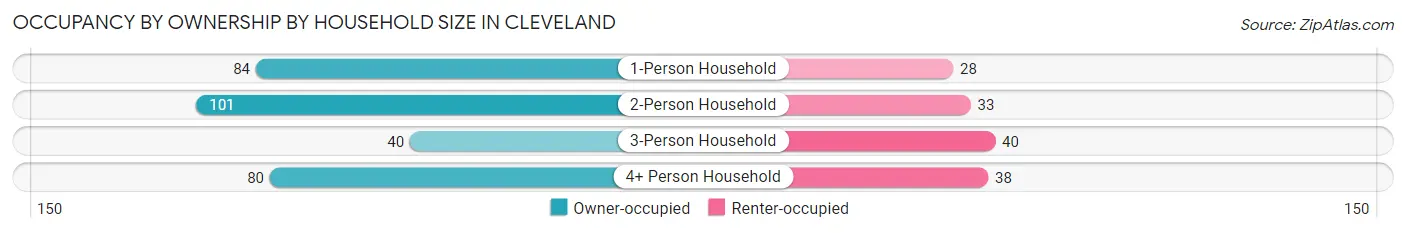
| Household Size | Owner-occupied | Renter-occupied |
| 1-Person Household | 84 (75.0%) | 28 (25.0%) |
| 2-Person Household | 101 (75.4%) | 33 (24.6%) |
| 3-Person Household | 40 (50.0%) | 40 (50.0%) |
| 4+ Person Household | 80 (67.8%) | 38 (32.2%) |
| Total Housing Units | 305 (68.7%) | 139 (31.3%) |
Occupancy by Educational Attainment in Cleveland
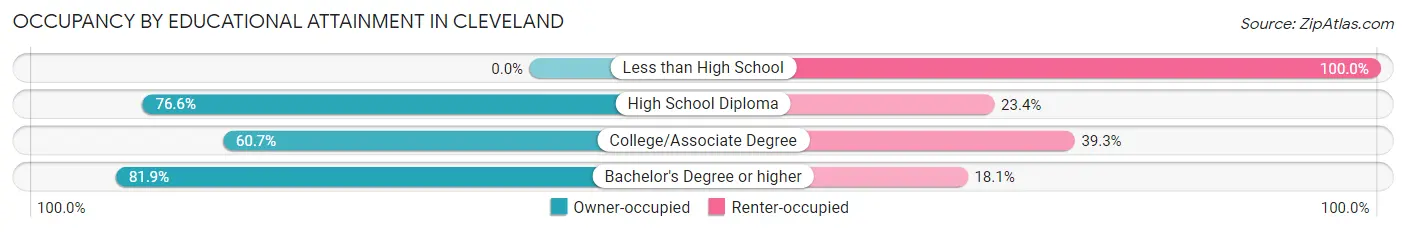
| Household Size | Owner-occupied | Renter-occupied |
| Less than High School | 0 (0.0%) | 23 (100.0%) |
| High School Diploma | 131 (76.6%) | 40 (23.4%) |
| College/Associate Degree | 88 (60.7%) | 57 (39.3%) |
| Bachelor's Degree or higher | 86 (81.9%) | 19 (18.1%) |
Occupancy by Age of Householder in Cleveland
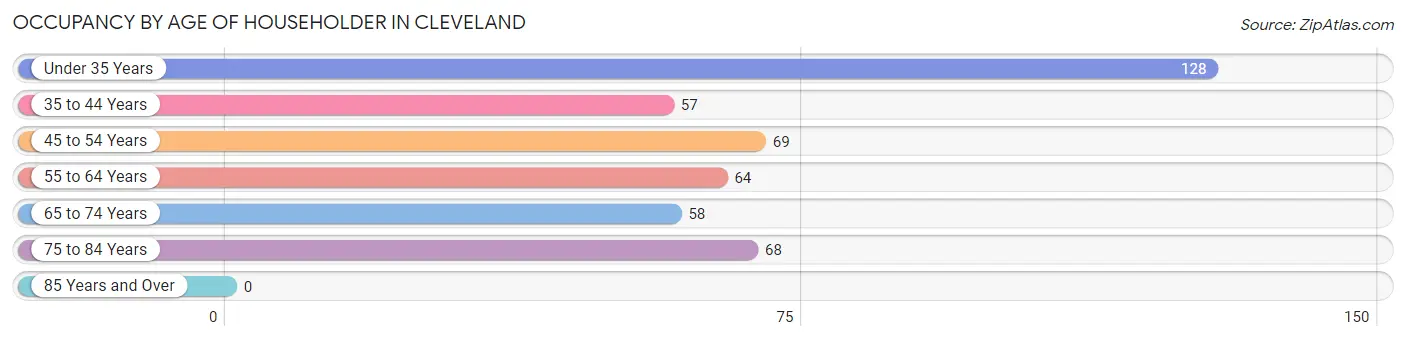
| Age Bracket | # Households | % Households |
| Under 35 Years | 128 | 28.8% |
| 35 to 44 Years | 57 | 12.8% |
| 45 to 54 Years | 69 | 15.5% |
| 55 to 64 Years | 64 | 14.4% |
| 65 to 74 Years | 58 | 13.1% |
| 75 to 84 Years | 68 | 15.3% |
| 85 Years and Over | 0 | 0.0% |
| Total | 444 | 100.0% |
Housing Finances in Cleveland
Median Income by Occupancy in Cleveland
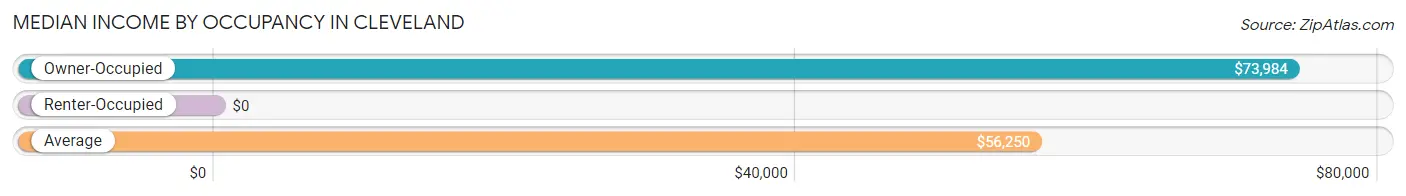
| Occupancy Type | # Households | Median Income |
| Owner-Occupied | 305 (68.7%) | $73,984 |
| Renter-Occupied | 139 (31.3%) | $0 |
| Average | 444 (100.0%) | $56,250 |
Occupancy by Householder Income Bracket in Cleveland
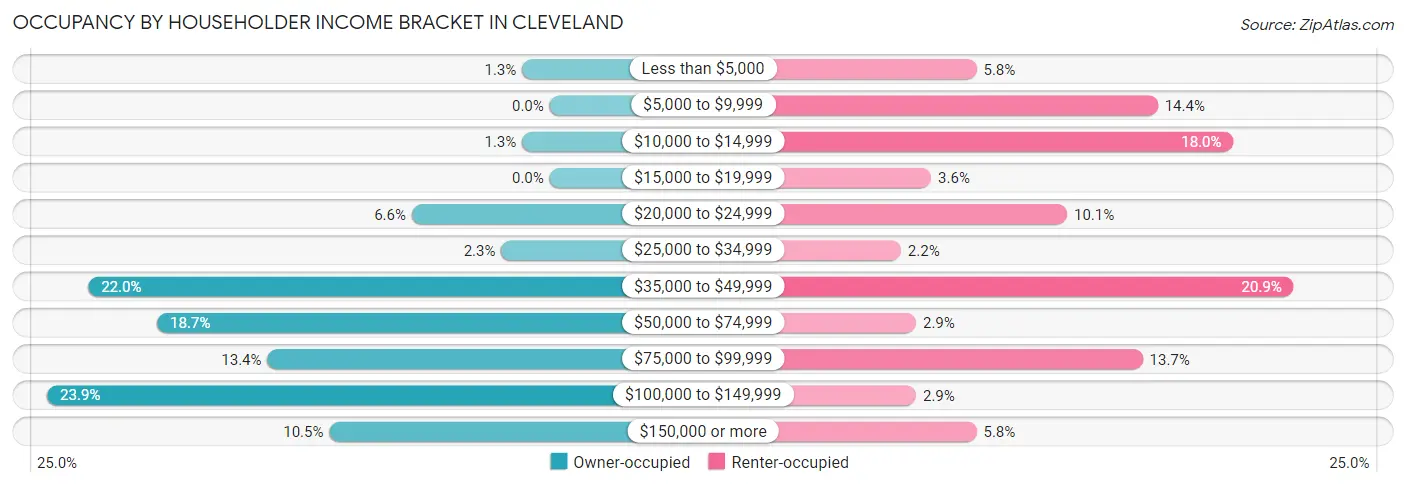
| Income Bracket | Owner-occupied | Renter-occupied |
| Less than $5,000 | 4 (1.3%) | 8 (5.8%) |
| $5,000 to $9,999 | 0 (0.0%) | 20 (14.4%) |
| $10,000 to $14,999 | 4 (1.3%) | 25 (18.0%) |
| $15,000 to $19,999 | 0 (0.0%) | 5 (3.6%) |
| $20,000 to $24,999 | 20 (6.6%) | 14 (10.1%) |
| $25,000 to $34,999 | 7 (2.3%) | 3 (2.2%) |
| $35,000 to $49,999 | 67 (22.0%) | 29 (20.9%) |
| $50,000 to $74,999 | 57 (18.7%) | 4 (2.9%) |
| $75,000 to $99,999 | 41 (13.4%) | 19 (13.7%) |
| $100,000 to $149,999 | 73 (23.9%) | 4 (2.9%) |
| $150,000 or more | 32 (10.5%) | 8 (5.8%) |
| Total | 305 (100.0%) | 139 (100.0%) |
Monthly Housing Cost Tiers in Cleveland
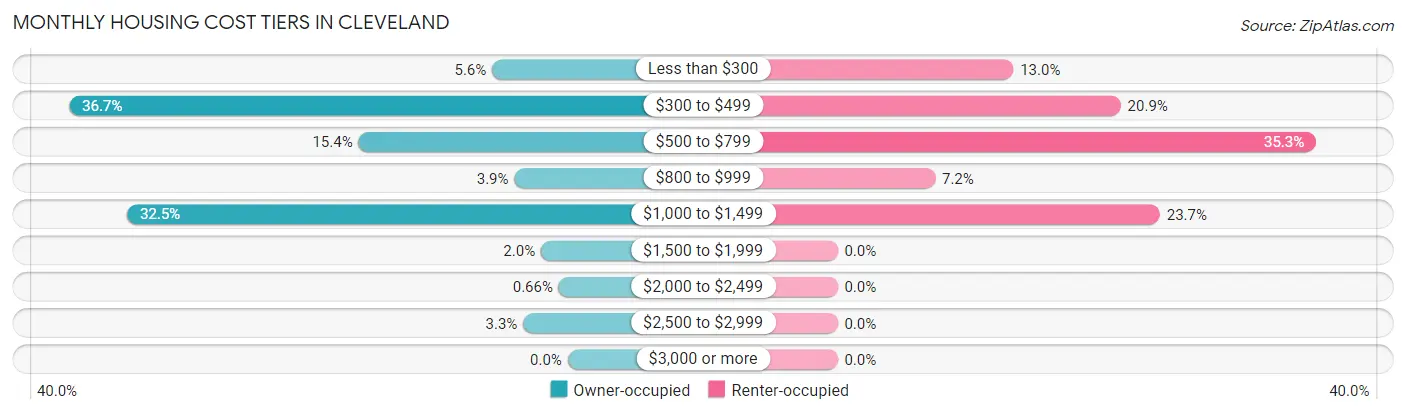
| Monthly Cost | Owner-occupied | Renter-occupied |
| Less than $300 | 17 (5.6%) | 18 (13.0%) |
| $300 to $499 | 112 (36.7%) | 29 (20.9%) |
| $500 to $799 | 47 (15.4%) | 49 (35.2%) |
| $800 to $999 | 12 (3.9%) | 10 (7.2%) |
| $1,000 to $1,499 | 99 (32.5%) | 33 (23.7%) |
| $1,500 to $1,999 | 6 (2.0%) | 0 (0.0%) |
| $2,000 to $2,499 | 2 (0.7%) | 0 (0.0%) |
| $2,500 to $2,999 | 10 (3.3%) | 0 (0.0%) |
| $3,000 or more | 0 (0.0%) | 0 (0.0%) |
| Total | 305 (100.0%) | 139 (100.0%) |
Physical Housing Characteristics in Cleveland
Housing Structures in Cleveland
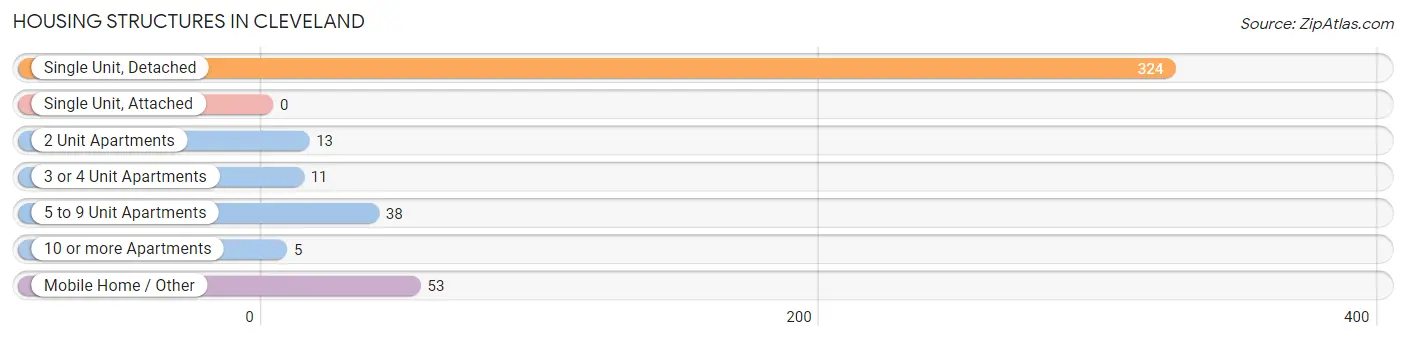
| Structure Type | # Housing Units | % Housing Units |
| Single Unit, Detached | 324 | 73.0% |
| Single Unit, Attached | 0 | 0.0% |
| 2 Unit Apartments | 13 | 2.9% |
| 3 or 4 Unit Apartments | 11 | 2.5% |
| 5 to 9 Unit Apartments | 38 | 8.6% |
| 10 or more Apartments | 5 | 1.1% |
| Mobile Home / Other | 53 | 11.9% |
| Total | 444 | 100.0% |
Housing Structures by Occupancy in Cleveland
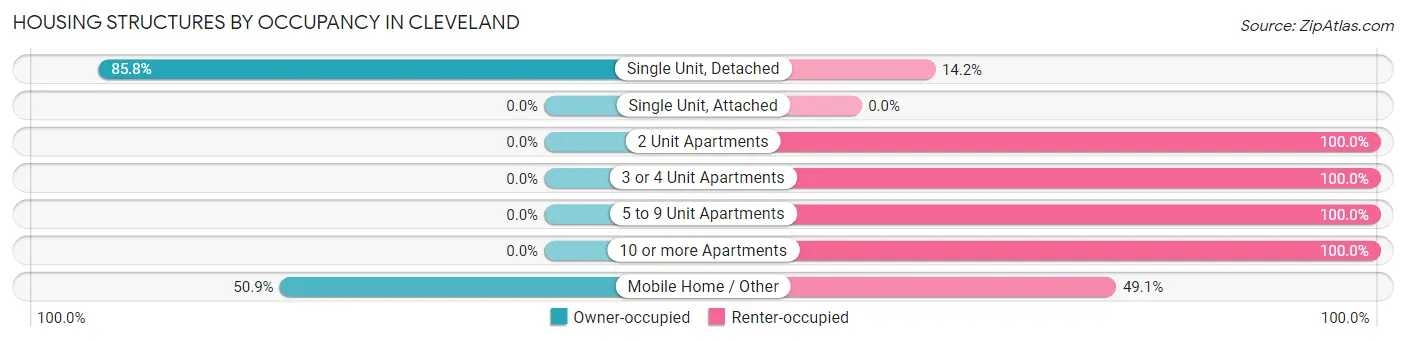
| Structure Type | Owner-occupied | Renter-occupied |
| Single Unit, Detached | 278 (85.8%) | 46 (14.2%) |
| Single Unit, Attached | 0 (0.0%) | 0 (0.0%) |
| 2 Unit Apartments | 0 (0.0%) | 13 (100.0%) |
| 3 or 4 Unit Apartments | 0 (0.0%) | 11 (100.0%) |
| 5 to 9 Unit Apartments | 0 (0.0%) | 38 (100.0%) |
| 10 or more Apartments | 0 (0.0%) | 5 (100.0%) |
| Mobile Home / Other | 27 (50.9%) | 26 (49.1%) |
| Total | 305 (68.7%) | 139 (31.3%) |
Housing Structures by Number of Rooms in Cleveland
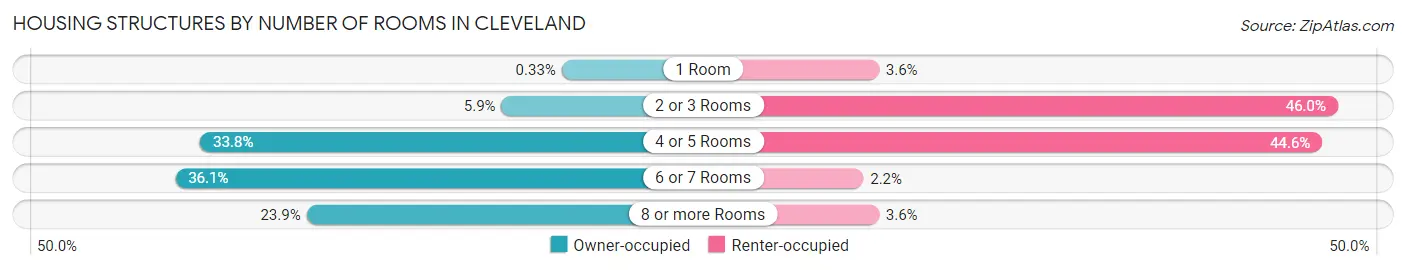
| Number of Rooms | Owner-occupied | Renter-occupied |
| 1 Room | 1 (0.3%) | 5 (3.6%) |
| 2 or 3 Rooms | 18 (5.9%) | 64 (46.0%) |
| 4 or 5 Rooms | 103 (33.8%) | 62 (44.6%) |
| 6 or 7 Rooms | 110 (36.1%) | 3 (2.2%) |
| 8 or more Rooms | 73 (23.9%) | 5 (3.6%) |
| Total | 305 (100.0%) | 139 (100.0%) |
Housing Structure by Heating Type in Cleveland
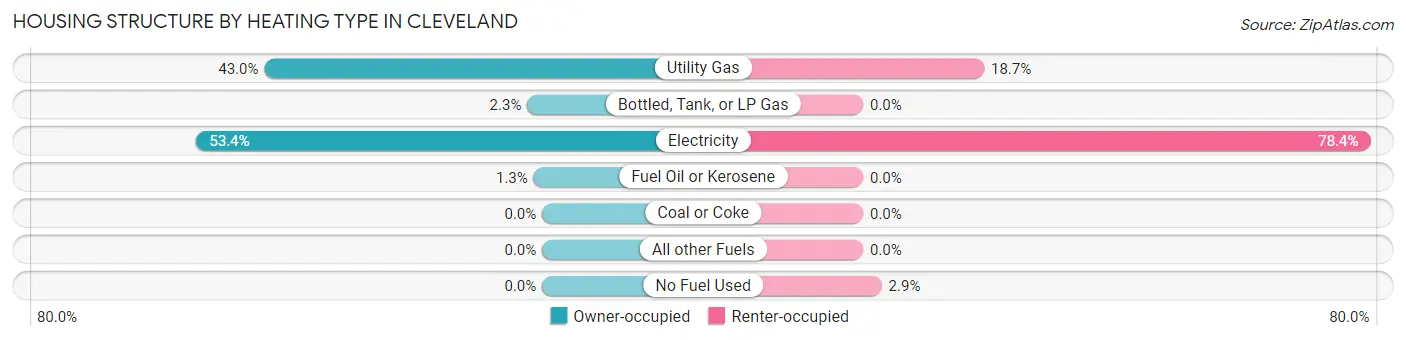
| Heating Type | Owner-occupied | Renter-occupied |
| Utility Gas | 131 (42.9%) | 26 (18.7%) |
| Bottled, Tank, or LP Gas | 7 (2.3%) | 0 (0.0%) |
| Electricity | 163 (53.4%) | 109 (78.4%) |
| Fuel Oil or Kerosene | 4 (1.3%) | 0 (0.0%) |
| Coal or Coke | 0 (0.0%) | 0 (0.0%) |
| All other Fuels | 0 (0.0%) | 0 (0.0%) |
| No Fuel Used | 0 (0.0%) | 4 (2.9%) |
| Total | 305 (100.0%) | 139 (100.0%) |
Household Vehicle Usage in Cleveland
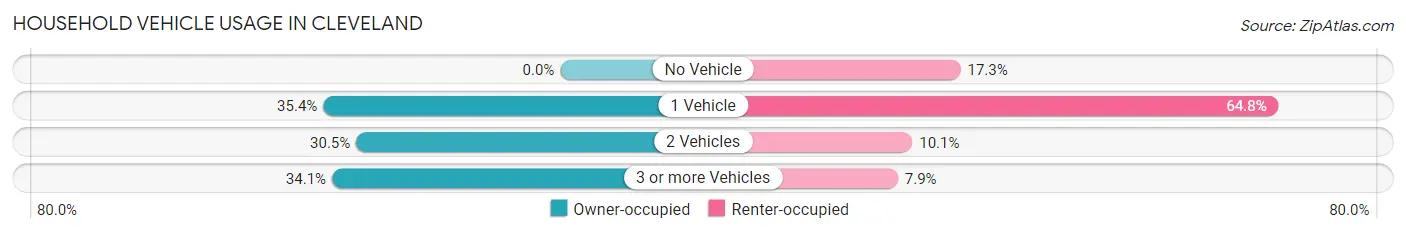
| Vehicles per Household | Owner-occupied | Renter-occupied |
| No Vehicle | 0 (0.0%) | 24 (17.3%) |
| 1 Vehicle | 108 (35.4%) | 90 (64.7%) |
| 2 Vehicles | 93 (30.5%) | 14 (10.1%) |
| 3 or more Vehicles | 104 (34.1%) | 11 (7.9%) |
| Total | 305 (100.0%) | 139 (100.0%) |
Real Estate & Mortgages in Cleveland
Real Estate and Mortgage Overview in Cleveland
| Characteristic | Without Mortgage | With Mortgage |
| Housing Units | 161 | 144 |
| Median Property Value | $202,100 | $168,600 |
| Median Household Income | $51,635 | $19 |
| Monthly Housing Costs | $393 | $0 |
| Real Estate Taxes | $1,216 | $4 |
Property Value by Mortgage Status in Cleveland
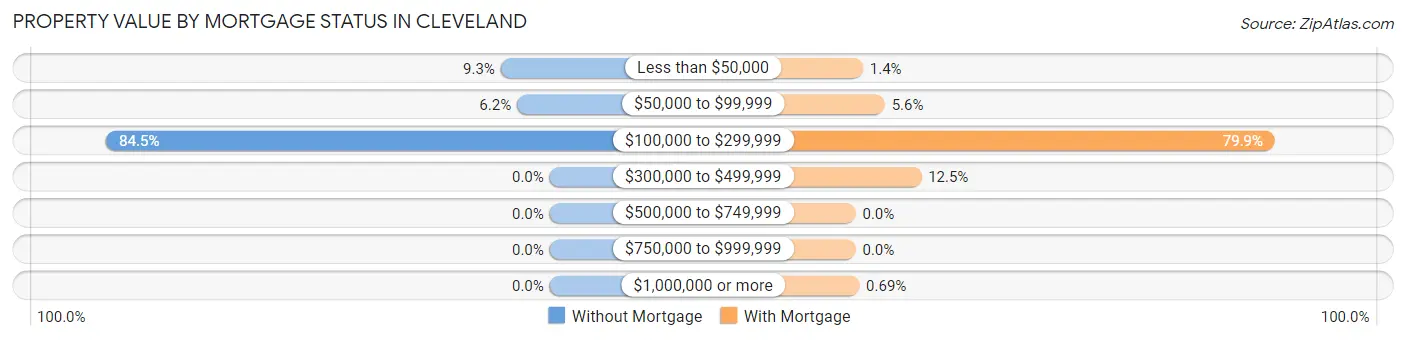
| Property Value | Without Mortgage | With Mortgage |
| Less than $50,000 | 15 (9.3%) | 2 (1.4%) |
| $50,000 to $99,999 | 10 (6.2%) | 8 (5.6%) |
| $100,000 to $299,999 | 136 (84.5%) | 115 (79.9%) |
| $300,000 to $499,999 | 0 (0.0%) | 18 (12.5%) |
| $500,000 to $749,999 | 0 (0.0%) | 0 (0.0%) |
| $750,000 to $999,999 | 0 (0.0%) | 0 (0.0%) |
| $1,000,000 or more | 0 (0.0%) | 1 (0.7%) |
| Total | 161 (100.0%) | 144 (100.0%) |
Household Income by Mortgage Status in Cleveland
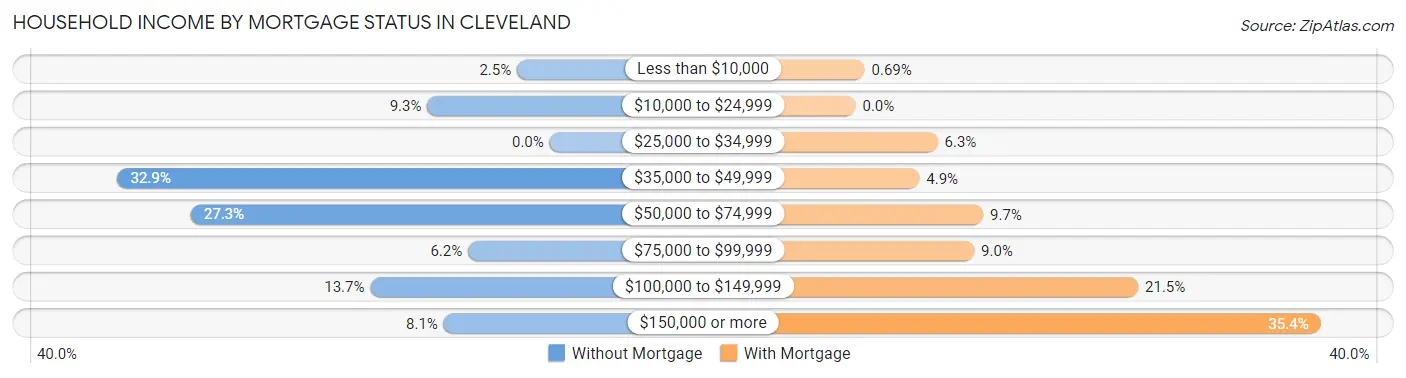
| Household Income | Without Mortgage | With Mortgage |
| Less than $10,000 | 4 (2.5%) | 1 (0.7%) |
| $10,000 to $24,999 | 15 (9.3%) | 0 (0.0%) |
| $25,000 to $34,999 | 0 (0.0%) | 9 (6.2%) |
| $35,000 to $49,999 | 53 (32.9%) | 7 (4.9%) |
| $50,000 to $74,999 | 44 (27.3%) | 14 (9.7%) |
| $75,000 to $99,999 | 10 (6.2%) | 13 (9.0%) |
| $100,000 to $149,999 | 22 (13.7%) | 31 (21.5%) |
| $150,000 or more | 13 (8.1%) | 51 (35.4%) |
| Total | 161 (100.0%) | 144 (100.0%) |
Property Value to Household Income Ratio in Cleveland
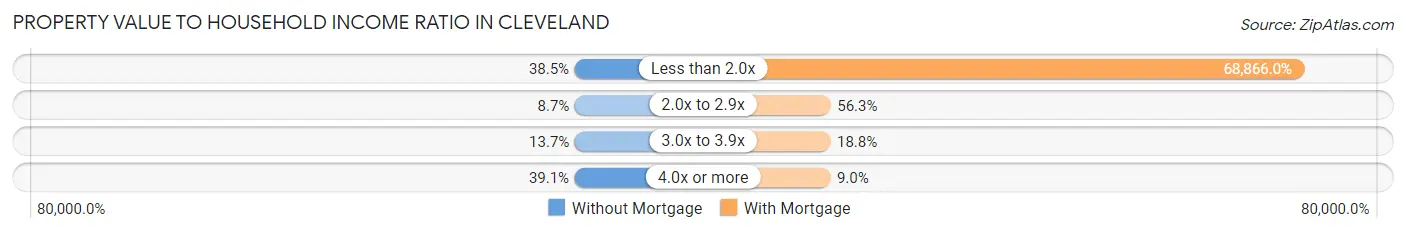
| Value-to-Income Ratio | Without Mortgage | With Mortgage |
| Less than 2.0x | 62 (38.5%) | 99,167 (68,866.0%) |
| 2.0x to 2.9x | 14 (8.7%) | 81 (56.2%) |
| 3.0x to 3.9x | 22 (13.7%) | 27 (18.8%) |
| 4.0x or more | 63 (39.1%) | 13 (9.0%) |
| Total | 161 (100.0%) | 144 (100.0%) |
Real Estate Taxes by Mortgage Status in Cleveland
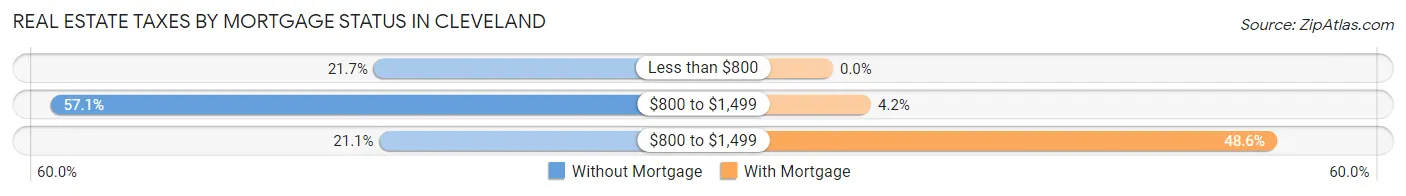
| Property Taxes | Without Mortgage | With Mortgage |
| Less than $800 | 35 (21.7%) | 0 (0.0%) |
| $800 to $1,499 | 92 (57.1%) | 6 (4.2%) |
| $800 to $1,499 | 34 (21.1%) | 70 (48.6%) |
| Total | 161 (100.0%) | 144 (100.0%) |
Health & Disability in Cleveland
Health Insurance Coverage by Age in Cleveland
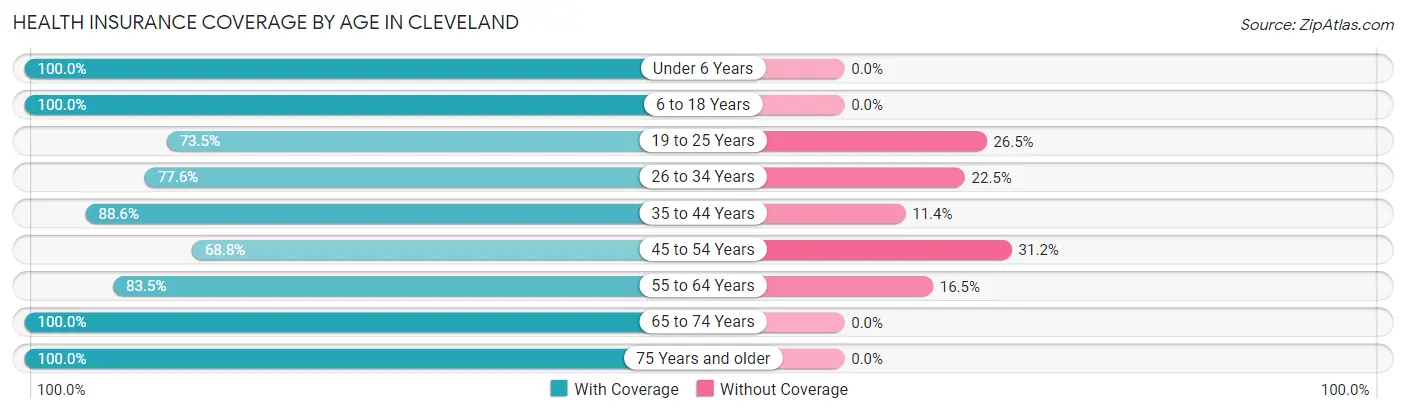
| Age Bracket | With Coverage | Without Coverage |
| Under 6 Years | 137 (100.0%) | 0 (0.0%) |
| 6 to 18 Years | 255 (100.0%) | 0 (0.0%) |
| 19 to 25 Years | 61 (73.5%) | 22 (26.5%) |
| 26 to 34 Years | 190 (77.5%) | 55 (22.5%) |
| 35 to 44 Years | 109 (88.6%) | 14 (11.4%) |
| 45 to 54 Years | 97 (68.8%) | 44 (31.2%) |
| 55 to 64 Years | 86 (83.5%) | 17 (16.5%) |
| 65 to 74 Years | 82 (100.0%) | 0 (0.0%) |
| 75 Years and older | 75 (100.0%) | 0 (0.0%) |
| Total | 1,092 (87.8%) | 152 (12.2%) |
Health Insurance Coverage by Citizenship Status in Cleveland
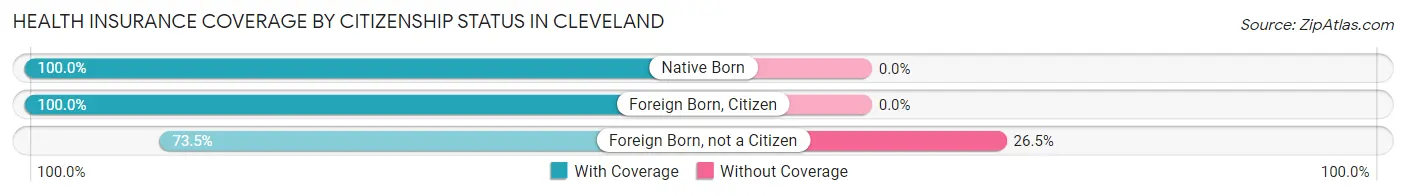
| Citizenship Status | With Coverage | Without Coverage |
| Native Born | 137 (100.0%) | 0 (0.0%) |
| Foreign Born, Citizen | 255 (100.0%) | 0 (0.0%) |
| Foreign Born, not a Citizen | 61 (73.5%) | 22 (26.5%) |
Health Insurance Coverage by Household Income in Cleveland
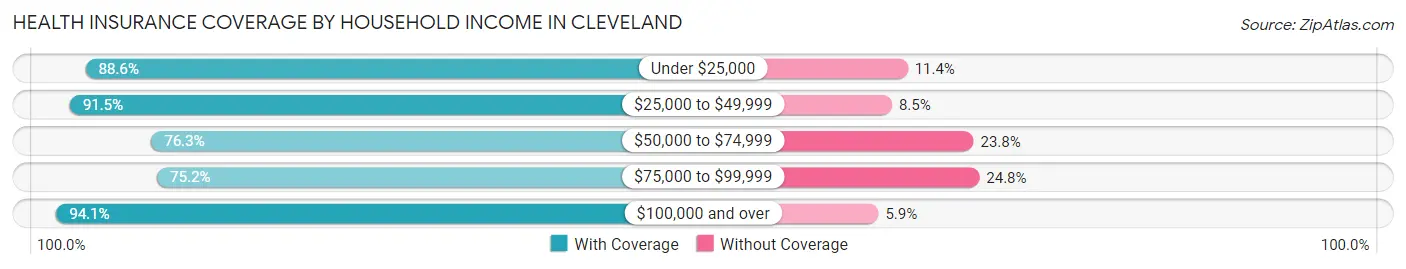
| Household Income | With Coverage | Without Coverage |
| Under $25,000 | 233 (88.6%) | 30 (11.4%) |
| $25,000 to $49,999 | 173 (91.5%) | 16 (8.5%) |
| $50,000 to $74,999 | 122 (76.2%) | 38 (23.7%) |
| $75,000 to $99,999 | 121 (75.2%) | 40 (24.8%) |
| $100,000 and over | 443 (94.1%) | 28 (5.9%) |
Public vs Private Health Insurance Coverage by Age in Cleveland
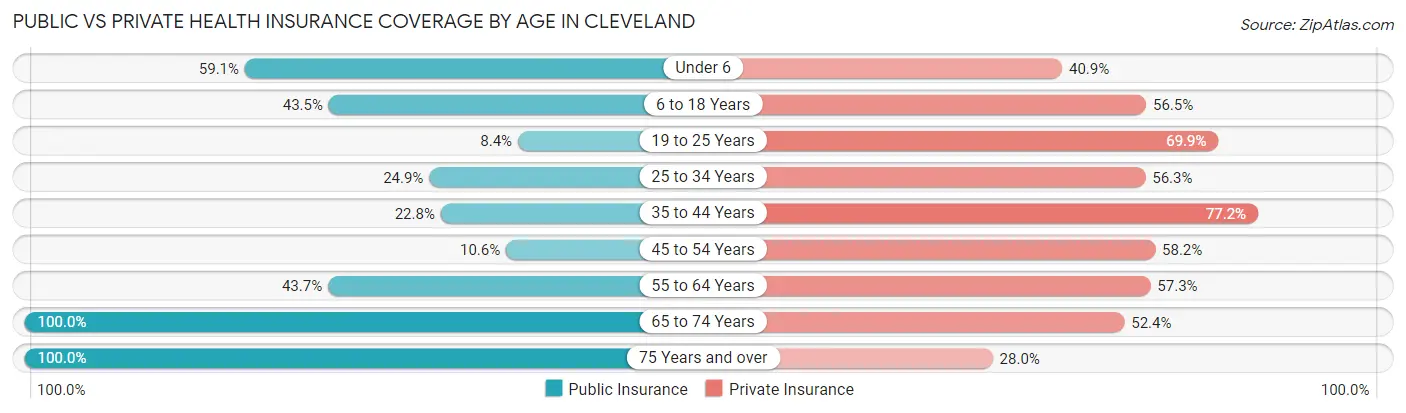
| Age Bracket | Public Insurance | Private Insurance |
| Under 6 | 81 (59.1%) | 56 (40.9%) |
| 6 to 18 Years | 111 (43.5%) | 144 (56.5%) |
| 19 to 25 Years | 7 (8.4%) | 58 (69.9%) |
| 25 to 34 Years | 61 (24.9%) | 138 (56.3%) |
| 35 to 44 Years | 28 (22.8%) | 95 (77.2%) |
| 45 to 54 Years | 15 (10.6%) | 82 (58.2%) |
| 55 to 64 Years | 45 (43.7%) | 59 (57.3%) |
| 65 to 74 Years | 82 (100.0%) | 43 (52.4%) |
| 75 Years and over | 75 (100.0%) | 21 (28.0%) |
| Total | 505 (40.6%) | 696 (55.9%) |
Disability Status by Sex by Age in Cleveland
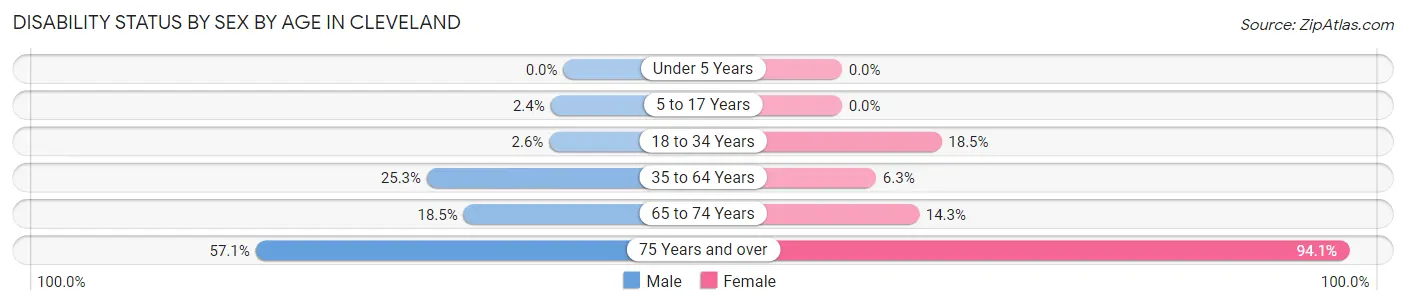
| Age Bracket | Male | Female |
| Under 5 Years | 0 (0.0%) | 0 (0.0%) |
| 5 to 17 Years | 4 (2.4%) | 0 (0.0%) |
| 18 to 34 Years | 4 (2.6%) | 34 (18.5%) |
| 35 to 64 Years | 37 (25.3%) | 14 (6.3%) |
| 65 to 74 Years | 10 (18.5%) | 4 (14.3%) |
| 75 Years and over | 4 (57.1%) | 64 (94.1%) |
Disability Class by Sex by Age in Cleveland
Disability Class: Hearing Difficulty
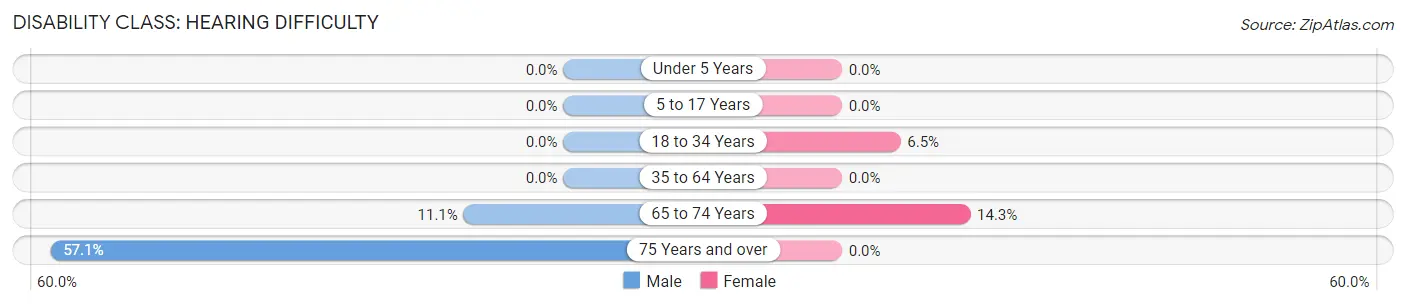
| Age Bracket | Male | Female |
| Under 5 Years | 0 (0.0%) | 0 (0.0%) |
| 5 to 17 Years | 0 (0.0%) | 0 (0.0%) |
| 18 to 34 Years | 0 (0.0%) | 12 (6.5%) |
| 35 to 64 Years | 0 (0.0%) | 0 (0.0%) |
| 65 to 74 Years | 6 (11.1%) | 4 (14.3%) |
| 75 Years and over | 4 (57.1%) | 0 (0.0%) |
Disability Class: Vision Difficulty
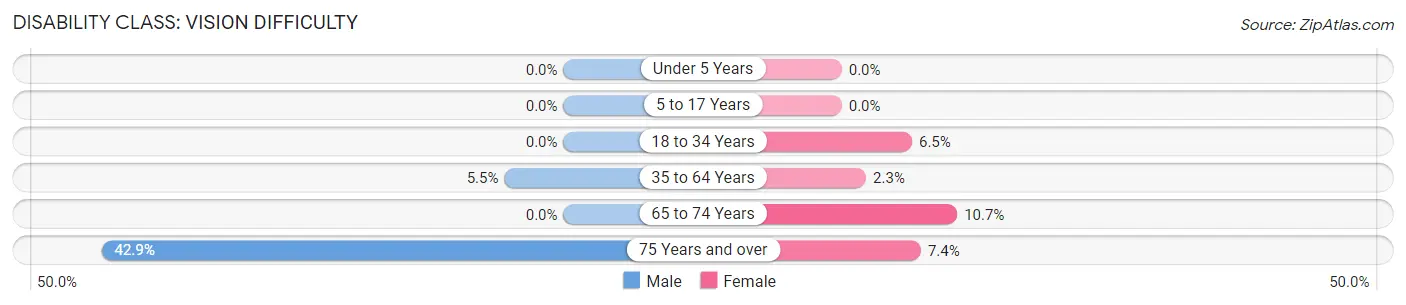
| Age Bracket | Male | Female |
| Under 5 Years | 0 (0.0%) | 0 (0.0%) |
| 5 to 17 Years | 0 (0.0%) | 0 (0.0%) |
| 18 to 34 Years | 0 (0.0%) | 12 (6.5%) |
| 35 to 64 Years | 8 (5.5%) | 5 (2.3%) |
| 65 to 74 Years | 0 (0.0%) | 3 (10.7%) |
| 75 Years and over | 3 (42.9%) | 5 (7.3%) |
Disability Class: Cognitive Difficulty
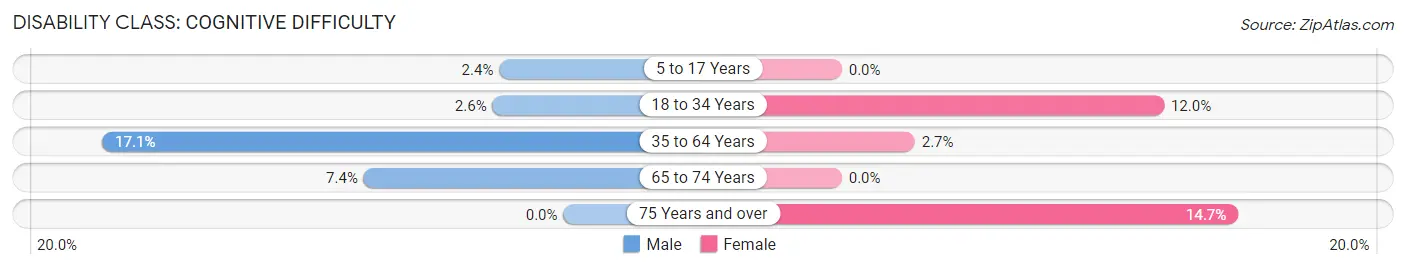
| Age Bracket | Male | Female |
| 5 to 17 Years | 4 (2.4%) | 0 (0.0%) |
| 18 to 34 Years | 4 (2.6%) | 22 (12.0%) |
| 35 to 64 Years | 25 (17.1%) | 6 (2.7%) |
| 65 to 74 Years | 4 (7.4%) | 0 (0.0%) |
| 75 Years and over | 0 (0.0%) | 10 (14.7%) |
Disability Class: Ambulatory Difficulty
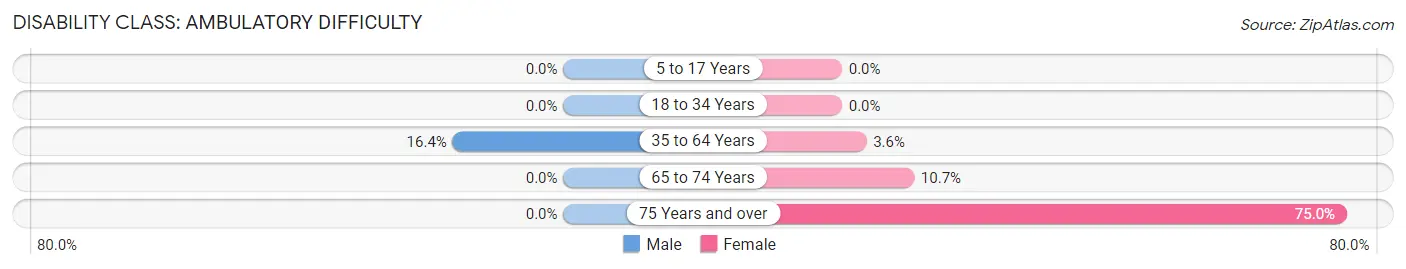
| Age Bracket | Male | Female |
| 5 to 17 Years | 0 (0.0%) | 0 (0.0%) |
| 18 to 34 Years | 0 (0.0%) | 0 (0.0%) |
| 35 to 64 Years | 24 (16.4%) | 8 (3.6%) |
| 65 to 74 Years | 0 (0.0%) | 3 (10.7%) |
| 75 Years and over | 0 (0.0%) | 51 (75.0%) |
Disability Class: Self-Care Difficulty
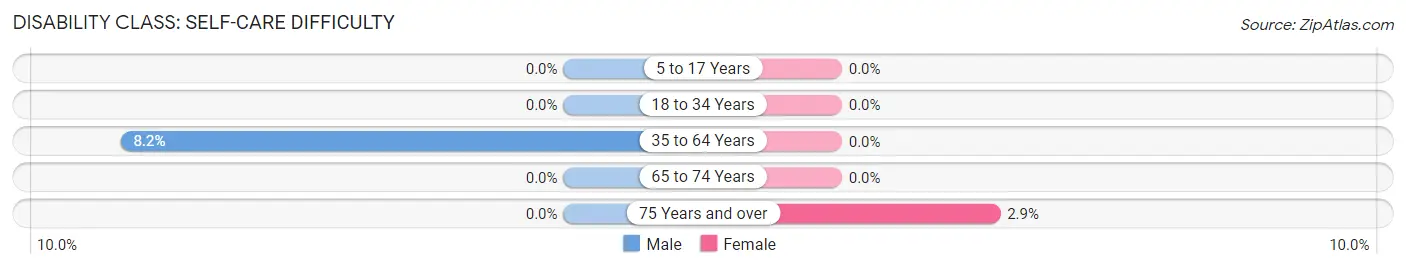
| Age Bracket | Male | Female |
| 5 to 17 Years | 0 (0.0%) | 0 (0.0%) |
| 18 to 34 Years | 0 (0.0%) | 0 (0.0%) |
| 35 to 64 Years | 12 (8.2%) | 0 (0.0%) |
| 65 to 74 Years | 0 (0.0%) | 0 (0.0%) |
| 75 Years and over | 0 (0.0%) | 2 (2.9%) |
Technology Access in Cleveland
Computing Device Access in Cleveland
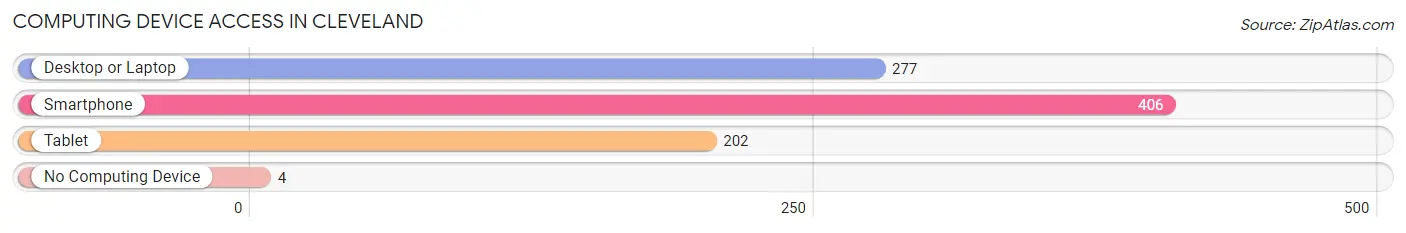
| Device Type | # Households | % Households |
| Desktop or Laptop | 277 | 62.4% |
| Smartphone | 406 | 91.4% |
| Tablet | 202 | 45.5% |
| No Computing Device | 4 | 0.9% |
| Total | 444 | 100.0% |
Internet Access in Cleveland
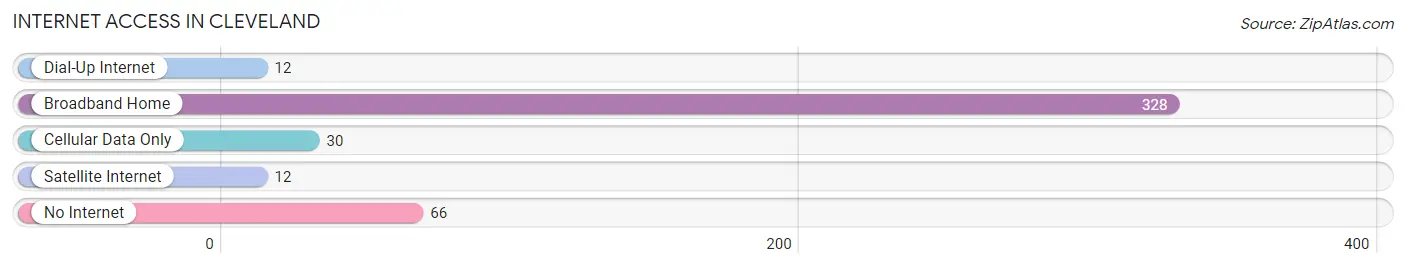
| Internet Type | # Households | % Households |
| Dial-Up Internet | 12 | 2.7% |
| Broadband Home | 328 | 73.9% |
| Cellular Data Only | 30 | 6.8% |
| Satellite Internet | 12 | 2.7% |
| No Internet | 66 | 14.9% |
| Total | 444 | 100.0% |
Cleveland Summary
Cleveland is a small town located in the foothills of the Blue Ridge Mountains in North Carolina. It is situated in the southwestern corner of the state, about 25 miles west of Asheville. The town was founded in 1887 and named after President Grover Cleveland. It has a population of about 1,500 people and is the county seat of Rowan County.
Geography
Cleveland is located in the foothills of the Blue Ridge Mountains in western North Carolina. The town is situated in the southwestern corner of the state, about 25 miles west of Asheville. The town is surrounded by rolling hills and is situated at an elevation of 1,400 feet. The town is located in the Yadkin-Pee Dee River Basin and is part of the Catawba River watershed. The town is located in a temperate climate zone and experiences mild winters and hot summers.
Economy
Cleveland’s economy is largely based on agriculture and tourism. The town is home to several farms, including a dairy farm, a beef cattle farm, and a vegetable farm. The town is also home to several small businesses, including a hardware store, a grocery store, and a restaurant. The town is also home to several tourist attractions, including the historic Cleveland County Courthouse, the Cleveland County Museum, and the Cleveland County Fairgrounds.
Demographics
As of the 2010 census, the population of Cleveland was 1,521. The racial makeup of the town was 94.3% White, 2.7% African American, 0.3% Native American, 0.3% Asian, 0.1% Pacific Islander, 1.2% from other races, and 1.3% from two or more races. Hispanic or Latino of any race were 2.7% of the population. The median household income was $35,938 and the median family income was $41,250.
Conclusion
Cleveland is a small town located in the foothills of the Blue Ridge Mountains in western North Carolina. It is situated in the southwestern corner of the state, about 25 miles west of Asheville. The town was founded in 1887 and has a population of about 1,500 people. The town’s economy is largely based on agriculture and tourism. The racial makeup of the town is 94.3% White, 2.7% African American, 0.3% Native American, 0.3% Asian, 0.1% Pacific Islander, 1.2% from other races, and 1.3% from two or more races. The median household income was $35,938 and the median family income was $41,250.
Common Questions
What is Per Capita Income in Cleveland?
Per Capita income in Cleveland is $26,817.
What is the Median Family Income in Cleveland?
Median Family Income in Cleveland is $82,727.
What is the Median Household income in Cleveland?
Median Household Income in Cleveland is $56,250.
What is Income or Wage Gap in Cleveland?
Income or Wage Gap in Cleveland is 38.5%.
Women in Cleveland earn 61.5 cents for every dollar earned by a man.
What is Inequality or Gini Index in Cleveland?
Inequality or Gini Index in Cleveland is 0.42.
What is the Total Population of Cleveland?
Total Population of Cleveland is 1,244.
What is the Total Male Population of Cleveland?
Total Male Population of Cleveland is 586.
What is the Total Female Population of Cleveland?
Total Female Population of Cleveland is 658.
What is the Ratio of Males per 100 Females in Cleveland?
There are 89.06 Males per 100 Females in Cleveland.
What is the Ratio of Females per 100 Males in Cleveland?
There are 112.29 Females per 100 Males in Cleveland.
What is the Median Population Age in Cleveland?
Median Population Age in Cleveland is 29.6 Years.
What is the Average Family Size in Cleveland
Average Family Size in Cleveland is 3.4 People.
What is the Average Household Size in Cleveland
Average Household Size in Cleveland is 2.8 People.
How Large is the Labor Force in Cleveland?
There are 561 People in the Labor Forcein in Cleveland.
What is the Percentage of People in the Labor Force in Cleveland?
63.1% of People are in the Labor Force in Cleveland.
What is the Unemployment Rate in Cleveland?
Unemployment Rate in Cleveland is 8.0%.