Franklin, NC Map & Demographics
Franklin Map
Franklin Overview
$25,449
PER CAPITA INCOME
$56,852
AVG FAMILY INCOME
$38,947
AVG HOUSEHOLD INCOME
45.6%
WAGE / INCOME GAP [ % ]
54.4¢/ $1
WAGE / INCOME GAP [ $ ]
0.42
INEQUALITY / GINI INDEX
4,184
TOTAL POPULATION
2,156
MALE POPULATION
2,028
FEMALE POPULATION
106.31
MALES / 100 FEMALES
94.06
FEMALES / 100 MALES
48.0
MEDIAN AGE
2.9
AVG FAMILY SIZE
2.1
AVG HOUSEHOLD SIZE
1,816
LABOR FORCE [ PEOPLE ]
50.8%
PERCENT IN LABOR FORCE
3.7%
UNEMPLOYMENT RATE
Franklin Zip Codes
Franklin Area Codes
Income in Franklin
Income Overview in Franklin
Per Capita Income in Franklin is $25,449, while median incomes of families and households are $56,852 and $38,947 respectively.
| Characteristic | Number | Measure |
| Per Capita Income | 4,184 | $25,449 |
| Median Family Income | 1,108 | $56,852 |
| Mean Family Income | 1,108 | $69,501 |
| Median Household Income | 1,964 | $38,947 |
| Mean Household Income | 1,964 | $55,084 |
| Income Deficit | 1,108 | $0 |
| Wage / Income Gap (%) | 4,184 | 45.63% |
| Wage / Income Gap ($) | 4,184 | 54.37¢ per $1 |
| Gini / Inequality Index | 4,184 | 0.42 |
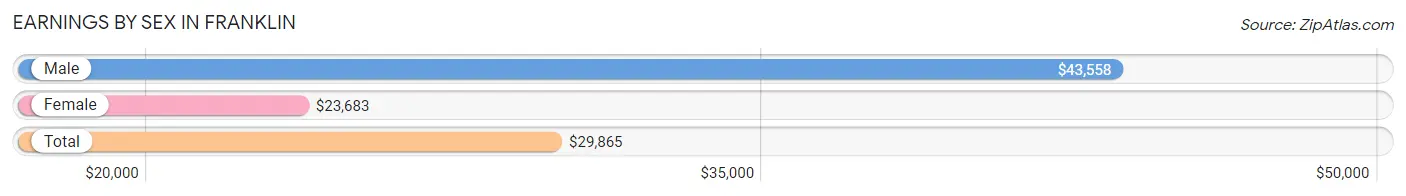
Earnings by Sex in Franklin
Average Earnings in Franklin are $29,865, $43,558 for men and $23,683 for women, a difference of 45.6%.
| Sex | Number | Average Earnings |
| Male | 892 (48.7%) | $43,558 |
| Female | 940 (51.3%) | $23,683 |
| Total | 1,832 (100.0%) | $29,865 |
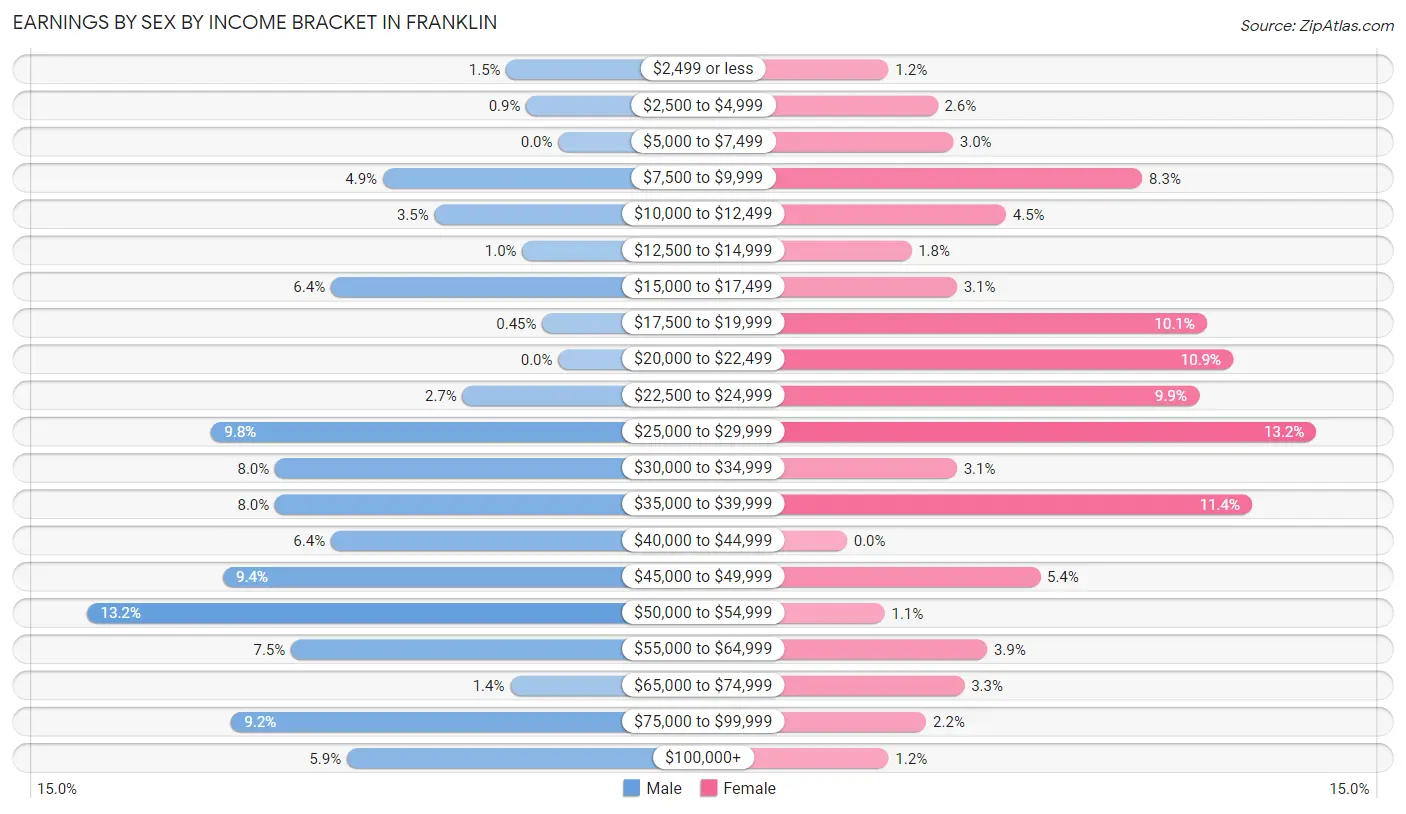
Earnings by Sex by Income Bracket in Franklin
The most common earnings brackets in Franklin are $50,000 to $54,999 for men (118 | 13.2%) and $25,000 to $29,999 for women (124 | 13.2%).
| Income | Male | Female |
| $2,499 or less | 13 (1.5%) | 11 (1.2%) |
| $2,500 to $4,999 | 8 (0.9%) | 24 (2.5%) |
| $5,000 to $7,499 | 0 (0.0%) | 28 (3.0%) |
| $7,500 to $9,999 | 44 (4.9%) | 78 (8.3%) |
| $10,000 to $12,499 | 31 (3.5%) | 42 (4.5%) |
| $12,500 to $14,999 | 9 (1.0%) | 17 (1.8%) |
| $15,000 to $17,499 | 57 (6.4%) | 29 (3.1%) |
| $17,500 to $19,999 | 4 (0.4%) | 95 (10.1%) |
| $20,000 to $22,499 | 0 (0.0%) | 102 (10.8%) |
| $22,500 to $24,999 | 24 (2.7%) | 93 (9.9%) |
| $25,000 to $29,999 | 87 (9.8%) | 124 (13.2%) |
| $30,000 to $34,999 | 71 (8.0%) | 29 (3.1%) |
| $35,000 to $39,999 | 71 (8.0%) | 107 (11.4%) |
| $40,000 to $44,999 | 57 (6.4%) | 0 (0.0%) |
| $45,000 to $49,999 | 84 (9.4%) | 51 (5.4%) |
| $50,000 to $54,999 | 118 (13.2%) | 10 (1.1%) |
| $55,000 to $64,999 | 67 (7.5%) | 37 (3.9%) |
| $65,000 to $74,999 | 12 (1.3%) | 31 (3.3%) |
| $75,000 to $99,999 | 82 (9.2%) | 21 (2.2%) |
| $100,000+ | 53 (5.9%) | 11 (1.2%) |
| Total | 892 (100.0%) | 940 (100.0%) |
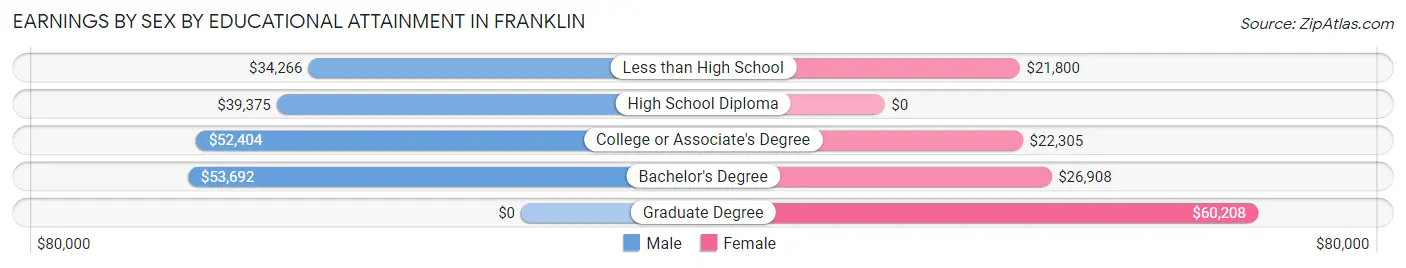
Earnings by Sex by Educational Attainment in Franklin
Average earnings in Franklin are $46,413 for men and $23,944 for women, a difference of 48.4%. Men with an educational attainment of bachelor's degree enjoy the highest average annual earnings of $53,692, while those with less than high school education earn the least with $34,266. Women with an educational attainment of graduate degree earn the most with the average annual earnings of $60,208, while those with less than high school education have the smallest earnings of $21,800.
| Educational Attainment | Male Income | Female Income |
| Less than High School | $34,266 | $21,800 |
| High School Diploma | $39,375 | $0 |
| College or Associate's Degree | $52,404 | $22,305 |
| Bachelor's Degree | $53,692 | $26,908 |
| Graduate Degree | - | - |
| Total | $46,413 | $23,944 |
Family Income in Franklin
Family Income Brackets in Franklin
According to the Franklin family income data, there are 238 families falling into the $50,000 to $74,999 income range, which is the most common income bracket and makes up 21.5% of all families.
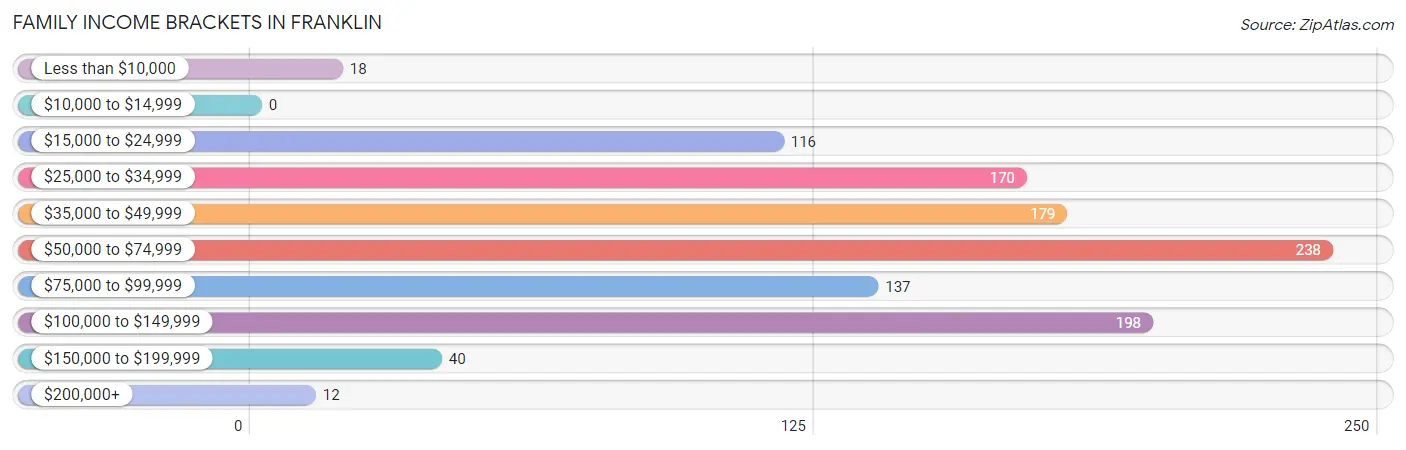
| Income Bracket | # Families | % Families |
| Less than $10,000 | 18 | 1.6% |
| $10,000 to $14,999 | 0 | 0.0% |
| $15,000 to $24,999 | 116 | 10.5% |
| $25,000 to $34,999 | 170 | 15.3% |
| $35,000 to $49,999 | 179 | 16.2% |
| $50,000 to $74,999 | 238 | 21.5% |
| $75,000 to $99,999 | 137 | 12.4% |
| $100,000 to $149,999 | 198 | 17.9% |
| $150,000 to $199,999 | 40 | 3.6% |
| $200,000+ | 12 | 1.1% |
Family Income by Famaliy Size in Franklin
4-person families (201 | 18.1%) account for the highest median family income in Franklin with $87,042 per family, while 2-person families (508 | 45.9%) have the highest median income of $24,834 per family member.
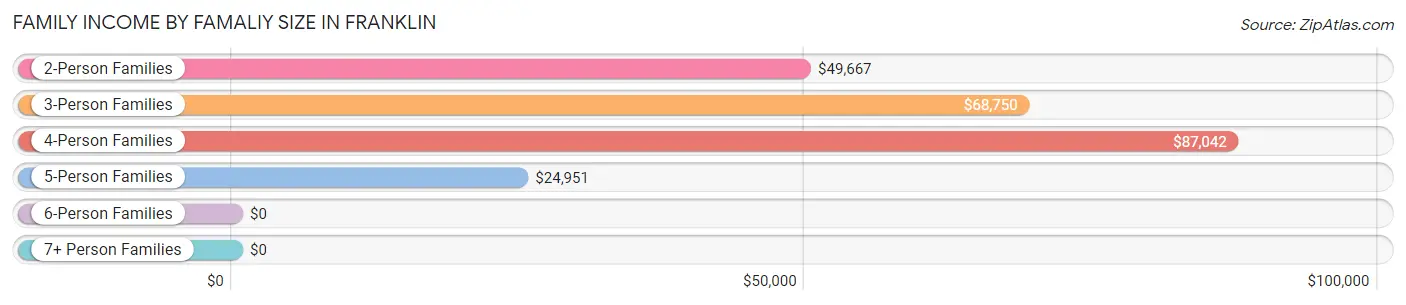
| Income Bracket | # Families | Median Income |
| 2-Person Families | 508 (45.9%) | $49,667 |
| 3-Person Families | 245 (22.1%) | $68,750 |
| 4-Person Families | 201 (18.1%) | $87,042 |
| 5-Person Families | 151 (13.6%) | $24,951 |
| 6-Person Families | 3 (0.3%) | $0 |
| 7+ Person Families | 0 (0.0%) | $0 |
| Total | 1,108 (100.0%) | $56,852 |
Family Income by Number of Earners in Franklin
The median family income in Franklin is $56,852, with families comprising 3+ earners (88) having the highest median family income of $122,045, while families with 1 earner (319) have the lowest median family income of $34,176, accounting for 7.9% and 28.8% of families, respectively.
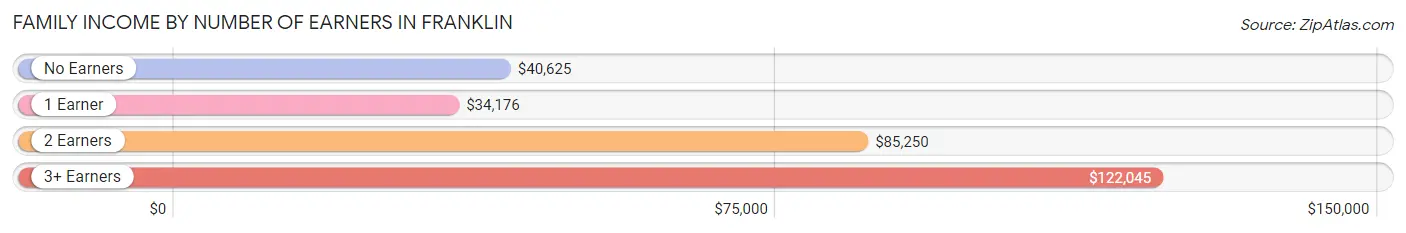
| Number of Earners | # Families | Median Income |
| No Earners | 257 (23.2%) | $40,625 |
| 1 Earner | 319 (28.8%) | $34,176 |
| 2 Earners | 444 (40.1%) | $85,250 |
| 3+ Earners | 88 (7.9%) | $122,045 |
| Total | 1,108 (100.0%) | $56,852 |
Household Income in Franklin
Household Income Brackets in Franklin
With 401 households falling in the category, the $15,000 to $24,999 income range is the most frequent in Franklin, accounting for 20.4% of all households. In contrast, only 20 households (1.0%) fall into the $200,000+ income bracket, making it the least populous group.
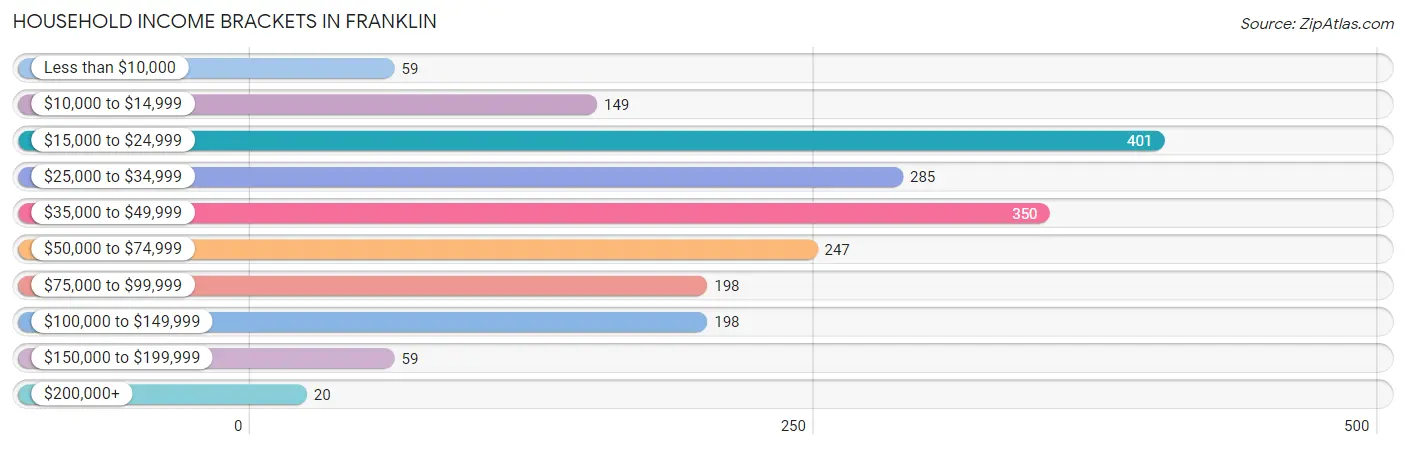
| Income Bracket | # Households | % Households |
| Less than $10,000 | 59 | 3.0% |
| $10,000 to $14,999 | 149 | 7.6% |
| $15,000 to $24,999 | 401 | 20.4% |
| $25,000 to $34,999 | 285 | 14.5% |
| $35,000 to $49,999 | 350 | 17.8% |
| $50,000 to $74,999 | 247 | 12.6% |
| $75,000 to $99,999 | 198 | 10.1% |
| $100,000 to $149,999 | 198 | 10.1% |
| $150,000 to $199,999 | 59 | 3.0% |
| $200,000+ | 20 | 1.0% |
Household Income by Householder Age in Franklin
The median household income in Franklin is $38,947, with the highest median household income of $56,392 found in the 45 to 64 years age bracket for the primary householder. A total of 739 households (37.6%) fall into this category. Meanwhile, the 15 to 24 years age bracket for the primary householder has the lowest median household income of $0, with 6 households (0.3%) in this group.
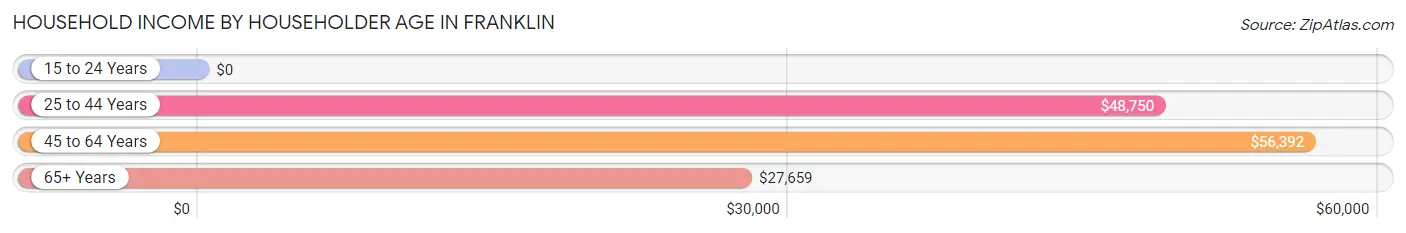
| Income Bracket | # Households | Median Income |
| 15 to 24 Years | 6 (0.3%) | $0 |
| 25 to 44 Years | 415 (21.1%) | $48,750 |
| 45 to 64 Years | 739 (37.6%) | $56,392 |
| 65+ Years | 804 (40.9%) | $27,659 |
| Total | 1,964 (100.0%) | $38,947 |
Poverty in Franklin
Income Below Poverty by Sex and Age in Franklin
With 26.9% poverty level for males and 18.7% for females among the residents of Franklin, 16 and 17 year old males and 6 to 11 year old females are the most vulnerable to poverty, with 101 males (100.0%) and 87 females (65.4%) in their respective age groups living below the poverty level.
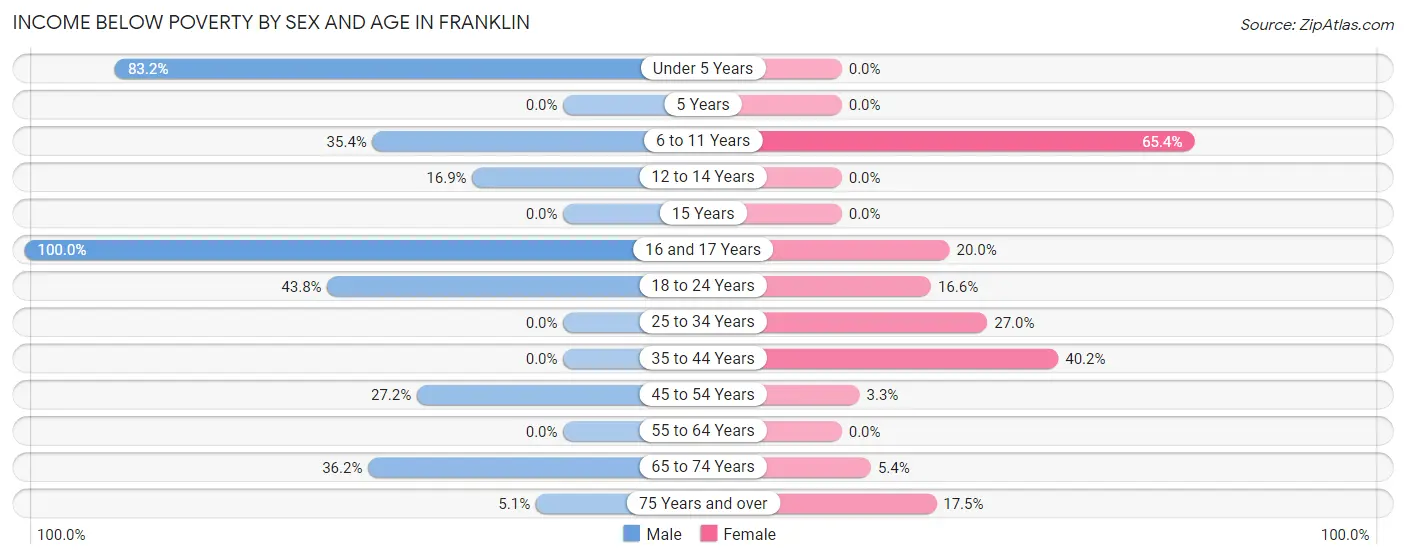
| Age Bracket | Male | Female |
| Under 5 Years | 119 (83.2%) | 0 (0.0%) |
| 5 Years | 0 (0.0%) | 0 (0.0%) |
| 6 to 11 Years | 40 (35.4%) | 87 (65.4%) |
| 12 to 14 Years | 13 (16.9%) | 0 (0.0%) |
| 15 Years | 0 (0.0%) | 0 (0.0%) |
| 16 and 17 Years | 101 (100.0%) | 14 (20.0%) |
| 18 to 24 Years | 127 (43.8%) | 25 (16.6%) |
| 25 to 34 Years | 0 (0.0%) | 37 (27.0%) |
| 35 to 44 Years | 0 (0.0%) | 125 (40.2%) |
| 45 to 54 Years | 79 (27.2%) | 7 (3.3%) |
| 55 to 64 Years | 0 (0.0%) | 0 (0.0%) |
| 65 to 74 Years | 92 (36.2%) | 11 (5.4%) |
| 75 Years and over | 9 (5.1%) | 74 (17.5%) |
| Total | 580 (26.9%) | 380 (18.7%) |
Income Above Poverty by Sex and Age in Franklin
According to the poverty statistics in Franklin, males aged 5 years and females aged under 5 years are the age groups that are most secure financially, with 100.0% of males and 100.0% of females in these age groups living above the poverty line.
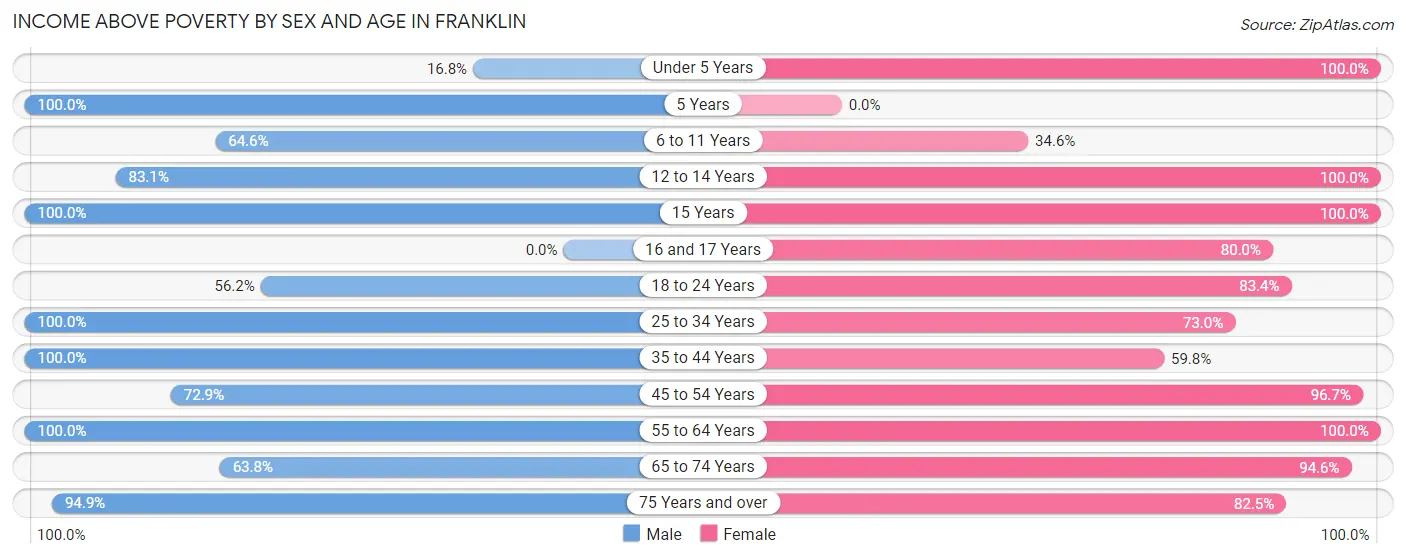
| Age Bracket | Male | Female |
| Under 5 Years | 24 (16.8%) | 23 (100.0%) |
| 5 Years | 13 (100.0%) | 0 (0.0%) |
| 6 to 11 Years | 73 (64.6%) | 46 (34.6%) |
| 12 to 14 Years | 64 (83.1%) | 61 (100.0%) |
| 15 Years | 3 (100.0%) | 44 (100.0%) |
| 16 and 17 Years | 0 (0.0%) | 56 (80.0%) |
| 18 to 24 Years | 163 (56.2%) | 126 (83.4%) |
| 25 to 34 Years | 109 (100.0%) | 100 (73.0%) |
| 35 to 44 Years | 162 (100.0%) | 186 (59.8%) |
| 45 to 54 Years | 212 (72.9%) | 205 (96.7%) |
| 55 to 64 Years | 423 (100.0%) | 261 (100.0%) |
| 65 to 74 Years | 162 (63.8%) | 192 (94.6%) |
| 75 Years and over | 168 (94.9%) | 348 (82.5%) |
| Total | 1,576 (73.1%) | 1,648 (81.3%) |
Income Below Poverty Among Married-Couple Families in Franklin
The poverty statistics for married-couple families in Franklin show that 3.7% or 26 of the total 694 families live below the poverty line. Families with 1 or 2 children have the highest poverty rate of 6.1%, comprising of 18 families. On the other hand, families with 3 or 4 children have the lowest poverty rate of 0.0%, which includes 0 families.
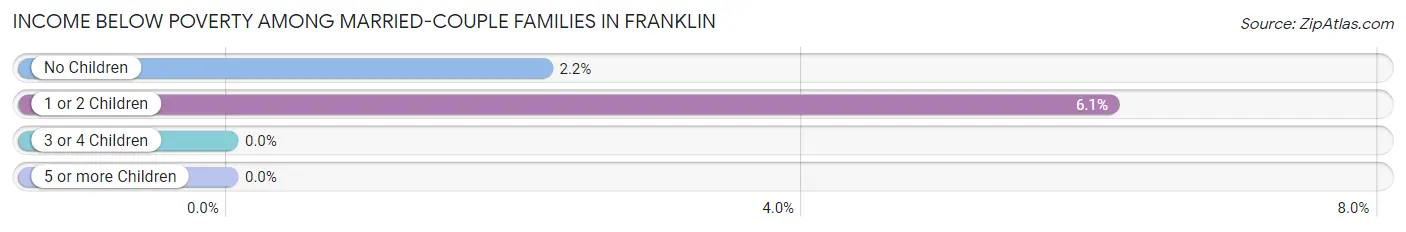
| Children | Above Poverty | Below Poverty |
| No Children | 357 (97.8%) | 8 (2.2%) |
| 1 or 2 Children | 275 (93.9%) | 18 (6.1%) |
| 3 or 4 Children | 36 (100.0%) | 0 (0.0%) |
| 5 or more Children | 0 (0.0%) | 0 (0.0%) |
| Total | 668 (96.3%) | 26 (3.7%) |
Income Below Poverty Among Single-Parent Households in Franklin
According to the poverty data in Franklin, 11.7% or 20 single-father households and 39.1% or 95 single-mother households are living below the poverty line. Among single-father households, those with 3 or 4 children have the highest poverty rate, with 20 households (100.0%) experiencing poverty. Likewise, among single-mother households, those with 3 or 4 children have the highest poverty rate, with 95 households (100.0%) falling below the poverty line.
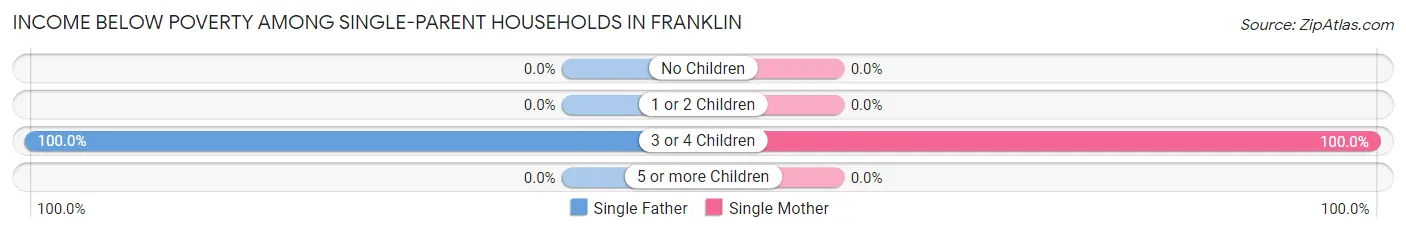
| Children | Single Father | Single Mother |
| No Children | 0 (0.0%) | 0 (0.0%) |
| 1 or 2 Children | 0 (0.0%) | 0 (0.0%) |
| 3 or 4 Children | 20 (100.0%) | 95 (100.0%) |
| 5 or more Children | 0 (0.0%) | 0 (0.0%) |
| Total | 20 (11.7%) | 95 (39.1%) |
Income Below Poverty Among Married-Couple vs Single-Parent Households in Franklin
The poverty data for Franklin shows that 26 of the married-couple family households (3.7%) and 115 of the single-parent households (27.8%) are living below the poverty level. Within the married-couple family households, those with 1 or 2 children have the highest poverty rate, with 18 households (6.1%) falling below the poverty line. Among the single-parent households, those with 3 or 4 children have the highest poverty rate, with 115 household (100.0%) living below poverty.
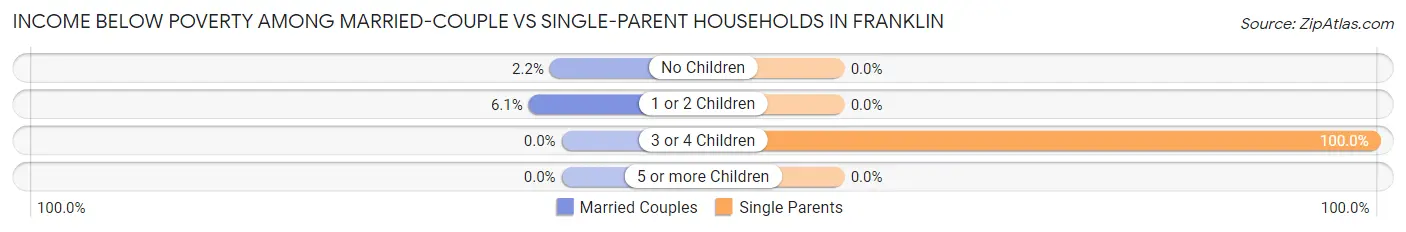
| Children | Married-Couple Families | Single-Parent Households |
| No Children | 8 (2.2%) | 0 (0.0%) |
| 1 or 2 Children | 18 (6.1%) | 0 (0.0%) |
| 3 or 4 Children | 0 (0.0%) | 115 (100.0%) |
| 5 or more Children | 0 (0.0%) | 0 (0.0%) |
| Total | 26 (3.7%) | 115 (27.8%) |
Race in Franklin
The most populous races in Franklin are White / Caucasian (3,442 | 82.3%), Hispanic or Latino (746 | 17.8%), and Two or more Races (409 | 9.8%).
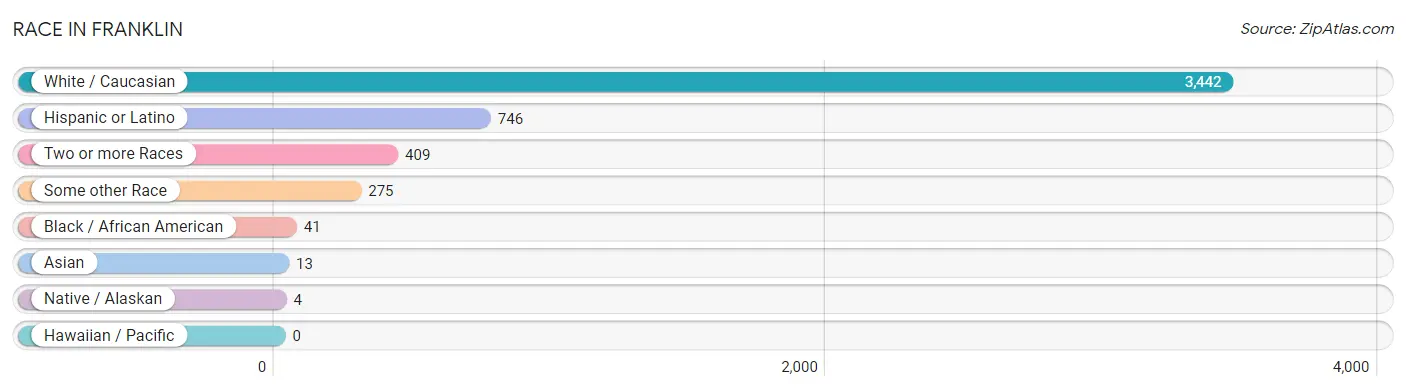
| Race | # Population | % Population |
| Asian | 13 | 0.3% |
| Black / African American | 41 | 1.0% |
| Hawaiian / Pacific | 0 | 0.0% |
| Hispanic or Latino | 746 | 17.8% |
| Native / Alaskan | 4 | 0.1% |
| White / Caucasian | 3,442 | 82.3% |
| Two or more Races | 409 | 9.8% |
| Some other Race | 275 | 6.6% |
| Total | 4,184 | 100.0% |
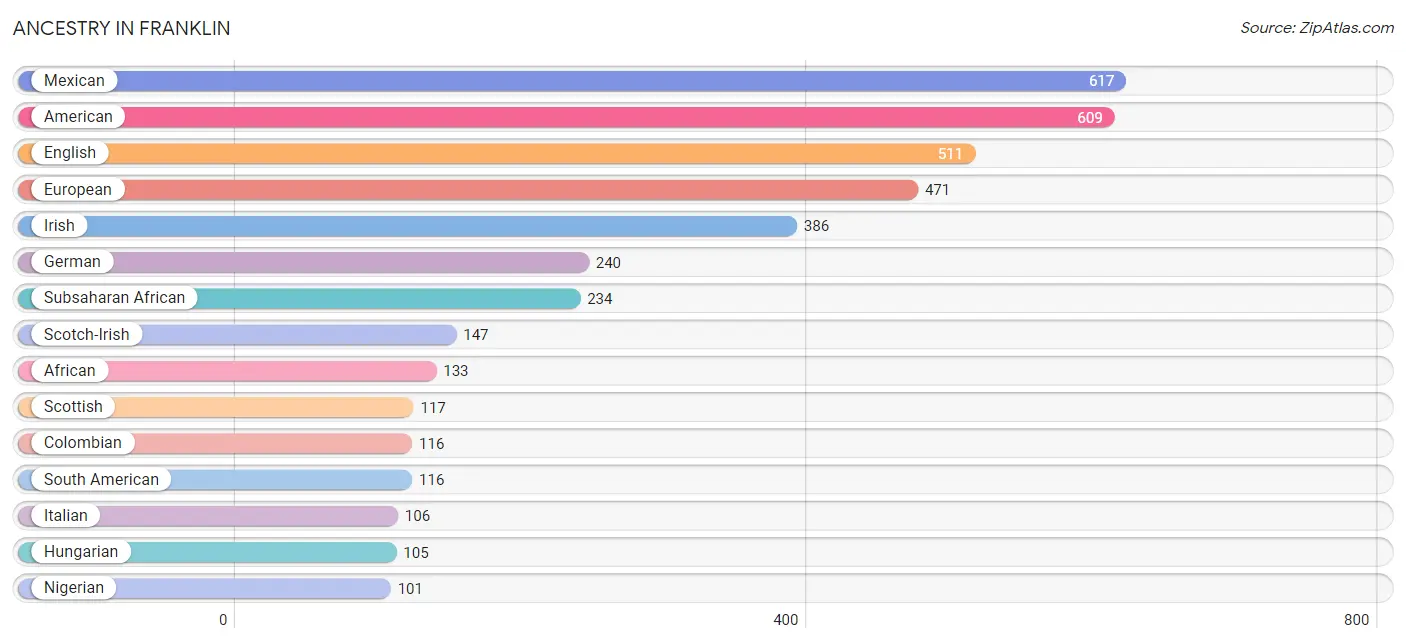
Ancestry in Franklin
The most populous ancestries reported in Franklin are Mexican (617 | 14.7%), American (609 | 14.6%), English (511 | 12.2%), European (471 | 11.3%), and Irish (386 | 9.2%), together accounting for 62.0% of all Franklin residents.
| Ancestry | # Population | % Population |
| African | 133 | 3.2% |
| American | 609 | 14.6% |
| Arab | 70 | 1.7% |
| Bhutanese | 13 | 0.3% |
| British | 7 | 0.2% |
| Cherokee | 19 | 0.4% |
| Choctaw | 4 | 0.1% |
| Colombian | 116 | 2.8% |
| Cuban | 13 | 0.3% |
| Czech | 5 | 0.1% |
| Danish | 12 | 0.3% |
| Dutch | 39 | 0.9% |
| Eastern European | 9 | 0.2% |
| English | 511 | 12.2% |
| European | 471 | 11.3% |
| Finnish | 33 | 0.8% |
| French | 79 | 1.9% |
| French Canadian | 17 | 0.4% |
| German | 240 | 5.7% |
| Hungarian | 105 | 2.5% |
| Irish | 386 | 9.2% |
| Italian | 106 | 2.5% |
| Mexican | 617 | 14.7% |
| Nigerian | 101 | 2.4% |
| Polish | 48 | 1.1% |
| Scotch-Irish | 147 | 3.5% |
| Scottish | 117 | 2.8% |
| South American | 116 | 2.8% |
| Subsaharan African | 234 | 5.6% |
| Swedish | 33 | 0.8% |
| Swiss | 15 | 0.4% | View All 31 Rows |
Immigrants in Franklin
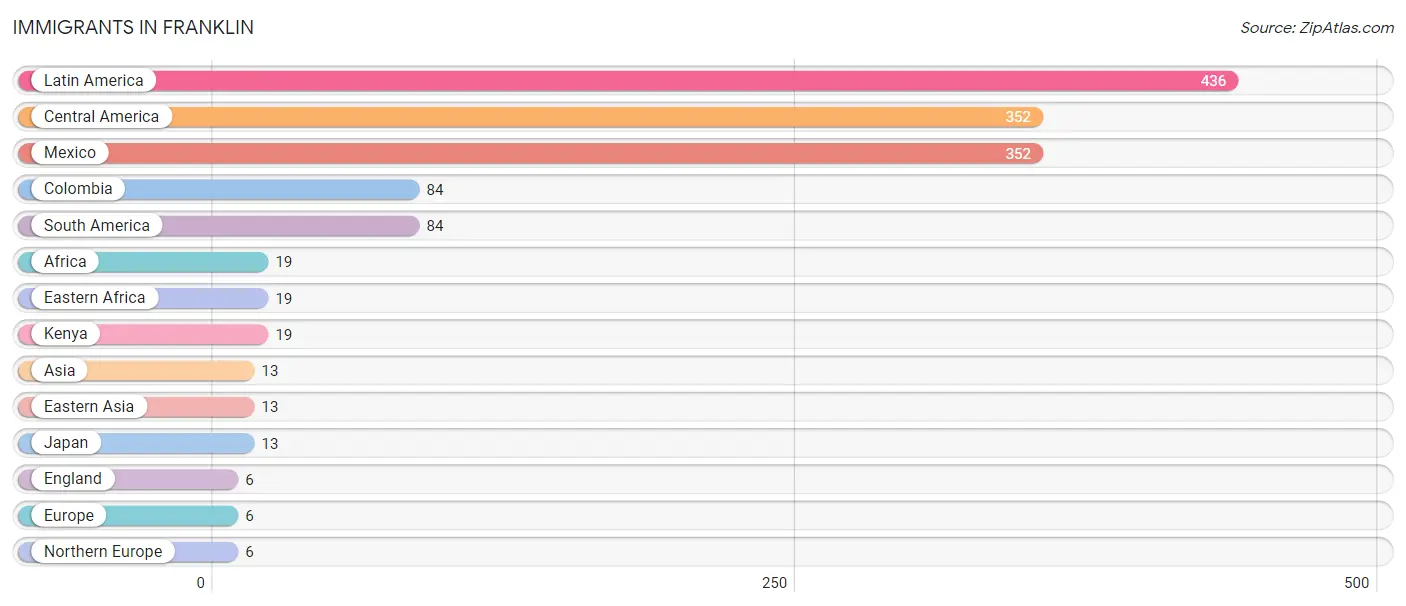
The most numerous immigrant groups reported in Franklin came from Latin America (436 | 10.4%), Central America (352 | 8.4%), Mexico (352 | 8.4%), Colombia (84 | 2.0%), and South America (84 | 2.0%), together accounting for 31.3% of all Franklin residents.
| Immigration Origin | # Population | % Population |
| Africa | 19 | 0.4% |
| Asia | 13 | 0.3% |
| Central America | 352 | 8.4% |
| Colombia | 84 | 2.0% |
| Eastern Africa | 19 | 0.4% |
| Eastern Asia | 13 | 0.3% |
| England | 6 | 0.1% |
| Europe | 6 | 0.1% |
| Japan | 13 | 0.3% |
| Kenya | 19 | 0.4% |
| Latin America | 436 | 10.4% |
| Mexico | 352 | 8.4% |
| Northern Europe | 6 | 0.1% |
| South America | 84 | 2.0% | View All 14 Rows |
Sex and Age in Franklin
Sex and Age in Franklin
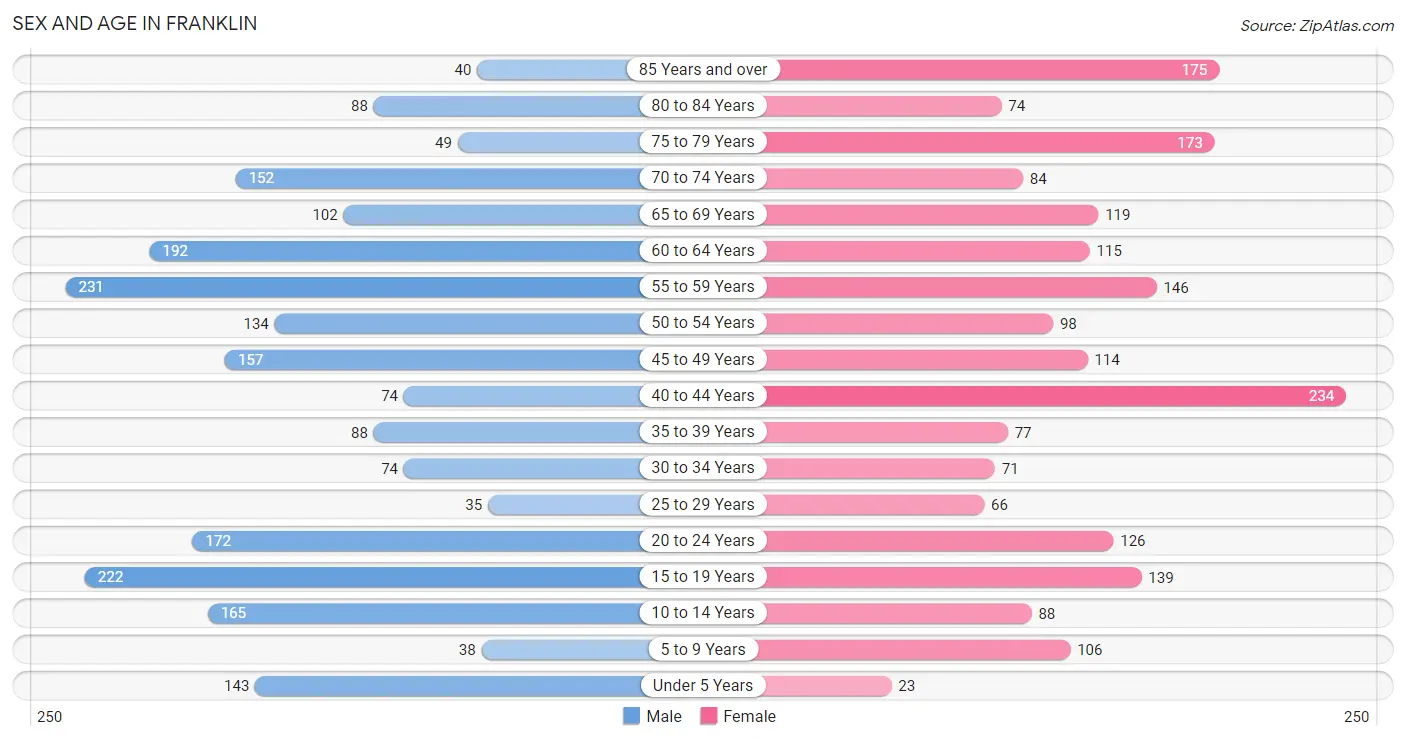
The most populous age groups in Franklin are 55 to 59 Years (231 | 10.7%) for men and 40 to 44 Years (234 | 11.5%) for women.
| Age Bracket | Male | Female |
| Under 5 Years | 143 (6.6%) | 23 (1.1%) |
| 5 to 9 Years | 38 (1.8%) | 106 (5.2%) |
| 10 to 14 Years | 165 (7.6%) | 88 (4.3%) |
| 15 to 19 Years | 222 (10.3%) | 139 (6.9%) |
| 20 to 24 Years | 172 (8.0%) | 126 (6.2%) |
| 25 to 29 Years | 35 (1.6%) | 66 (3.3%) |
| 30 to 34 Years | 74 (3.4%) | 71 (3.5%) |
| 35 to 39 Years | 88 (4.1%) | 77 (3.8%) |
| 40 to 44 Years | 74 (3.4%) | 234 (11.5%) |
| 45 to 49 Years | 157 (7.3%) | 114 (5.6%) |
| 50 to 54 Years | 134 (6.2%) | 98 (4.8%) |
| 55 to 59 Years | 231 (10.7%) | 146 (7.2%) |
| 60 to 64 Years | 192 (8.9%) | 115 (5.7%) |
| 65 to 69 Years | 102 (4.7%) | 119 (5.9%) |
| 70 to 74 Years | 152 (7.0%) | 84 (4.1%) |
| 75 to 79 Years | 49 (2.3%) | 173 (8.5%) |
| 80 to 84 Years | 88 (4.1%) | 74 (3.6%) |
| 85 Years and over | 40 (1.9%) | 175 (8.6%) |
| Total | 2,156 (100.0%) | 2,028 (100.0%) |
Families and Households in Franklin
Median Family Size in Franklin
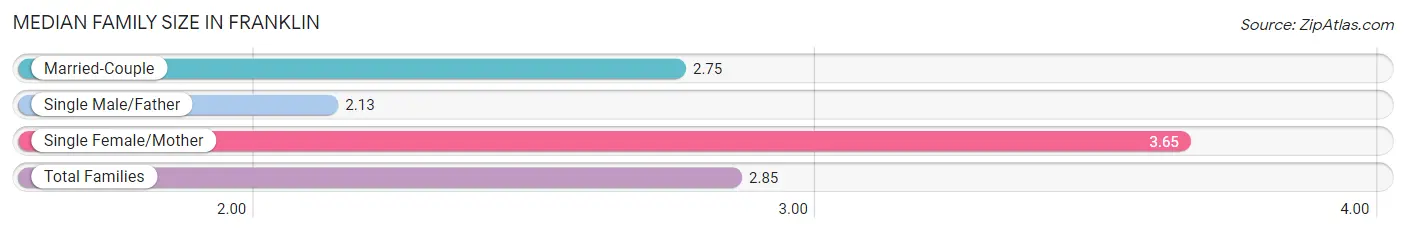
The median family size in Franklin is 2.85 persons per family, with single female/mother families (243 | 21.9%) accounting for the largest median family size of 3.65 persons per family. On the other hand, single male/father families (171 | 15.4%) represent the smallest median family size with 2.13 persons per family.
| Family Type | # Families | Family Size |
| Married-Couple | 694 (62.6%) | 2.75 |
| Single Male/Father | 171 (15.4%) | 2.13 |
| Single Female/Mother | 243 (21.9%) | 3.65 |
| Total Families | 1,108 (100.0%) | 2.85 |
Median Household Size in Franklin
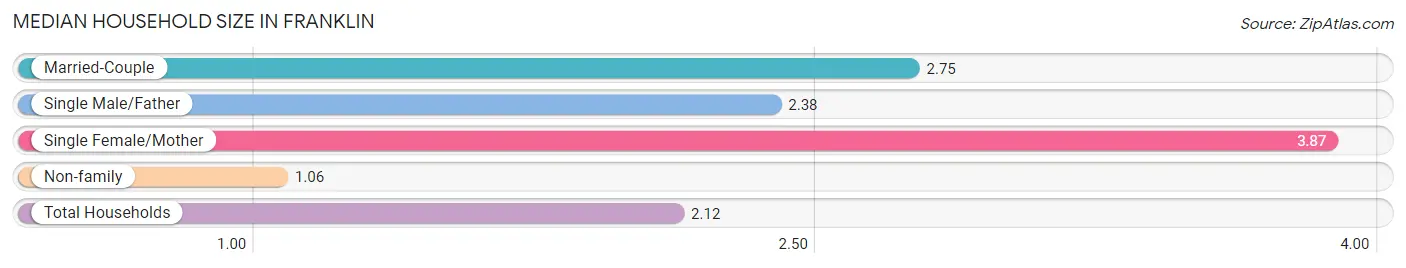
The median household size in Franklin is 2.12 persons per household, with single female/mother households (243 | 12.4%) accounting for the largest median household size of 3.87 persons per household. non-family households (856 | 43.6%) represent the smallest median household size with 1.06 persons per household.
| Household Type | # Households | Household Size |
| Married-Couple | 694 (35.3%) | 2.75 |
| Single Male/Father | 171 (8.7%) | 2.38 |
| Single Female/Mother | 243 (12.4%) | 3.87 |
| Non-family | 856 (43.6%) | 1.06 |
| Total Households | 1,964 (100.0%) | 2.12 |
Household Size by Marriage Status in Franklin
Out of a total of 1,964 households in Franklin, 1,108 (56.4%) are family households, while 856 (43.6%) are nonfamily households. The most numerous type of family households are 2-person households, comprising 490, and the most common type of nonfamily households are 1-person households, comprising 802.
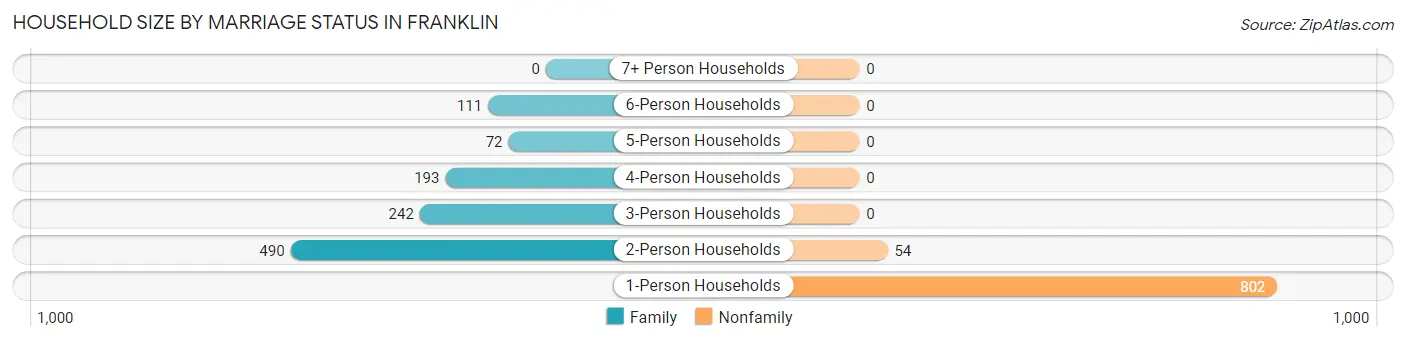
| Household Size | Family Households | Nonfamily Households |
| 1-Person Households | - | 802 (40.8%) |
| 2-Person Households | 490 (24.9%) | 54 (2.8%) |
| 3-Person Households | 242 (12.3%) | 0 (0.0%) |
| 4-Person Households | 193 (9.8%) | 0 (0.0%) |
| 5-Person Households | 72 (3.7%) | 0 (0.0%) |
| 6-Person Households | 111 (5.7%) | 0 (0.0%) |
| 7+ Person Households | 0 (0.0%) | 0 (0.0%) |
| Total | 1,108 (56.4%) | 856 (43.6%) |
Female Fertility in Franklin
Fertility by Age in Franklin
Average fertility rate in Franklin is 31.0 births per 1,000 women. Women in the age bracket of 15 to 19 years have the highest fertility rate with 165.0 births per 1,000 women. Women in the age bracket of 15 to 19 years acount for 88.5% of all women with births.
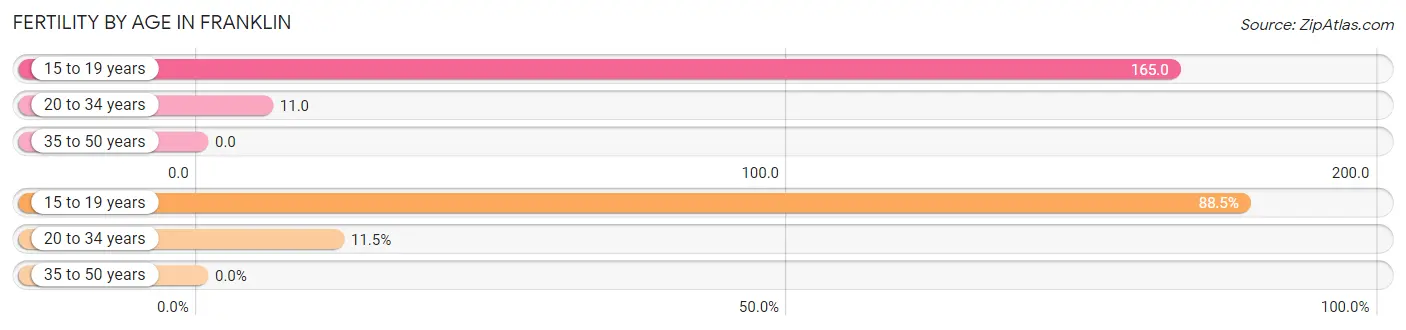
| Age Bracket | Women with Births | Births / 1,000 Women |
| 15 to 19 years | 23 (88.5%) | 165.0 |
| 20 to 34 years | 3 (11.5%) | 11.0 |
| 35 to 50 years | 0 (0.0%) | 0.0 |
| Total | 26 (100.0%) | 31.0 |
Fertility by Age by Marriage Status in Franklin
11.5% of women with births (26) in Franklin are married. The highest percentage of unmarried women with births falls into 15 to 19 years age bracket with 100.0% of them unmarried at the time of birth, while the lowest percentage of unmarried women with births belong to 20 to 34 years age bracket with 0.0% of them unmarried.
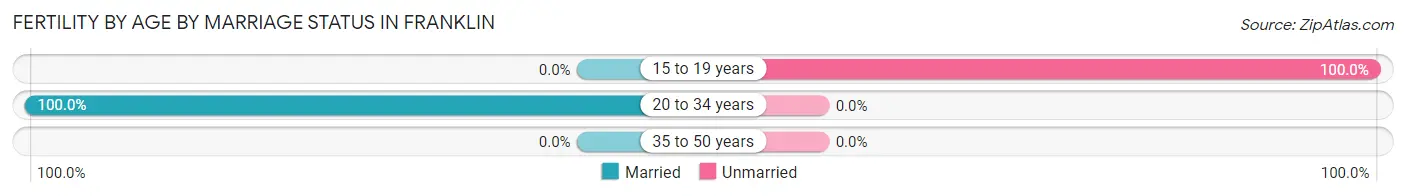
| Age Bracket | Married | Unmarried |
| 15 to 19 years | 0 (0.0%) | 23 (100.0%) |
| 20 to 34 years | 3 (100.0%) | 0 (0.0%) |
| 35 to 50 years | 0 (0.0%) | 0 (0.0%) |
| Total | 3 (11.5%) | 23 (88.5%) |
Fertility by Education in Franklin
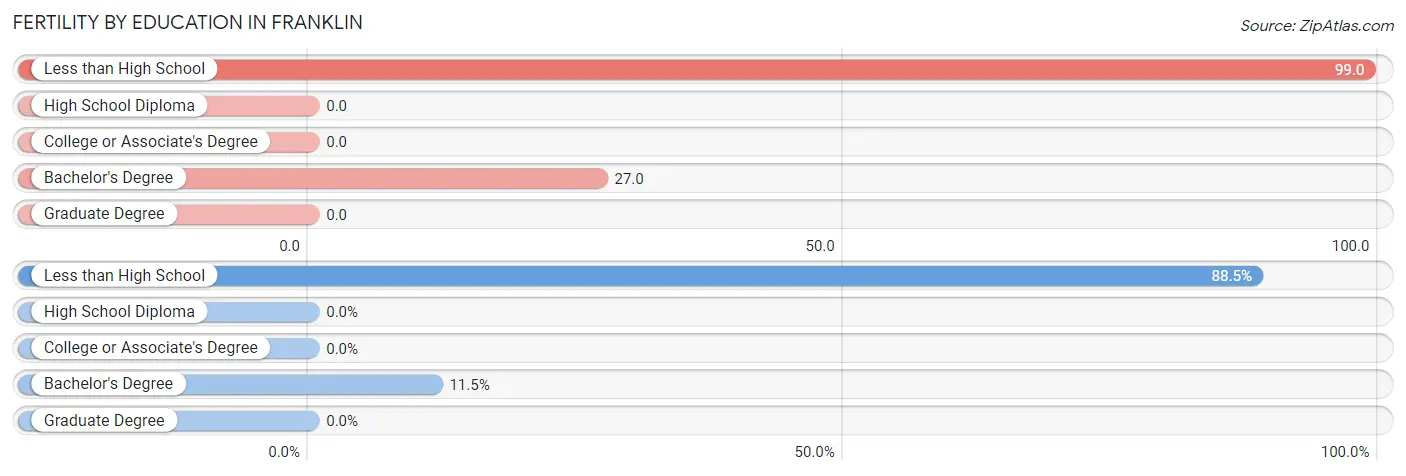
| Educational Attainment | Women with Births | Births / 1,000 Women |
| Less than High School | 23 (88.5%) | 99.0 |
| High School Diploma | 0 (0.0%) | 0.0 |
| College or Associate's Degree | 0 (0.0%) | 0.0 |
| Bachelor's Degree | 3 (11.5%) | 27.0 |
| Graduate Degree | 0 (0.0%) | 0.0 |
| Total | 26 (100.0%) | 31.0 |
Fertility by Education by Marriage Status in Franklin
88.5% of women with births in Franklin are unmarried. Women with the educational attainment of bachelor's degree are most likely to be married with 100.0% of them married at childbirth, while women with the educational attainment of less than high school are least likely to be married with 100.0% of them unmarried at childbirth.
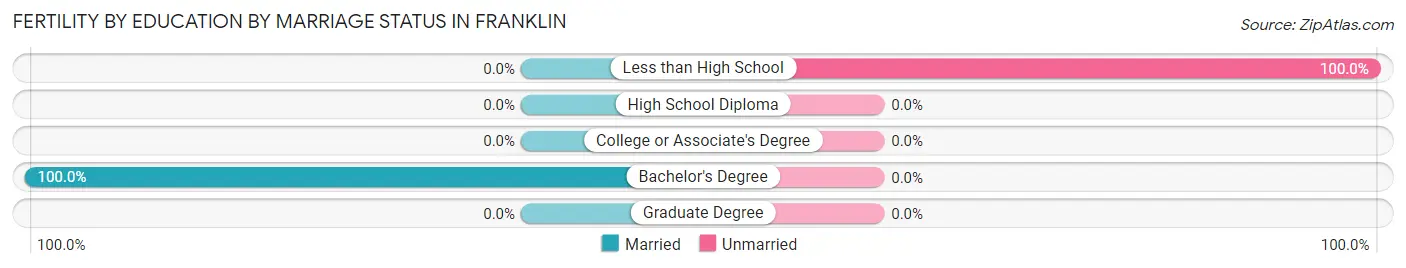
| Educational Attainment | Married | Unmarried |
| Less than High School | 0 (0.0%) | 23 (100.0%) |
| High School Diploma | 0 (0.0%) | 0 (0.0%) |
| College or Associate's Degree | 0 (0.0%) | 0 (0.0%) |
| Bachelor's Degree | 3 (100.0%) | 0 (0.0%) |
| Graduate Degree | 0 (0.0%) | 0 (0.0%) |
| Total | 3 (11.5%) | 23 (88.5%) |
Employment Characteristics in Franklin
Employment by Class of Employer in Franklin
Among the 1,706 employed individuals in Franklin, private company employees (1,165 | 68.3%), local government employees (188 | 11.0%), and self-employed (not incorporated) (160 | 9.4%) make up the most common classes of employment.
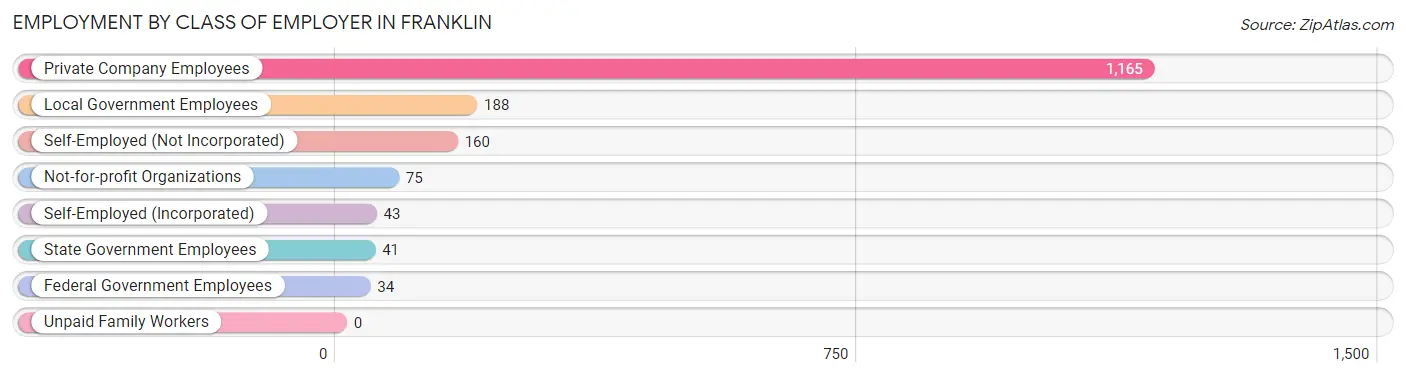
| Employer Class | # Employees | % Employees |
| Private Company Employees | 1,165 | 68.3% |
| Self-Employed (Incorporated) | 43 | 2.5% |
| Self-Employed (Not Incorporated) | 160 | 9.4% |
| Not-for-profit Organizations | 75 | 4.4% |
| Local Government Employees | 188 | 11.0% |
| State Government Employees | 41 | 2.4% |
| Federal Government Employees | 34 | 2.0% |
| Unpaid Family Workers | 0 | 0.0% |
| Total | 1,706 | 100.0% |
Employment Status by Age in Franklin
According to the labor force statistics for Franklin, out of the total population over 16 years of age (3,574), 50.8% or 1,816 individuals are in the labor force, with 3.7% or 67 of them unemployed. The age group with the highest labor force participation rate is 30 to 34 years, with 89.7% or 130 individuals in the labor force. Within the labor force, the 25 to 29 years age range has the highest percentage of unemployed individuals, with 23.6% or 17 of them being unemployed.
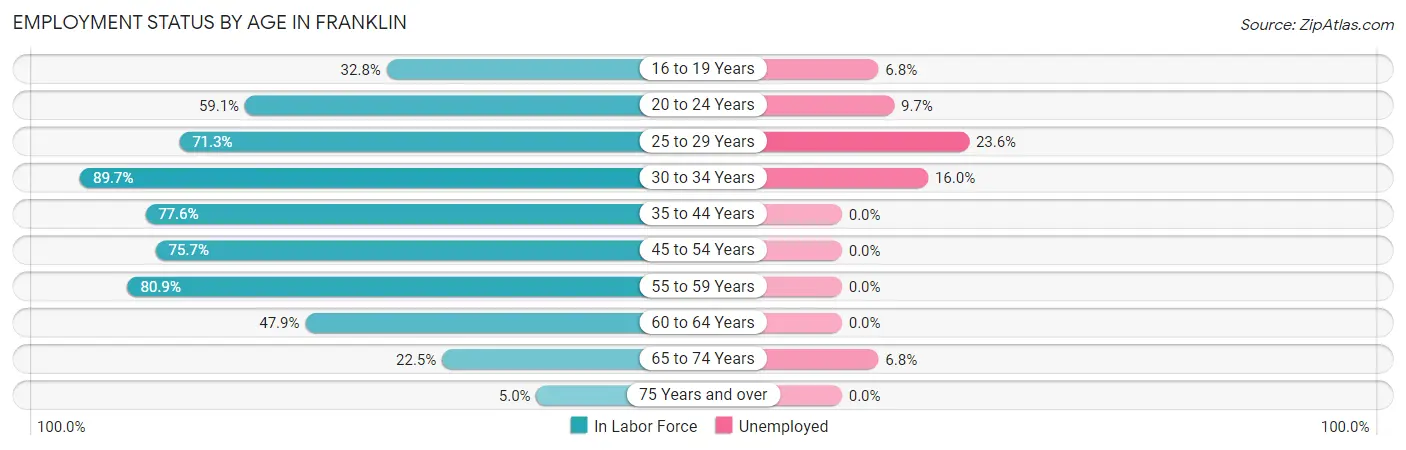
| Age Bracket | In Labor Force | Unemployed |
| 16 to 19 Years | 103 (32.8%) | 7 (6.8%) |
| 20 to 24 Years | 176 (59.1%) | 17 (9.7%) |
| 25 to 29 Years | 72 (71.3%) | 17 (23.6%) |
| 30 to 34 Years | 130 (89.7%) | 21 (16.0%) |
| 35 to 44 Years | 367 (77.6%) | 0 (0.0%) |
| 45 to 54 Years | 381 (75.7%) | 0 (0.0%) |
| 55 to 59 Years | 305 (80.9%) | 0 (0.0%) |
| 60 to 64 Years | 147 (47.9%) | 0 (0.0%) |
| 65 to 74 Years | 103 (22.5%) | 7 (6.8%) |
| 75 Years and over | 30 (5.0%) | 0 (0.0%) |
| Total | 1,816 (50.8%) | 67 (3.7%) |
Employment Status by Educational Attainment in Franklin
According to labor force statistics for Franklin, 73.6% of individuals (1,403) out of the total population between 25 and 64 years of age (1,906) are in the labor force, with 2.6% or 36 of them being unemployed. The group with the highest labor force participation rate are those with the educational attainment of bachelor's degree or higher, with 86.9% or 364 individuals in the labor force. Within the labor force, individuals with bachelor's degree or higher education have the highest percentage of unemployment, with 4.4% or 16 of them being unemployed.
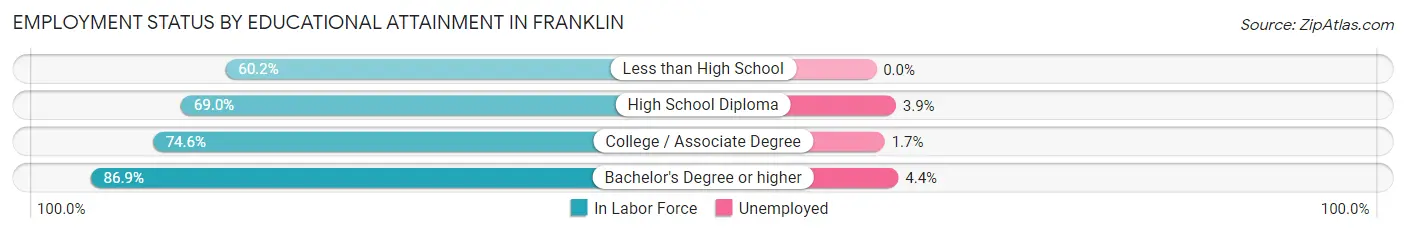
| Educational Attainment | In Labor Force | Unemployed |
| Less than High School | 204 (60.2%) | 0 (0.0%) |
| High School Diploma | 281 (69.0%) | 16 (3.9%) |
| College / Associate Degree | 553 (74.6%) | 13 (1.7%) |
| Bachelor's Degree or higher | 364 (86.9%) | 18 (4.4%) |
| Total | 1,403 (73.6%) | 50 (2.6%) |
Employment Occupations by Sex in Franklin
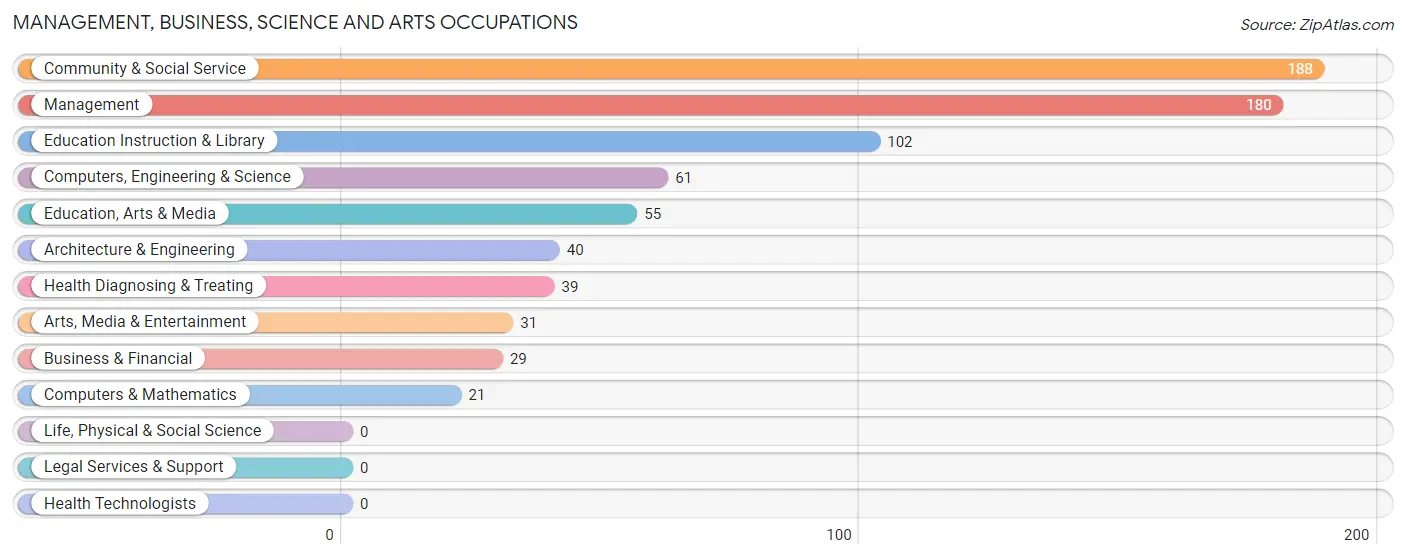
Management, Business, Science and Arts Occupations
The most common Management, Business, Science and Arts occupations in Franklin are Community & Social Service (188 | 10.8%), Management (180 | 10.4%), Education Instruction & Library (102 | 5.9%), Computers, Engineering & Science (61 | 3.5%), and Education, Arts & Media (55 | 3.2%).
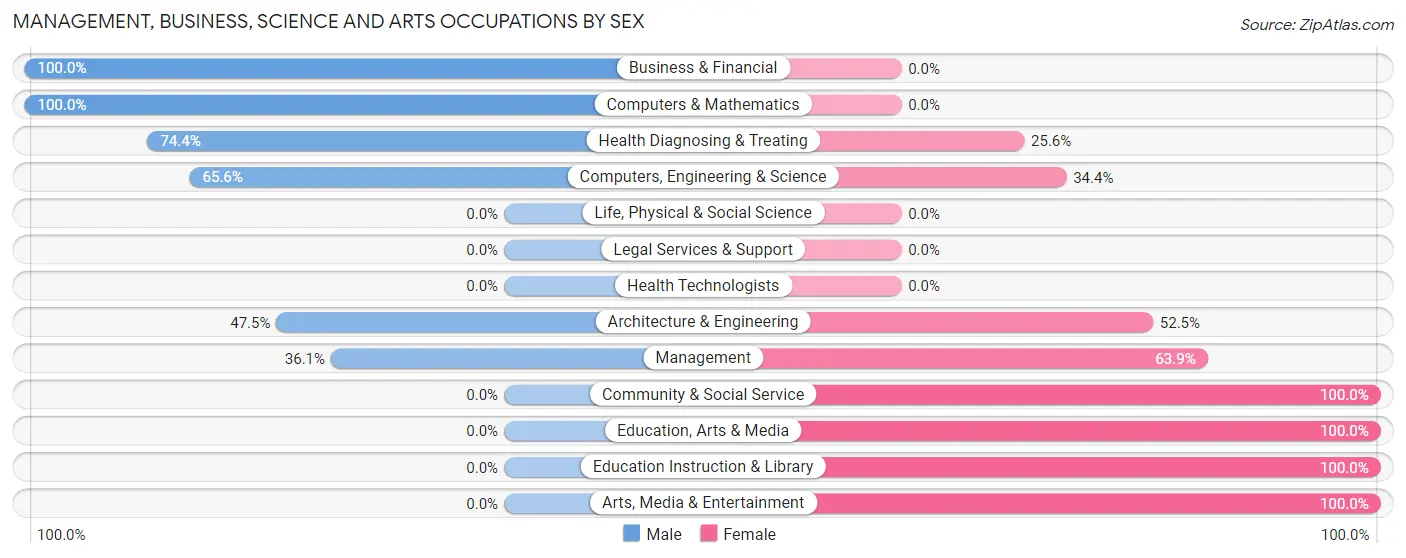
Management, Business, Science and Arts Occupations by Sex
Within the Management, Business, Science and Arts occupations in Franklin, the most male-oriented occupations are Business & Financial (100.0%), Computers & Mathematics (100.0%), and Health Diagnosing & Treating (74.4%), while the most female-oriented occupations are Community & Social Service (100.0%), Education, Arts & Media (100.0%), and Education Instruction & Library (100.0%).
| Occupation | Male | Female |
| Management | 65 (36.1%) | 115 (63.9%) |
| Business & Financial | 29 (100.0%) | 0 (0.0%) |
| Computers, Engineering & Science | 40 (65.6%) | 21 (34.4%) |
| Computers & Mathematics | 21 (100.0%) | 0 (0.0%) |
| Architecture & Engineering | 19 (47.5%) | 21 (52.5%) |
| Life, Physical & Social Science | 0 (0.0%) | 0 (0.0%) |
| Community & Social Service | 0 (0.0%) | 188 (100.0%) |
| Education, Arts & Media | 0 (0.0%) | 55 (100.0%) |
| Legal Services & Support | 0 (0.0%) | 0 (0.0%) |
| Education Instruction & Library | 0 (0.0%) | 102 (100.0%) |
| Arts, Media & Entertainment | 0 (0.0%) | 31 (100.0%) |
| Health Diagnosing & Treating | 29 (74.4%) | 10 (25.6%) |
| Health Technologists | 0 (0.0%) | 0 (0.0%) |
| Total (Category) | 163 (32.8%) | 334 (67.2%) |
| Total (Overall) | 834 (48.0%) | 902 (52.0%) |
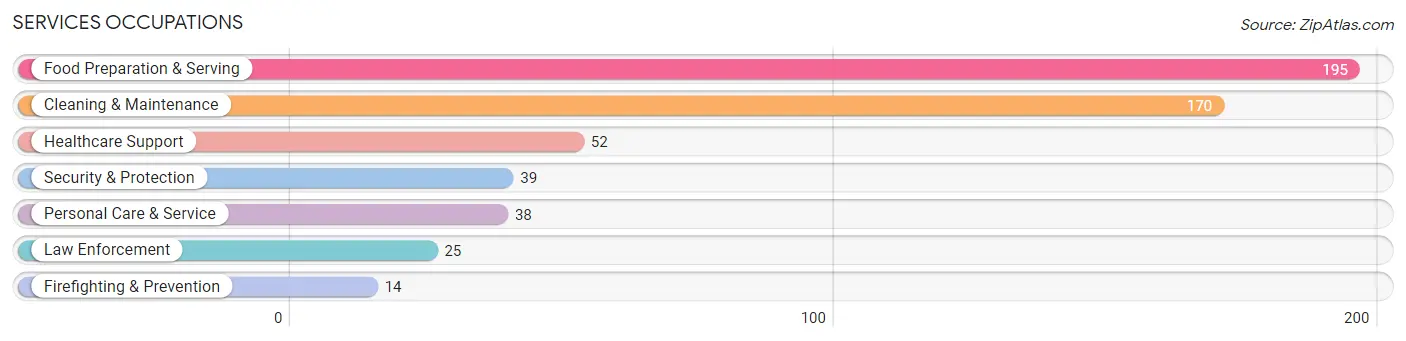
Services Occupations
The most common Services occupations in Franklin are Food Preparation & Serving (195 | 11.2%), Cleaning & Maintenance (170 | 9.8%), Healthcare Support (52 | 3.0%), Security & Protection (39 | 2.2%), and Personal Care & Service (38 | 2.2%).
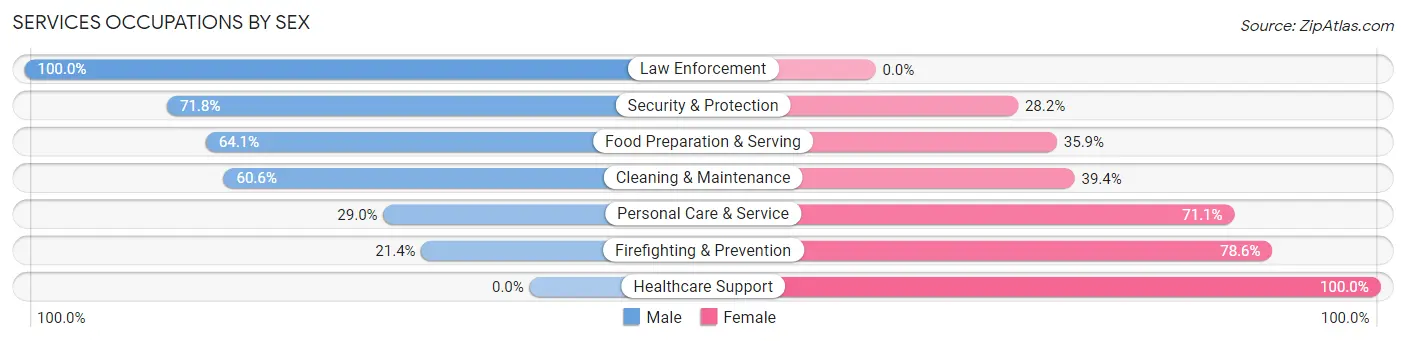
Services Occupations by Sex
Within the Services occupations in Franklin, the most male-oriented occupations are Law Enforcement (100.0%), Security & Protection (71.8%), and Food Preparation & Serving (64.1%), while the most female-oriented occupations are Healthcare Support (100.0%), Firefighting & Prevention (78.6%), and Personal Care & Service (71.1%).
| Occupation | Male | Female |
| Healthcare Support | 0 (0.0%) | 52 (100.0%) |
| Security & Protection | 28 (71.8%) | 11 (28.2%) |
| Firefighting & Prevention | 3 (21.4%) | 11 (78.6%) |
| Law Enforcement | 25 (100.0%) | 0 (0.0%) |
| Food Preparation & Serving | 125 (64.1%) | 70 (35.9%) |
| Cleaning & Maintenance | 103 (60.6%) | 67 (39.4%) |
| Personal Care & Service | 11 (28.9%) | 27 (71.1%) |
| Total (Category) | 267 (54.0%) | 227 (46.0%) |
| Total (Overall) | 834 (48.0%) | 902 (52.0%) |
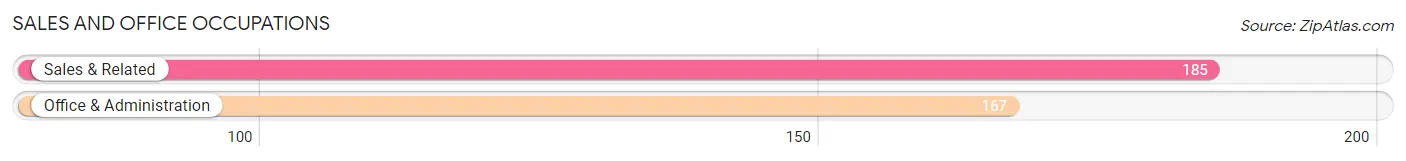
Sales and Office Occupations
The most common Sales and Office occupations in Franklin are Sales & Related (185 | 10.7%), and Office & Administration (167 | 9.6%).
Sales and Office Occupations by Sex
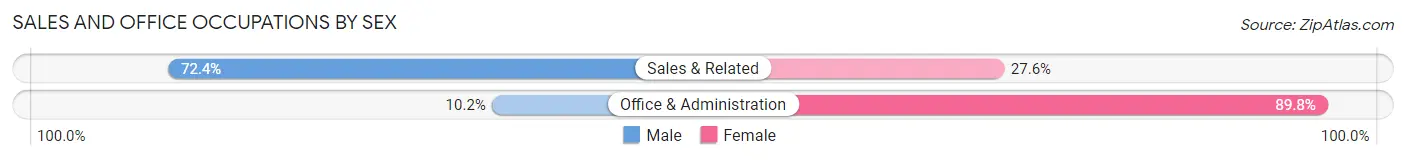
| Occupation | Male | Female |
| Sales & Related | 134 (72.4%) | 51 (27.6%) |
| Office & Administration | 17 (10.2%) | 150 (89.8%) |
| Total (Category) | 151 (42.9%) | 201 (57.1%) |
| Total (Overall) | 834 (48.0%) | 902 (52.0%) |
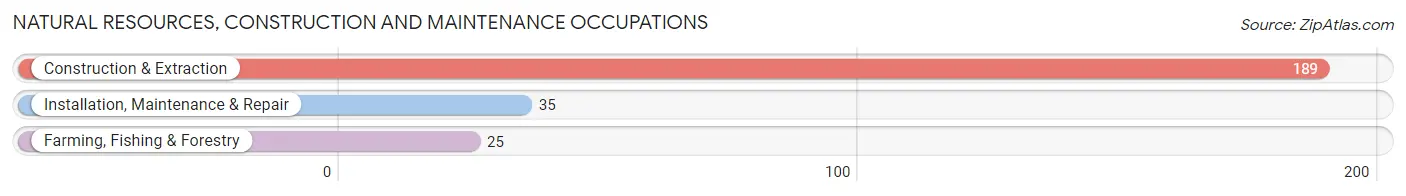
Natural Resources, Construction and Maintenance Occupations
The most common Natural Resources, Construction and Maintenance occupations in Franklin are Construction & Extraction (189 | 10.9%), Installation, Maintenance & Repair (35 | 2.0%), and Farming, Fishing & Forestry (25 | 1.4%).
Natural Resources, Construction and Maintenance Occupations by Sex
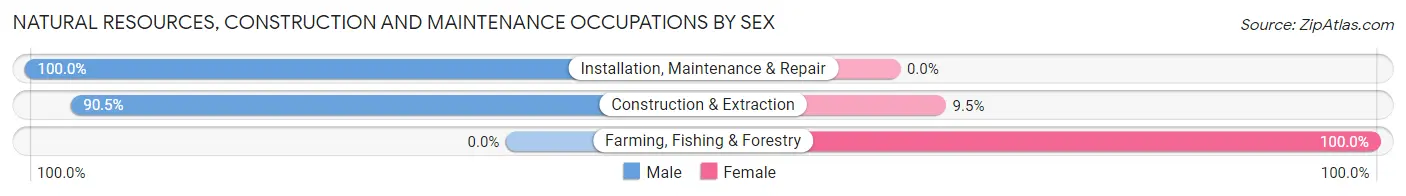
| Occupation | Male | Female |
| Farming, Fishing & Forestry | 0 (0.0%) | 25 (100.0%) |
| Construction & Extraction | 171 (90.5%) | 18 (9.5%) |
| Installation, Maintenance & Repair | 35 (100.0%) | 0 (0.0%) |
| Total (Category) | 206 (82.7%) | 43 (17.3%) |
| Total (Overall) | 834 (48.0%) | 902 (52.0%) |
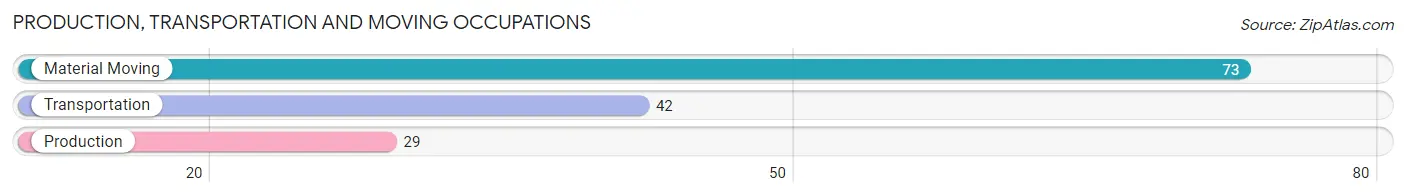
Production, Transportation and Moving Occupations
The most common Production, Transportation and Moving occupations in Franklin are Material Moving (73 | 4.2%), Transportation (42 | 2.4%), and Production (29 | 1.7%).
Production, Transportation and Moving Occupations by Sex
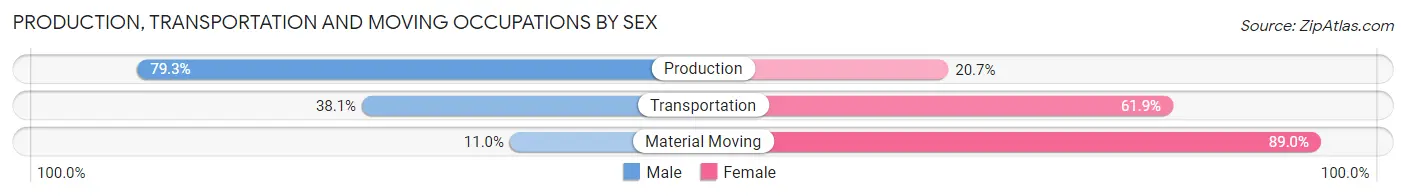
| Occupation | Male | Female |
| Production | 23 (79.3%) | 6 (20.7%) |
| Transportation | 16 (38.1%) | 26 (61.9%) |
| Material Moving | 8 (11.0%) | 65 (89.0%) |
| Total (Category) | 47 (32.6%) | 97 (67.4%) |
| Total (Overall) | 834 (48.0%) | 902 (52.0%) |
Employment Industries by Sex in Franklin
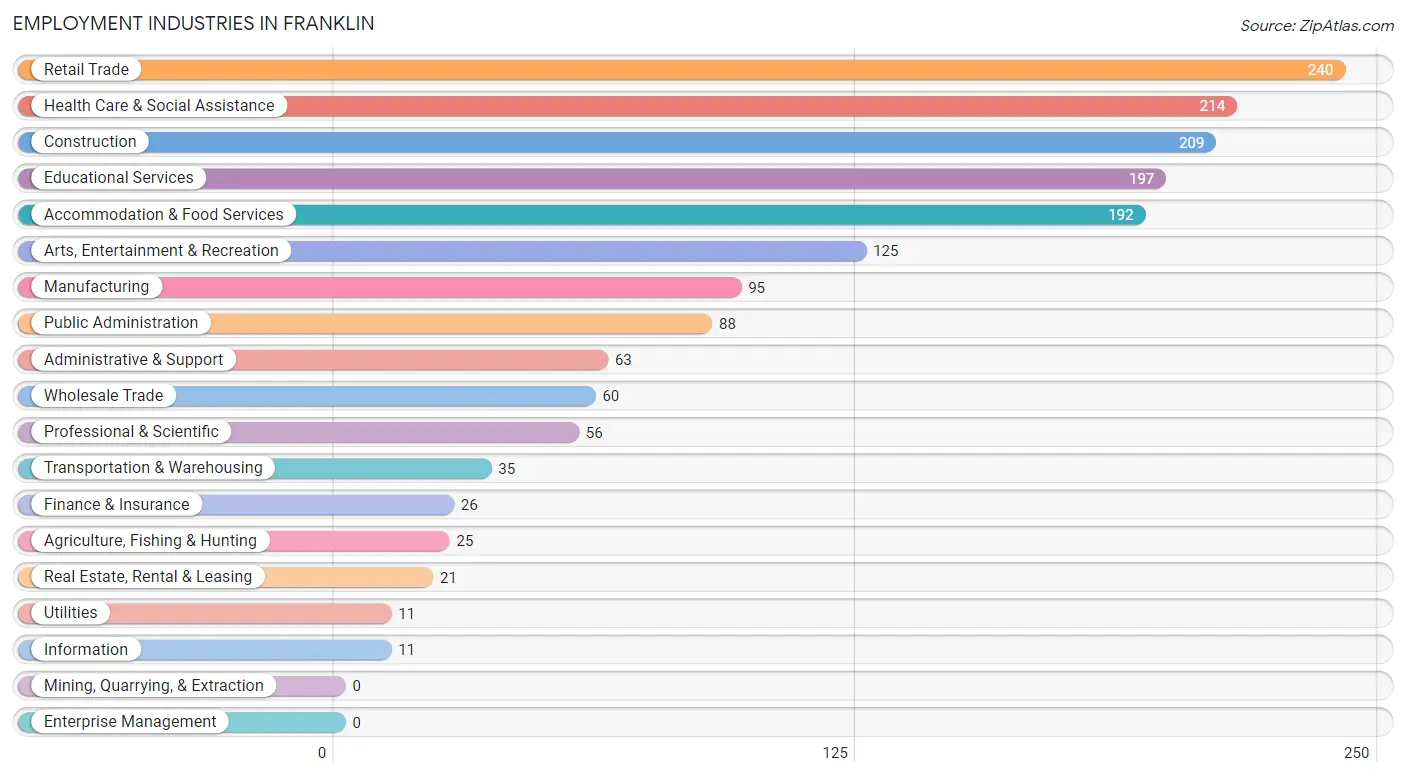
Employment Industries in Franklin
The major employment industries in Franklin include Retail Trade (240 | 13.8%), Health Care & Social Assistance (214 | 12.3%), Construction (209 | 12.0%), Educational Services (197 | 11.4%), and Accommodation & Food Services (192 | 11.1%).
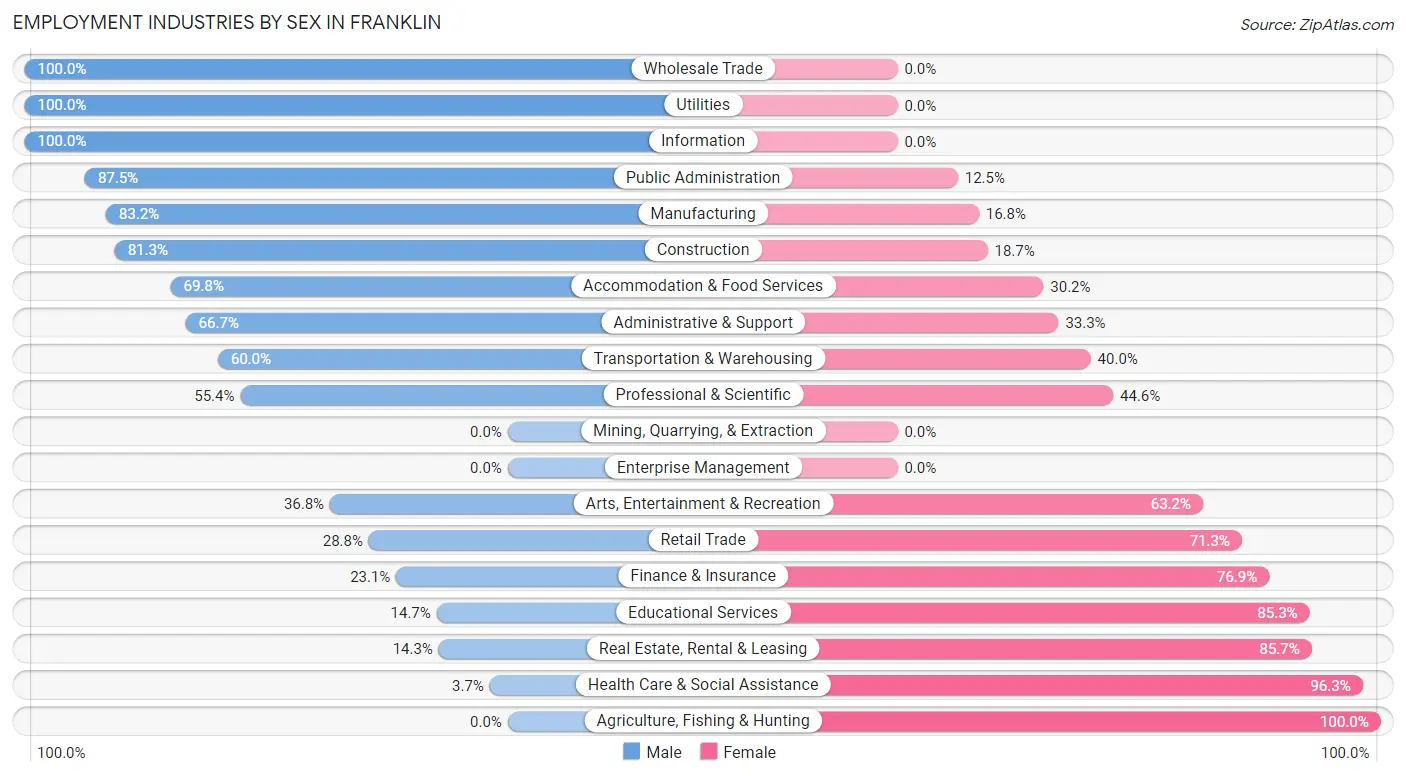
Employment Industries by Sex in Franklin
The Franklin industries that see more men than women are Wholesale Trade (100.0%), Utilities (100.0%), and Information (100.0%), whereas the industries that tend to have a higher number of women are Agriculture, Fishing & Hunting (100.0%), Health Care & Social Assistance (96.3%), and Real Estate, Rental & Leasing (85.7%).
| Industry | Male | Female |
| Agriculture, Fishing & Hunting | 0 (0.0%) | 25 (100.0%) |
| Mining, Quarrying, & Extraction | 0 (0.0%) | 0 (0.0%) |
| Construction | 170 (81.3%) | 39 (18.7%) |
| Manufacturing | 79 (83.2%) | 16 (16.8%) |
| Wholesale Trade | 60 (100.0%) | 0 (0.0%) |
| Retail Trade | 69 (28.7%) | 171 (71.3%) |
| Transportation & Warehousing | 21 (60.0%) | 14 (40.0%) |
| Utilities | 11 (100.0%) | 0 (0.0%) |
| Information | 11 (100.0%) | 0 (0.0%) |
| Finance & Insurance | 6 (23.1%) | 20 (76.9%) |
| Real Estate, Rental & Leasing | 3 (14.3%) | 18 (85.7%) |
| Professional & Scientific | 31 (55.4%) | 25 (44.6%) |
| Enterprise Management | 0 (0.0%) | 0 (0.0%) |
| Administrative & Support | 42 (66.7%) | 21 (33.3%) |
| Educational Services | 29 (14.7%) | 168 (85.3%) |
| Health Care & Social Assistance | 8 (3.7%) | 206 (96.3%) |
| Arts, Entertainment & Recreation | 46 (36.8%) | 79 (63.2%) |
| Accommodation & Food Services | 134 (69.8%) | 58 (30.2%) |
| Public Administration | 77 (87.5%) | 11 (12.5%) |
| Total | 834 (48.0%) | 902 (52.0%) |
Education in Franklin
School Enrollment in Franklin
The most common levels of schooling among the 946 students in Franklin are college / undergraduate (323 | 34.1%), high school (230 | 24.3%), and middle school (211 | 22.3%).
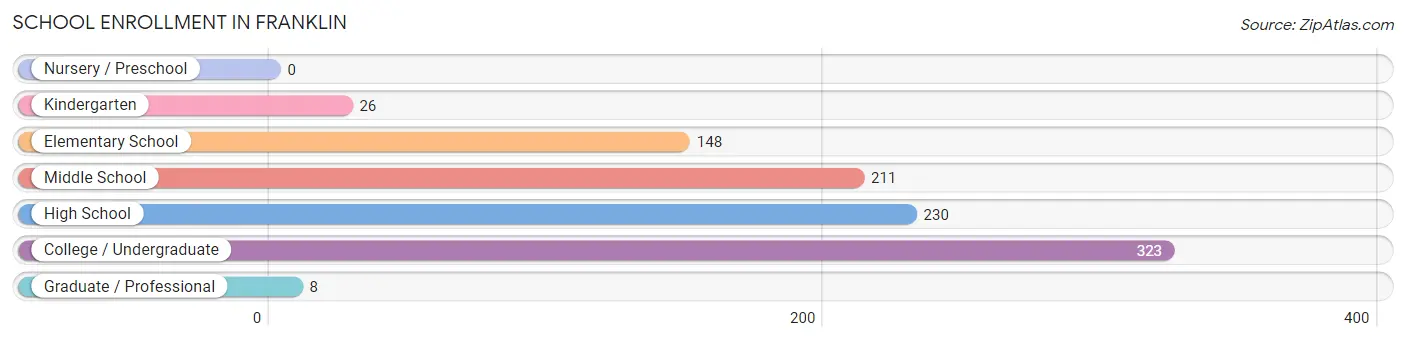
| School Level | # Students | % Students |
| Nursery / Preschool | 0 | 0.0% |
| Kindergarten | 26 | 2.8% |
| Elementary School | 148 | 15.6% |
| Middle School | 211 | 22.3% |
| High School | 230 | 24.3% |
| College / Undergraduate | 323 | 34.1% |
| Graduate / Professional | 8 | 0.9% |
| Total | 946 | 100.0% |
School Enrollment by Age by Funding Source in Franklin
Out of a total of 946 students who are enrolled in schools in Franklin, 383 (40.5%) attend a private institution, while the remaining 563 (59.5%) are enrolled in public schools. The age group of 5 to 9 year old has the highest likelihood of being enrolled in private schools, with 104 (72.2% in the age bracket) enrolled. Conversely, the age group of 20 to 24 year olds has the lowest likelihood of being enrolled in a private school, with 106 (100.0% in the age bracket) attending a public institution.
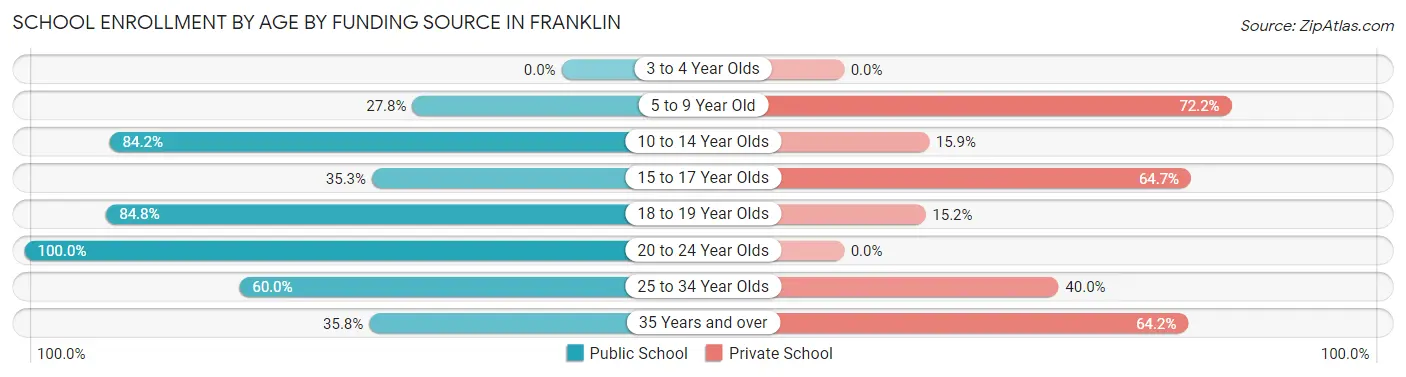
| Age Bracket | Public School | Private School |
| 3 to 4 Year Olds | 0 (0.0%) | 0 (0.0%) |
| 5 to 9 Year Old | 40 (27.8%) | 104 (72.2%) |
| 10 to 14 Year Olds | 207 (84.2%) | 39 (15.9%) |
| 15 to 17 Year Olds | 77 (35.3%) | 141 (64.7%) |
| 18 to 19 Year Olds | 78 (84.8%) | 14 (15.2%) |
| 20 to 24 Year Olds | 106 (100.0%) | 0 (0.0%) |
| 25 to 34 Year Olds | 12 (60.0%) | 8 (40.0%) |
| 35 Years and over | 43 (35.8%) | 77 (64.2%) |
| Total | 563 (59.5%) | 383 (40.5%) |
Educational Attainment by Field of Study in Franklin
Business (241 | 33.6%), arts & humanities (90 | 12.5%), computers & mathematics (71 | 9.9%), science & technology (58 | 8.1%), and communications (54 | 7.5%) are the most common fields of study among 718 individuals in Franklin who have obtained a bachelor's degree or higher.
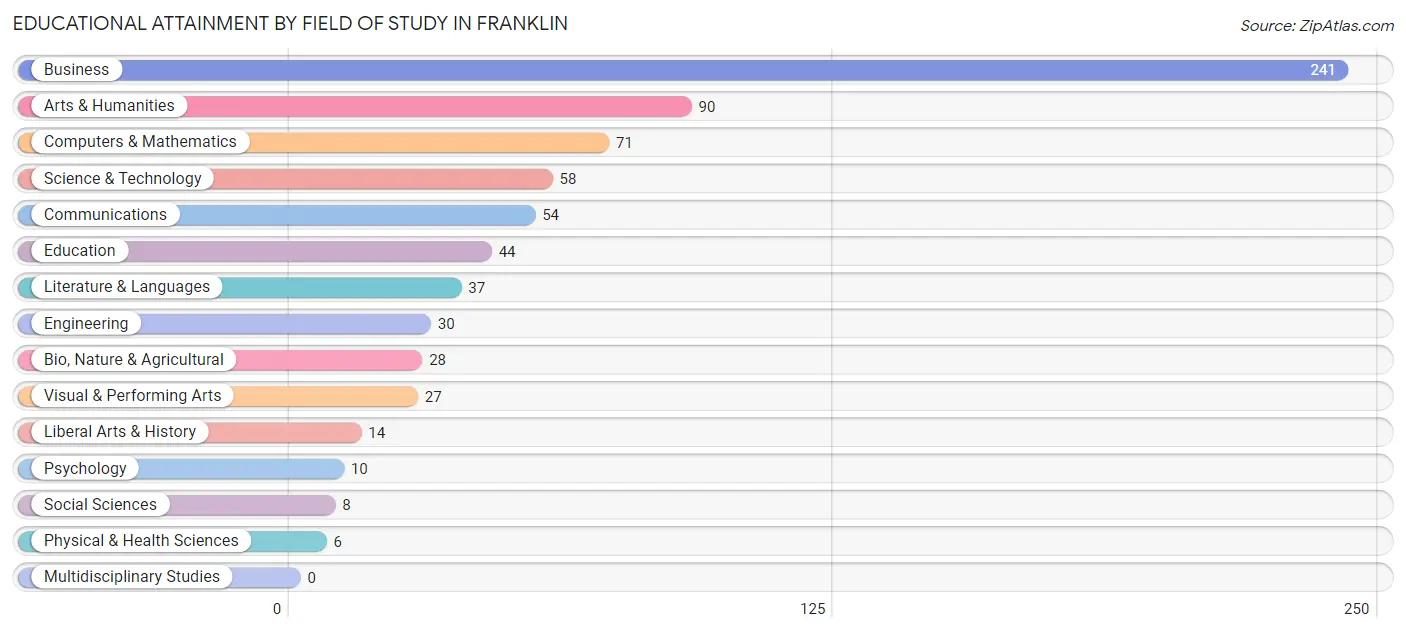
| Field of Study | # Graduates | % Graduates |
| Computers & Mathematics | 71 | 9.9% |
| Bio, Nature & Agricultural | 28 | 3.9% |
| Physical & Health Sciences | 6 | 0.8% |
| Psychology | 10 | 1.4% |
| Social Sciences | 8 | 1.1% |
| Engineering | 30 | 4.2% |
| Multidisciplinary Studies | 0 | 0.0% |
| Science & Technology | 58 | 8.1% |
| Business | 241 | 33.6% |
| Education | 44 | 6.1% |
| Literature & Languages | 37 | 5.1% |
| Liberal Arts & History | 14 | 1.9% |
| Visual & Performing Arts | 27 | 3.8% |
| Communications | 54 | 7.5% |
| Arts & Humanities | 90 | 12.5% |
| Total | 718 | 100.0% |
Transportation & Commute in Franklin
Vehicle Availability by Sex in Franklin
The most prevalent vehicle ownership categories in Franklin are males with 2 vehicles (349, accounting for 43.6%) and females with 2 vehicles (439, making up 38.7%).
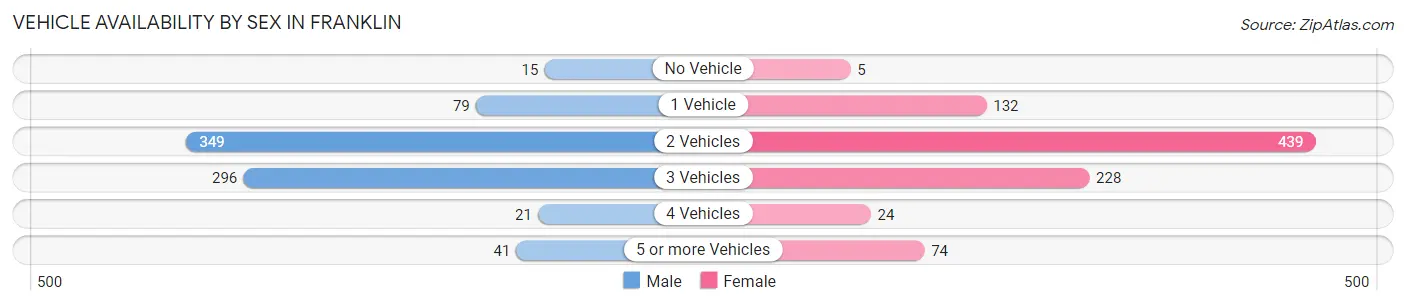
| Vehicles Available | Male | Female |
| No Vehicle | 15 (1.9%) | 5 (0.5%) |
| 1 Vehicle | 79 (9.9%) | 132 (14.6%) |
| 2 Vehicles | 349 (43.6%) | 439 (48.7%) |
| 3 Vehicles | 296 (36.9%) | 228 (25.3%) |
| 4 Vehicles | 21 (2.6%) | 24 (2.7%) |
| 5 or more Vehicles | 41 (5.1%) | 74 (8.2%) |
| Total | 801 (100.0%) | 902 (100.0%) |
Commute Time in Franklin
The most frequently occuring commute durations in Franklin are 5 to 9 minutes (387 commuters, 23.6%), 45 to 59 minutes (327 commuters, 19.9%), and 30 to 34 minutes (282 commuters, 17.2%).
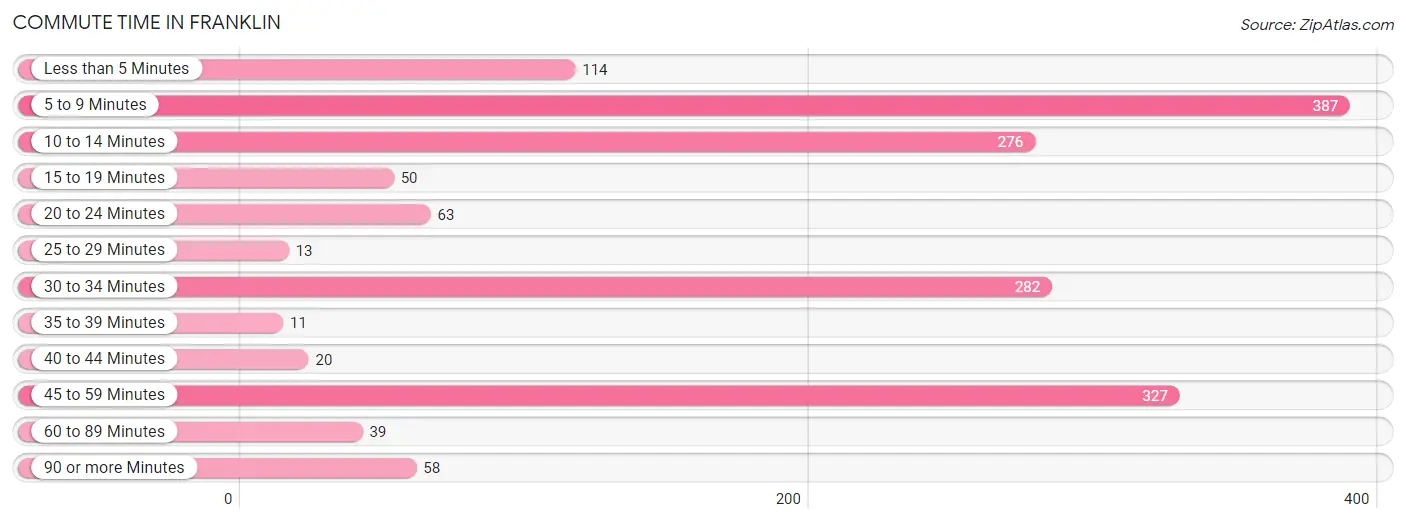
| Commute Time | # Commuters | % Commuters |
| Less than 5 Minutes | 114 | 7.0% |
| 5 to 9 Minutes | 387 | 23.6% |
| 10 to 14 Minutes | 276 | 16.8% |
| 15 to 19 Minutes | 50 | 3.0% |
| 20 to 24 Minutes | 63 | 3.8% |
| 25 to 29 Minutes | 13 | 0.8% |
| 30 to 34 Minutes | 282 | 17.2% |
| 35 to 39 Minutes | 11 | 0.7% |
| 40 to 44 Minutes | 20 | 1.2% |
| 45 to 59 Minutes | 327 | 19.9% |
| 60 to 89 Minutes | 39 | 2.4% |
| 90 or more Minutes | 58 | 3.5% |
Commute Time by Sex in Franklin
The most common commute times in Franklin are 30 to 34 minutes (196 commuters, 25.5%) for males and 5 to 9 minutes (276 commuters, 31.7%) for females.
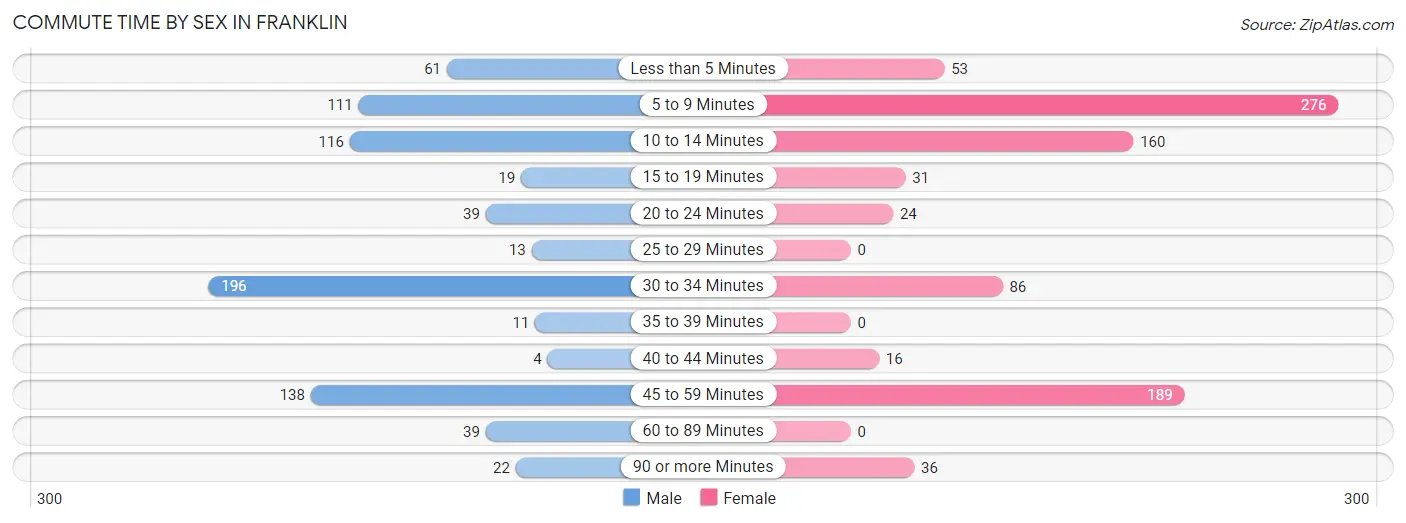
| Commute Time | Male | Female |
| Less than 5 Minutes | 61 (7.9%) | 53 (6.1%) |
| 5 to 9 Minutes | 111 (14.4%) | 276 (31.7%) |
| 10 to 14 Minutes | 116 (15.1%) | 160 (18.4%) |
| 15 to 19 Minutes | 19 (2.5%) | 31 (3.6%) |
| 20 to 24 Minutes | 39 (5.1%) | 24 (2.8%) |
| 25 to 29 Minutes | 13 (1.7%) | 0 (0.0%) |
| 30 to 34 Minutes | 196 (25.5%) | 86 (9.9%) |
| 35 to 39 Minutes | 11 (1.4%) | 0 (0.0%) |
| 40 to 44 Minutes | 4 (0.5%) | 16 (1.8%) |
| 45 to 59 Minutes | 138 (17.9%) | 189 (21.7%) |
| 60 to 89 Minutes | 39 (5.1%) | 0 (0.0%) |
| 90 or more Minutes | 22 (2.9%) | 36 (4.1%) |
Time of Departure to Work by Sex in Franklin
The most frequent times of departure to work in Franklin are 7:00 AM to 7:29 AM (190, 24.7%) for males and 8:00 AM to 8:29 AM (117, 13.4%) for females.
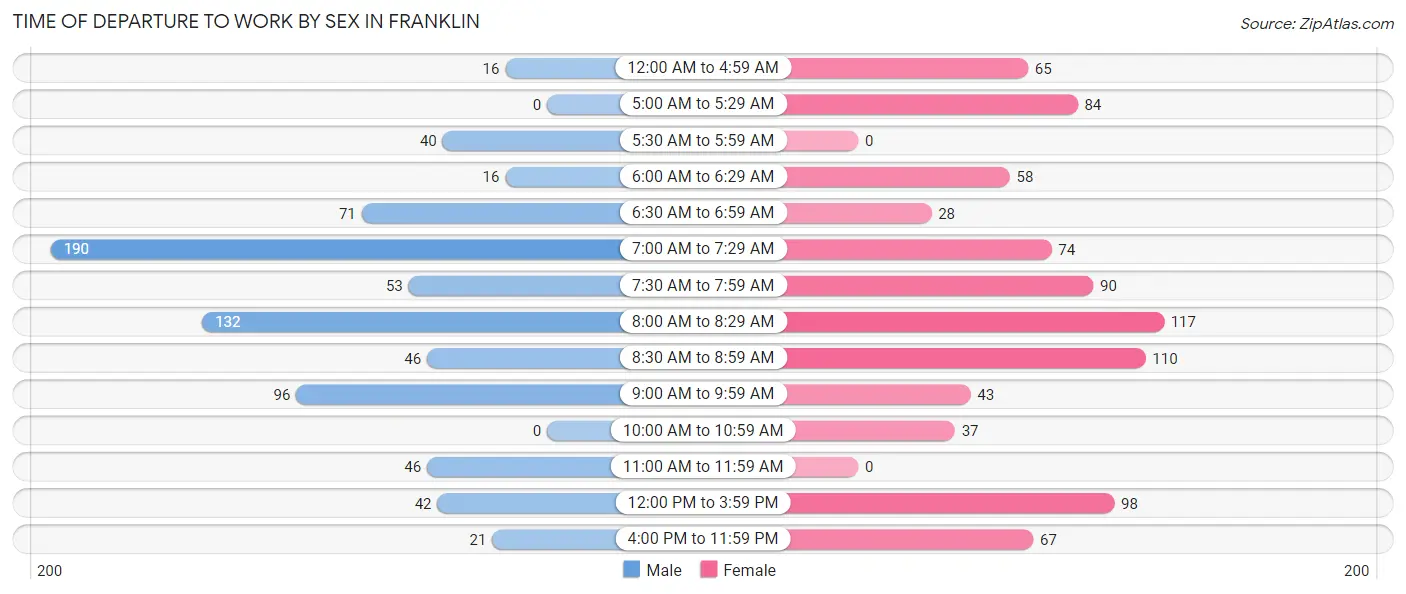
| Time of Departure | Male | Female |
| 12:00 AM to 4:59 AM | 16 (2.1%) | 65 (7.5%) |
| 5:00 AM to 5:29 AM | 0 (0.0%) | 84 (9.6%) |
| 5:30 AM to 5:59 AM | 40 (5.2%) | 0 (0.0%) |
| 6:00 AM to 6:29 AM | 16 (2.1%) | 58 (6.7%) |
| 6:30 AM to 6:59 AM | 71 (9.2%) | 28 (3.2%) |
| 7:00 AM to 7:29 AM | 190 (24.7%) | 74 (8.5%) |
| 7:30 AM to 7:59 AM | 53 (6.9%) | 90 (10.3%) |
| 8:00 AM to 8:29 AM | 132 (17.2%) | 117 (13.4%) |
| 8:30 AM to 8:59 AM | 46 (6.0%) | 110 (12.6%) |
| 9:00 AM to 9:59 AM | 96 (12.5%) | 43 (4.9%) |
| 10:00 AM to 10:59 AM | 0 (0.0%) | 37 (4.3%) |
| 11:00 AM to 11:59 AM | 46 (6.0%) | 0 (0.0%) |
| 12:00 PM to 3:59 PM | 42 (5.5%) | 98 (11.3%) |
| 4:00 PM to 11:59 PM | 21 (2.7%) | 67 (7.7%) |
| Total | 769 (100.0%) | 871 (100.0%) |
Housing Occupancy in Franklin
Occupancy by Ownership in Franklin
Of the total 1,964 dwellings in Franklin, owner-occupied units account for 1,119 (57.0%), while renter-occupied units make up 845 (43.0%).
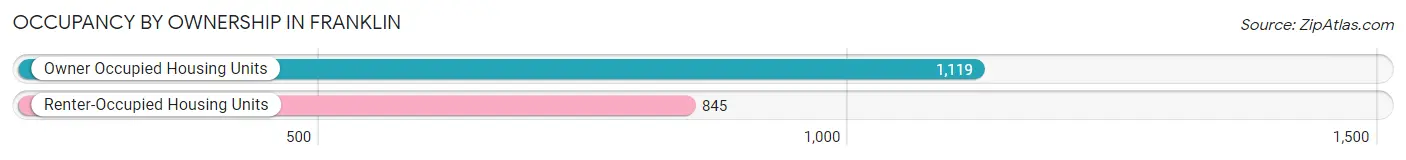
| Occupancy | # Housing Units | % Housing Units |
| Owner Occupied Housing Units | 1,119 | 57.0% |
| Renter-Occupied Housing Units | 845 | 43.0% |
| Total Occupied Housing Units | 1,964 | 100.0% |
Occupancy by Household Size in Franklin
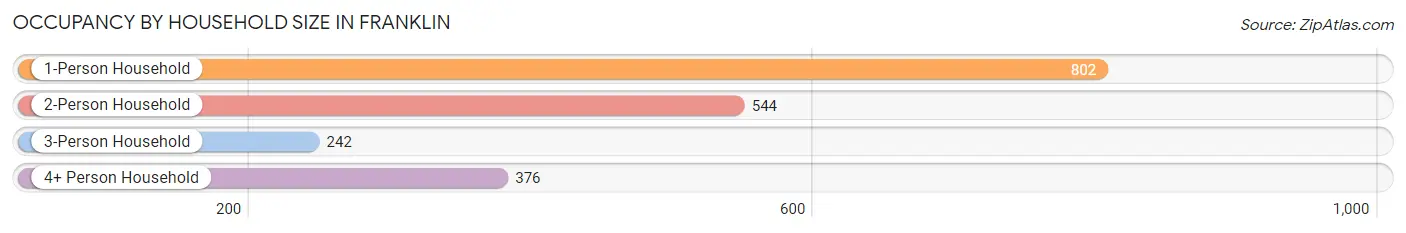
| Household Size | # Housing Units | % Housing Units |
| 1-Person Household | 802 | 40.8% |
| 2-Person Household | 544 | 27.7% |
| 3-Person Household | 242 | 12.3% |
| 4+ Person Household | 376 | 19.1% |
| Total Housing Units | 1,964 | 100.0% |
Occupancy by Ownership by Household Size in Franklin
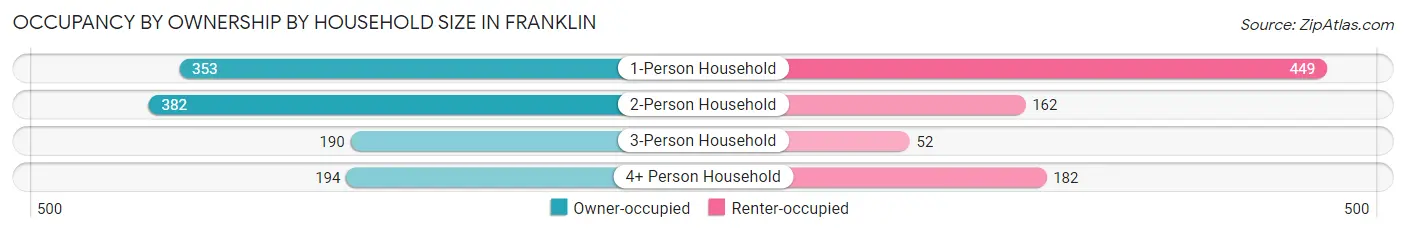
| Household Size | Owner-occupied | Renter-occupied |
| 1-Person Household | 353 (44.0%) | 449 (56.0%) |
| 2-Person Household | 382 (70.2%) | 162 (29.8%) |
| 3-Person Household | 190 (78.5%) | 52 (21.5%) |
| 4+ Person Household | 194 (51.6%) | 182 (48.4%) |
| Total Housing Units | 1,119 (57.0%) | 845 (43.0%) |
Occupancy by Educational Attainment in Franklin
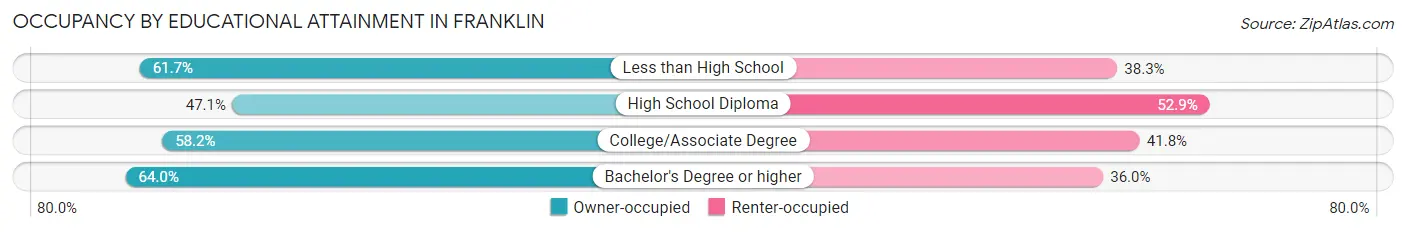
| Household Size | Owner-occupied | Renter-occupied |
| Less than High School | 213 (61.7%) | 132 (38.3%) |
| High School Diploma | 239 (47.1%) | 268 (52.9%) |
| College/Associate Degree | 445 (58.2%) | 320 (41.8%) |
| Bachelor's Degree or higher | 222 (64.0%) | 125 (36.0%) |
Occupancy by Age of Householder in Franklin
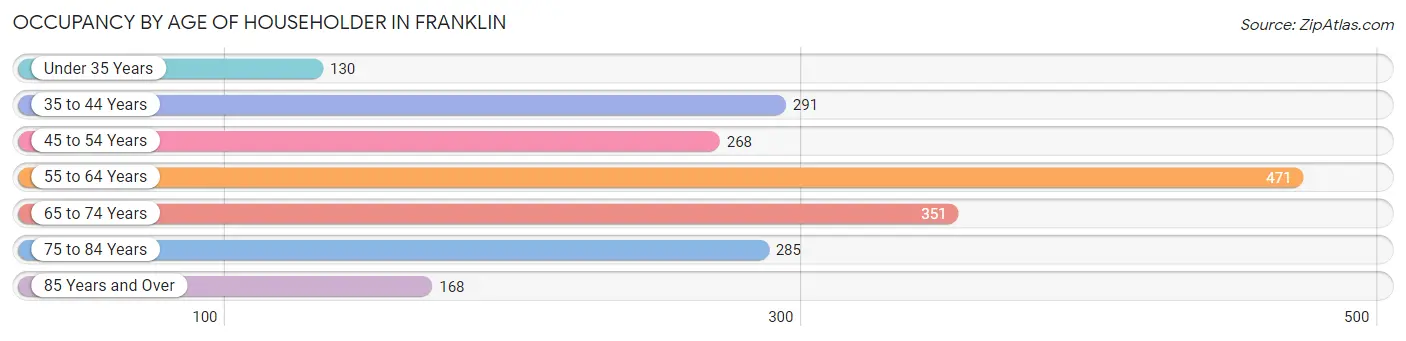
| Age Bracket | # Households | % Households |
| Under 35 Years | 130 | 6.6% |
| 35 to 44 Years | 291 | 14.8% |
| 45 to 54 Years | 268 | 13.7% |
| 55 to 64 Years | 471 | 24.0% |
| 65 to 74 Years | 351 | 17.9% |
| 75 to 84 Years | 285 | 14.5% |
| 85 Years and Over | 168 | 8.6% |
| Total | 1,964 | 100.0% |
Housing Finances in Franklin
Median Income by Occupancy in Franklin
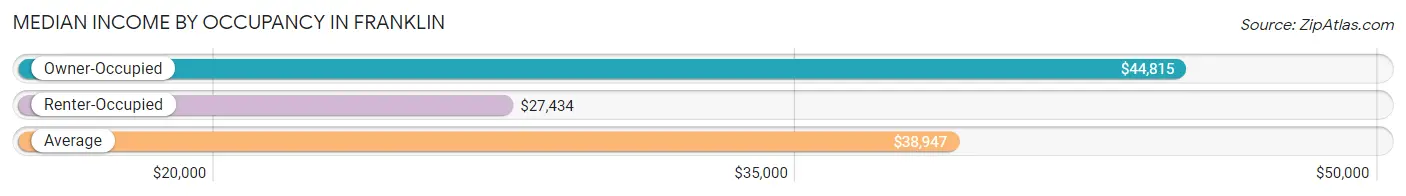
| Occupancy Type | # Households | Median Income |
| Owner-Occupied | 1,119 (57.0%) | $44,815 |
| Renter-Occupied | 845 (43.0%) | $27,434 |
| Average | 1,964 (100.0%) | $38,947 |
Occupancy by Householder Income Bracket in Franklin
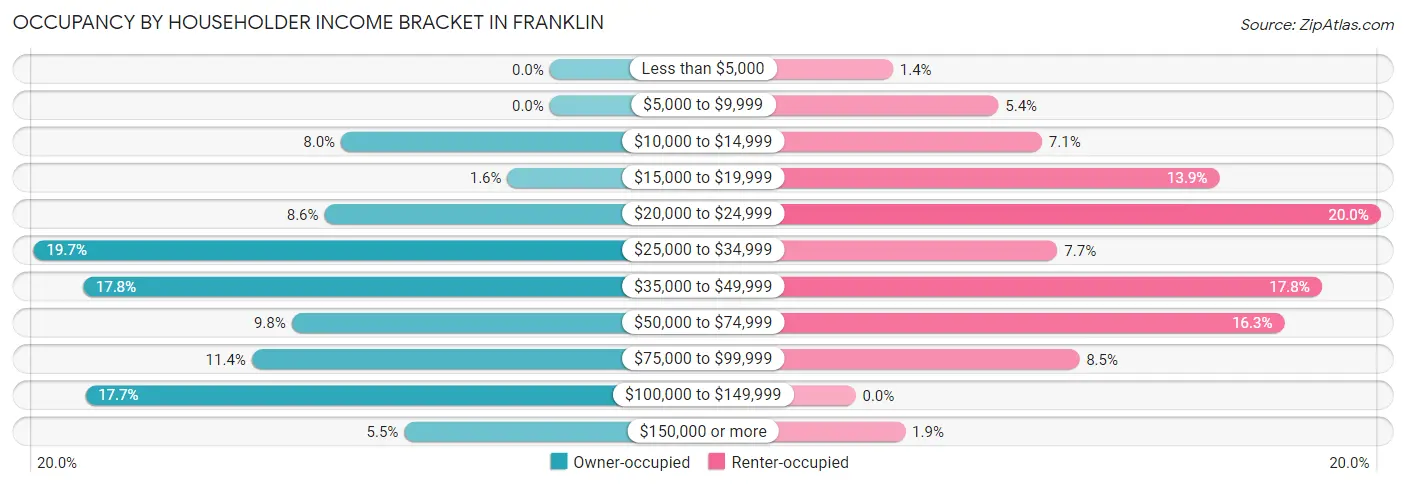
| Income Bracket | Owner-occupied | Renter-occupied |
| Less than $5,000 | 0 (0.0%) | 12 (1.4%) |
| $5,000 to $9,999 | 0 (0.0%) | 46 (5.4%) |
| $10,000 to $14,999 | 89 (8.0%) | 60 (7.1%) |
| $15,000 to $19,999 | 18 (1.6%) | 117 (13.9%) |
| $20,000 to $24,999 | 96 (8.6%) | 169 (20.0%) |
| $25,000 to $34,999 | 220 (19.7%) | 65 (7.7%) |
| $35,000 to $49,999 | 199 (17.8%) | 150 (17.7%) |
| $50,000 to $74,999 | 110 (9.8%) | 138 (16.3%) |
| $75,000 to $99,999 | 127 (11.4%) | 72 (8.5%) |
| $100,000 to $149,999 | 198 (17.7%) | 0 (0.0%) |
| $150,000 or more | 62 (5.5%) | 16 (1.9%) |
| Total | 1,119 (100.0%) | 845 (100.0%) |
Monthly Housing Cost Tiers in Franklin
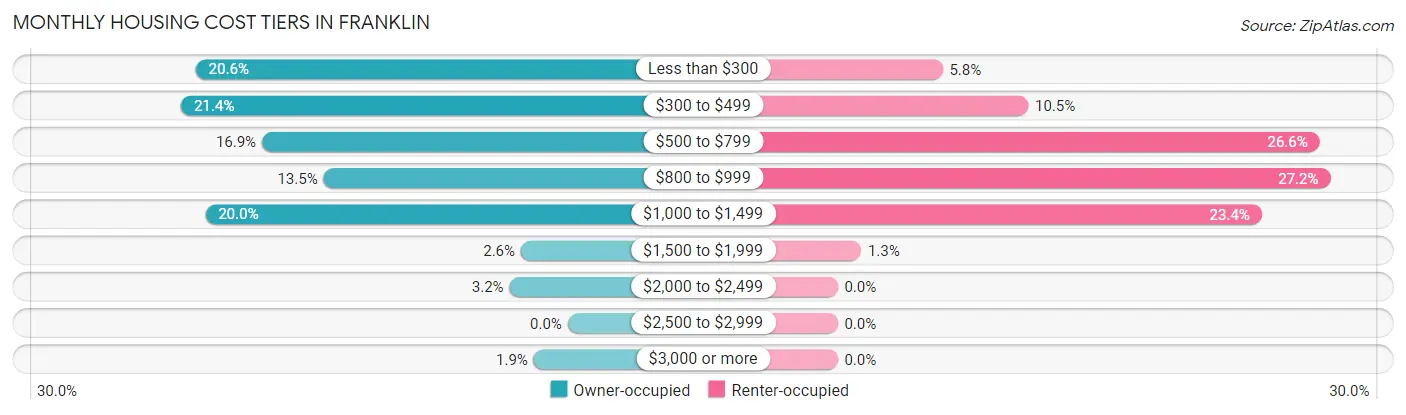
| Monthly Cost | Owner-occupied | Renter-occupied |
| Less than $300 | 230 (20.5%) | 49 (5.8%) |
| $300 to $499 | 239 (21.4%) | 89 (10.5%) |
| $500 to $799 | 189 (16.9%) | 225 (26.6%) |
| $800 to $999 | 151 (13.5%) | 230 (27.2%) |
| $1,000 to $1,499 | 224 (20.0%) | 198 (23.4%) |
| $1,500 to $1,999 | 29 (2.6%) | 11 (1.3%) |
| $2,000 to $2,499 | 36 (3.2%) | 0 (0.0%) |
| $2,500 to $2,999 | 0 (0.0%) | 0 (0.0%) |
| $3,000 or more | 21 (1.9%) | 0 (0.0%) |
| Total | 1,119 (100.0%) | 845 (100.0%) |
Physical Housing Characteristics in Franklin
Housing Structures in Franklin
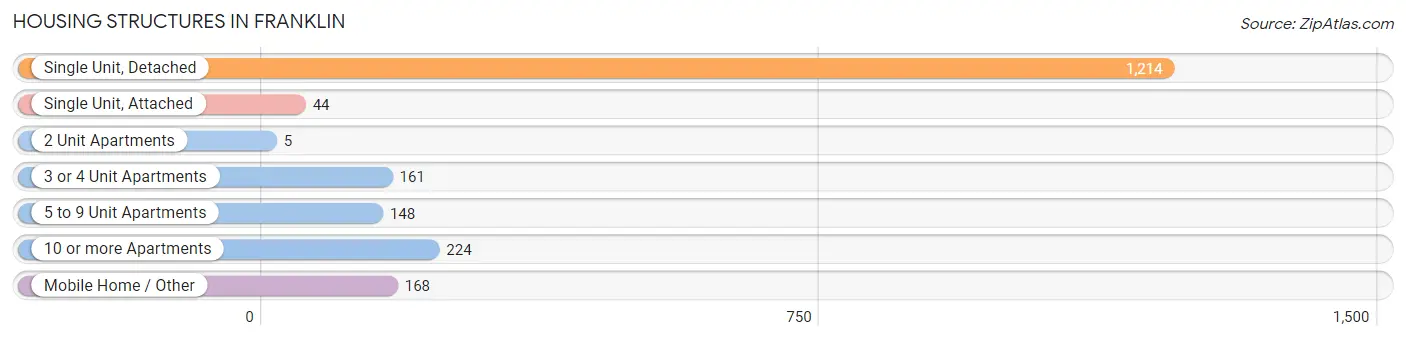
| Structure Type | # Housing Units | % Housing Units |
| Single Unit, Detached | 1,214 | 61.8% |
| Single Unit, Attached | 44 | 2.2% |
| 2 Unit Apartments | 5 | 0.3% |
| 3 or 4 Unit Apartments | 161 | 8.2% |
| 5 to 9 Unit Apartments | 148 | 7.5% |
| 10 or more Apartments | 224 | 11.4% |
| Mobile Home / Other | 168 | 8.6% |
| Total | 1,964 | 100.0% |
Housing Structures by Occupancy in Franklin
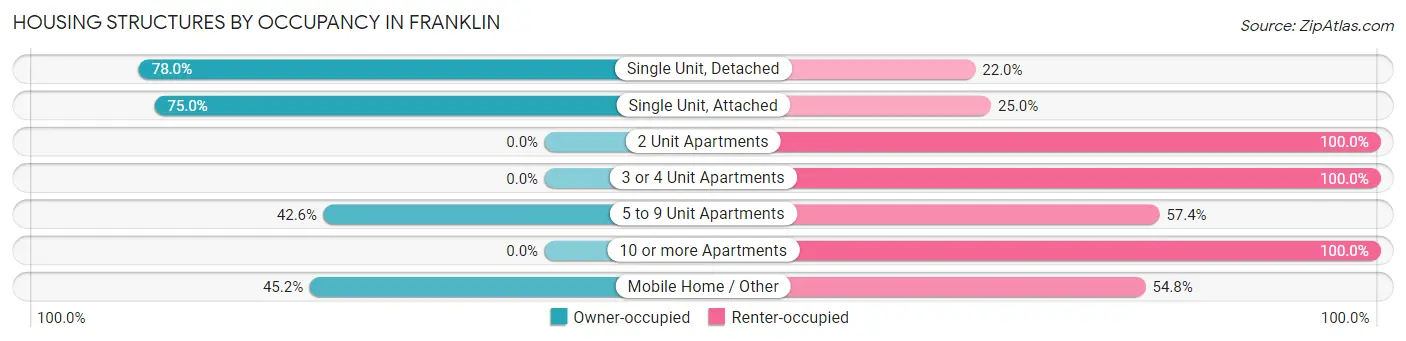
| Structure Type | Owner-occupied | Renter-occupied |
| Single Unit, Detached | 947 (78.0%) | 267 (22.0%) |
| Single Unit, Attached | 33 (75.0%) | 11 (25.0%) |
| 2 Unit Apartments | 0 (0.0%) | 5 (100.0%) |
| 3 or 4 Unit Apartments | 0 (0.0%) | 161 (100.0%) |
| 5 to 9 Unit Apartments | 63 (42.6%) | 85 (57.4%) |
| 10 or more Apartments | 0 (0.0%) | 224 (100.0%) |
| Mobile Home / Other | 76 (45.2%) | 92 (54.8%) |
| Total | 1,119 (57.0%) | 845 (43.0%) |
Housing Structures by Number of Rooms in Franklin
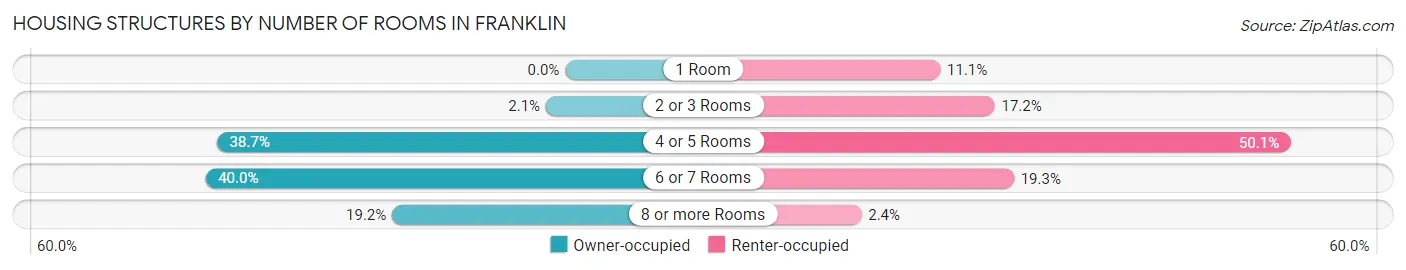
| Number of Rooms | Owner-occupied | Renter-occupied |
| 1 Room | 0 (0.0%) | 94 (11.1%) |
| 2 or 3 Rooms | 24 (2.1%) | 145 (17.2%) |
| 4 or 5 Rooms | 433 (38.7%) | 423 (50.1%) |
| 6 or 7 Rooms | 447 (40.0%) | 163 (19.3%) |
| 8 or more Rooms | 215 (19.2%) | 20 (2.4%) |
| Total | 1,119 (100.0%) | 845 (100.0%) |
Housing Structure by Heating Type in Franklin
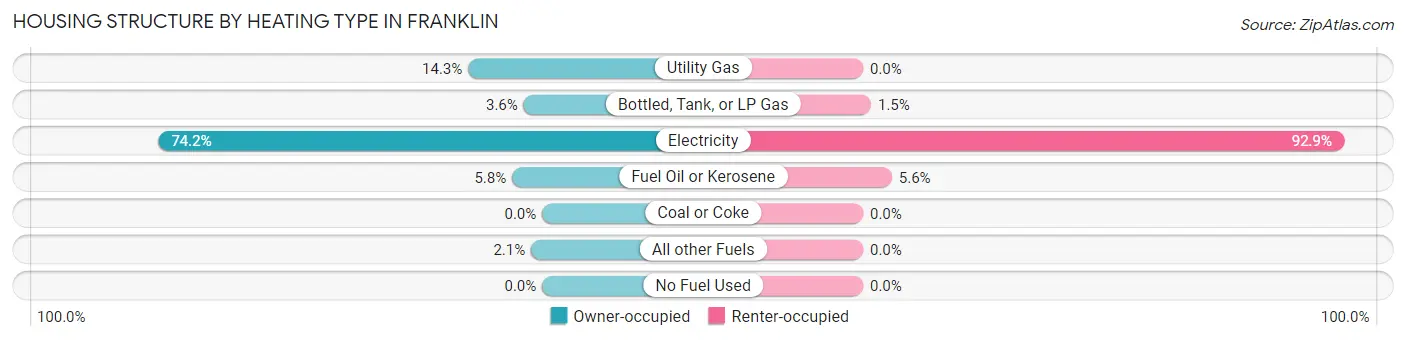
| Heating Type | Owner-occupied | Renter-occupied |
| Utility Gas | 160 (14.3%) | 0 (0.0%) |
| Bottled, Tank, or LP Gas | 40 (3.6%) | 13 (1.5%) |
| Electricity | 830 (74.2%) | 785 (92.9%) |
| Fuel Oil or Kerosene | 65 (5.8%) | 47 (5.6%) |
| Coal or Coke | 0 (0.0%) | 0 (0.0%) |
| All other Fuels | 24 (2.1%) | 0 (0.0%) |
| No Fuel Used | 0 (0.0%) | 0 (0.0%) |
| Total | 1,119 (100.0%) | 845 (100.0%) |
Household Vehicle Usage in Franklin
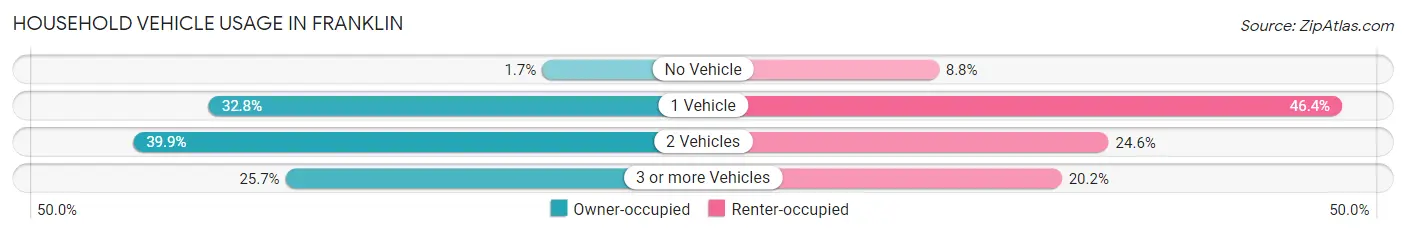
| Vehicles per Household | Owner-occupied | Renter-occupied |
| No Vehicle | 19 (1.7%) | 74 (8.8%) |
| 1 Vehicle | 367 (32.8%) | 392 (46.4%) |
| 2 Vehicles | 446 (39.9%) | 208 (24.6%) |
| 3 or more Vehicles | 287 (25.7%) | 171 (20.2%) |
| Total | 1,119 (100.0%) | 845 (100.0%) |
Real Estate & Mortgages in Franklin
Real Estate and Mortgage Overview in Franklin
| Characteristic | Without Mortgage | With Mortgage |
| Housing Units | 591 | 528 |
| Median Property Value | $145,900 | $207,700 |
| Median Household Income | $31,234 | $40 |
| Monthly Housing Costs | $331 | $21 |
| Real Estate Taxes | $999 | $0 |
Property Value by Mortgage Status in Franklin
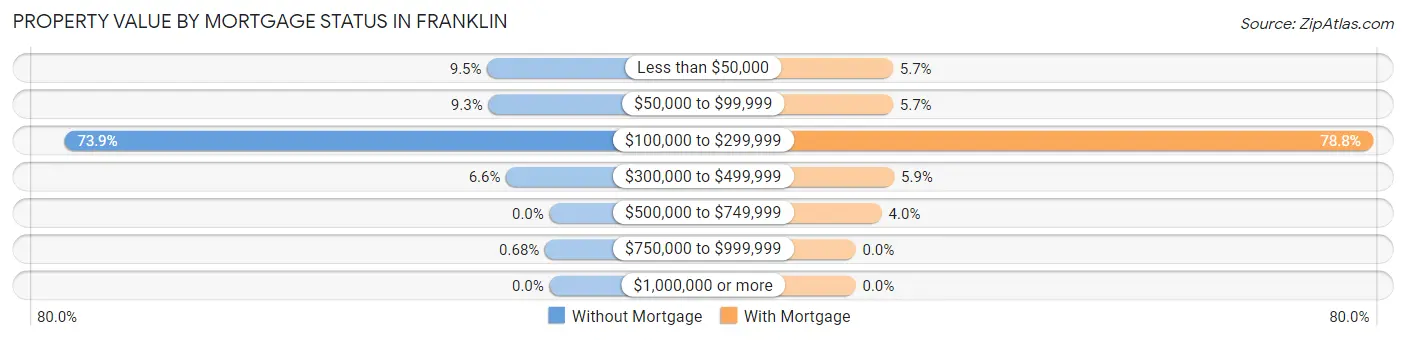
| Property Value | Without Mortgage | With Mortgage |
| Less than $50,000 | 56 (9.5%) | 30 (5.7%) |
| $50,000 to $99,999 | 55 (9.3%) | 30 (5.7%) |
| $100,000 to $299,999 | 437 (73.9%) | 416 (78.8%) |
| $300,000 to $499,999 | 39 (6.6%) | 31 (5.9%) |
| $500,000 to $749,999 | 0 (0.0%) | 21 (4.0%) |
| $750,000 to $999,999 | 4 (0.7%) | 0 (0.0%) |
| $1,000,000 or more | 0 (0.0%) | 0 (0.0%) |
| Total | 591 (100.0%) | 528 (100.0%) |
Household Income by Mortgage Status in Franklin
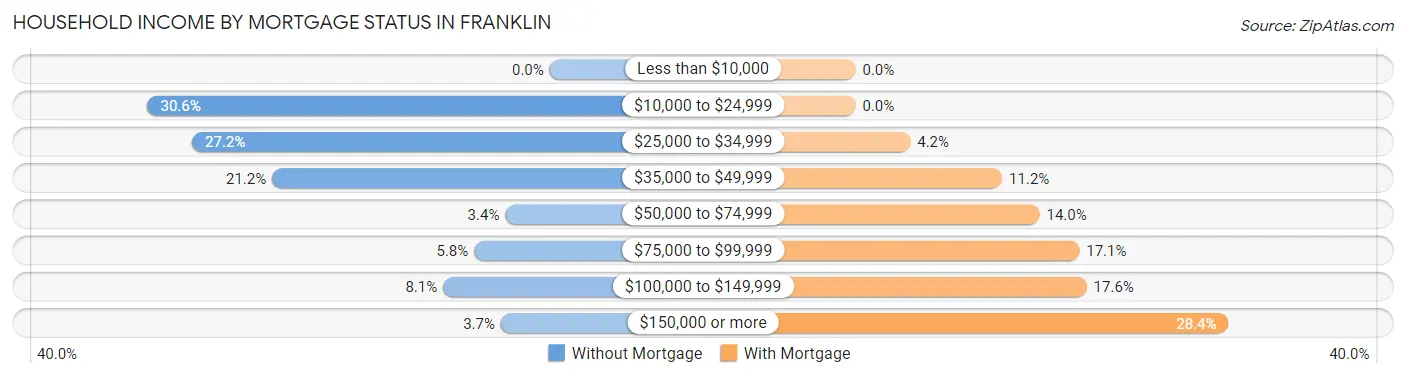
| Household Income | Without Mortgage | With Mortgage |
| Less than $10,000 | 0 (0.0%) | 0 (0.0%) |
| $10,000 to $24,999 | 181 (30.6%) | 0 (0.0%) |
| $25,000 to $34,999 | 161 (27.2%) | 22 (4.2%) |
| $35,000 to $49,999 | 125 (21.1%) | 59 (11.2%) |
| $50,000 to $74,999 | 20 (3.4%) | 74 (14.0%) |
| $75,000 to $99,999 | 34 (5.8%) | 90 (17.1%) |
| $100,000 to $149,999 | 48 (8.1%) | 93 (17.6%) |
| $150,000 or more | 22 (3.7%) | 150 (28.4%) |
| Total | 591 (100.0%) | 528 (100.0%) |
Property Value to Household Income Ratio in Franklin
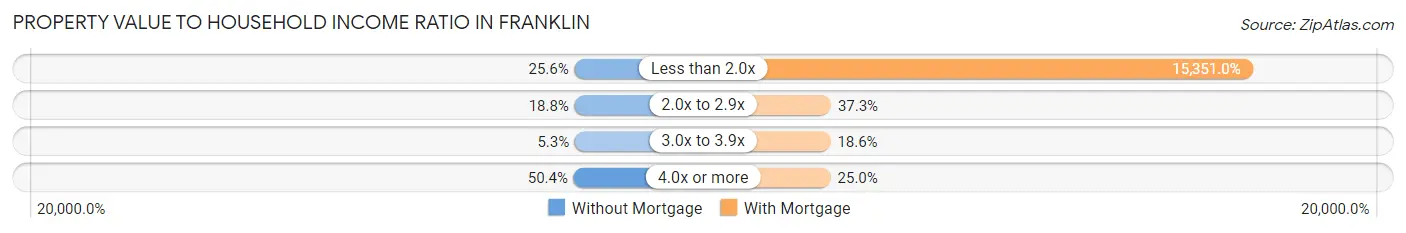
| Value-to-Income Ratio | Without Mortgage | With Mortgage |
| Less than 2.0x | 151 (25.6%) | 81,053 (15,351.0%) |
| 2.0x to 2.9x | 111 (18.8%) | 197 (37.3%) |
| 3.0x to 3.9x | 31 (5.2%) | 98 (18.6%) |
| 4.0x or more | 298 (50.4%) | 132 (25.0%) |
| Total | 591 (100.0%) | 528 (100.0%) |
Real Estate Taxes by Mortgage Status in Franklin
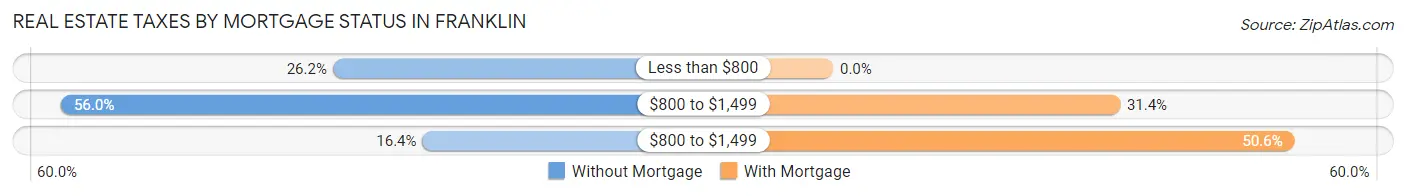
| Property Taxes | Without Mortgage | With Mortgage |
| Less than $800 | 155 (26.2%) | 0 (0.0%) |
| $800 to $1,499 | 331 (56.0%) | 166 (31.4%) |
| $800 to $1,499 | 97 (16.4%) | 267 (50.6%) |
| Total | 591 (100.0%) | 528 (100.0%) |
Health & Disability in Franklin
Health Insurance Coverage by Age in Franklin
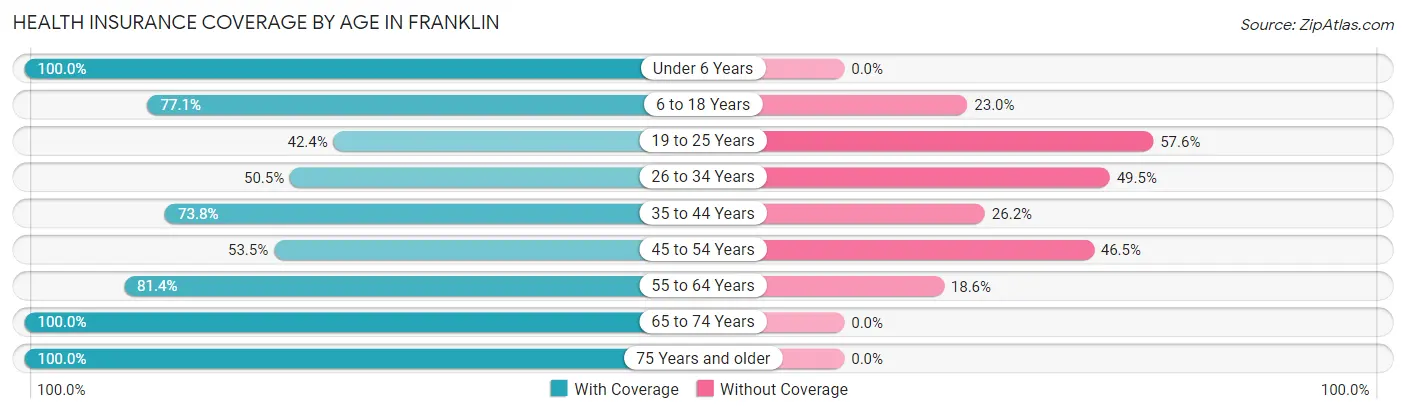
| Age Bracket | With Coverage | Without Coverage |
| Under 6 Years | 179 (100.0%) | 0 (0.0%) |
| 6 to 18 Years | 527 (77.0%) | 157 (23.0%) |
| 19 to 25 Years | 167 (42.4%) | 227 (57.6%) |
| 26 to 34 Years | 101 (50.5%) | 99 (49.5%) |
| 35 to 44 Years | 349 (73.8%) | 124 (26.2%) |
| 45 to 54 Years | 269 (53.5%) | 234 (46.5%) |
| 55 to 64 Years | 557 (81.4%) | 127 (18.6%) |
| 65 to 74 Years | 457 (100.0%) | 0 (0.0%) |
| 75 Years and older | 599 (100.0%) | 0 (0.0%) |
| Total | 3,205 (76.8%) | 968 (23.2%) |
Health Insurance Coverage by Citizenship Status in Franklin
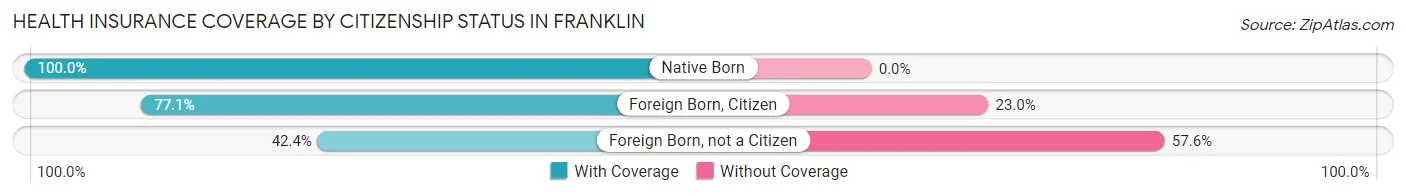
| Citizenship Status | With Coverage | Without Coverage |
| Native Born | 179 (100.0%) | 0 (0.0%) |
| Foreign Born, Citizen | 527 (77.0%) | 157 (23.0%) |
| Foreign Born, not a Citizen | 167 (42.4%) | 227 (57.6%) |
Health Insurance Coverage by Household Income in Franklin
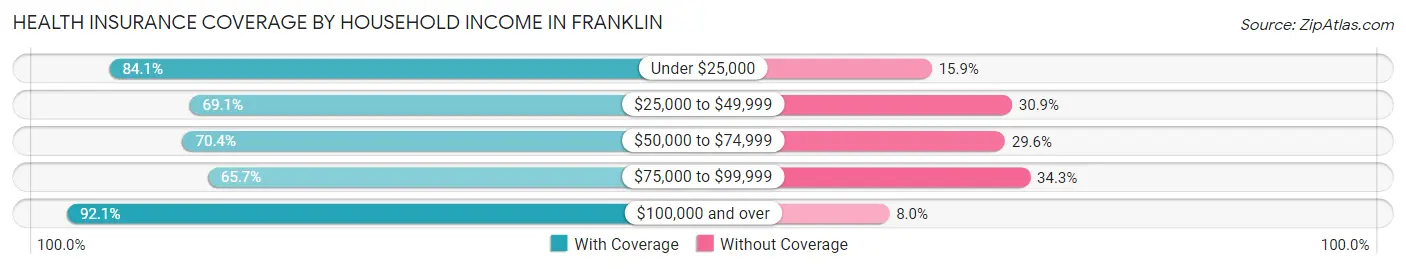
| Household Income | With Coverage | Without Coverage |
| Under $25,000 | 851 (84.1%) | 161 (15.9%) |
| $25,000 to $49,999 | 835 (69.1%) | 374 (30.9%) |
| $50,000 to $74,999 | 454 (70.4%) | 191 (29.6%) |
| $75,000 to $99,999 | 348 (65.7%) | 182 (34.3%) |
| $100,000 and over | 695 (92.0%) | 60 (8.0%) |
Public vs Private Health Insurance Coverage by Age in Franklin
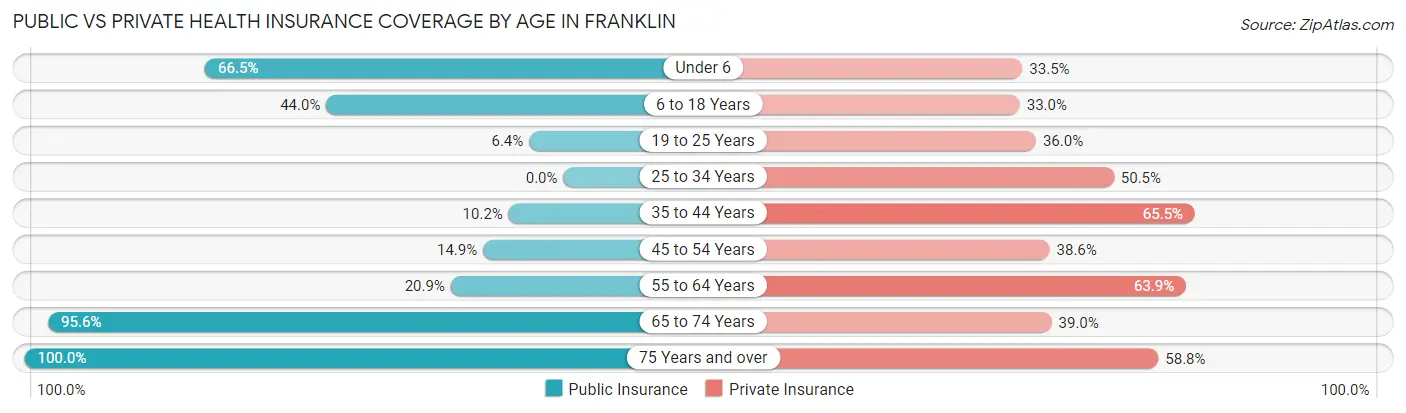
| Age Bracket | Public Insurance | Private Insurance |
| Under 6 | 119 (66.5%) | 60 (33.5%) |
| 6 to 18 Years | 301 (44.0%) | 226 (33.0%) |
| 19 to 25 Years | 25 (6.4%) | 142 (36.0%) |
| 25 to 34 Years | 0 (0.0%) | 101 (50.5%) |
| 35 to 44 Years | 48 (10.2%) | 310 (65.5%) |
| 45 to 54 Years | 75 (14.9%) | 194 (38.6%) |
| 55 to 64 Years | 143 (20.9%) | 437 (63.9%) |
| 65 to 74 Years | 437 (95.6%) | 178 (39.0%) |
| 75 Years and over | 599 (100.0%) | 352 (58.8%) |
| Total | 1,747 (41.9%) | 2,000 (47.9%) |
Disability Status by Sex by Age in Franklin
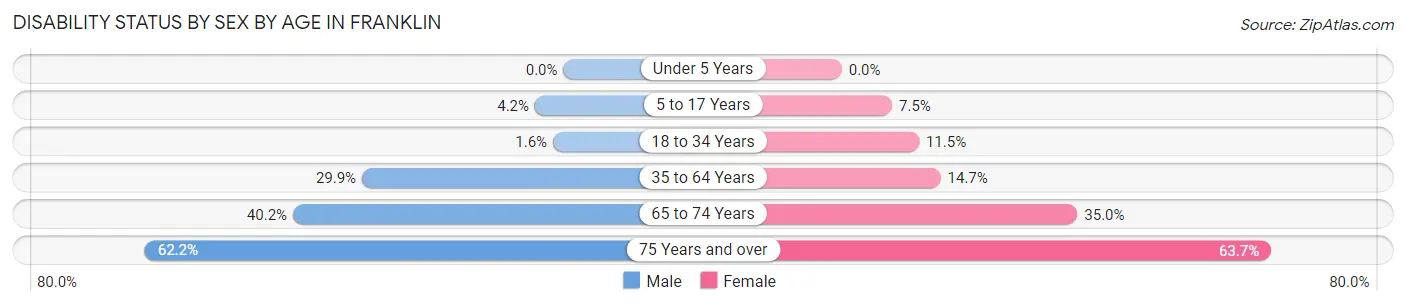
| Age Bracket | Male | Female |
| Under 5 Years | 0 (0.0%) | 0 (0.0%) |
| 5 to 17 Years | 13 (4.2%) | 23 (7.5%) |
| 18 to 34 Years | 6 (1.5%) | 33 (11.5%) |
| 35 to 64 Years | 262 (29.9%) | 115 (14.7%) |
| 65 to 74 Years | 102 (40.2%) | 71 (35.0%) |
| 75 Years and over | 110 (62.2%) | 269 (63.7%) |
Disability Class by Sex by Age in Franklin
Disability Class: Hearing Difficulty
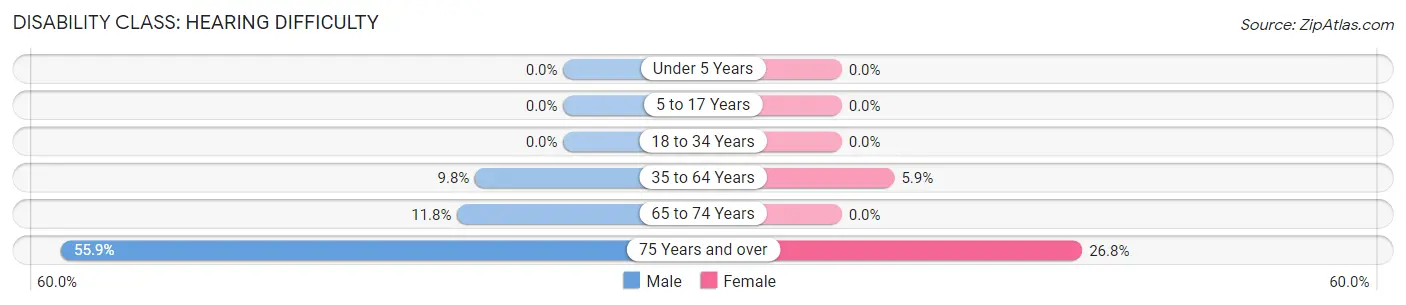
| Age Bracket | Male | Female |
| Under 5 Years | 0 (0.0%) | 0 (0.0%) |
| 5 to 17 Years | 0 (0.0%) | 0 (0.0%) |
| 18 to 34 Years | 0 (0.0%) | 0 (0.0%) |
| 35 to 64 Years | 86 (9.8%) | 46 (5.9%) |
| 65 to 74 Years | 30 (11.8%) | 0 (0.0%) |
| 75 Years and over | 99 (55.9%) | 113 (26.8%) |
Disability Class: Vision Difficulty
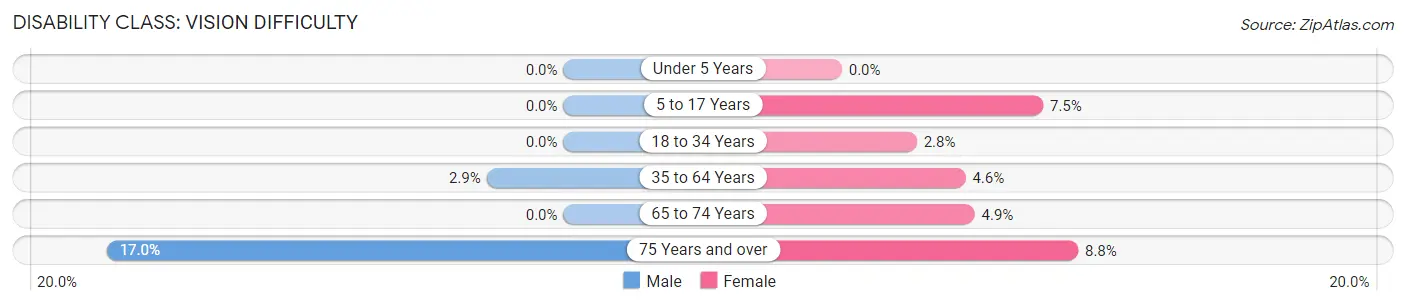
| Age Bracket | Male | Female |
| Under 5 Years | 0 (0.0%) | 0 (0.0%) |
| 5 to 17 Years | 0 (0.0%) | 23 (7.5%) |
| 18 to 34 Years | 0 (0.0%) | 8 (2.8%) |
| 35 to 64 Years | 25 (2.9%) | 36 (4.6%) |
| 65 to 74 Years | 0 (0.0%) | 10 (4.9%) |
| 75 Years and over | 30 (17.0%) | 37 (8.8%) |
Disability Class: Cognitive Difficulty
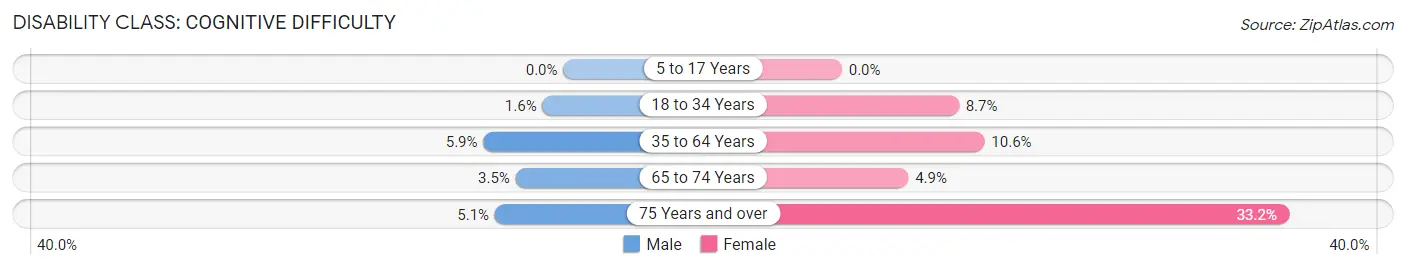
| Age Bracket | Male | Female |
| 5 to 17 Years | 0 (0.0%) | 0 (0.0%) |
| 18 to 34 Years | 6 (1.5%) | 25 (8.7%) |
| 35 to 64 Years | 52 (5.9%) | 83 (10.6%) |
| 65 to 74 Years | 9 (3.5%) | 10 (4.9%) |
| 75 Years and over | 9 (5.1%) | 140 (33.2%) |
Disability Class: Ambulatory Difficulty
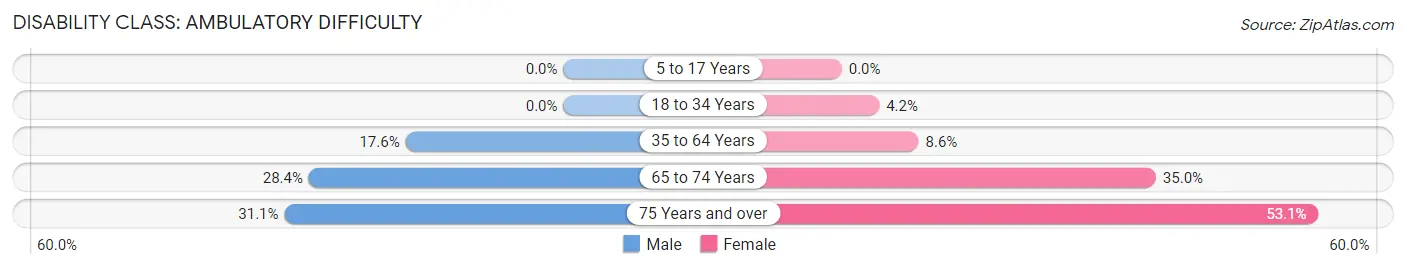
| Age Bracket | Male | Female |
| 5 to 17 Years | 0 (0.0%) | 0 (0.0%) |
| 18 to 34 Years | 0 (0.0%) | 12 (4.2%) |
| 35 to 64 Years | 154 (17.6%) | 67 (8.6%) |
| 65 to 74 Years | 72 (28.3%) | 71 (35.0%) |
| 75 Years and over | 55 (31.1%) | 224 (53.1%) |
Disability Class: Self-Care Difficulty
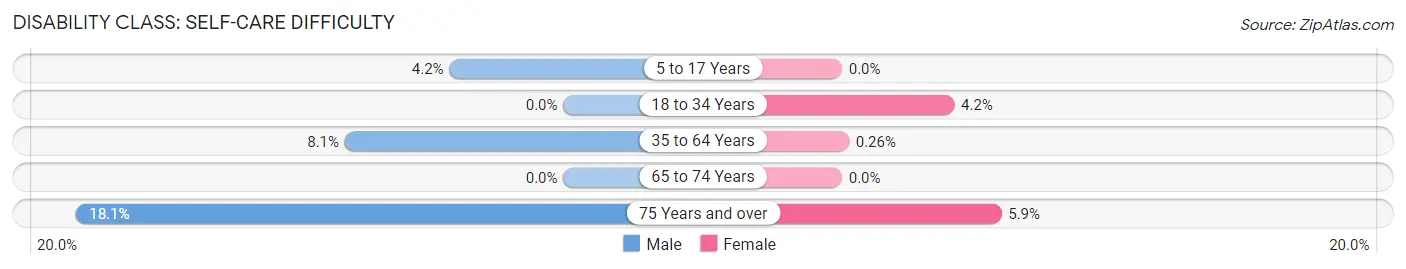
| Age Bracket | Male | Female |
| 5 to 17 Years | 13 (4.2%) | 0 (0.0%) |
| 18 to 34 Years | 0 (0.0%) | 12 (4.2%) |
| 35 to 64 Years | 71 (8.1%) | 2 (0.3%) |
| 65 to 74 Years | 0 (0.0%) | 0 (0.0%) |
| 75 Years and over | 32 (18.1%) | 25 (5.9%) |
Technology Access in Franklin
Computing Device Access in Franklin
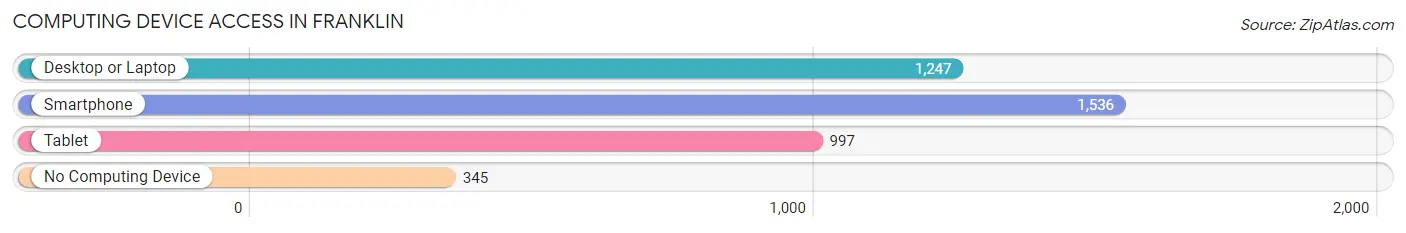
| Device Type | # Households | % Households |
| Desktop or Laptop | 1,247 | 63.5% |
| Smartphone | 1,536 | 78.2% |
| Tablet | 997 | 50.8% |
| No Computing Device | 345 | 17.6% |
| Total | 1,964 | 100.0% |
Internet Access in Franklin
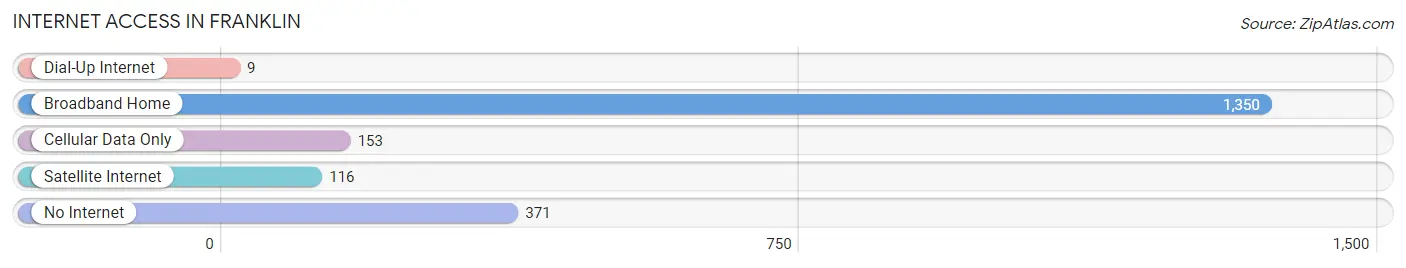
| Internet Type | # Households | % Households |
| Dial-Up Internet | 9 | 0.5% |
| Broadband Home | 1,350 | 68.7% |
| Cellular Data Only | 153 | 7.8% |
| Satellite Internet | 116 | 5.9% |
| No Internet | 371 | 18.9% |
| Total | 1,964 | 100.0% |
Franklin Summary
Franklin, North Carolina is a small town located in the western part of the state, in the Appalachian Mountains. It is the county seat of Macon County, and is situated in the Nantahala National Forest. The town has a population of approximately 3,600 people, and is the largest town in Macon County.
History
Franklin was founded in 1820 by John Franklin, a Revolutionary War veteran. He named the town after himself, and it was incorporated in 1855. The town was originally a trading post, and it quickly grew into a thriving community. The town was a major stop on the Western North Carolina Railroad, and it was also the site of the first public school in Macon County.
In the late 19th century, the town became a major center for the timber industry. The town was also home to several large textile mills, which provided employment for many of the town’s residents.
Geography
Franklin is located in the western part of North Carolina, in the Appalachian Mountains. The town is situated in the Nantahala National Forest, and is surrounded by the Nantahala River and the Little Tennessee River. The town is located at an elevation of 1,890 feet, and has a total area of 4.2 square miles.
Economy
Franklin’s economy is largely based on tourism, as the town is a popular destination for outdoor recreation. The town is home to several attractions, including the Macon County Historical Museum, the Cowee Valley Historical Museum, and the Franklin Gem and Mineral Museum. The town is also home to several wineries, and is a popular destination for wine tasting.
The town is also home to several manufacturing companies, including a paper mill, a furniture factory, and a plastics factory. The town is also home to several retail stores, restaurants, and other businesses.
Demographics
As of the 2010 census, the population of Franklin was 3,619. The racial makeup of the town was 94.3% White, 2.2% African American, 0.3% Native American, 0.7% Asian, 0.1% Pacific Islander, 1.2% from other races, and 1.3% from two or more races. Hispanic or Latino of any race were 2.7% of the population.
The median income for a household in the town was $30,938, and the median income for a family was $37,917. The per capita income for the town was $17,845. About 17.2% of families and 20.3% of the population were below the poverty line, including 28.2% of those under age 18 and 16.2% of those age 65 or over.
Common Questions
What is Per Capita Income in Franklin?
Per Capita income in Franklin is $25,449.
What is the Median Family Income in Franklin?
Median Family Income in Franklin is $56,852.
What is the Median Household income in Franklin?
Median Household Income in Franklin is $38,947.
What is Income or Wage Gap in Franklin?
Income or Wage Gap in Franklin is 45.6%.
Women in Franklin earn 54.4 cents for every dollar earned by a man.
What is Inequality or Gini Index in Franklin?
Inequality or Gini Index in Franklin is 0.42.
What is the Total Population of Franklin?
Total Population of Franklin is 4,184.
What is the Total Male Population of Franklin?
Total Male Population of Franklin is 2,156.
What is the Total Female Population of Franklin?
Total Female Population of Franklin is 2,028.
What is the Ratio of Males per 100 Females in Franklin?
There are 106.31 Males per 100 Females in Franklin.
What is the Ratio of Females per 100 Males in Franklin?
There are 94.06 Females per 100 Males in Franklin.
What is the Median Population Age in Franklin?
Median Population Age in Franklin is 48.0 Years.
What is the Average Family Size in Franklin
Average Family Size in Franklin is 2.9 People.
What is the Average Household Size in Franklin
Average Household Size in Franklin is 2.1 People.
How Large is the Labor Force in Franklin?
There are 1,816 People in the Labor Forcein in Franklin.
What is the Percentage of People in the Labor Force in Franklin?
50.8% of People are in the Labor Force in Franklin.
What is the Unemployment Rate in Franklin?
Unemployment Rate in Franklin is 3.7%.