Swannanoa, NC Map & Demographics
Swannanoa Map
Swannanoa Overview
$25,837
PER CAPITA INCOME
$71,350
AVG FAMILY INCOME
$64,815
AVG HOUSEHOLD INCOME
22.9%
WAGE / INCOME GAP [ % ]
77.1¢/ $1
WAGE / INCOME GAP [ $ ]
0.36
INEQUALITY / GINI INDEX
5,338
TOTAL POPULATION
2,730
MALE POPULATION
2,608
FEMALE POPULATION
104.68
MALES / 100 FEMALES
95.53
FEMALES / 100 MALES
33.5
MEDIAN AGE
3.4
AVG FAMILY SIZE
3.0
AVG HOUSEHOLD SIZE
2,109
LABOR FORCE [ PEOPLE ]
50.7%
PERCENT IN LABOR FORCE
1.5%
UNEMPLOYMENT RATE
Swannanoa Zip Codes
Swannanoa Area Codes
Income in Swannanoa
Income Overview in Swannanoa
Per Capita Income in Swannanoa is $25,837, while median incomes of families and households are $71,350 and $64,815 respectively.
| Characteristic | Number | Measure |
| Per Capita Income | 5,338 | $25,837 |
| Median Family Income | 1,111 | $71,350 |
| Mean Family Income | 1,111 | $79,525 |
| Median Household Income | 1,614 | $64,815 |
| Mean Household Income | 1,614 | $73,255 |
| Income Deficit | 1,111 | $0 |
| Wage / Income Gap (%) | 5,338 | 22.90% |
| Wage / Income Gap ($) | 5,338 | 77.10¢ per $1 |
| Gini / Inequality Index | 5,338 | 0.36 |
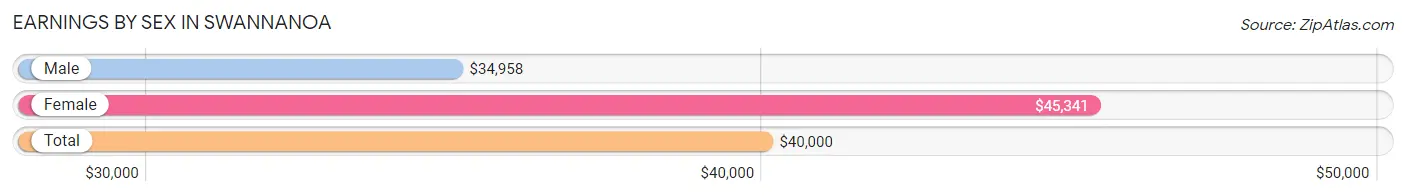
Earnings by Sex in Swannanoa
Average Earnings in Swannanoa are $40,000, $34,958 for men and $45,341 for women, a difference of 22.9%.
| Sex | Number | Average Earnings |
| Male | 1,304 (55.6%) | $34,958 |
| Female | 1,040 (44.4%) | $45,341 |
| Total | 2,344 (100.0%) | $40,000 |
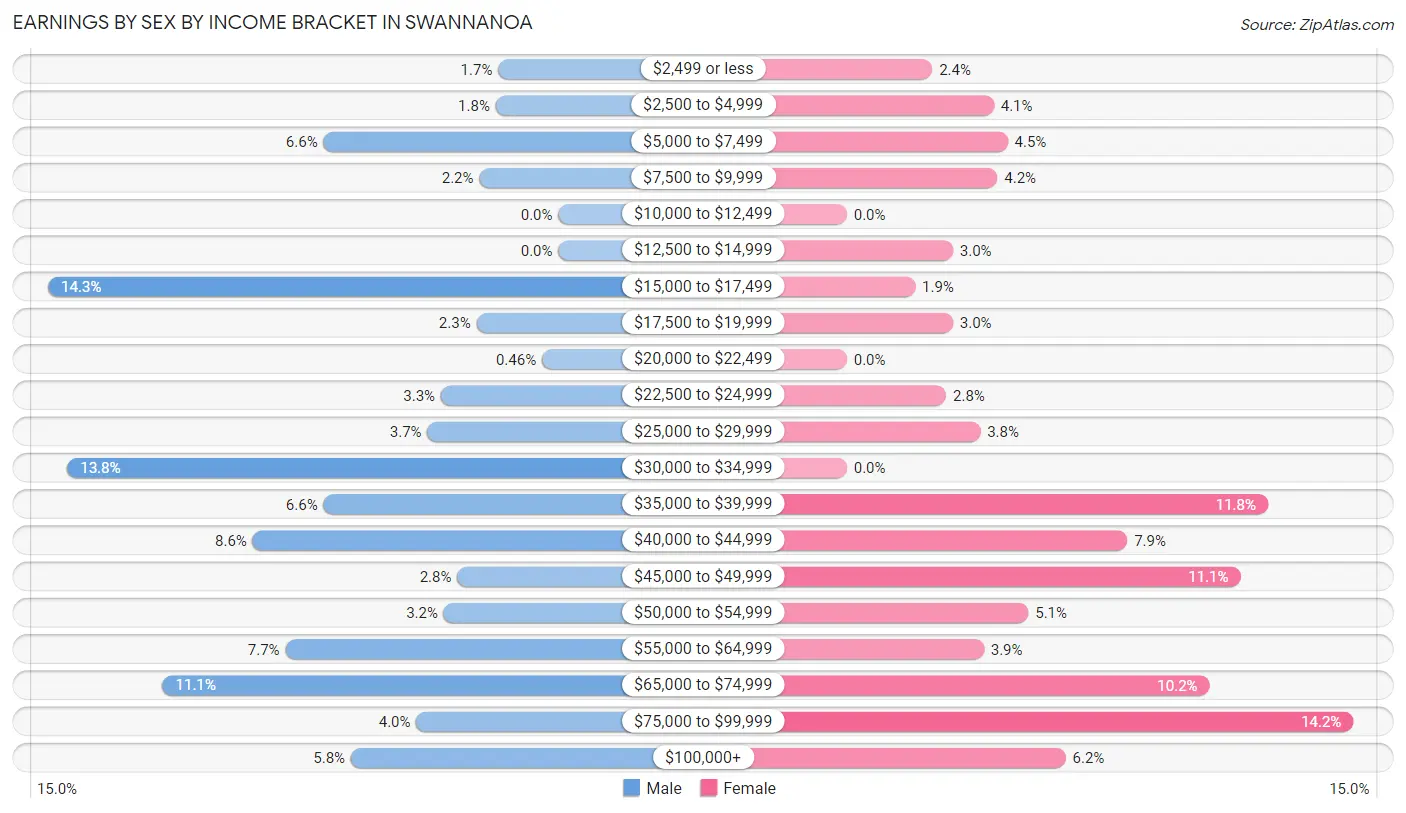
Earnings by Sex by Income Bracket in Swannanoa
The most common earnings brackets in Swannanoa are $15,000 to $17,499 for men (187 | 14.3%) and $75,000 to $99,999 for women (148 | 14.2%).
| Income | Male | Female |
| $2,499 or less | 22 (1.7%) | 25 (2.4%) |
| $2,500 to $4,999 | 23 (1.8%) | 43 (4.1%) |
| $5,000 to $7,499 | 86 (6.6%) | 47 (4.5%) |
| $7,500 to $9,999 | 29 (2.2%) | 44 (4.2%) |
| $10,000 to $12,499 | 0 (0.0%) | 0 (0.0%) |
| $12,500 to $14,999 | 0 (0.0%) | 31 (3.0%) |
| $15,000 to $17,499 | 187 (14.3%) | 20 (1.9%) |
| $17,500 to $19,999 | 30 (2.3%) | 31 (3.0%) |
| $20,000 to $22,499 | 6 (0.5%) | 0 (0.0%) |
| $22,500 to $24,999 | 43 (3.3%) | 29 (2.8%) |
| $25,000 to $29,999 | 48 (3.7%) | 39 (3.7%) |
| $30,000 to $34,999 | 180 (13.8%) | 0 (0.0%) |
| $35,000 to $39,999 | 86 (6.6%) | 123 (11.8%) |
| $40,000 to $44,999 | 112 (8.6%) | 82 (7.9%) |
| $45,000 to $49,999 | 37 (2.8%) | 115 (11.1%) |
| $50,000 to $54,999 | 42 (3.2%) | 53 (5.1%) |
| $55,000 to $64,999 | 100 (7.7%) | 40 (3.8%) |
| $65,000 to $74,999 | 145 (11.1%) | 106 (10.2%) |
| $75,000 to $99,999 | 52 (4.0%) | 148 (14.2%) |
| $100,000+ | 76 (5.8%) | 64 (6.1%) |
| Total | 1,304 (100.0%) | 1,040 (100.0%) |
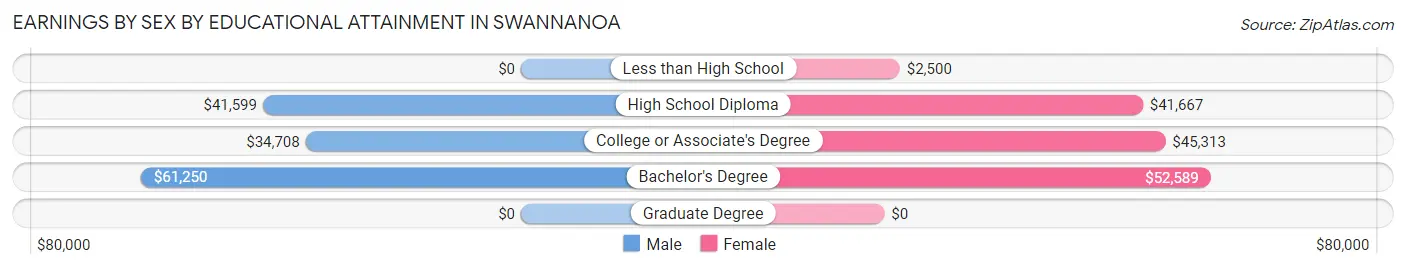
Earnings by Sex by Educational Attainment in Swannanoa
Average earnings in Swannanoa are $40,112 for men and $47,729 for women, a difference of 16.0%. Men with an educational attainment of bachelor's degree enjoy the highest average annual earnings of $61,250, while those with college or associate's degree education earn the least with $34,708. Women with an educational attainment of bachelor's degree earn the most with the average annual earnings of $52,589, while those with less than high school education have the smallest earnings of $2,500.
| Educational Attainment | Male Income | Female Income |
| Less than High School | - | - |
| High School Diploma | $41,599 | $41,667 |
| College or Associate's Degree | $34,708 | $45,313 |
| Bachelor's Degree | $61,250 | $52,589 |
| Graduate Degree | - | - |
| Total | $40,112 | $47,729 |
Family Income in Swannanoa
Family Income Brackets in Swannanoa
According to the Swannanoa family income data, there are 241 families falling into the $50,000 to $74,999 income range, which is the most common income bracket and makes up 21.7% of all families. Conversely, the $10,000 to $14,999 income bracket is the least frequent group with only 7 families (0.6%) belonging to this category.
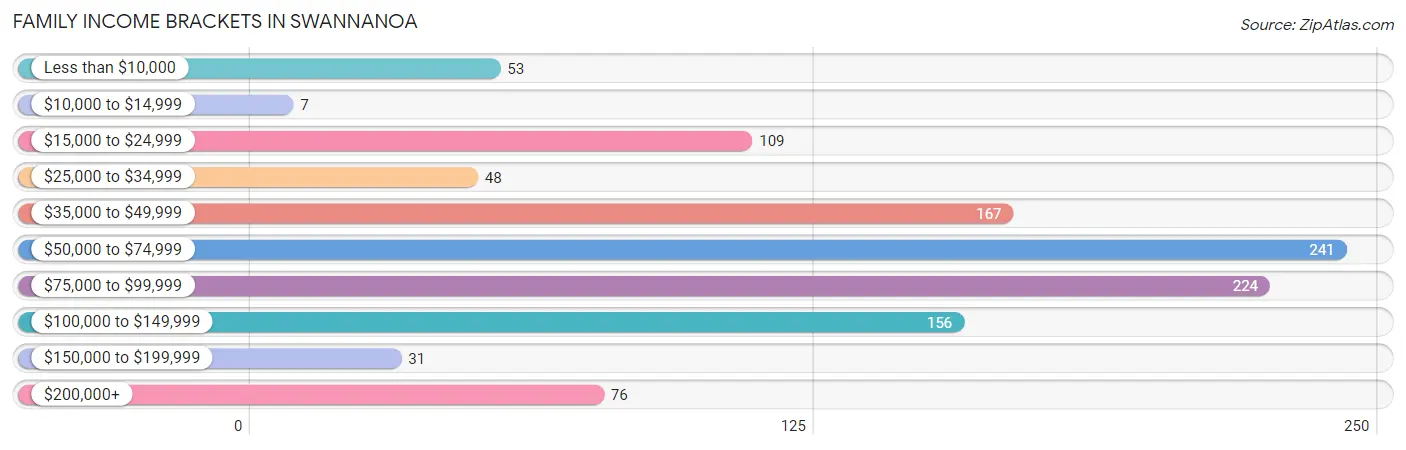
| Income Bracket | # Families | % Families |
| Less than $10,000 | 53 | 4.8% |
| $10,000 to $14,999 | 7 | 0.6% |
| $15,000 to $24,999 | 109 | 9.8% |
| $25,000 to $34,999 | 48 | 4.3% |
| $35,000 to $49,999 | 167 | 15.0% |
| $50,000 to $74,999 | 241 | 21.7% |
| $75,000 to $99,999 | 224 | 20.2% |
| $100,000 to $149,999 | 156 | 14.0% |
| $150,000 to $199,999 | 31 | 2.8% |
| $200,000+ | 76 | 6.8% |
Family Income by Famaliy Size in Swannanoa
4-person families (136 | 12.2%) account for the highest median family income in Swannanoa with $137,431 per family, while 4-person families (136 | 12.2%) have the highest median income of $34,358 per family member.
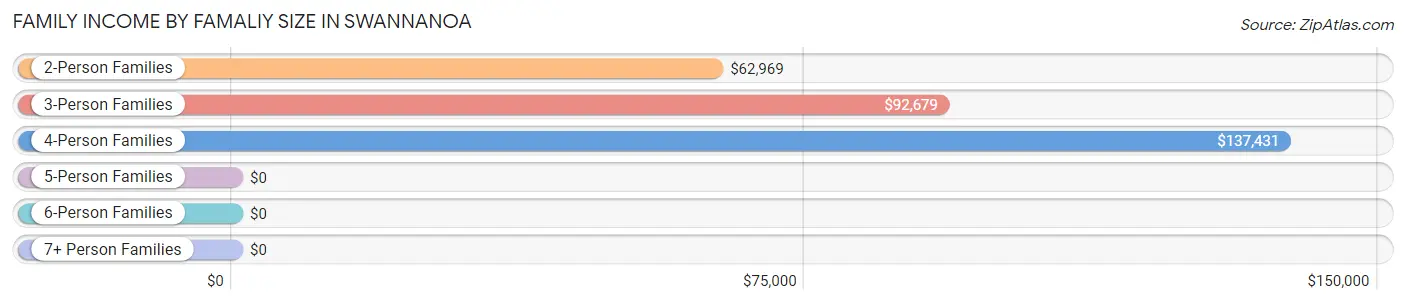
| Income Bracket | # Families | Median Income |
| 2-Person Families | 593 (53.4%) | $62,969 |
| 3-Person Families | 145 (13.1%) | $92,679 |
| 4-Person Families | 136 (12.2%) | $137,431 |
| 5-Person Families | 237 (21.3%) | $0 |
| 6-Person Families | 0 (0.0%) | $0 |
| 7+ Person Families | 0 (0.0%) | $0 |
| Total | 1,111 (100.0%) | $71,350 |
Family Income by Number of Earners in Swannanoa
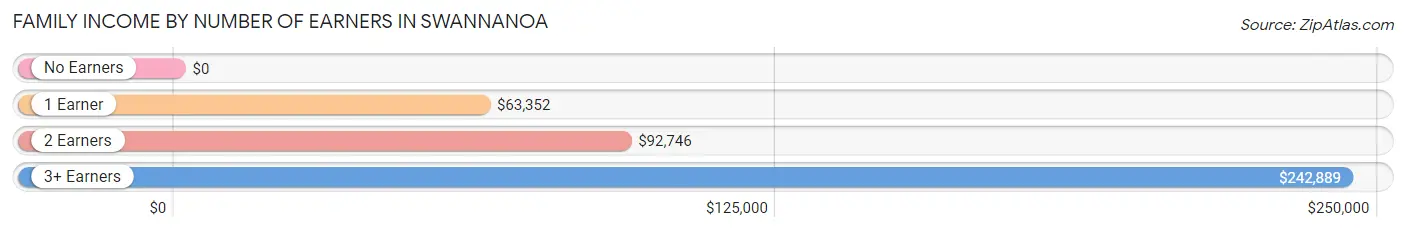
| Number of Earners | # Families | Median Income |
| No Earners | 215 (19.4%) | $0 |
| 1 Earner | 403 (36.3%) | $63,352 |
| 2 Earners | 417 (37.5%) | $92,746 |
| 3+ Earners | 76 (6.8%) | $242,889 |
| Total | 1,111 (100.0%) | $71,350 |
Household Income in Swannanoa
Household Income Brackets in Swannanoa
With 341 households falling in the category, the $50,000 to $74,999 income range is the most frequent in Swannanoa, accounting for 21.1% of all households. In contrast, only 31 households (1.9%) fall into the $150,000 to $199,999 income bracket, making it the least populous group.
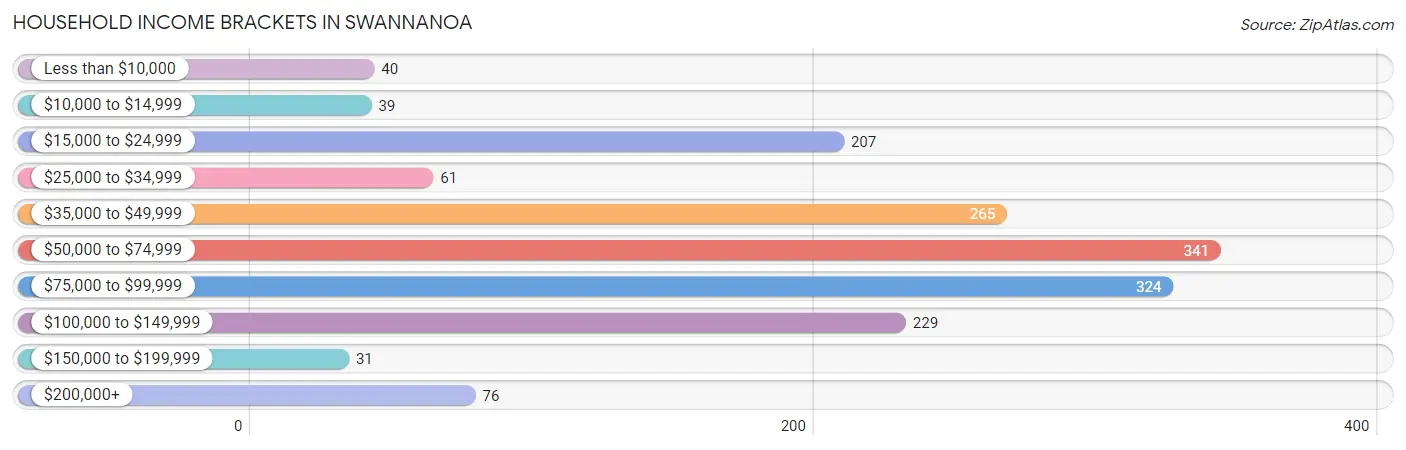
| Income Bracket | # Households | % Households |
| Less than $10,000 | 40 | 2.5% |
| $10,000 to $14,999 | 39 | 2.4% |
| $15,000 to $24,999 | 207 | 12.8% |
| $25,000 to $34,999 | 61 | 3.8% |
| $35,000 to $49,999 | 265 | 16.4% |
| $50,000 to $74,999 | 341 | 21.1% |
| $75,000 to $99,999 | 324 | 20.1% |
| $100,000 to $149,999 | 229 | 14.2% |
| $150,000 to $199,999 | 31 | 1.9% |
| $200,000+ | 76 | 4.7% |
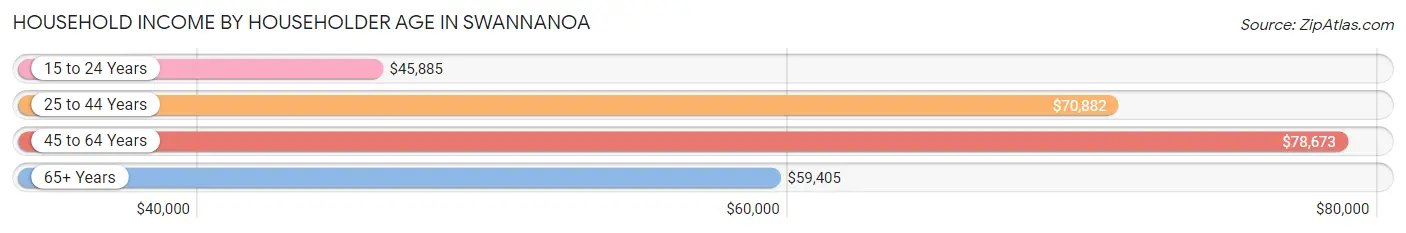
Household Income by Householder Age in Swannanoa
The median household income in Swannanoa is $64,815, with the highest median household income of $78,673 found in the 45 to 64 years age bracket for the primary householder. A total of 536 households (33.2%) fall into this category. Meanwhile, the 15 to 24 years age bracket for the primary householder has the lowest median household income of $45,885, with 105 households (6.5%) in this group.
| Income Bracket | # Households | Median Income |
| 15 to 24 Years | 105 (6.5%) | $45,885 |
| 25 to 44 Years | 609 (37.7%) | $70,882 |
| 45 to 64 Years | 536 (33.2%) | $78,673 |
| 65+ Years | 364 (22.6%) | $59,405 |
| Total | 1,614 (100.0%) | $64,815 |
Poverty in Swannanoa
Income Below Poverty by Sex and Age in Swannanoa
With 15.1% poverty level for males and 21.9% for females among the residents of Swannanoa, 6 to 11 year old males and 5 year old females are the most vulnerable to poverty, with 188 males (50.0%) and 42 females (100.0%) in their respective age groups living below the poverty level.
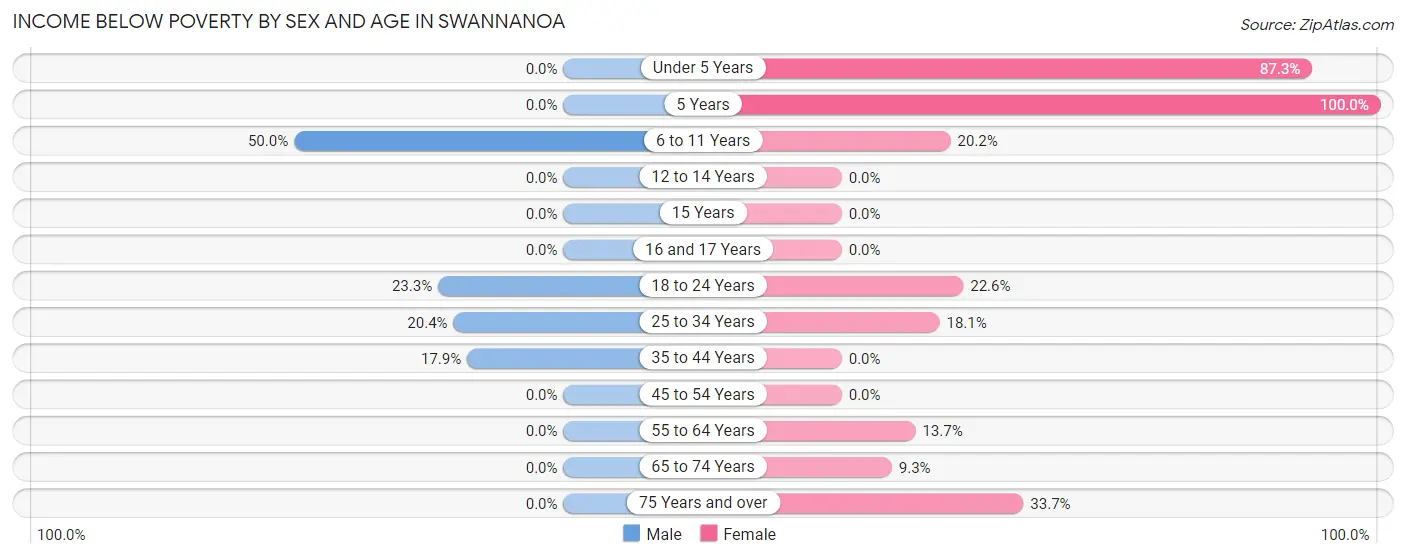
| Age Bracket | Male | Female |
| Under 5 Years | 0 (0.0%) | 165 (87.3%) |
| 5 Years | 0 (0.0%) | 42 (100.0%) |
| 6 to 11 Years | 188 (50.0%) | 41 (20.2%) |
| 12 to 14 Years | 0 (0.0%) | 0 (0.0%) |
| 15 Years | 0 (0.0%) | 0 (0.0%) |
| 16 and 17 Years | 0 (0.0%) | 0 (0.0%) |
| 18 to 24 Years | 57 (23.3%) | 44 (22.6%) |
| 25 to 34 Years | 79 (20.4%) | 109 (18.1%) |
| 35 to 44 Years | 67 (17.9%) | 0 (0.0%) |
| 45 to 54 Years | 0 (0.0%) | 0 (0.0%) |
| 55 to 64 Years | 0 (0.0%) | 64 (13.7%) |
| 65 to 74 Years | 0 (0.0%) | 25 (9.3%) |
| 75 Years and over | 0 (0.0%) | 30 (33.7%) |
| Total | 391 (15.1%) | 520 (21.9%) |
Income Above Poverty by Sex and Age in Swannanoa
According to the poverty statistics in Swannanoa, males aged under 5 years and females aged 12 to 14 years are the age groups that are most secure financially, with 100.0% of males and 100.0% of females in these age groups living above the poverty line.
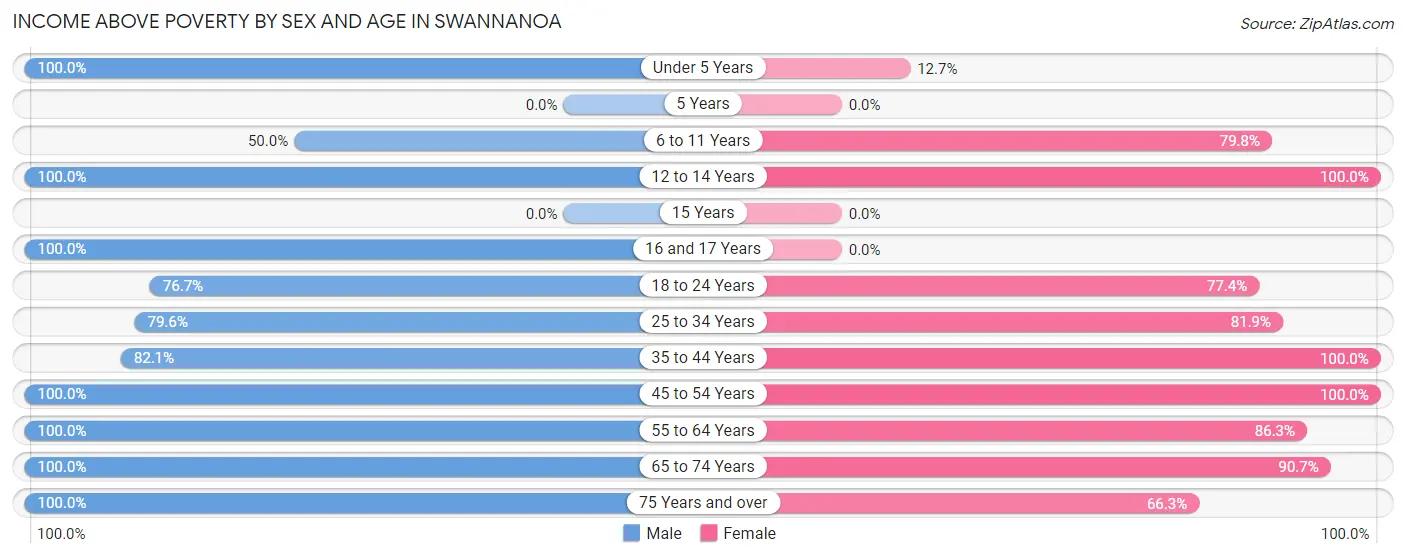
| Age Bracket | Male | Female |
| Under 5 Years | 270 (100.0%) | 24 (12.7%) |
| 5 Years | 0 (0.0%) | 0 (0.0%) |
| 6 to 11 Years | 188 (50.0%) | 162 (79.8%) |
| 12 to 14 Years | 59 (100.0%) | 39 (100.0%) |
| 15 Years | 0 (0.0%) | 0 (0.0%) |
| 16 and 17 Years | 35 (100.0%) | 0 (0.0%) |
| 18 to 24 Years | 188 (76.7%) | 151 (77.4%) |
| 25 to 34 Years | 308 (79.6%) | 492 (81.9%) |
| 35 to 44 Years | 308 (82.1%) | 169 (100.0%) |
| 45 to 54 Years | 257 (100.0%) | 110 (100.0%) |
| 55 to 64 Years | 213 (100.0%) | 404 (86.3%) |
| 65 to 74 Years | 269 (100.0%) | 244 (90.7%) |
| 75 Years and over | 106 (100.0%) | 59 (66.3%) |
| Total | 2,201 (84.9%) | 1,854 (78.1%) |
Income Below Poverty Among Married-Couple Families in Swannanoa
The poverty statistics for married-couple families in Swannanoa show that 13.3% or 109 of the total 817 families live below the poverty line. Families with 1 or 2 children have the highest poverty rate of 41.0%, comprising of 109 families. On the other hand, families with no children have the lowest poverty rate of 0.0%, which includes 0 families.
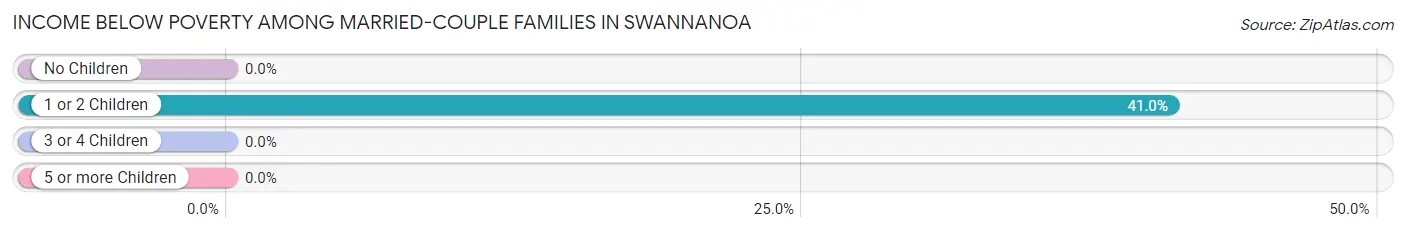
| Children | Above Poverty | Below Poverty |
| No Children | 423 (100.0%) | 0 (0.0%) |
| 1 or 2 Children | 157 (59.0%) | 109 (41.0%) |
| 3 or 4 Children | 128 (100.0%) | 0 (0.0%) |
| 5 or more Children | 0 (0.0%) | 0 (0.0%) |
| Total | 708 (86.7%) | 109 (13.3%) |
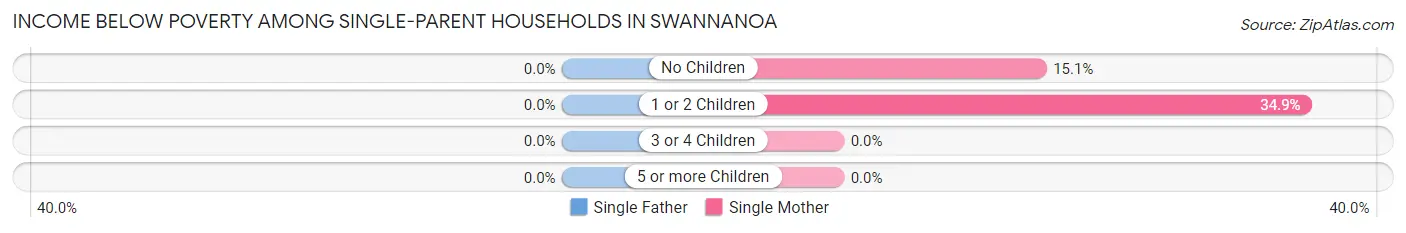
Income Below Poverty Among Single-Parent Households in Swannanoa
| Children | Single Father | Single Mother |
| No Children | 0 (0.0%) | 16 (15.1%) |
| 1 or 2 Children | 0 (0.0%) | 44 (34.9%) |
| 3 or 4 Children | 0 (0.0%) | 0 (0.0%) |
| 5 or more Children | 0 (0.0%) | 0 (0.0%) |
| Total | 0 (0.0%) | 60 (25.9%) |
Income Below Poverty Among Married-Couple vs Single-Parent Households in Swannanoa
The poverty data for Swannanoa shows that 109 of the married-couple family households (13.3%) and 60 of the single-parent households (20.4%) are living below the poverty level. Within the married-couple family households, those with 1 or 2 children have the highest poverty rate, with 109 households (41.0%) falling below the poverty line. Among the single-parent households, those with 1 or 2 children have the highest poverty rate, with 44 household (32.6%) living below poverty.
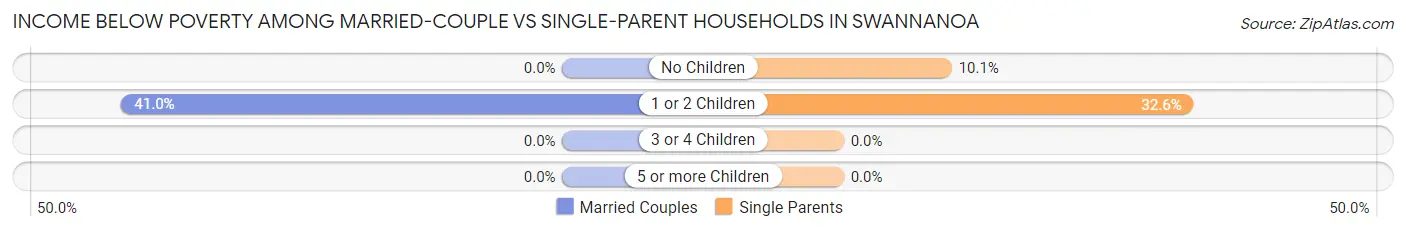
| Children | Married-Couple Families | Single-Parent Households |
| No Children | 0 (0.0%) | 16 (10.1%) |
| 1 or 2 Children | 109 (41.0%) | 44 (32.6%) |
| 3 or 4 Children | 0 (0.0%) | 0 (0.0%) |
| 5 or more Children | 0 (0.0%) | 0 (0.0%) |
| Total | 109 (13.3%) | 60 (20.4%) |
Race in Swannanoa
The most populous races in Swannanoa are White / Caucasian (4,362 | 81.7%), Two or more Races (789 | 14.8%), and Hispanic or Latino (608 | 11.4%).
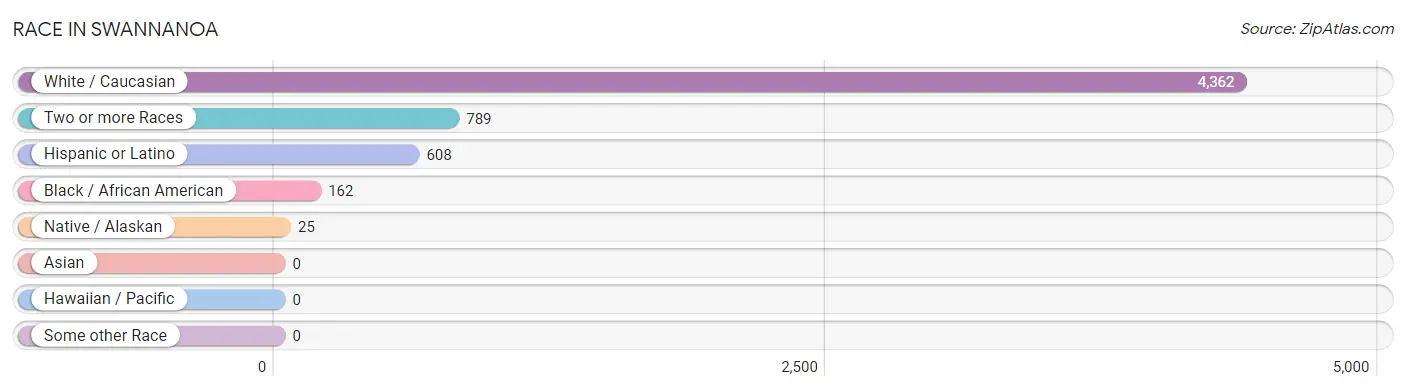
| Race | # Population | % Population |
| Asian | 0 | 0.0% |
| Black / African American | 162 | 3.0% |
| Hawaiian / Pacific | 0 | 0.0% |
| Hispanic or Latino | 608 | 11.4% |
| Native / Alaskan | 25 | 0.5% |
| White / Caucasian | 4,362 | 81.7% |
| Two or more Races | 789 | 14.8% |
| Some other Race | 0 | 0.0% |
| Total | 5,338 | 100.0% |
Ancestry in Swannanoa
The most populous ancestries reported in Swannanoa are English (1,672 | 31.3%), German (534 | 10.0%), Mexican (497 | 9.3%), American (425 | 8.0%), and Irish (322 | 6.0%), together accounting for 64.6% of all Swannanoa residents.
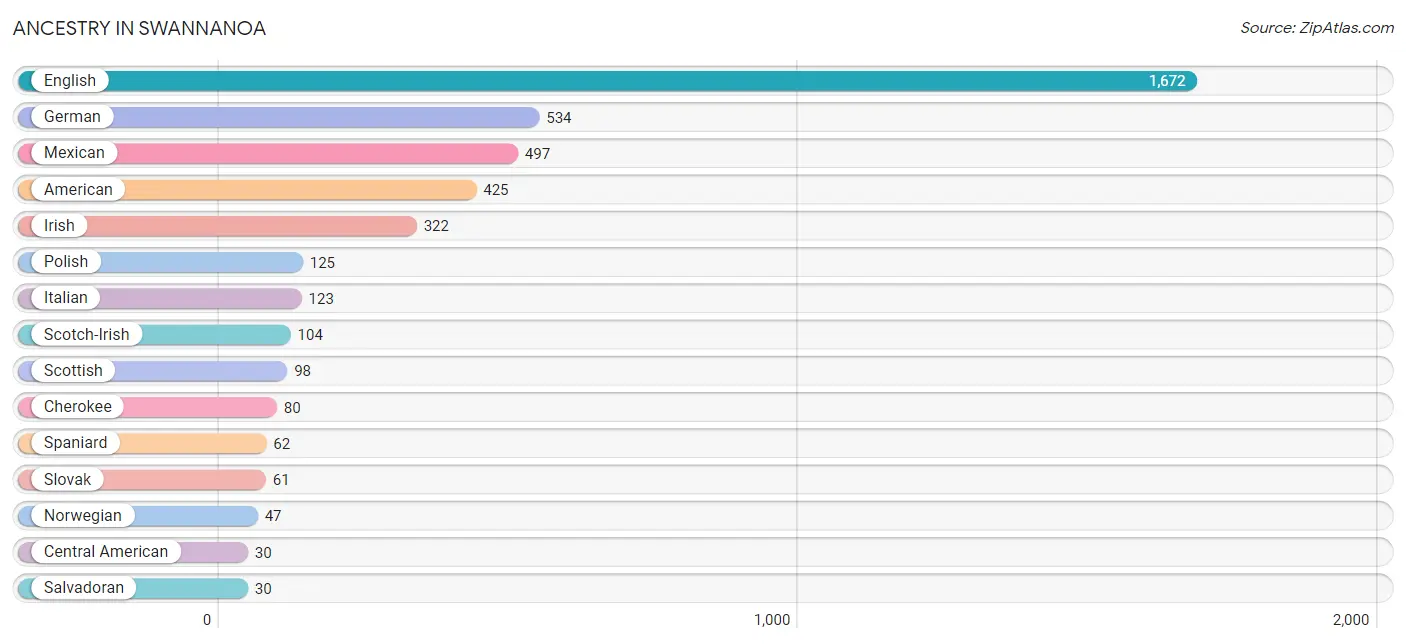
| Ancestry | # Population | % Population |
| American | 425 | 8.0% |
| Austrian | 10 | 0.2% |
| British | 29 | 0.5% |
| Central American | 30 | 0.6% |
| Cherokee | 80 | 1.5% |
| English | 1,672 | 31.3% |
| European | 5 | 0.1% |
| Finnish | 15 | 0.3% |
| French | 25 | 0.5% |
| French Canadian | 20 | 0.4% |
| German | 534 | 10.0% |
| Greek | 26 | 0.5% |
| Irish | 322 | 6.0% |
| Italian | 123 | 2.3% |
| Lumbee | 15 | 0.3% |
| Luxembourger | 23 | 0.4% |
| Mexican | 497 | 9.3% |
| Norwegian | 47 | 0.9% |
| Polish | 125 | 2.3% |
| Portuguese | 1 | 0.0% |
| Puerto Rican | 19 | 0.4% |
| Salvadoran | 30 | 0.6% |
| Scotch-Irish | 104 | 1.9% |
| Scottish | 98 | 1.8% |
| Sioux | 6 | 0.1% |
| Slovak | 61 | 1.1% |
| Spaniard | 62 | 1.2% |
| Swedish | 20 | 0.4% |
| Trinidadian and Tobagonian | 2 | 0.0% |
| Welsh | 4 | 0.1% | View All 30 Rows |
Immigrants in Swannanoa
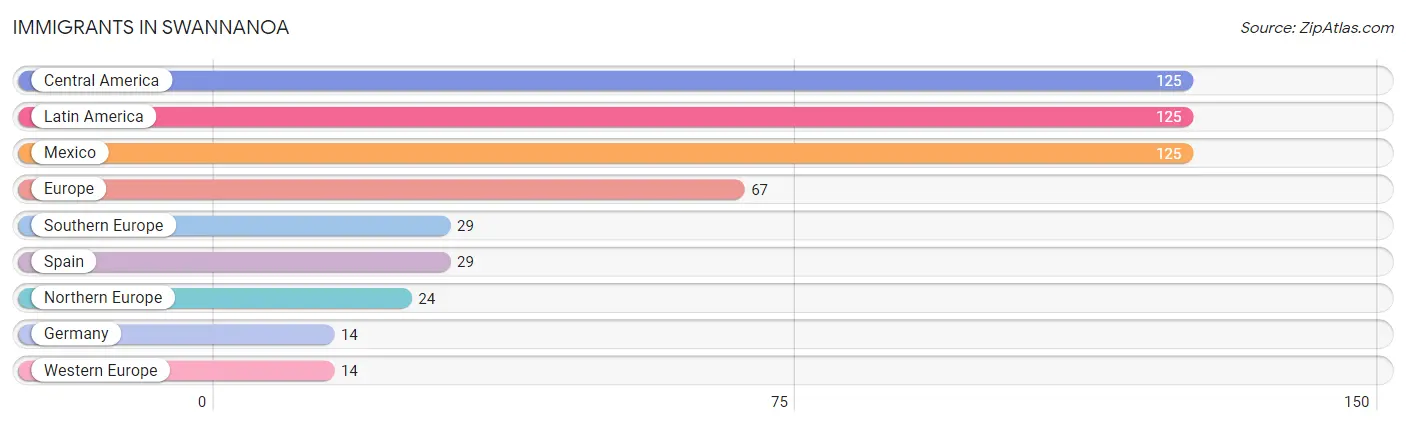
The most numerous immigrant groups reported in Swannanoa came from Central America (125 | 2.3%), Latin America (125 | 2.3%), Mexico (125 | 2.3%), Europe (67 | 1.3%), and Southern Europe (29 | 0.5%), together accounting for 8.8% of all Swannanoa residents.
| Immigration Origin | # Population | % Population |
| Central America | 125 | 2.3% |
| Europe | 67 | 1.3% |
| Germany | 14 | 0.3% |
| Latin America | 125 | 2.3% |
| Mexico | 125 | 2.3% |
| Northern Europe | 24 | 0.4% |
| Southern Europe | 29 | 0.5% |
| Spain | 29 | 0.5% |
| Western Europe | 14 | 0.3% | View All 9 Rows |
Sex and Age in Swannanoa
Sex and Age in Swannanoa
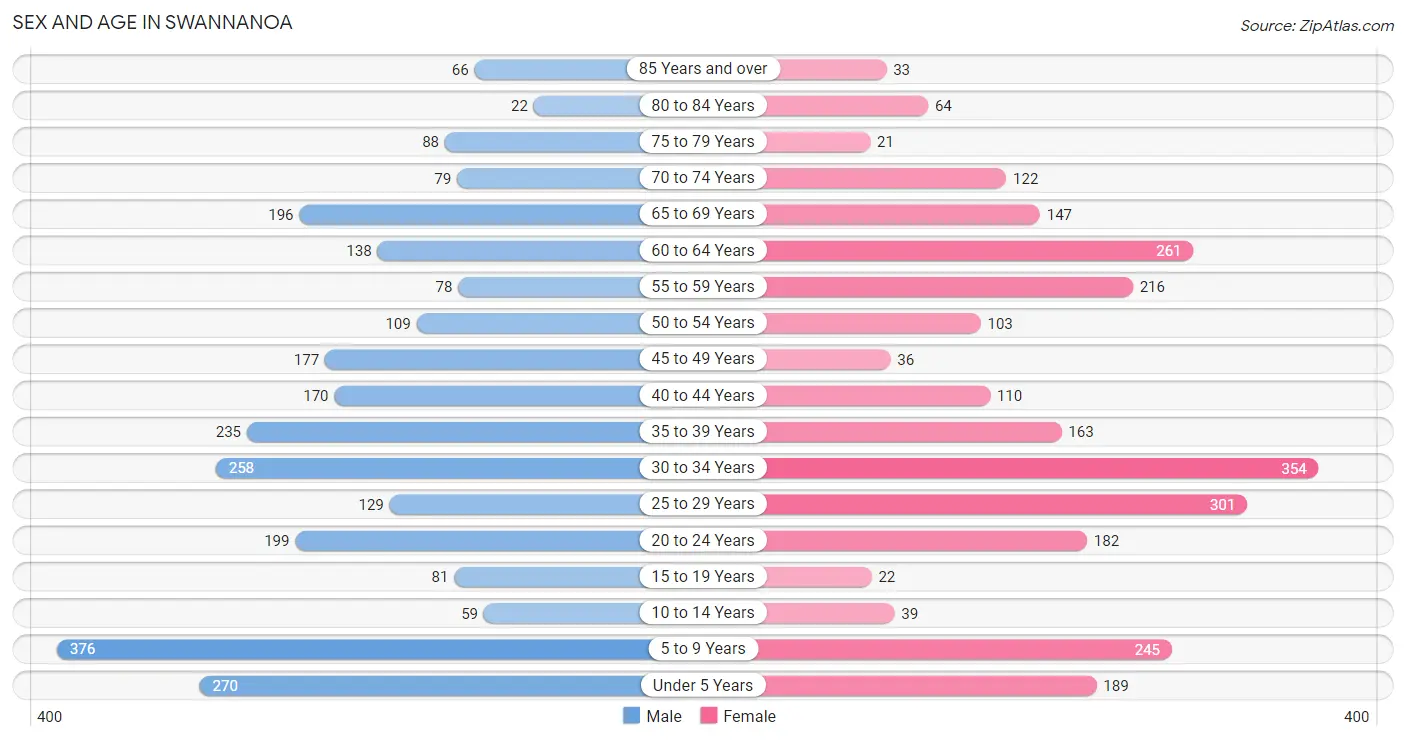
The most populous age groups in Swannanoa are 5 to 9 Years (376 | 13.8%) for men and 30 to 34 Years (354 | 13.6%) for women.
| Age Bracket | Male | Female |
| Under 5 Years | 270 (9.9%) | 189 (7.2%) |
| 5 to 9 Years | 376 (13.8%) | 245 (9.4%) |
| 10 to 14 Years | 59 (2.2%) | 39 (1.5%) |
| 15 to 19 Years | 81 (3.0%) | 22 (0.8%) |
| 20 to 24 Years | 199 (7.3%) | 182 (7.0%) |
| 25 to 29 Years | 129 (4.7%) | 301 (11.5%) |
| 30 to 34 Years | 258 (9.5%) | 354 (13.6%) |
| 35 to 39 Years | 235 (8.6%) | 163 (6.2%) |
| 40 to 44 Years | 170 (6.2%) | 110 (4.2%) |
| 45 to 49 Years | 177 (6.5%) | 36 (1.4%) |
| 50 to 54 Years | 109 (4.0%) | 103 (4.0%) |
| 55 to 59 Years | 78 (2.9%) | 216 (8.3%) |
| 60 to 64 Years | 138 (5.1%) | 261 (10.0%) |
| 65 to 69 Years | 196 (7.2%) | 147 (5.6%) |
| 70 to 74 Years | 79 (2.9%) | 122 (4.7%) |
| 75 to 79 Years | 88 (3.2%) | 21 (0.8%) |
| 80 to 84 Years | 22 (0.8%) | 64 (2.5%) |
| 85 Years and over | 66 (2.4%) | 33 (1.3%) |
| Total | 2,730 (100.0%) | 2,608 (100.0%) |
Families and Households in Swannanoa
Median Family Size in Swannanoa
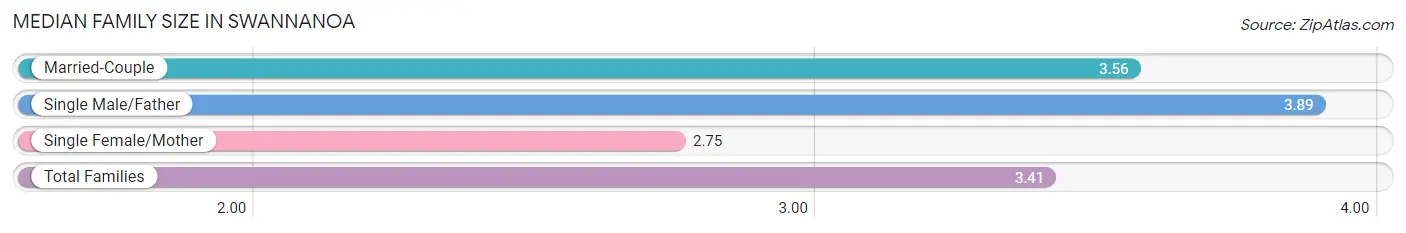
The median family size in Swannanoa is 3.41 persons per family, with single male/father families (62 | 5.6%) accounting for the largest median family size of 3.89 persons per family. On the other hand, single female/mother families (232 | 20.9%) represent the smallest median family size with 2.75 persons per family.
| Family Type | # Families | Family Size |
| Married-Couple | 817 (73.5%) | 3.56 |
| Single Male/Father | 62 (5.6%) | 3.89 |
| Single Female/Mother | 232 (20.9%) | 2.75 |
| Total Families | 1,111 (100.0%) | 3.41 |
Median Household Size in Swannanoa
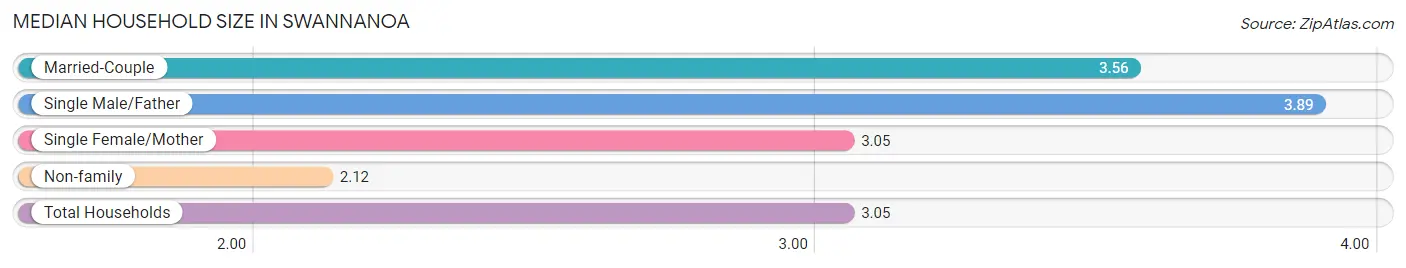
The median household size in Swannanoa is 3.05 persons per household, with single male/father households (62 | 3.8%) accounting for the largest median household size of 3.89 persons per household. non-family households (503 | 31.2%) represent the smallest median household size with 2.12 persons per household.
| Household Type | # Households | Household Size |
| Married-Couple | 817 (50.6%) | 3.56 |
| Single Male/Father | 62 (3.8%) | 3.89 |
| Single Female/Mother | 232 (14.4%) | 3.05 |
| Non-family | 503 (31.2%) | 2.12 |
| Total Households | 1,614 (100.0%) | 3.05 |
Household Size by Marriage Status in Swannanoa
Out of a total of 1,614 households in Swannanoa, 1,111 (68.8%) are family households, while 503 (31.2%) are nonfamily households. The most numerous type of family households are 2-person households, comprising 569, and the most common type of nonfamily households are 1-person households, comprising 308.
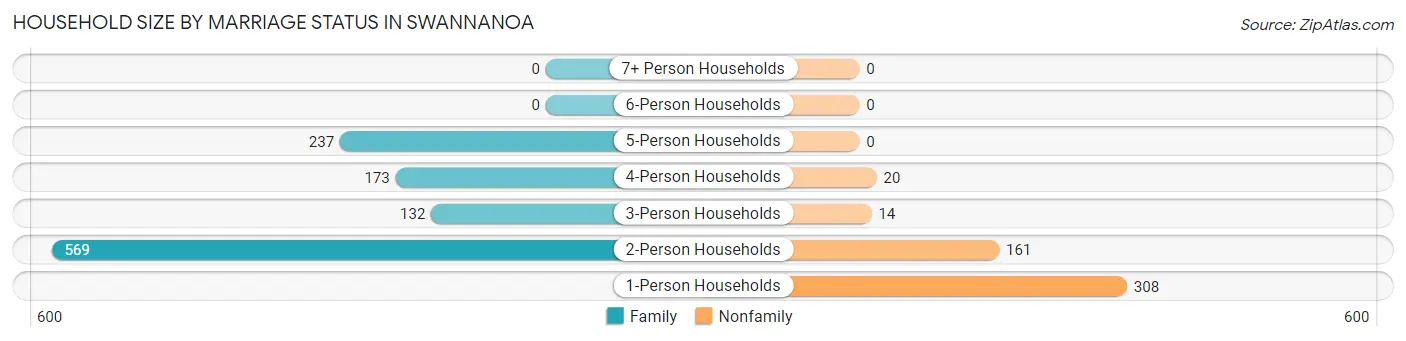
| Household Size | Family Households | Nonfamily Households |
| 1-Person Households | - | 308 (19.1%) |
| 2-Person Households | 569 (35.2%) | 161 (10.0%) |
| 3-Person Households | 132 (8.2%) | 14 (0.9%) |
| 4-Person Households | 173 (10.7%) | 20 (1.2%) |
| 5-Person Households | 237 (14.7%) | 0 (0.0%) |
| 6-Person Households | 0 (0.0%) | 0 (0.0%) |
| 7+ Person Households | 0 (0.0%) | 0 (0.0%) |
| Total | 1,111 (68.8%) | 503 (31.2%) |
Female Fertility in Swannanoa
Fertility by Age in Swannanoa
Average fertility rate in Swannanoa is 117.0 births per 1,000 women. Women in the age bracket of 20 to 34 years have the highest fertility rate with 136.0 births per 1,000 women. Women in the age bracket of 20 to 34 years acount for 83.2% of all women with births.
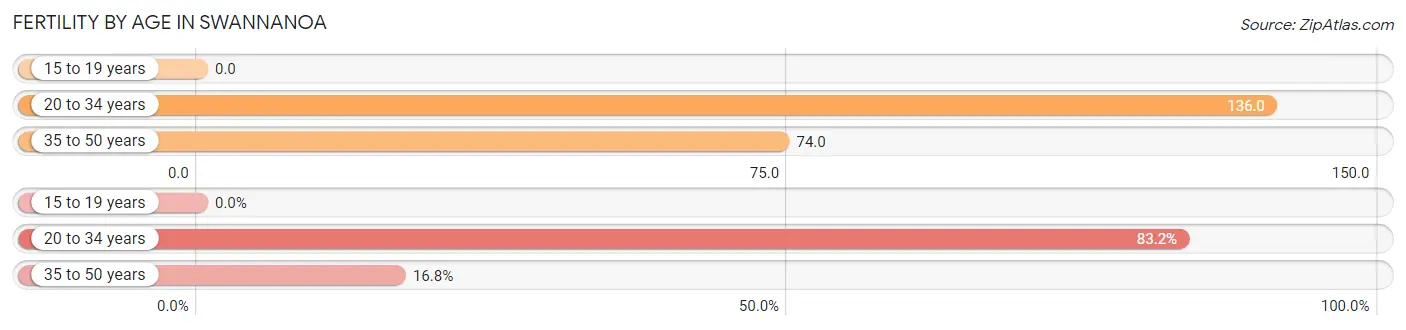
| Age Bracket | Women with Births | Births / 1,000 Women |
| 15 to 19 years | 0 (0.0%) | 0.0 |
| 20 to 34 years | 114 (83.2%) | 136.0 |
| 35 to 50 years | 23 (16.8%) | 74.0 |
| Total | 137 (100.0%) | 117.0 |
Fertility by Age by Marriage Status in Swannanoa
98.5% of women with births (137) in Swannanoa are married. The highest percentage of unmarried women with births falls into 20 to 34 years age bracket with 1.8% of them unmarried at the time of birth, while the lowest percentage of unmarried women with births belong to 35 to 50 years age bracket with 0.0% of them unmarried.
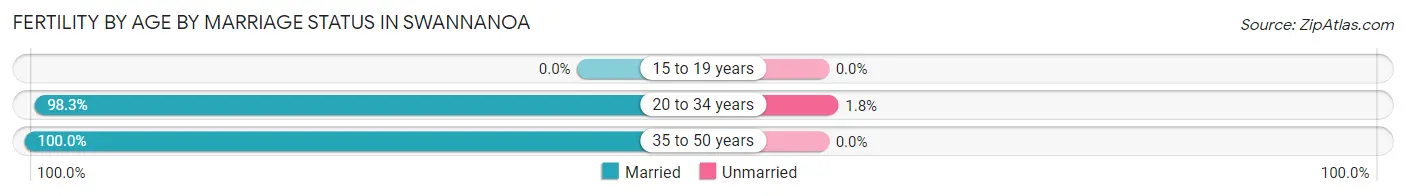
| Age Bracket | Married | Unmarried |
| 15 to 19 years | 0 (0.0%) | 0 (0.0%) |
| 20 to 34 years | 112 (98.3%) | 2 (1.8%) |
| 35 to 50 years | 23 (100.0%) | 0 (0.0%) |
| Total | 135 (98.5%) | 2 (1.5%) |
Fertility by Education in Swannanoa
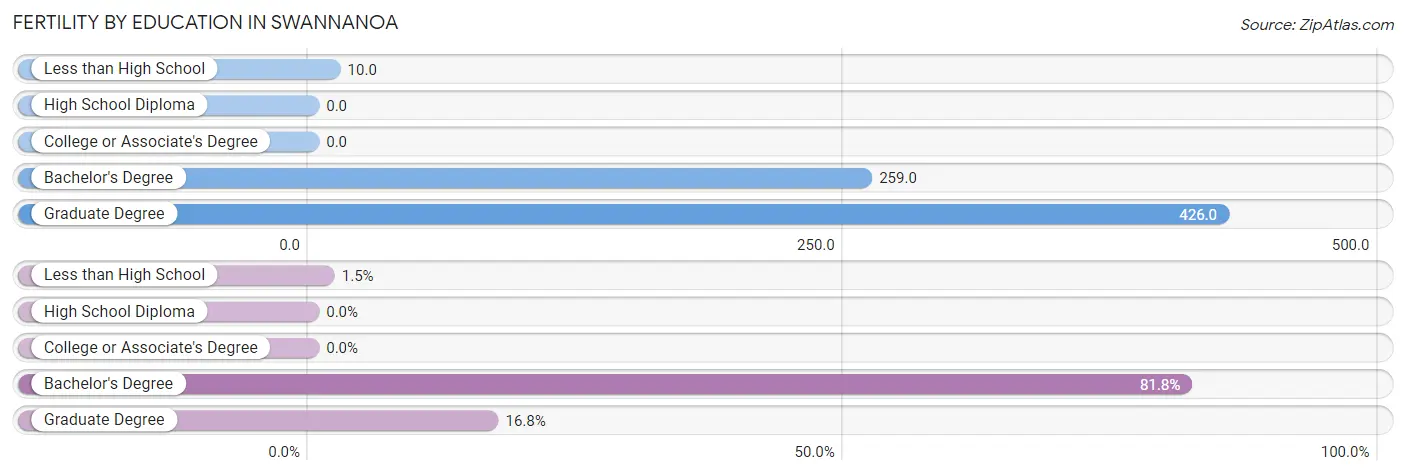
| Educational Attainment | Women with Births | Births / 1,000 Women |
| Less than High School | 2 (1.5%) | 10.0 |
| High School Diploma | 0 (0.0%) | 0.0 |
| College or Associate's Degree | 0 (0.0%) | 0.0 |
| Bachelor's Degree | 112 (81.8%) | 259.0 |
| Graduate Degree | 23 (16.8%) | 426.0 |
| Total | 137 (100.0%) | 117.0 |
Fertility by Education by Marriage Status in Swannanoa
1.5% of women with births in Swannanoa are unmarried. Women with the educational attainment of bachelor's degree are most likely to be married with 100.0% of them married at childbirth, while women with the educational attainment of less than high school are least likely to be married with 100.0% of them unmarried at childbirth.
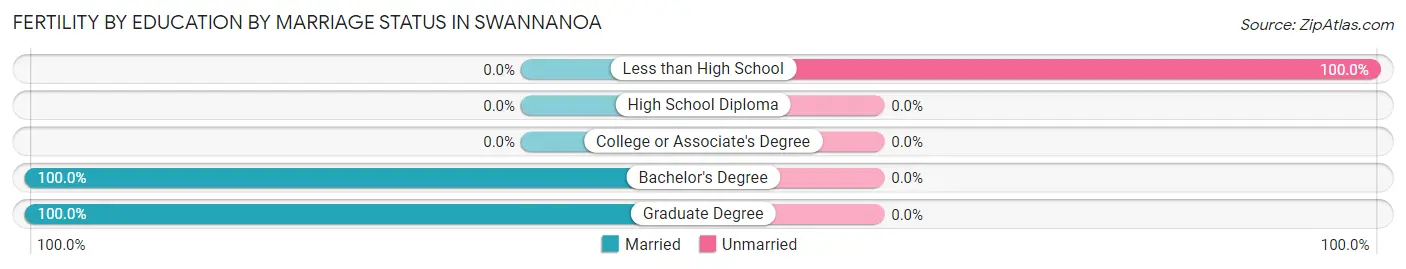
| Educational Attainment | Married | Unmarried |
| Less than High School | 0 (0.0%) | 2 (100.0%) |
| High School Diploma | 0 (0.0%) | 0 (0.0%) |
| College or Associate's Degree | 0 (0.0%) | 0 (0.0%) |
| Bachelor's Degree | 112 (100.0%) | 0 (0.0%) |
| Graduate Degree | 23 (100.0%) | 0 (0.0%) |
| Total | 135 (98.5%) | 2 (1.5%) |
Employment Characteristics in Swannanoa
Employment by Class of Employer in Swannanoa
Among the 2,006 employed individuals in Swannanoa, private company employees (1,157 | 57.7%), not-for-profit organizations (218 | 10.9%), and self-employed (not incorporated) (198 | 9.9%) make up the most common classes of employment.
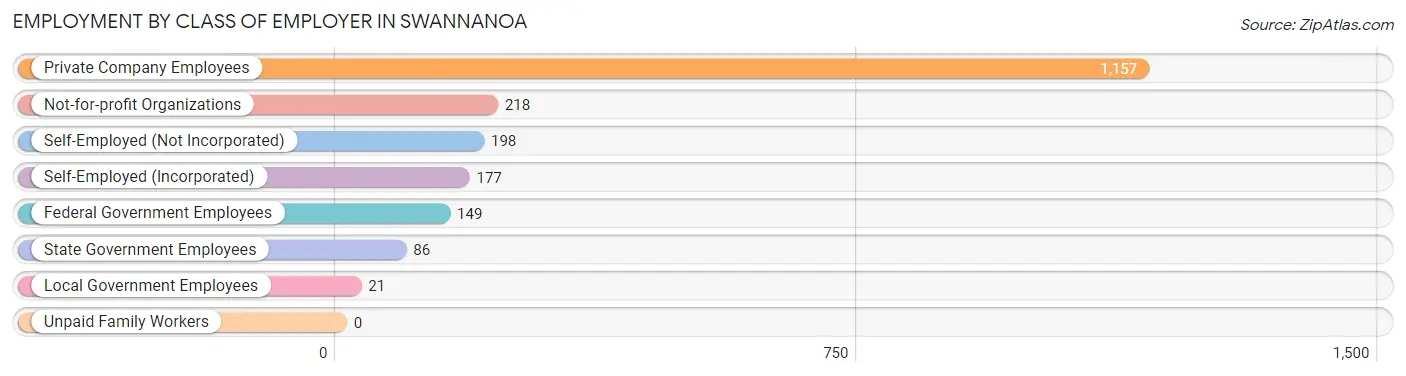
| Employer Class | # Employees | % Employees |
| Private Company Employees | 1,157 | 57.7% |
| Self-Employed (Incorporated) | 177 | 8.8% |
| Self-Employed (Not Incorporated) | 198 | 9.9% |
| Not-for-profit Organizations | 218 | 10.9% |
| Local Government Employees | 21 | 1.1% |
| State Government Employees | 86 | 4.3% |
| Federal Government Employees | 149 | 7.4% |
| Unpaid Family Workers | 0 | 0.0% |
| Total | 2,006 | 100.0% |
Employment Status by Age in Swannanoa
According to the labor force statistics for Swannanoa, out of the total population over 16 years of age (4,160), 50.7% or 2,109 individuals are in the labor force, with 1.5% or 32 of them unemployed. The age group with the highest labor force participation rate is 45 to 54 years, with 83.8% or 356 individuals in the labor force. Within the labor force, the 35 to 44 years age range has the highest percentage of unemployed individuals, with 7.7% or 32 of them being unemployed.
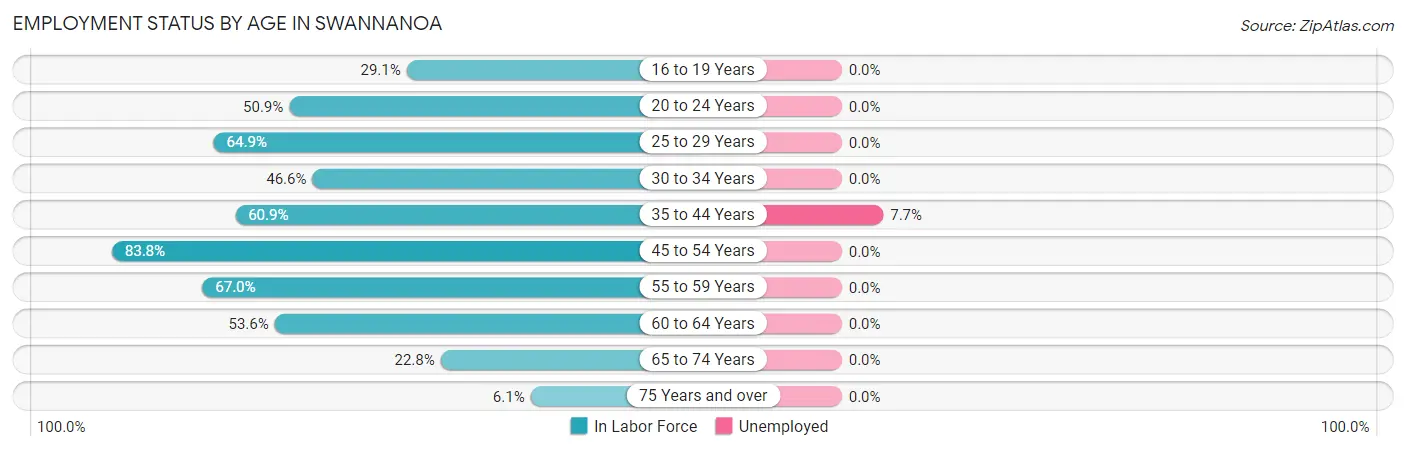
| Age Bracket | In Labor Force | Unemployed |
| 16 to 19 Years | 30 (29.1%) | 0 (0.0%) |
| 20 to 24 Years | 194 (50.9%) | 0 (0.0%) |
| 25 to 29 Years | 279 (64.9%) | 0 (0.0%) |
| 30 to 34 Years | 285 (46.6%) | 0 (0.0%) |
| 35 to 44 Years | 413 (60.9%) | 32 (7.7%) |
| 45 to 54 Years | 356 (83.8%) | 0 (0.0%) |
| 55 to 59 Years | 197 (67.0%) | 0 (0.0%) |
| 60 to 64 Years | 214 (53.6%) | 0 (0.0%) |
| 65 to 74 Years | 124 (22.8%) | 0 (0.0%) |
| 75 Years and over | 18 (6.1%) | 0 (0.0%) |
| Total | 2,109 (50.7%) | 32 (1.5%) |
Employment Status by Educational Attainment in Swannanoa
According to labor force statistics for Swannanoa, 61.5% of individuals (1,745) out of the total population between 25 and 64 years of age (2,838) are in the labor force, with 1.8% or 31 of them being unemployed. The group with the highest labor force participation rate are those with the educational attainment of high school diploma, with 80.9% or 684 individuals in the labor force. Within the labor force, individuals with bachelor's degree or higher education have the highest percentage of unemployment, with 2.6% or 15 of them being unemployed.
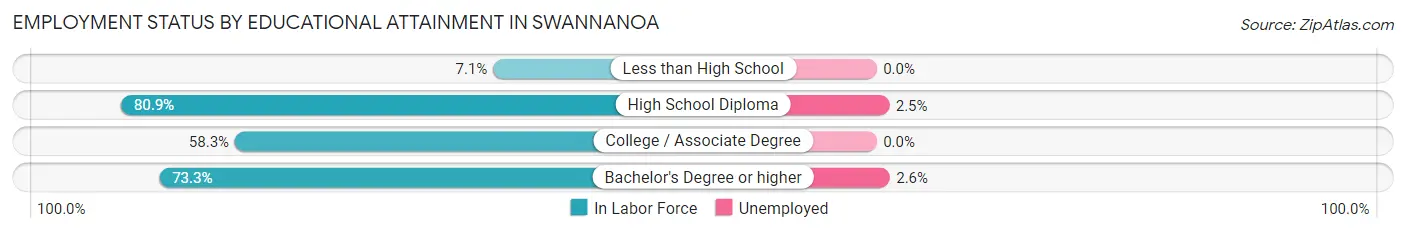
| Educational Attainment | In Labor Force | Unemployed |
| Less than High School | 31 (7.1%) | 0 (0.0%) |
| High School Diploma | 684 (80.9%) | 21 (2.5%) |
| College / Associate Degree | 441 (58.3%) | 0 (0.0%) |
| Bachelor's Degree or higher | 588 (73.3%) | 21 (2.6%) |
| Total | 1,745 (61.5%) | 51 (1.8%) |
Employment Occupations by Sex in Swannanoa
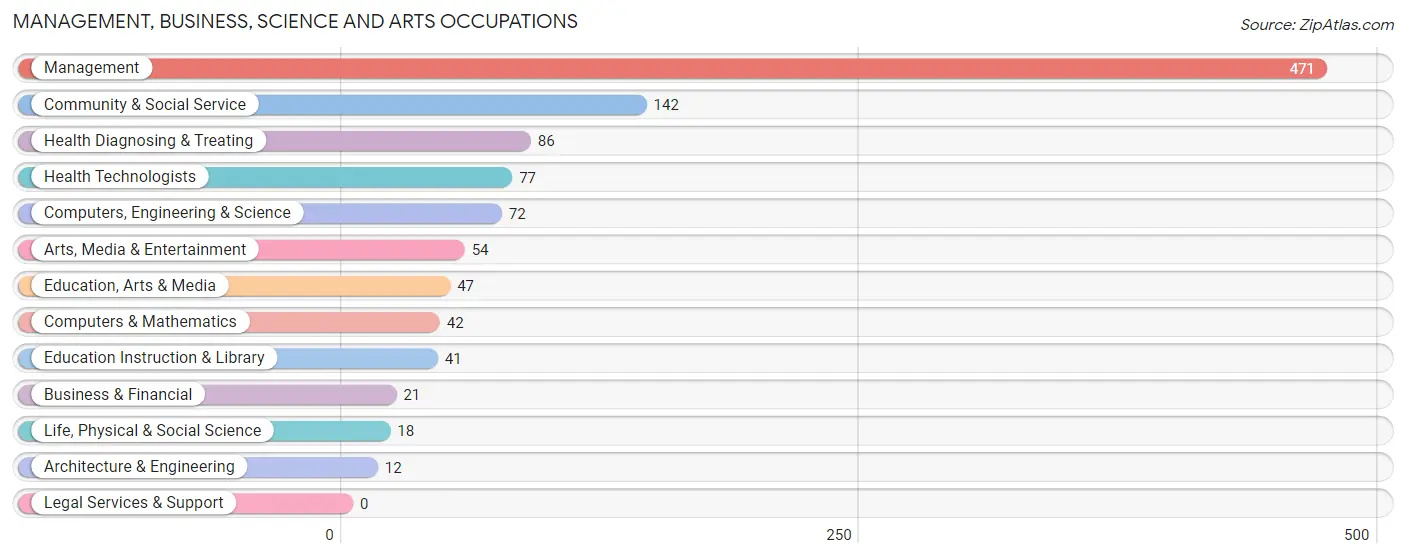
Management, Business, Science and Arts Occupations
The most common Management, Business, Science and Arts occupations in Swannanoa are Management (471 | 22.7%), Community & Social Service (142 | 6.8%), Health Diagnosing & Treating (86 | 4.1%), Health Technologists (77 | 3.7%), and Computers, Engineering & Science (72 | 3.5%).
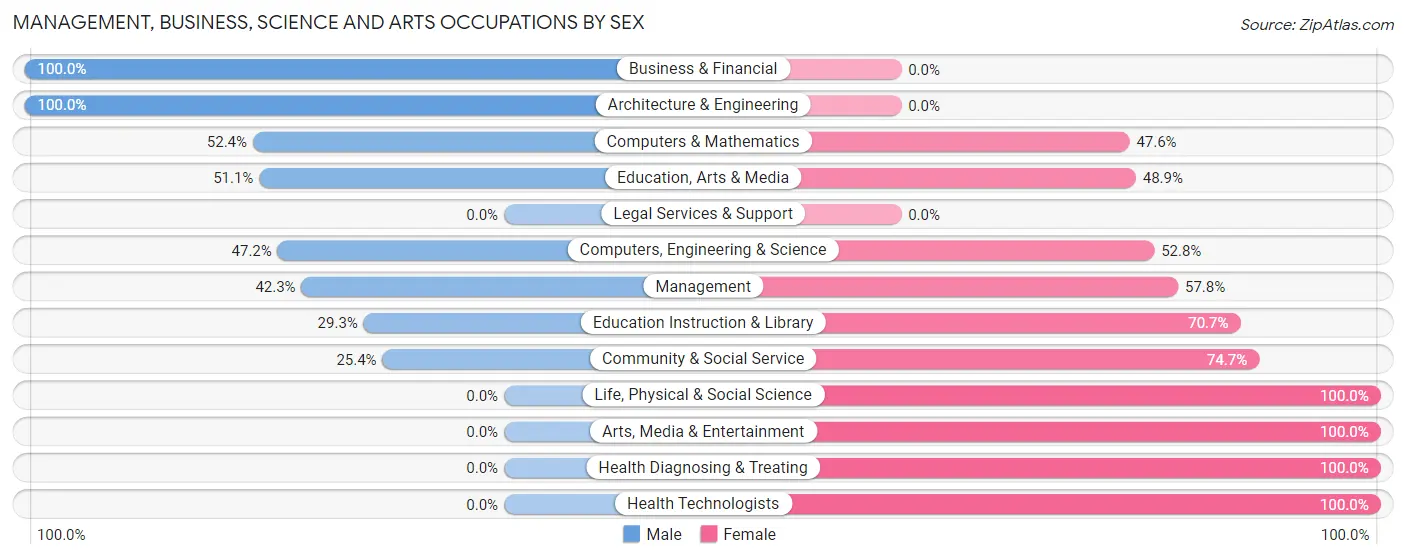
Management, Business, Science and Arts Occupations by Sex
Within the Management, Business, Science and Arts occupations in Swannanoa, the most male-oriented occupations are Business & Financial (100.0%), Architecture & Engineering (100.0%), and Computers & Mathematics (52.4%), while the most female-oriented occupations are Life, Physical & Social Science (100.0%), Arts, Media & Entertainment (100.0%), and Health Diagnosing & Treating (100.0%).
| Occupation | Male | Female |
| Management | 199 (42.2%) | 272 (57.8%) |
| Business & Financial | 21 (100.0%) | 0 (0.0%) |
| Computers, Engineering & Science | 34 (47.2%) | 38 (52.8%) |
| Computers & Mathematics | 22 (52.4%) | 20 (47.6%) |
| Architecture & Engineering | 12 (100.0%) | 0 (0.0%) |
| Life, Physical & Social Science | 0 (0.0%) | 18 (100.0%) |
| Community & Social Service | 36 (25.4%) | 106 (74.7%) |
| Education, Arts & Media | 24 (51.1%) | 23 (48.9%) |
| Legal Services & Support | 0 (0.0%) | 0 (0.0%) |
| Education Instruction & Library | 12 (29.3%) | 29 (70.7%) |
| Arts, Media & Entertainment | 0 (0.0%) | 54 (100.0%) |
| Health Diagnosing & Treating | 0 (0.0%) | 86 (100.0%) |
| Health Technologists | 0 (0.0%) | 77 (100.0%) |
| Total (Category) | 290 (36.6%) | 502 (63.4%) |
| Total (Overall) | 1,157 (55.7%) | 921 (44.3%) |
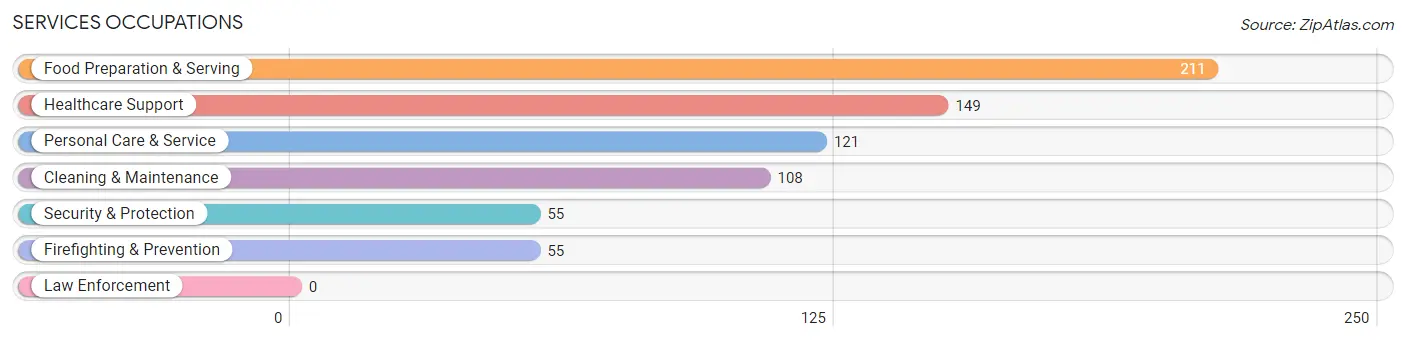
Services Occupations
The most common Services occupations in Swannanoa are Food Preparation & Serving (211 | 10.2%), Healthcare Support (149 | 7.2%), Personal Care & Service (121 | 5.8%), Cleaning & Maintenance (108 | 5.2%), and Security & Protection (55 | 2.6%).
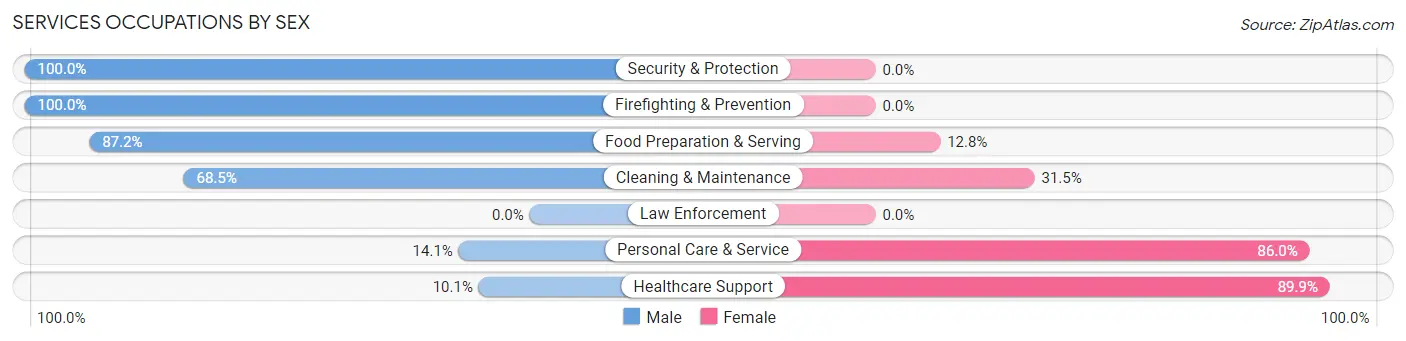
Services Occupations by Sex
Within the Services occupations in Swannanoa, the most male-oriented occupations are Security & Protection (100.0%), Firefighting & Prevention (100.0%), and Food Preparation & Serving (87.2%), while the most female-oriented occupations are Healthcare Support (89.9%), Personal Care & Service (86.0%), and Cleaning & Maintenance (31.5%).
| Occupation | Male | Female |
| Healthcare Support | 15 (10.1%) | 134 (89.9%) |
| Security & Protection | 55 (100.0%) | 0 (0.0%) |
| Firefighting & Prevention | 55 (100.0%) | 0 (0.0%) |
| Law Enforcement | 0 (0.0%) | 0 (0.0%) |
| Food Preparation & Serving | 184 (87.2%) | 27 (12.8%) |
| Cleaning & Maintenance | 74 (68.5%) | 34 (31.5%) |
| Personal Care & Service | 17 (14.1%) | 104 (86.0%) |
| Total (Category) | 345 (53.6%) | 299 (46.4%) |
| Total (Overall) | 1,157 (55.7%) | 921 (44.3%) |
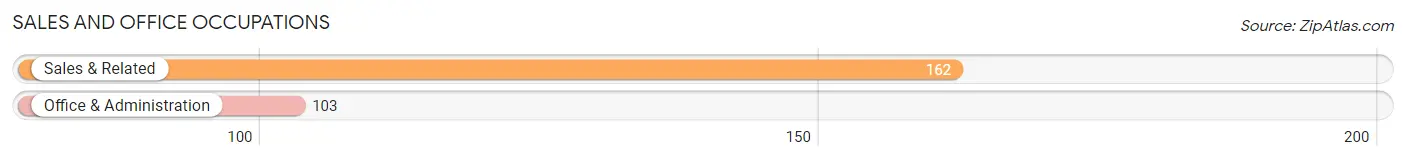
Sales and Office Occupations
The most common Sales and Office occupations in Swannanoa are Sales & Related (162 | 7.8%), and Office & Administration (103 | 5.0%).
Sales and Office Occupations by Sex
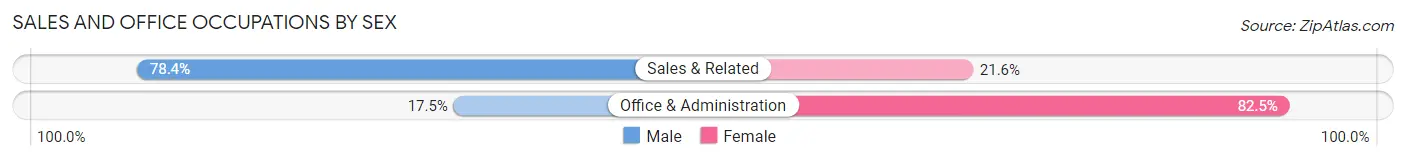
| Occupation | Male | Female |
| Sales & Related | 127 (78.4%) | 35 (21.6%) |
| Office & Administration | 18 (17.5%) | 85 (82.5%) |
| Total (Category) | 145 (54.7%) | 120 (45.3%) |
| Total (Overall) | 1,157 (55.7%) | 921 (44.3%) |
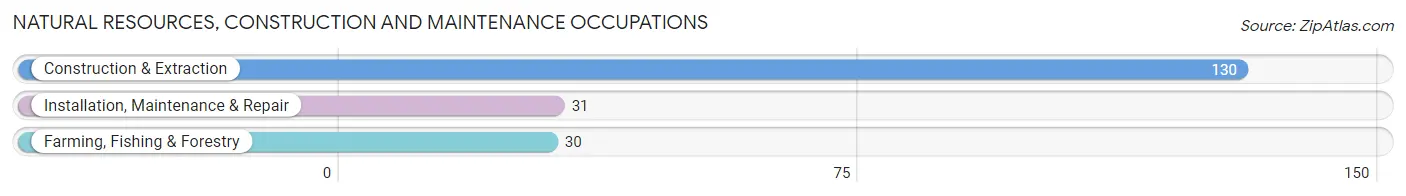
Natural Resources, Construction and Maintenance Occupations
The most common Natural Resources, Construction and Maintenance occupations in Swannanoa are Construction & Extraction (130 | 6.3%), Installation, Maintenance & Repair (31 | 1.5%), and Farming, Fishing & Forestry (30 | 1.4%).
Natural Resources, Construction and Maintenance Occupations by Sex
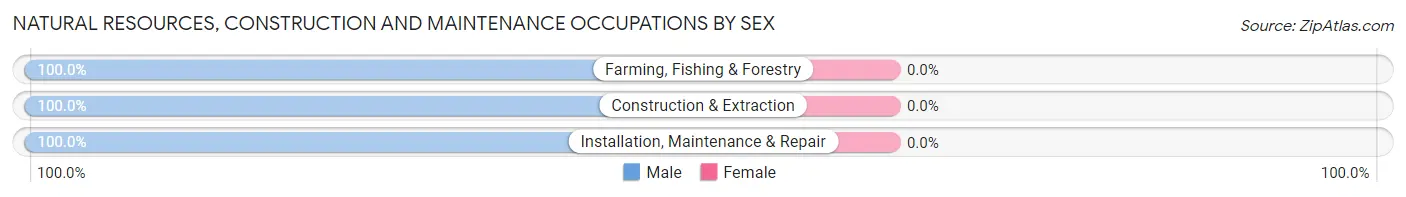
| Occupation | Male | Female |
| Farming, Fishing & Forestry | 30 (100.0%) | 0 (0.0%) |
| Construction & Extraction | 130 (100.0%) | 0 (0.0%) |
| Installation, Maintenance & Repair | 31 (100.0%) | 0 (0.0%) |
| Total (Category) | 191 (100.0%) | 0 (0.0%) |
| Total (Overall) | 1,157 (55.7%) | 921 (44.3%) |
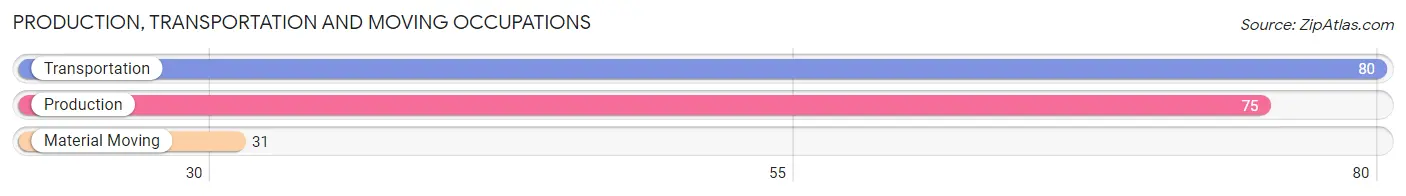
Production, Transportation and Moving Occupations
The most common Production, Transportation and Moving occupations in Swannanoa are Transportation (80 | 3.8%), Production (75 | 3.6%), and Material Moving (31 | 1.5%).
Production, Transportation and Moving Occupations by Sex
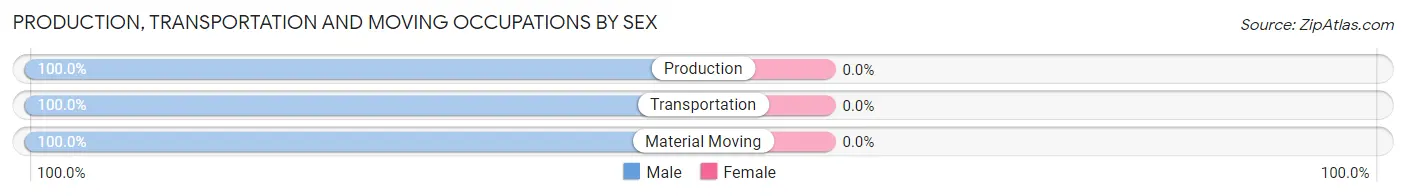
| Occupation | Male | Female |
| Production | 75 (100.0%) | 0 (0.0%) |
| Transportation | 80 (100.0%) | 0 (0.0%) |
| Material Moving | 31 (100.0%) | 0 (0.0%) |
| Total (Category) | 186 (100.0%) | 0 (0.0%) |
| Total (Overall) | 1,157 (55.7%) | 921 (44.3%) |
Employment Industries by Sex in Swannanoa
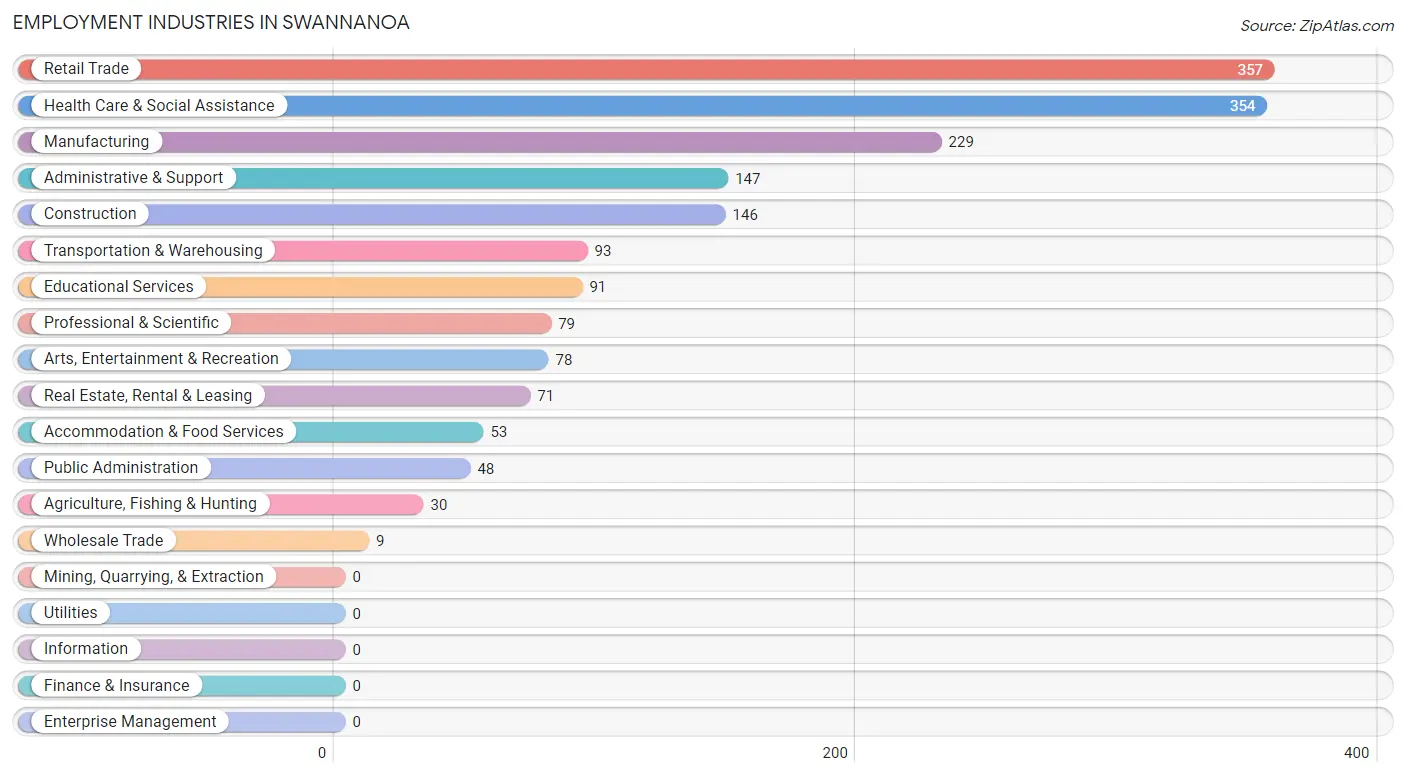
Employment Industries in Swannanoa
The major employment industries in Swannanoa include Retail Trade (357 | 17.2%), Health Care & Social Assistance (354 | 17.0%), Manufacturing (229 | 11.0%), Administrative & Support (147 | 7.1%), and Construction (146 | 7.0%).
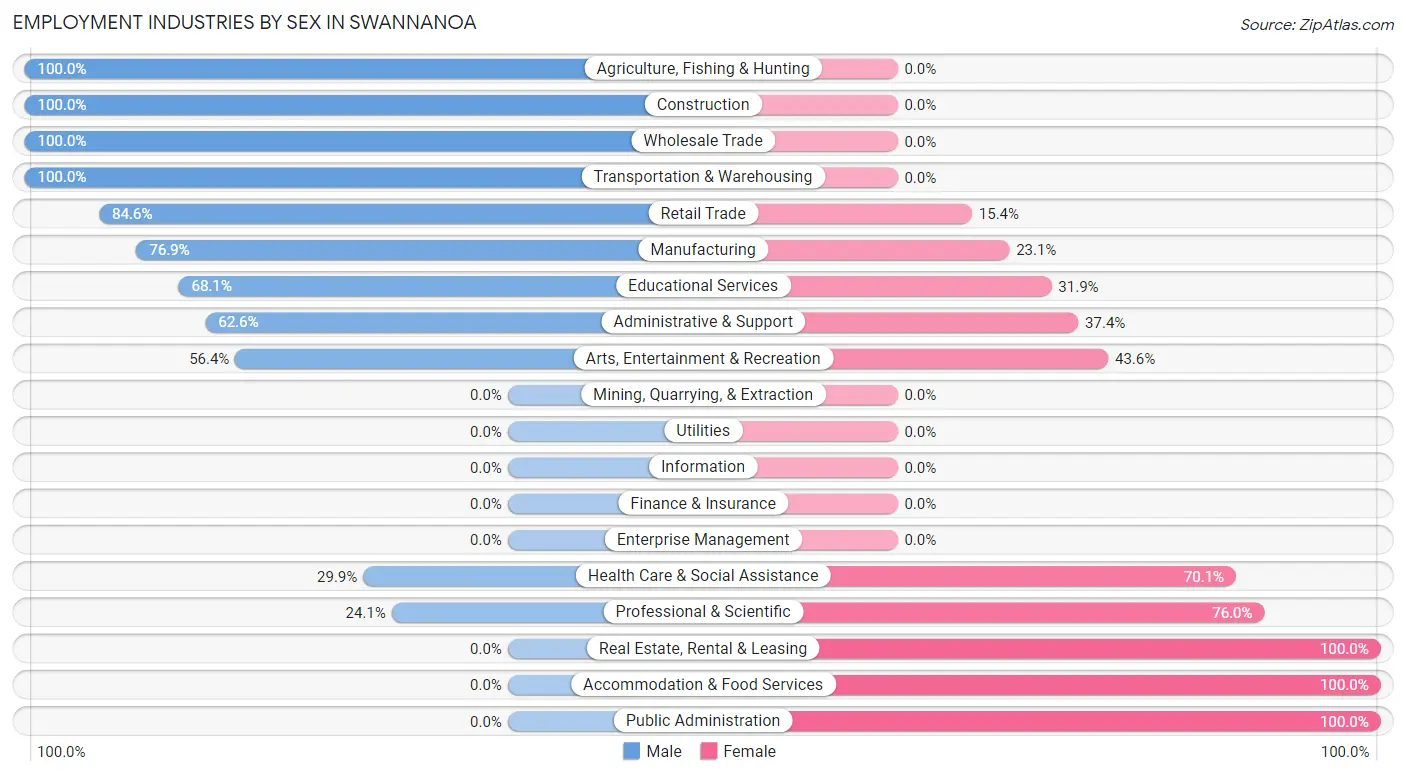
Employment Industries by Sex in Swannanoa
The Swannanoa industries that see more men than women are Agriculture, Fishing & Hunting (100.0%), Construction (100.0%), and Wholesale Trade (100.0%), whereas the industries that tend to have a higher number of women are Real Estate, Rental & Leasing (100.0%), Accommodation & Food Services (100.0%), and Public Administration (100.0%).
| Industry | Male | Female |
| Agriculture, Fishing & Hunting | 30 (100.0%) | 0 (0.0%) |
| Mining, Quarrying, & Extraction | 0 (0.0%) | 0 (0.0%) |
| Construction | 146 (100.0%) | 0 (0.0%) |
| Manufacturing | 176 (76.9%) | 53 (23.1%) |
| Wholesale Trade | 9 (100.0%) | 0 (0.0%) |
| Retail Trade | 302 (84.6%) | 55 (15.4%) |
| Transportation & Warehousing | 93 (100.0%) | 0 (0.0%) |
| Utilities | 0 (0.0%) | 0 (0.0%) |
| Information | 0 (0.0%) | 0 (0.0%) |
| Finance & Insurance | 0 (0.0%) | 0 (0.0%) |
| Real Estate, Rental & Leasing | 0 (0.0%) | 71 (100.0%) |
| Professional & Scientific | 19 (24.0%) | 60 (75.9%) |
| Enterprise Management | 0 (0.0%) | 0 (0.0%) |
| Administrative & Support | 92 (62.6%) | 55 (37.4%) |
| Educational Services | 62 (68.1%) | 29 (31.9%) |
| Health Care & Social Assistance | 106 (29.9%) | 248 (70.1%) |
| Arts, Entertainment & Recreation | 44 (56.4%) | 34 (43.6%) |
| Accommodation & Food Services | 0 (0.0%) | 53 (100.0%) |
| Public Administration | 0 (0.0%) | 48 (100.0%) |
| Total | 1,157 (55.7%) | 921 (44.3%) |
Education in Swannanoa
School Enrollment in Swannanoa
The most common levels of schooling among the 920 students in Swannanoa are elementary school (370 | 40.2%), college / undergraduate (262 | 28.5%), and high school (108 | 11.7%).
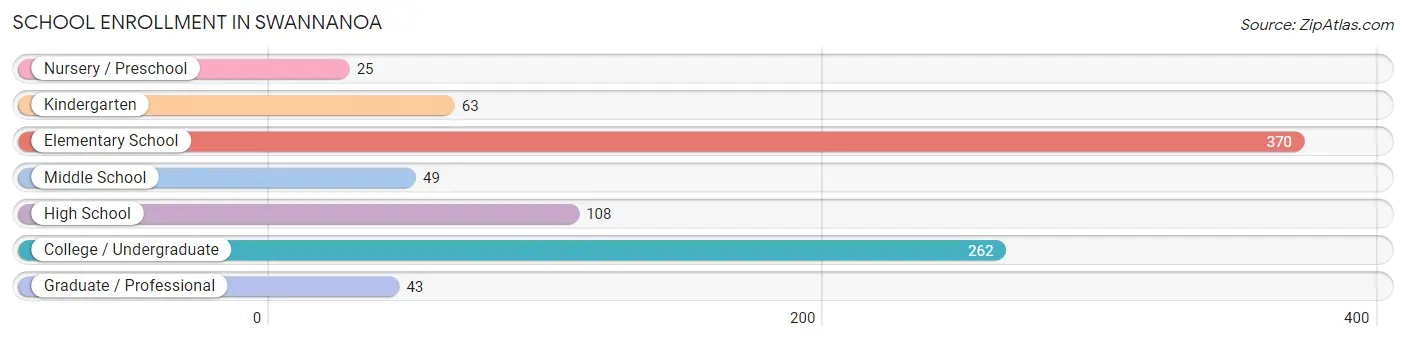
| School Level | # Students | % Students |
| Nursery / Preschool | 25 | 2.7% |
| Kindergarten | 63 | 6.9% |
| Elementary School | 370 | 40.2% |
| Middle School | 49 | 5.3% |
| High School | 108 | 11.7% |
| College / Undergraduate | 262 | 28.5% |
| Graduate / Professional | 43 | 4.7% |
| Total | 920 | 100.0% |
School Enrollment by Age by Funding Source in Swannanoa
Out of a total of 920 students who are enrolled in schools in Swannanoa, 66 (7.2%) attend a private institution, while the remaining 854 (92.8%) are enrolled in public schools. The age group of 35 years and over has the highest likelihood of being enrolled in private schools, with 37 (72.6% in the age bracket) enrolled. Conversely, the age group of 3 to 4 year olds has the lowest likelihood of being enrolled in a private school, with 25 (100.0% in the age bracket) attending a public institution.
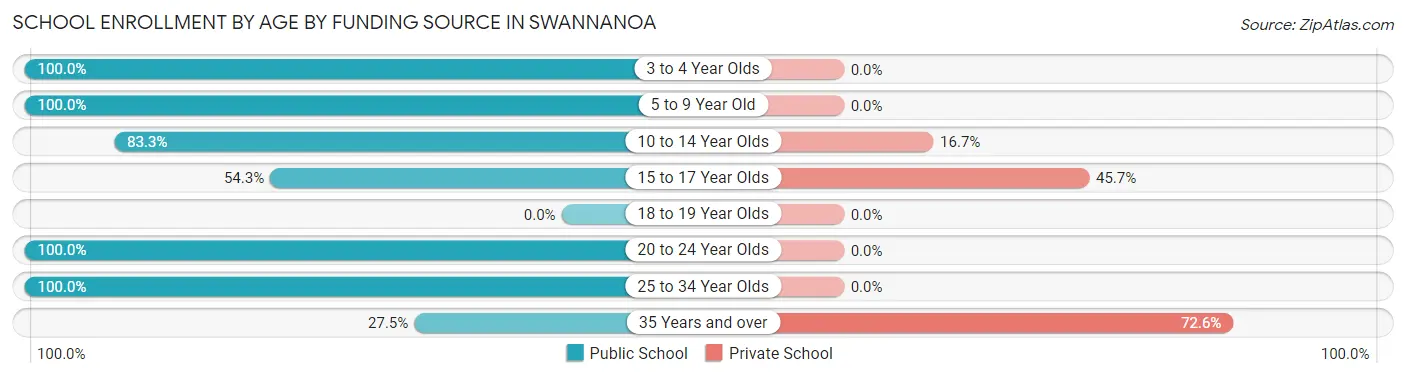
| Age Bracket | Public School | Private School |
| 3 to 4 Year Olds | 25 (100.0%) | 0 (0.0%) |
| 5 to 9 Year Old | 433 (100.0%) | 0 (0.0%) |
| 10 to 14 Year Olds | 65 (83.3%) | 13 (16.7%) |
| 15 to 17 Year Olds | 19 (54.3%) | 16 (45.7%) |
| 18 to 19 Year Olds | 0 (0.0%) | 0 (0.0%) |
| 20 to 24 Year Olds | 92 (100.0%) | 0 (0.0%) |
| 25 to 34 Year Olds | 206 (100.0%) | 0 (0.0%) |
| 35 Years and over | 14 (27.5%) | 37 (72.6%) |
| Total | 854 (92.8%) | 66 (7.2%) |
Educational Attainment by Field of Study in Swannanoa
Visual & performing arts (213 | 18.5%), bio, nature & agricultural (174 | 15.1%), communications (146 | 12.7%), business (111 | 9.6%), and psychology (85 | 7.4%) are the most common fields of study among 1,152 individuals in Swannanoa who have obtained a bachelor's degree or higher.
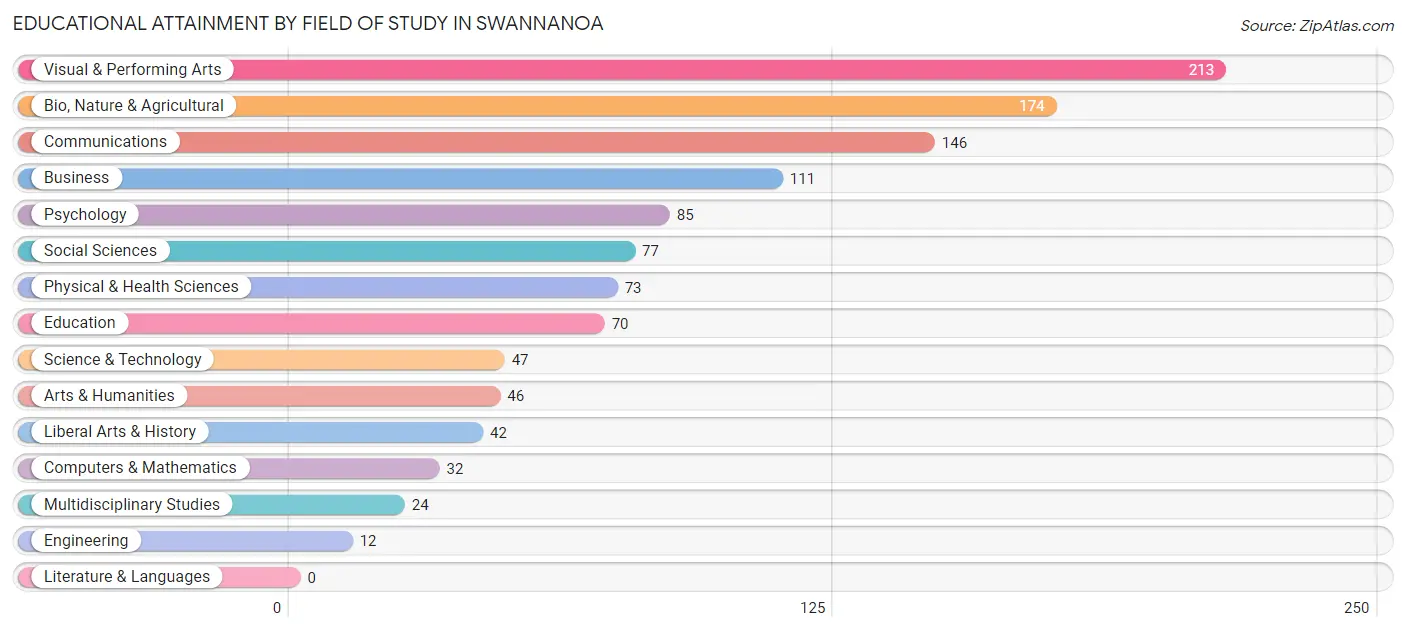
| Field of Study | # Graduates | % Graduates |
| Computers & Mathematics | 32 | 2.8% |
| Bio, Nature & Agricultural | 174 | 15.1% |
| Physical & Health Sciences | 73 | 6.3% |
| Psychology | 85 | 7.4% |
| Social Sciences | 77 | 6.7% |
| Engineering | 12 | 1.0% |
| Multidisciplinary Studies | 24 | 2.1% |
| Science & Technology | 47 | 4.1% |
| Business | 111 | 9.6% |
| Education | 70 | 6.1% |
| Literature & Languages | 0 | 0.0% |
| Liberal Arts & History | 42 | 3.6% |
| Visual & Performing Arts | 213 | 18.5% |
| Communications | 146 | 12.7% |
| Arts & Humanities | 46 | 4.0% |
| Total | 1,152 | 100.0% |
Transportation & Commute in Swannanoa
Vehicle Availability by Sex in Swannanoa
The most prevalent vehicle ownership categories in Swannanoa are males with 2 vehicles (550, accounting for 49.6%) and females with 2 vehicles (465, making up 61.7%).
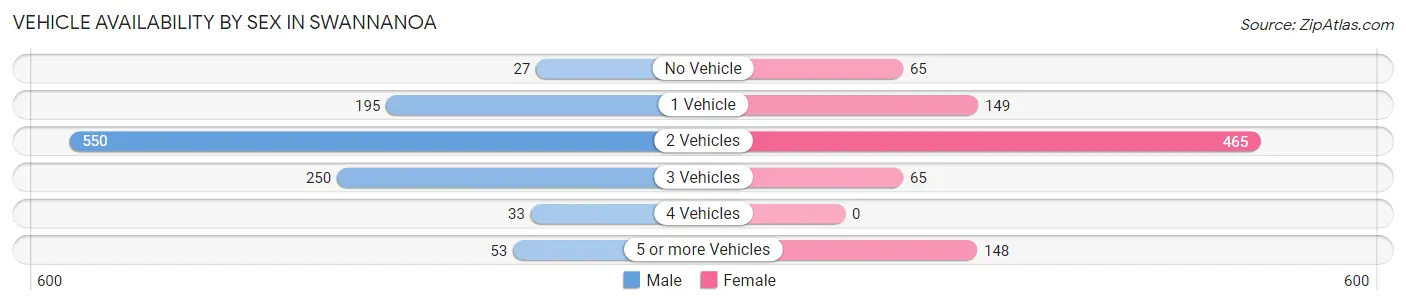
| Vehicles Available | Male | Female |
| No Vehicle | 27 (2.4%) | 65 (7.3%) |
| 1 Vehicle | 195 (17.6%) | 149 (16.7%) |
| 2 Vehicles | 550 (49.6%) | 465 (52.1%) |
| 3 Vehicles | 250 (22.6%) | 65 (7.3%) |
| 4 Vehicles | 33 (3.0%) | 0 (0.0%) |
| 5 or more Vehicles | 53 (4.8%) | 148 (16.6%) |
| Total | 1,108 (100.0%) | 892 (100.0%) |
Commute Time in Swannanoa
The most frequently occuring commute durations in Swannanoa are 15 to 19 minutes (565 commuters, 32.0%), 10 to 14 minutes (301 commuters, 17.0%), and 20 to 24 minutes (291 commuters, 16.5%).
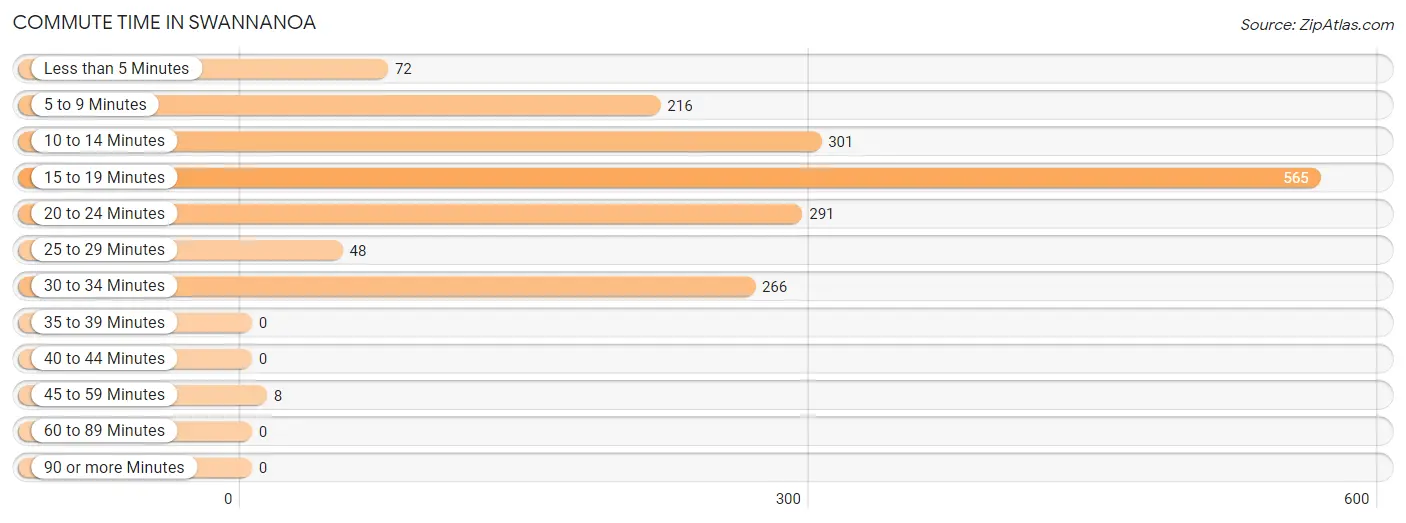
| Commute Time | # Commuters | % Commuters |
| Less than 5 Minutes | 72 | 4.1% |
| 5 to 9 Minutes | 216 | 12.2% |
| 10 to 14 Minutes | 301 | 17.0% |
| 15 to 19 Minutes | 565 | 32.0% |
| 20 to 24 Minutes | 291 | 16.5% |
| 25 to 29 Minutes | 48 | 2.7% |
| 30 to 34 Minutes | 266 | 15.0% |
| 35 to 39 Minutes | 0 | 0.0% |
| 40 to 44 Minutes | 0 | 0.0% |
| 45 to 59 Minutes | 8 | 0.4% |
| 60 to 89 Minutes | 0 | 0.0% |
| 90 or more Minutes | 0 | 0.0% |
Commute Time by Sex in Swannanoa
The most common commute times in Swannanoa are 15 to 19 minutes (375 commuters, 35.0%) for males and 15 to 19 minutes (190 commuters, 27.3%) for females.
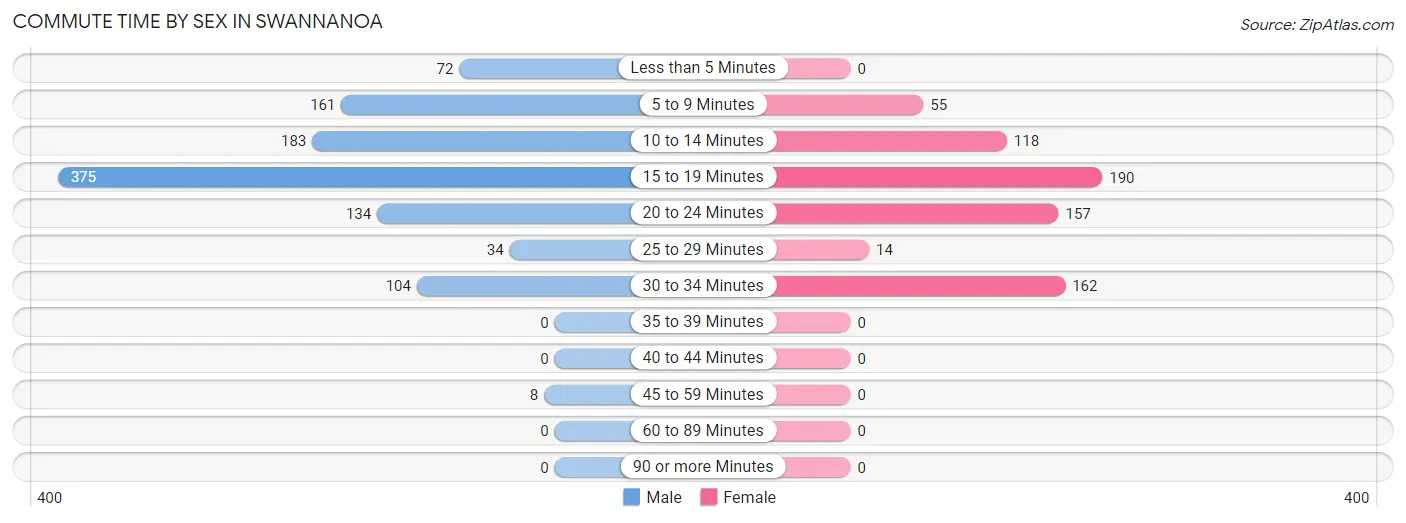
| Commute Time | Male | Female |
| Less than 5 Minutes | 72 (6.7%) | 0 (0.0%) |
| 5 to 9 Minutes | 161 (15.0%) | 55 (7.9%) |
| 10 to 14 Minutes | 183 (17.1%) | 118 (17.0%) |
| 15 to 19 Minutes | 375 (35.0%) | 190 (27.3%) |
| 20 to 24 Minutes | 134 (12.5%) | 157 (22.6%) |
| 25 to 29 Minutes | 34 (3.2%) | 14 (2.0%) |
| 30 to 34 Minutes | 104 (9.7%) | 162 (23.3%) |
| 35 to 39 Minutes | 0 (0.0%) | 0 (0.0%) |
| 40 to 44 Minutes | 0 (0.0%) | 0 (0.0%) |
| 45 to 59 Minutes | 8 (0.7%) | 0 (0.0%) |
| 60 to 89 Minutes | 0 (0.0%) | 0 (0.0%) |
| 90 or more Minutes | 0 (0.0%) | 0 (0.0%) |
Time of Departure to Work by Sex in Swannanoa
The most frequent times of departure to work in Swannanoa are 7:00 AM to 7:29 AM (202, 18.9%) for males and 8:00 AM to 8:29 AM (184, 26.4%) for females.
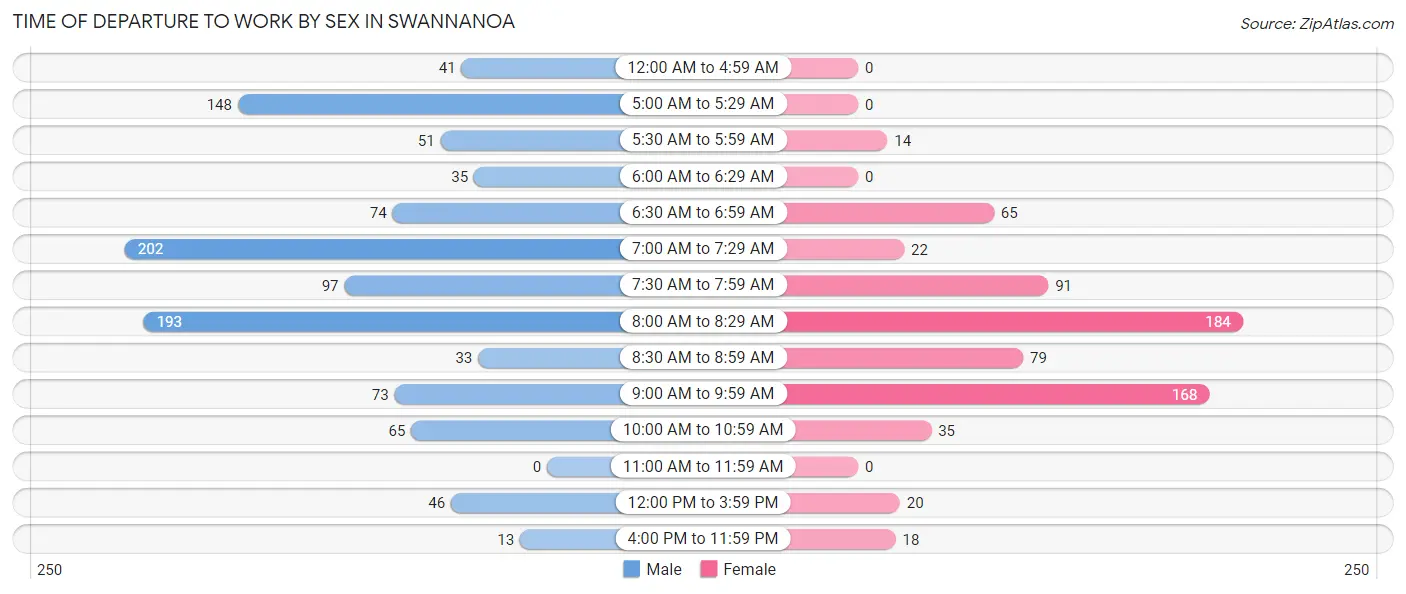
| Time of Departure | Male | Female |
| 12:00 AM to 4:59 AM | 41 (3.8%) | 0 (0.0%) |
| 5:00 AM to 5:29 AM | 148 (13.8%) | 0 (0.0%) |
| 5:30 AM to 5:59 AM | 51 (4.8%) | 14 (2.0%) |
| 6:00 AM to 6:29 AM | 35 (3.3%) | 0 (0.0%) |
| 6:30 AM to 6:59 AM | 74 (6.9%) | 65 (9.3%) |
| 7:00 AM to 7:29 AM | 202 (18.9%) | 22 (3.2%) |
| 7:30 AM to 7:59 AM | 97 (9.1%) | 91 (13.1%) |
| 8:00 AM to 8:29 AM | 193 (18.0%) | 184 (26.4%) |
| 8:30 AM to 8:59 AM | 33 (3.1%) | 79 (11.4%) |
| 9:00 AM to 9:59 AM | 73 (6.8%) | 168 (24.1%) |
| 10:00 AM to 10:59 AM | 65 (6.1%) | 35 (5.0%) |
| 11:00 AM to 11:59 AM | 0 (0.0%) | 0 (0.0%) |
| 12:00 PM to 3:59 PM | 46 (4.3%) | 20 (2.9%) |
| 4:00 PM to 11:59 PM | 13 (1.2%) | 18 (2.6%) |
| Total | 1,071 (100.0%) | 696 (100.0%) |
Housing Occupancy in Swannanoa
Occupancy by Ownership in Swannanoa
Of the total 1,614 dwellings in Swannanoa, owner-occupied units account for 1,224 (75.8%), while renter-occupied units make up 390 (24.2%).
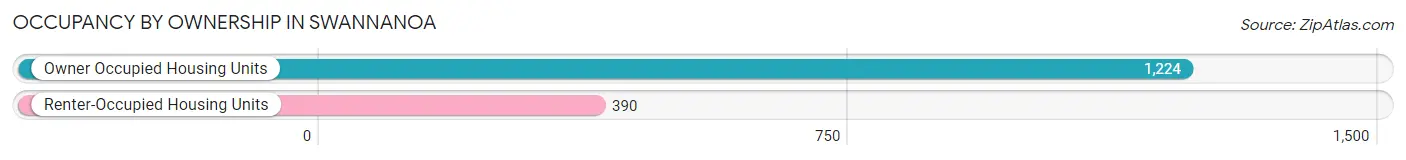
| Occupancy | # Housing Units | % Housing Units |
| Owner Occupied Housing Units | 1,224 | 75.8% |
| Renter-Occupied Housing Units | 390 | 24.2% |
| Total Occupied Housing Units | 1,614 | 100.0% |
Occupancy by Household Size in Swannanoa
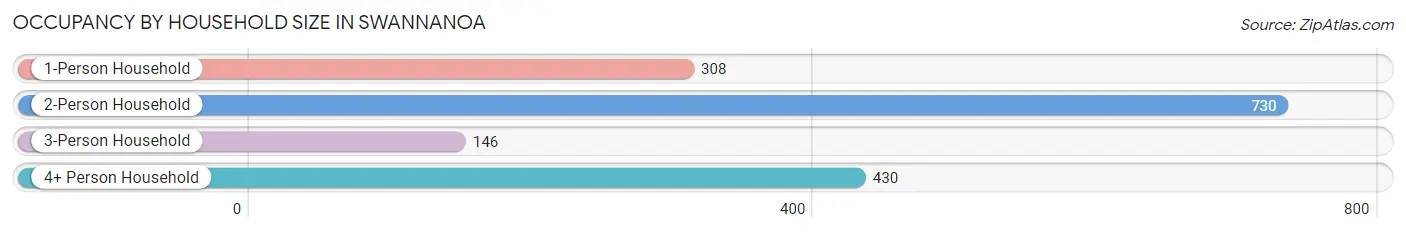
| Household Size | # Housing Units | % Housing Units |
| 1-Person Household | 308 | 19.1% |
| 2-Person Household | 730 | 45.2% |
| 3-Person Household | 146 | 9.0% |
| 4+ Person Household | 430 | 26.6% |
| Total Housing Units | 1,614 | 100.0% |
Occupancy by Ownership by Household Size in Swannanoa
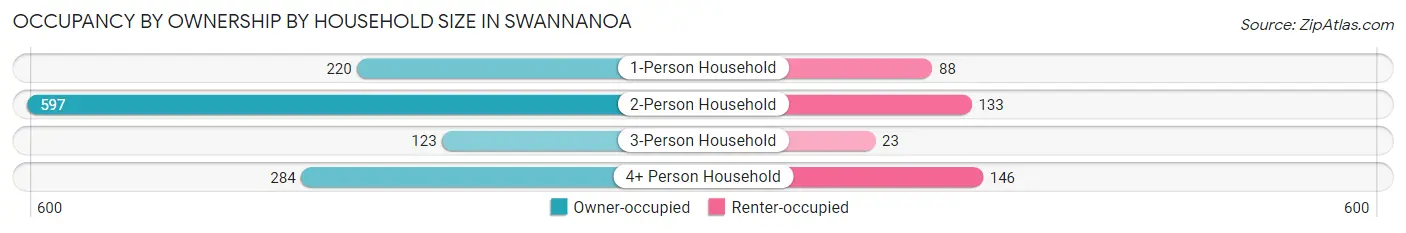
| Household Size | Owner-occupied | Renter-occupied |
| 1-Person Household | 220 (71.4%) | 88 (28.6%) |
| 2-Person Household | 597 (81.8%) | 133 (18.2%) |
| 3-Person Household | 123 (84.3%) | 23 (15.8%) |
| 4+ Person Household | 284 (66.0%) | 146 (34.0%) |
| Total Housing Units | 1,224 (75.8%) | 390 (24.2%) |
Occupancy by Educational Attainment in Swannanoa
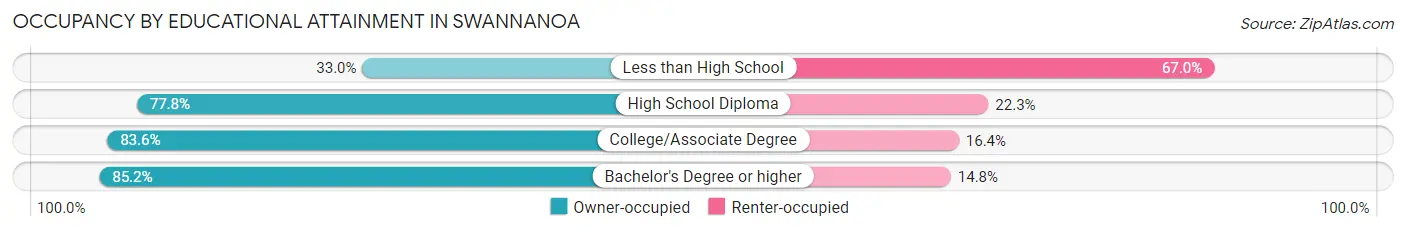
| Household Size | Owner-occupied | Renter-occupied |
| Less than High School | 72 (33.0%) | 146 (67.0%) |
| High School Diploma | 311 (77.7%) | 89 (22.3%) |
| College/Associate Degree | 398 (83.6%) | 78 (16.4%) |
| Bachelor's Degree or higher | 443 (85.2%) | 77 (14.8%) |
Occupancy by Age of Householder in Swannanoa
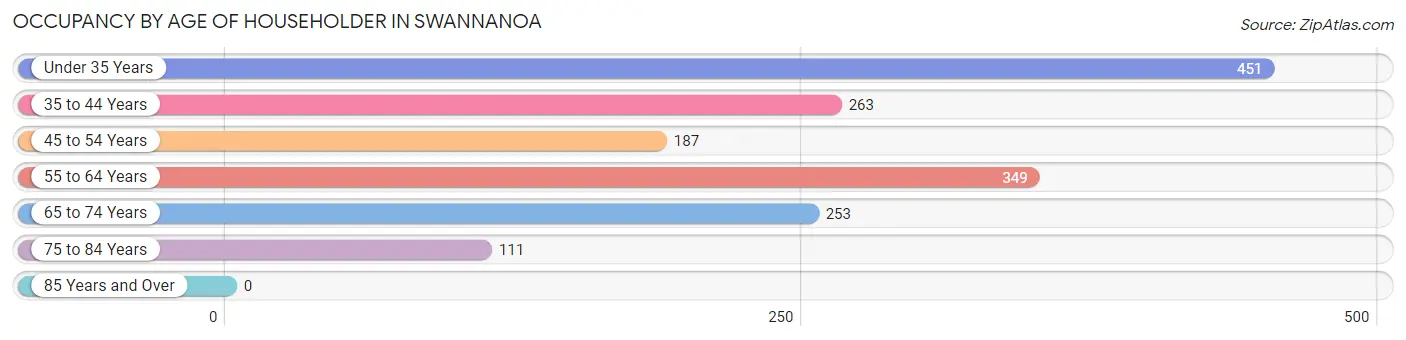
| Age Bracket | # Households | % Households |
| Under 35 Years | 451 | 27.9% |
| 35 to 44 Years | 263 | 16.3% |
| 45 to 54 Years | 187 | 11.6% |
| 55 to 64 Years | 349 | 21.6% |
| 65 to 74 Years | 253 | 15.7% |
| 75 to 84 Years | 111 | 6.9% |
| 85 Years and Over | 0 | 0.0% |
| Total | 1,614 | 100.0% |
Housing Finances in Swannanoa
Median Income by Occupancy in Swannanoa
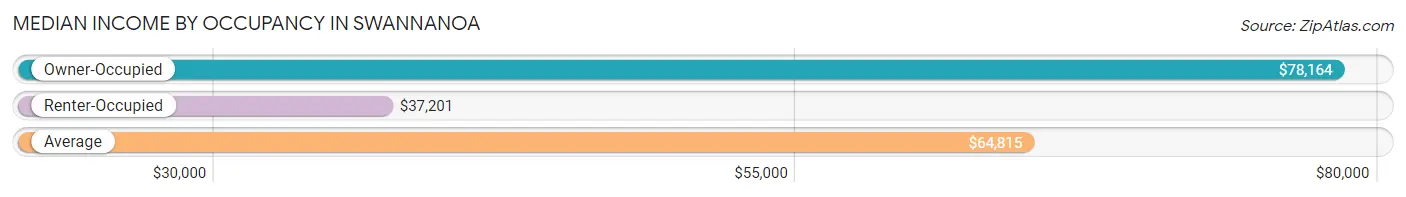
| Occupancy Type | # Households | Median Income |
| Owner-Occupied | 1,224 (75.8%) | $78,164 |
| Renter-Occupied | 390 (24.2%) | $37,201 |
| Average | 1,614 (100.0%) | $64,815 |
Occupancy by Householder Income Bracket in Swannanoa
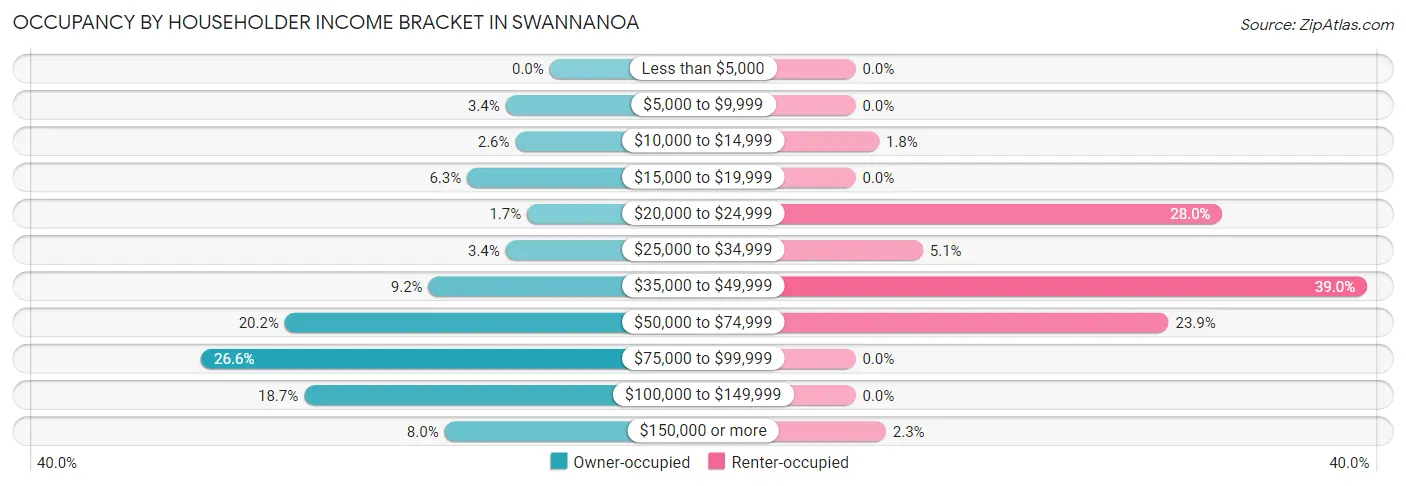
| Income Bracket | Owner-occupied | Renter-occupied |
| Less than $5,000 | 0 (0.0%) | 0 (0.0%) |
| $5,000 to $9,999 | 41 (3.4%) | 0 (0.0%) |
| $10,000 to $14,999 | 32 (2.6%) | 7 (1.8%) |
| $15,000 to $19,999 | 77 (6.3%) | 0 (0.0%) |
| $20,000 to $24,999 | 21 (1.7%) | 109 (28.0%) |
| $25,000 to $34,999 | 41 (3.4%) | 20 (5.1%) |
| $35,000 to $49,999 | 113 (9.2%) | 152 (39.0%) |
| $50,000 to $74,999 | 247 (20.2%) | 93 (23.8%) |
| $75,000 to $99,999 | 325 (26.6%) | 0 (0.0%) |
| $100,000 to $149,999 | 229 (18.7%) | 0 (0.0%) |
| $150,000 or more | 98 (8.0%) | 9 (2.3%) |
| Total | 1,224 (100.0%) | 390 (100.0%) |
Monthly Housing Cost Tiers in Swannanoa
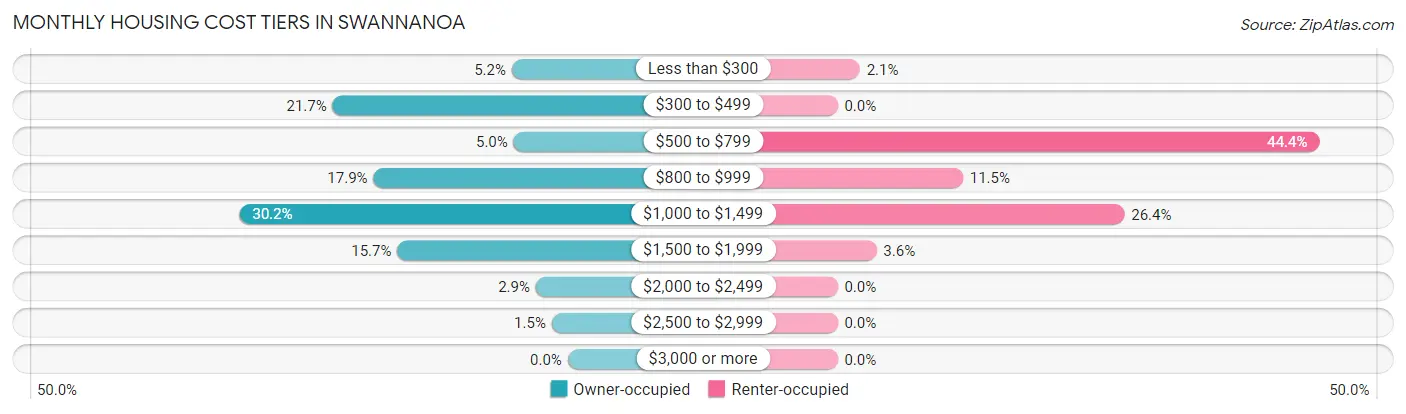
| Monthly Cost | Owner-occupied | Renter-occupied |
| Less than $300 | 63 (5.1%) | 8 (2.1%) |
| $300 to $499 | 265 (21.6%) | 0 (0.0%) |
| $500 to $799 | 61 (5.0%) | 173 (44.4%) |
| $800 to $999 | 219 (17.9%) | 45 (11.5%) |
| $1,000 to $1,499 | 370 (30.2%) | 103 (26.4%) |
| $1,500 to $1,999 | 192 (15.7%) | 14 (3.6%) |
| $2,000 to $2,499 | 36 (2.9%) | 0 (0.0%) |
| $2,500 to $2,999 | 18 (1.5%) | 0 (0.0%) |
| $3,000 or more | 0 (0.0%) | 0 (0.0%) |
| Total | 1,224 (100.0%) | 390 (100.0%) |
Physical Housing Characteristics in Swannanoa
Housing Structures in Swannanoa
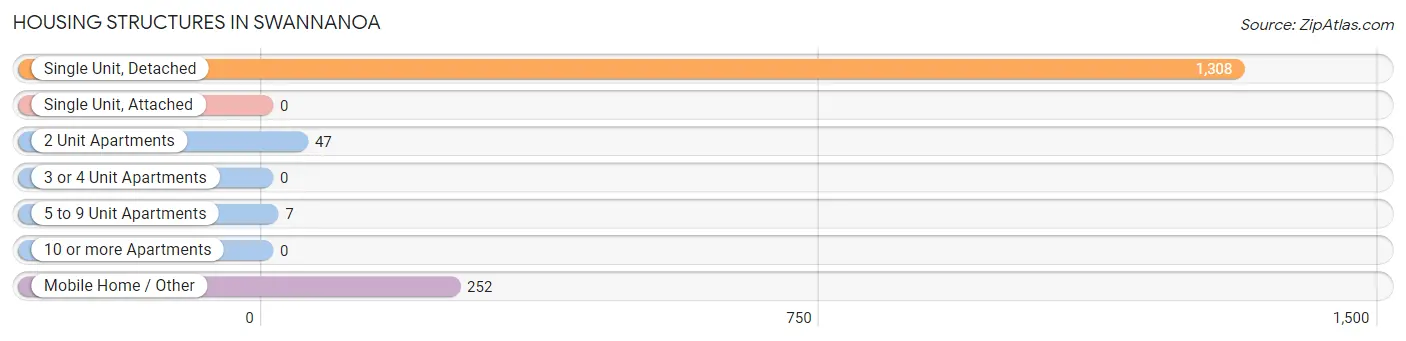
| Structure Type | # Housing Units | % Housing Units |
| Single Unit, Detached | 1,308 | 81.0% |
| Single Unit, Attached | 0 | 0.0% |
| 2 Unit Apartments | 47 | 2.9% |
| 3 or 4 Unit Apartments | 0 | 0.0% |
| 5 to 9 Unit Apartments | 7 | 0.4% |
| 10 or more Apartments | 0 | 0.0% |
| Mobile Home / Other | 252 | 15.6% |
| Total | 1,614 | 100.0% |
Housing Structures by Occupancy in Swannanoa
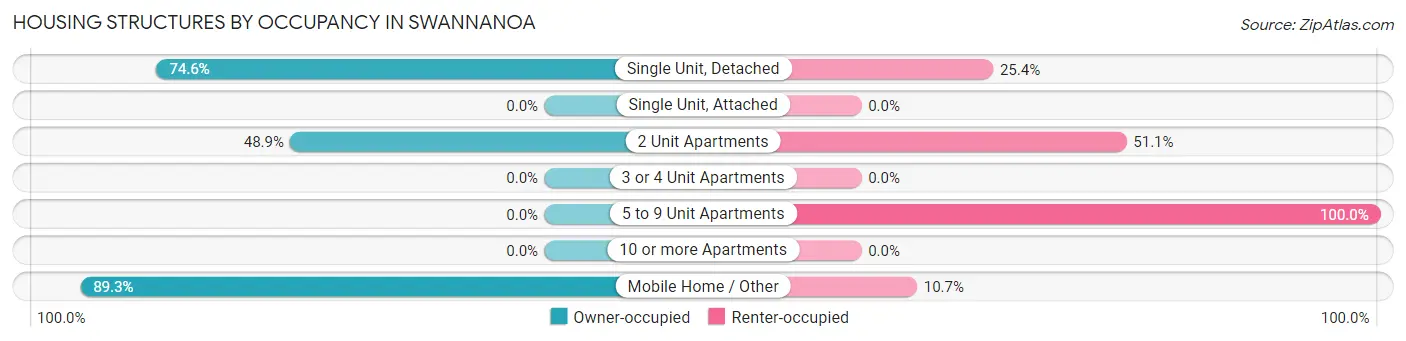
| Structure Type | Owner-occupied | Renter-occupied |
| Single Unit, Detached | 976 (74.6%) | 332 (25.4%) |
| Single Unit, Attached | 0 (0.0%) | 0 (0.0%) |
| 2 Unit Apartments | 23 (48.9%) | 24 (51.1%) |
| 3 or 4 Unit Apartments | 0 (0.0%) | 0 (0.0%) |
| 5 to 9 Unit Apartments | 0 (0.0%) | 7 (100.0%) |
| 10 or more Apartments | 0 (0.0%) | 0 (0.0%) |
| Mobile Home / Other | 225 (89.3%) | 27 (10.7%) |
| Total | 1,224 (75.8%) | 390 (24.2%) |
Housing Structures by Number of Rooms in Swannanoa
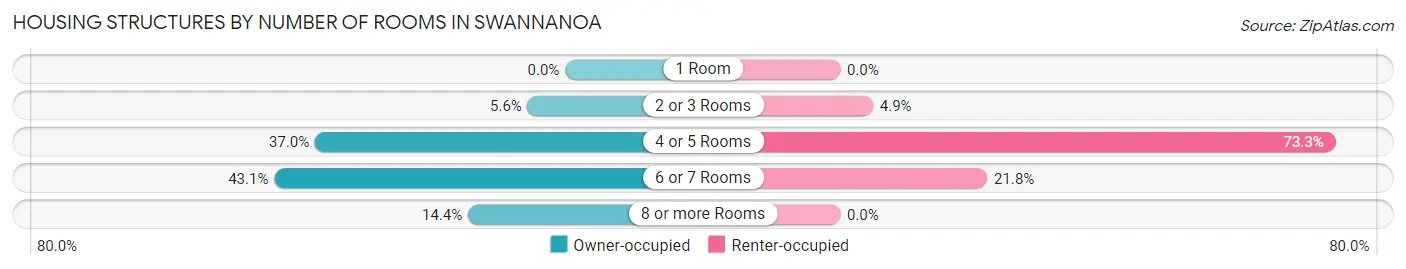
| Number of Rooms | Owner-occupied | Renter-occupied |
| 1 Room | 0 (0.0%) | 0 (0.0%) |
| 2 or 3 Rooms | 68 (5.6%) | 19 (4.9%) |
| 4 or 5 Rooms | 453 (37.0%) | 286 (73.3%) |
| 6 or 7 Rooms | 527 (43.1%) | 85 (21.8%) |
| 8 or more Rooms | 176 (14.4%) | 0 (0.0%) |
| Total | 1,224 (100.0%) | 390 (100.0%) |
Housing Structure by Heating Type in Swannanoa
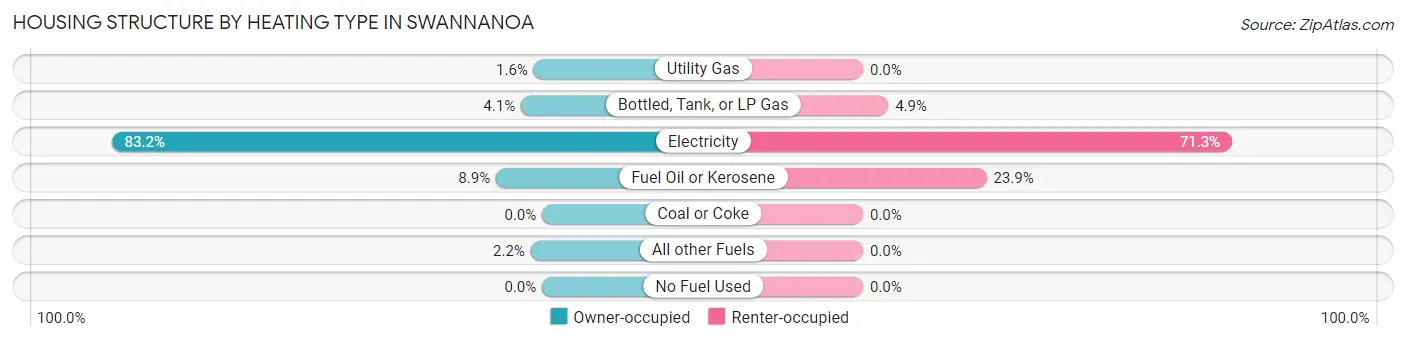
| Heating Type | Owner-occupied | Renter-occupied |
| Utility Gas | 20 (1.6%) | 0 (0.0%) |
| Bottled, Tank, or LP Gas | 50 (4.1%) | 19 (4.9%) |
| Electricity | 1,018 (83.2%) | 278 (71.3%) |
| Fuel Oil or Kerosene | 109 (8.9%) | 93 (23.8%) |
| Coal or Coke | 0 (0.0%) | 0 (0.0%) |
| All other Fuels | 27 (2.2%) | 0 (0.0%) |
| No Fuel Used | 0 (0.0%) | 0 (0.0%) |
| Total | 1,224 (100.0%) | 390 (100.0%) |
Household Vehicle Usage in Swannanoa
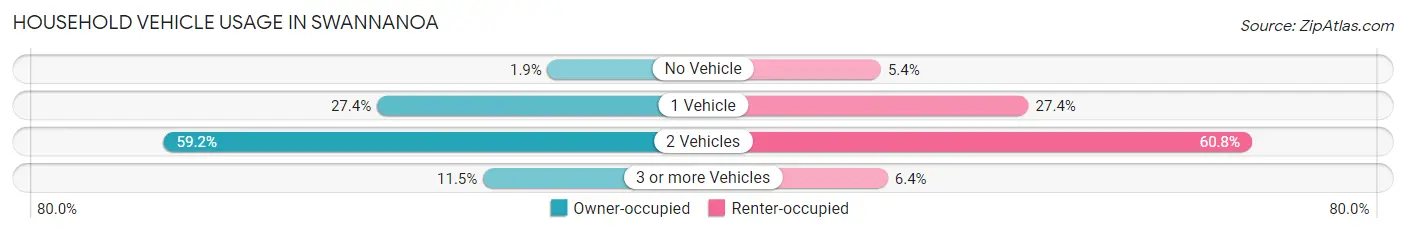
| Vehicles per Household | Owner-occupied | Renter-occupied |
| No Vehicle | 23 (1.9%) | 21 (5.4%) |
| 1 Vehicle | 335 (27.4%) | 107 (27.4%) |
| 2 Vehicles | 725 (59.2%) | 237 (60.8%) |
| 3 or more Vehicles | 141 (11.5%) | 25 (6.4%) |
| Total | 1,224 (100.0%) | 390 (100.0%) |
Real Estate & Mortgages in Swannanoa
Real Estate and Mortgage Overview in Swannanoa
| Characteristic | Without Mortgage | With Mortgage |
| Housing Units | 340 | 884 |
| Median Property Value | $204,200 | $225,500 |
| Median Household Income | $63,393 | $53 |
| Monthly Housing Costs | $344 | $0 |
| Real Estate Taxes | $1,009 | $50 |
Property Value by Mortgage Status in Swannanoa
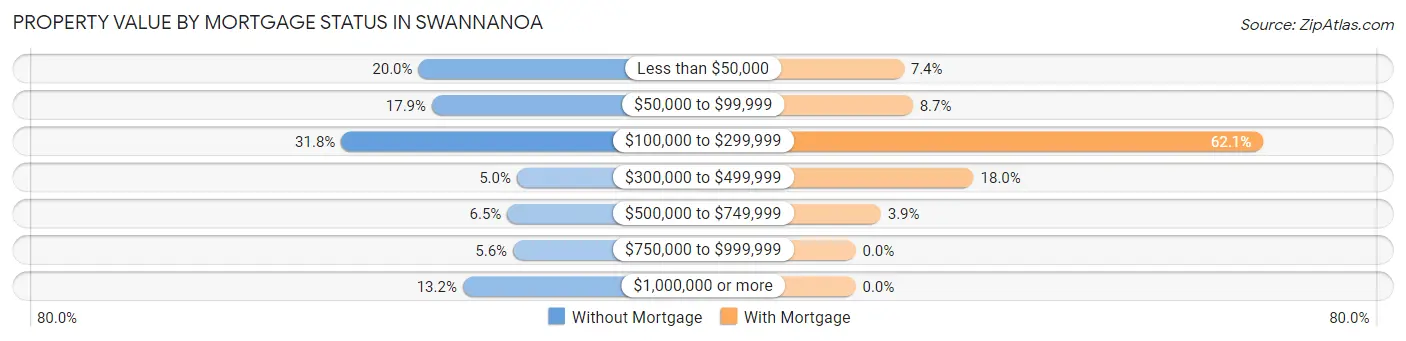
| Property Value | Without Mortgage | With Mortgage |
| Less than $50,000 | 68 (20.0%) | 65 (7.3%) |
| $50,000 to $99,999 | 61 (17.9%) | 77 (8.7%) |
| $100,000 to $299,999 | 108 (31.8%) | 549 (62.1%) |
| $300,000 to $499,999 | 17 (5.0%) | 159 (18.0%) |
| $500,000 to $749,999 | 22 (6.5%) | 34 (3.8%) |
| $750,000 to $999,999 | 19 (5.6%) | 0 (0.0%) |
| $1,000,000 or more | 45 (13.2%) | 0 (0.0%) |
| Total | 340 (100.0%) | 884 (100.0%) |
Household Income by Mortgage Status in Swannanoa
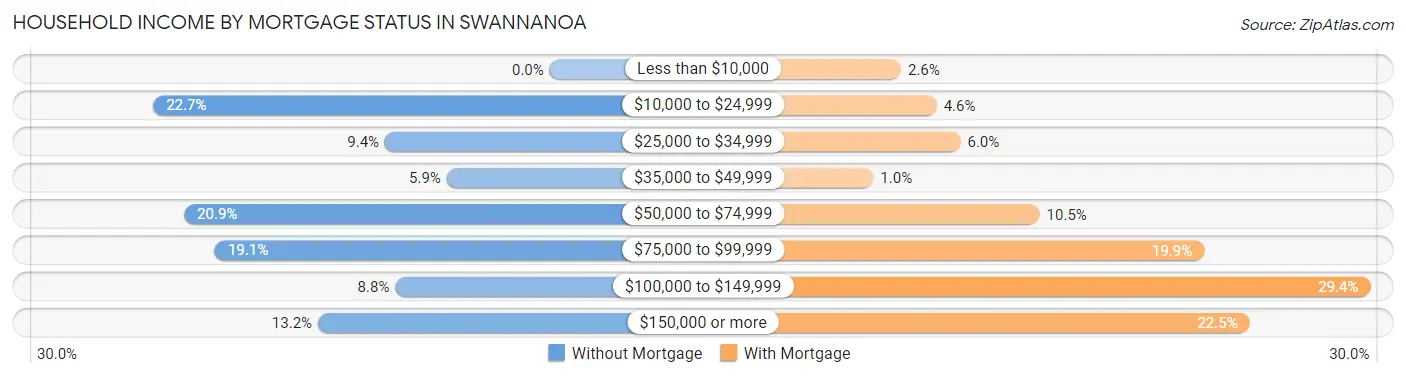
| Household Income | Without Mortgage | With Mortgage |
| Less than $10,000 | 0 (0.0%) | 23 (2.6%) |
| $10,000 to $24,999 | 77 (22.7%) | 41 (4.6%) |
| $25,000 to $34,999 | 32 (9.4%) | 53 (6.0%) |
| $35,000 to $49,999 | 20 (5.9%) | 9 (1.0%) |
| $50,000 to $74,999 | 71 (20.9%) | 93 (10.5%) |
| $75,000 to $99,999 | 65 (19.1%) | 176 (19.9%) |
| $100,000 to $149,999 | 30 (8.8%) | 260 (29.4%) |
| $150,000 or more | 45 (13.2%) | 199 (22.5%) |
| Total | 340 (100.0%) | 884 (100.0%) |
Property Value to Household Income Ratio in Swannanoa
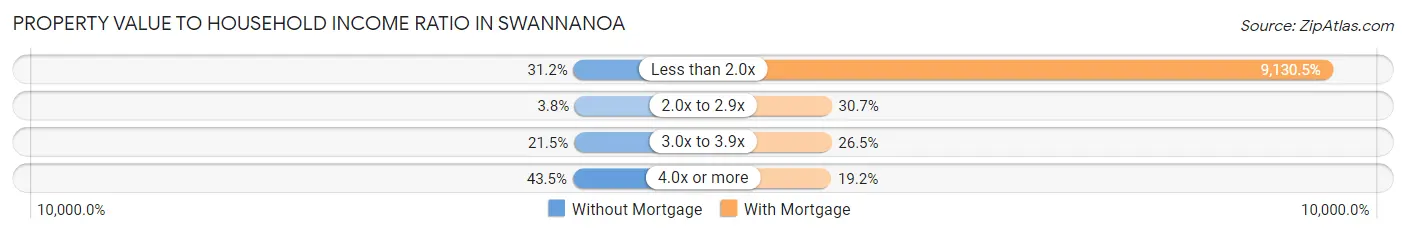
| Value-to-Income Ratio | Without Mortgage | With Mortgage |
| Less than 2.0x | 106 (31.2%) | 80,714 (9,130.5%) |
| 2.0x to 2.9x | 13 (3.8%) | 271 (30.7%) |
| 3.0x to 3.9x | 73 (21.5%) | 234 (26.5%) |
| 4.0x or more | 148 (43.5%) | 170 (19.2%) |
| Total | 340 (100.0%) | 884 (100.0%) |
Real Estate Taxes by Mortgage Status in Swannanoa
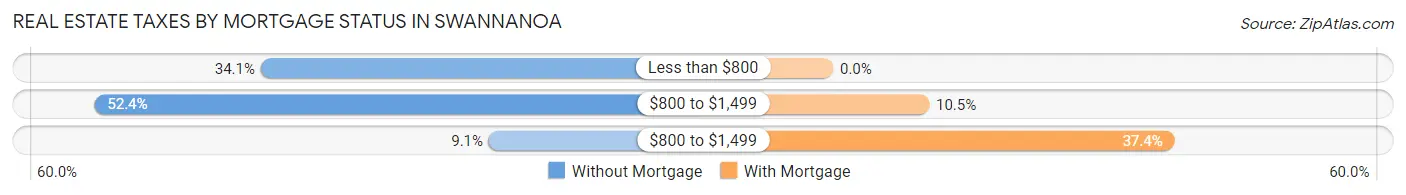
| Property Taxes | Without Mortgage | With Mortgage |
| Less than $800 | 116 (34.1%) | 0 (0.0%) |
| $800 to $1,499 | 178 (52.3%) | 93 (10.5%) |
| $800 to $1,499 | 31 (9.1%) | 331 (37.4%) |
| Total | 340 (100.0%) | 884 (100.0%) |
Health & Disability in Swannanoa
Health Insurance Coverage by Age in Swannanoa
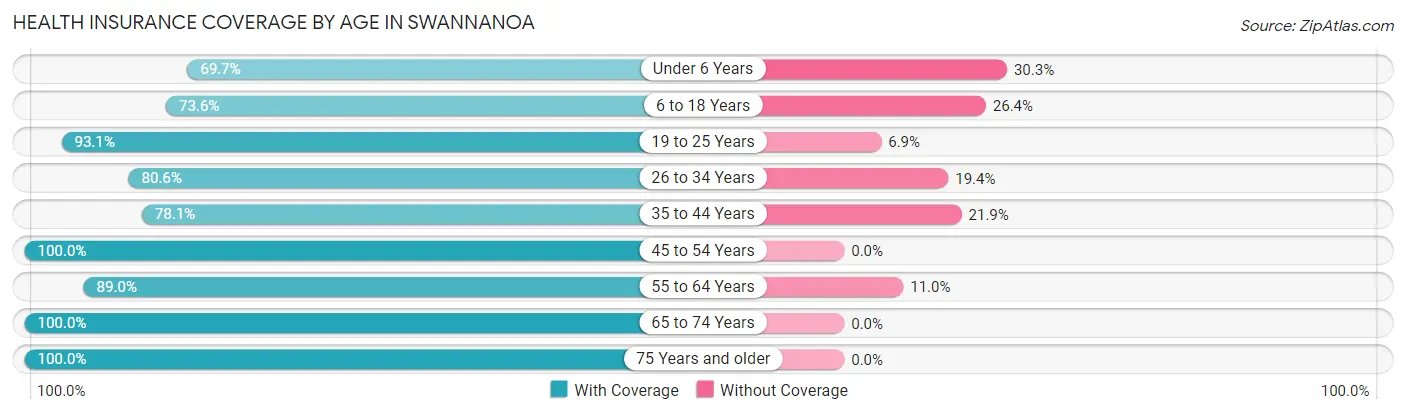
| Age Bracket | With Coverage | Without Coverage |
| Under 6 Years | 349 (69.7%) | 152 (30.3%) |
| 6 to 18 Years | 524 (73.6%) | 188 (26.4%) |
| 19 to 25 Years | 432 (93.1%) | 32 (6.9%) |
| 26 to 34 Years | 777 (80.6%) | 187 (19.4%) |
| 35 to 44 Years | 425 (78.1%) | 119 (21.9%) |
| 45 to 54 Years | 367 (100.0%) | 0 (0.0%) |
| 55 to 64 Years | 606 (89.0%) | 75 (11.0%) |
| 65 to 74 Years | 538 (100.0%) | 0 (0.0%) |
| 75 Years and older | 195 (100.0%) | 0 (0.0%) |
| Total | 4,213 (84.8%) | 753 (15.2%) |
Health Insurance Coverage by Citizenship Status in Swannanoa
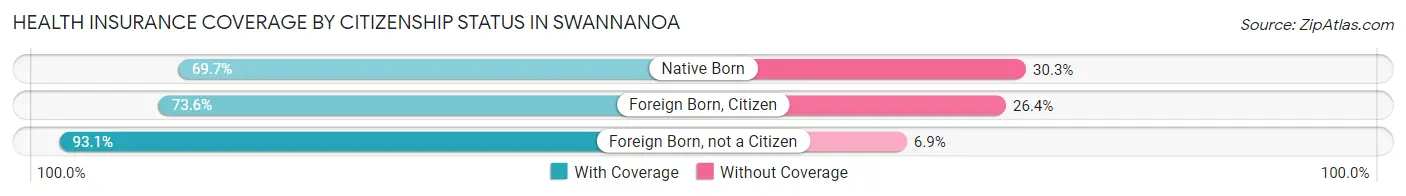
| Citizenship Status | With Coverage | Without Coverage |
| Native Born | 349 (69.7%) | 152 (30.3%) |
| Foreign Born, Citizen | 524 (73.6%) | 188 (26.4%) |
| Foreign Born, not a Citizen | 432 (93.1%) | 32 (6.9%) |
Health Insurance Coverage by Household Income in Swannanoa
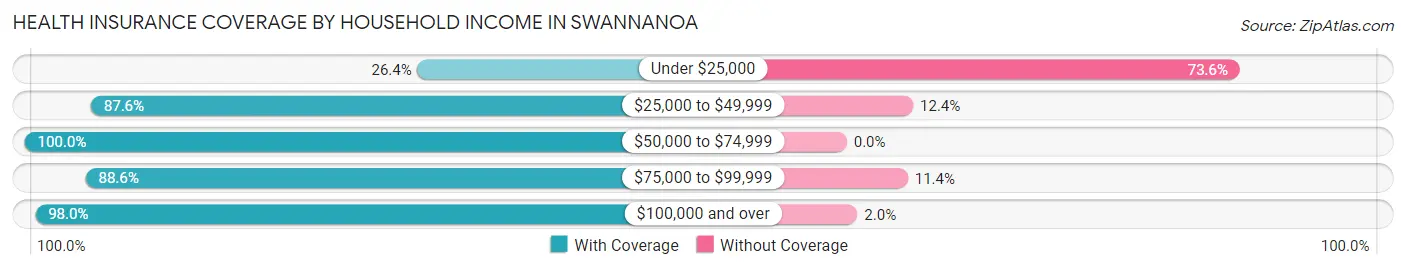
| Household Income | With Coverage | Without Coverage |
| Under $25,000 | 191 (26.4%) | 533 (73.6%) |
| $25,000 to $49,999 | 677 (87.6%) | 96 (12.4%) |
| $50,000 to $74,999 | 1,201 (100.0%) | 0 (0.0%) |
| $75,000 to $99,999 | 682 (88.6%) | 88 (11.4%) |
| $100,000 and over | 1,426 (98.0%) | 29 (2.0%) |
Public vs Private Health Insurance Coverage by Age in Swannanoa
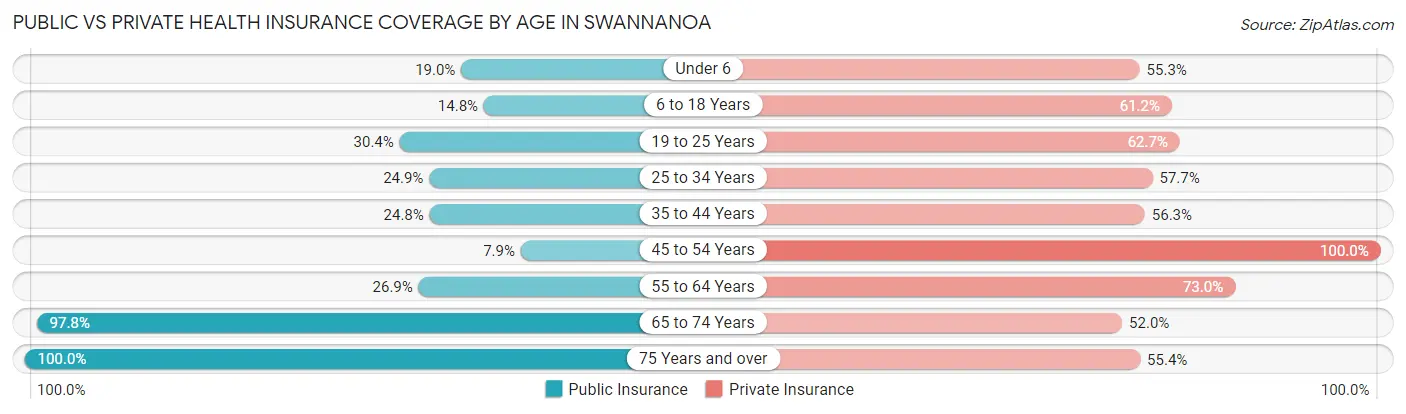
| Age Bracket | Public Insurance | Private Insurance |
| Under 6 | 95 (19.0%) | 277 (55.3%) |
| 6 to 18 Years | 105 (14.7%) | 436 (61.2%) |
| 19 to 25 Years | 141 (30.4%) | 291 (62.7%) |
| 25 to 34 Years | 240 (24.9%) | 556 (57.7%) |
| 35 to 44 Years | 135 (24.8%) | 306 (56.2%) |
| 45 to 54 Years | 29 (7.9%) | 367 (100.0%) |
| 55 to 64 Years | 183 (26.9%) | 497 (73.0%) |
| 65 to 74 Years | 526 (97.8%) | 280 (52.0%) |
| 75 Years and over | 195 (100.0%) | 108 (55.4%) |
| Total | 1,649 (33.2%) | 3,118 (62.8%) |
Disability Status by Sex by Age in Swannanoa
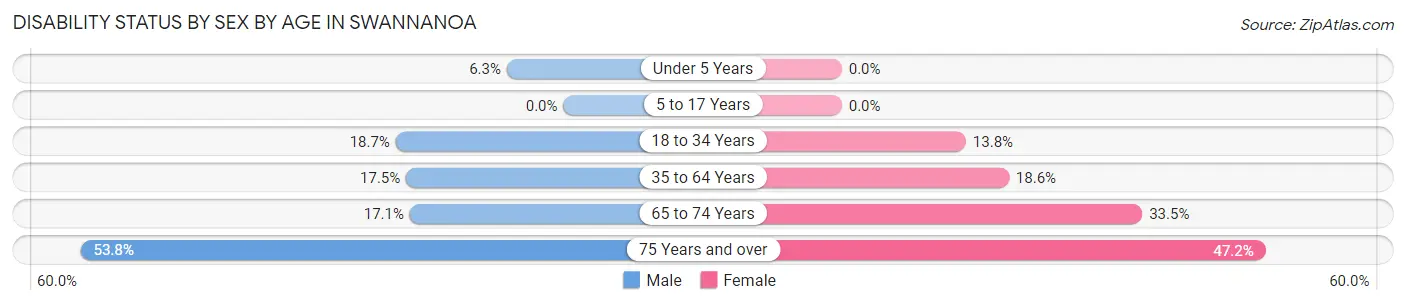
| Age Bracket | Male | Female |
| Under 5 Years | 17 (6.3%) | 0 (0.0%) |
| 5 to 17 Years | 0 (0.0%) | 0 (0.0%) |
| 18 to 34 Years | 118 (18.7%) | 110 (13.8%) |
| 35 to 64 Years | 148 (17.5%) | 139 (18.6%) |
| 65 to 74 Years | 46 (17.1%) | 90 (33.5%) |
| 75 Years and over | 57 (53.8%) | 42 (47.2%) |
Disability Class by Sex by Age in Swannanoa
Disability Class: Hearing Difficulty
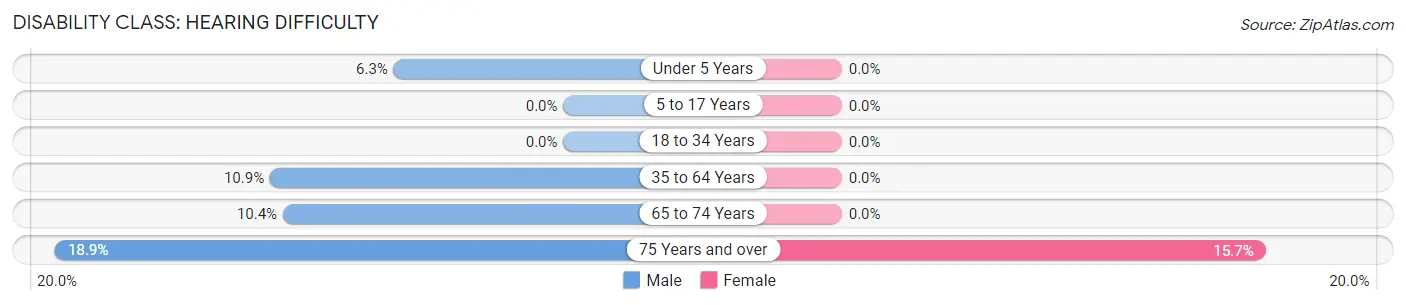
| Age Bracket | Male | Female |
| Under 5 Years | 17 (6.3%) | 0 (0.0%) |
| 5 to 17 Years | 0 (0.0%) | 0 (0.0%) |
| 18 to 34 Years | 0 (0.0%) | 0 (0.0%) |
| 35 to 64 Years | 92 (10.9%) | 0 (0.0%) |
| 65 to 74 Years | 28 (10.4%) | 0 (0.0%) |
| 75 Years and over | 20 (18.9%) | 14 (15.7%) |
Disability Class: Vision Difficulty
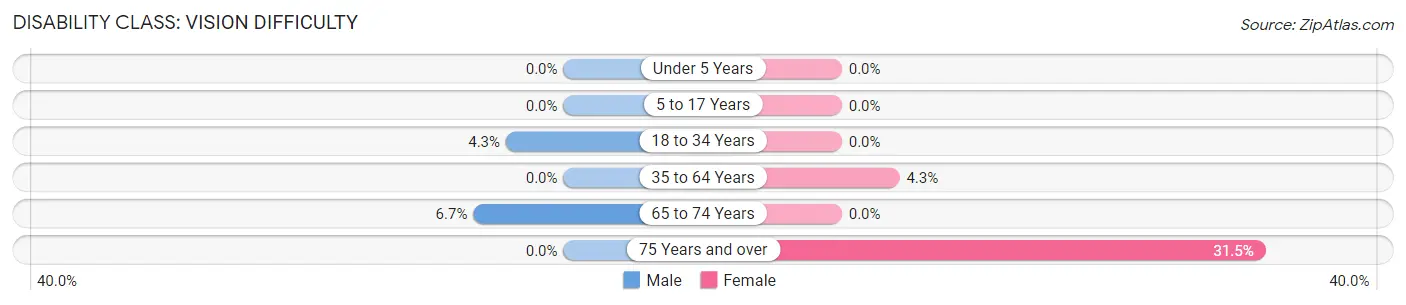
| Age Bracket | Male | Female |
| Under 5 Years | 0 (0.0%) | 0 (0.0%) |
| 5 to 17 Years | 0 (0.0%) | 0 (0.0%) |
| 18 to 34 Years | 27 (4.3%) | 0 (0.0%) |
| 35 to 64 Years | 0 (0.0%) | 32 (4.3%) |
| 65 to 74 Years | 18 (6.7%) | 0 (0.0%) |
| 75 Years and over | 0 (0.0%) | 28 (31.5%) |
Disability Class: Cognitive Difficulty
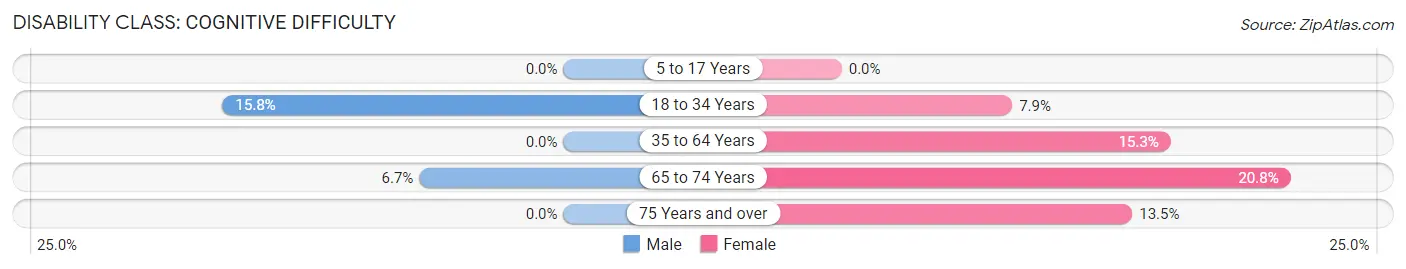
| Age Bracket | Male | Female |
| 5 to 17 Years | 0 (0.0%) | 0 (0.0%) |
| 18 to 34 Years | 100 (15.8%) | 63 (7.9%) |
| 35 to 64 Years | 0 (0.0%) | 114 (15.3%) |
| 65 to 74 Years | 18 (6.7%) | 56 (20.8%) |
| 75 Years and over | 0 (0.0%) | 12 (13.5%) |
Disability Class: Ambulatory Difficulty
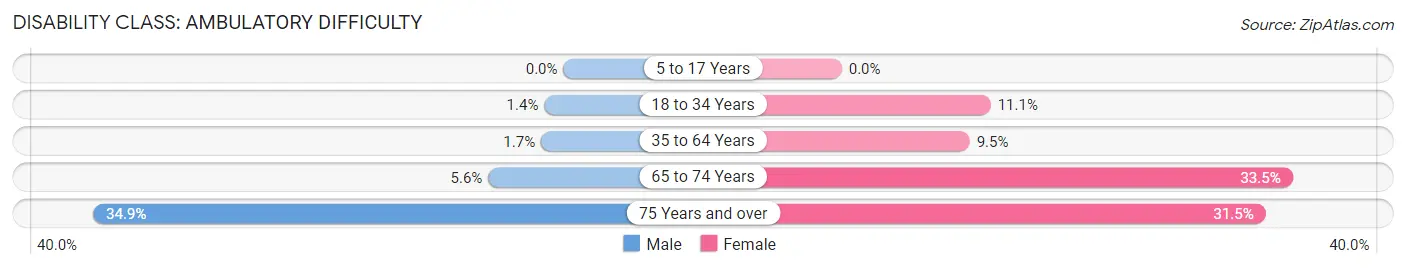
| Age Bracket | Male | Female |
| 5 to 17 Years | 0 (0.0%) | 0 (0.0%) |
| 18 to 34 Years | 9 (1.4%) | 88 (11.1%) |
| 35 to 64 Years | 14 (1.7%) | 71 (9.5%) |
| 65 to 74 Years | 15 (5.6%) | 90 (33.5%) |
| 75 Years and over | 37 (34.9%) | 28 (31.5%) |
Disability Class: Self-Care Difficulty
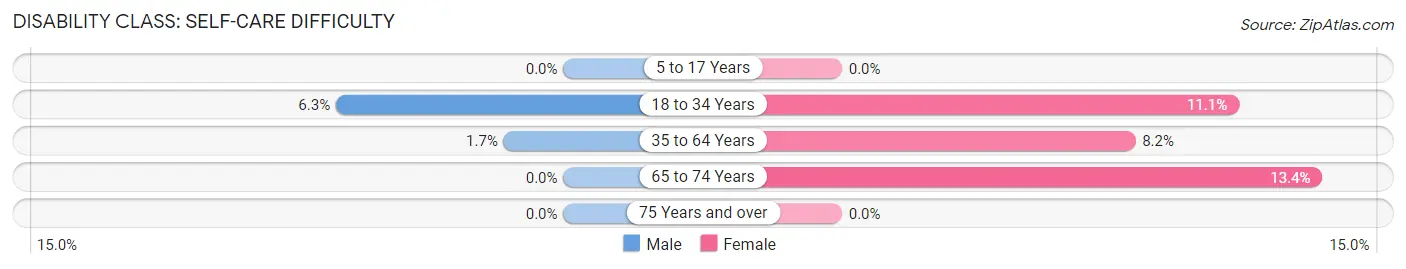
| Age Bracket | Male | Female |
| 5 to 17 Years | 0 (0.0%) | 0 (0.0%) |
| 18 to 34 Years | 40 (6.3%) | 88 (11.1%) |
| 35 to 64 Years | 14 (1.7%) | 61 (8.2%) |
| 65 to 74 Years | 0 (0.0%) | 36 (13.4%) |
| 75 Years and over | 0 (0.0%) | 0 (0.0%) |
Technology Access in Swannanoa
Computing Device Access in Swannanoa
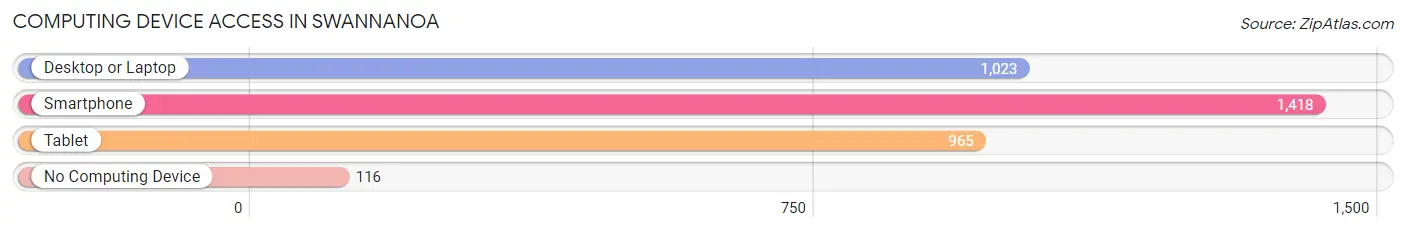
| Device Type | # Households | % Households |
| Desktop or Laptop | 1,023 | 63.4% |
| Smartphone | 1,418 | 87.9% |
| Tablet | 965 | 59.8% |
| No Computing Device | 116 | 7.2% |
| Total | 1,614 | 100.0% |
Internet Access in Swannanoa
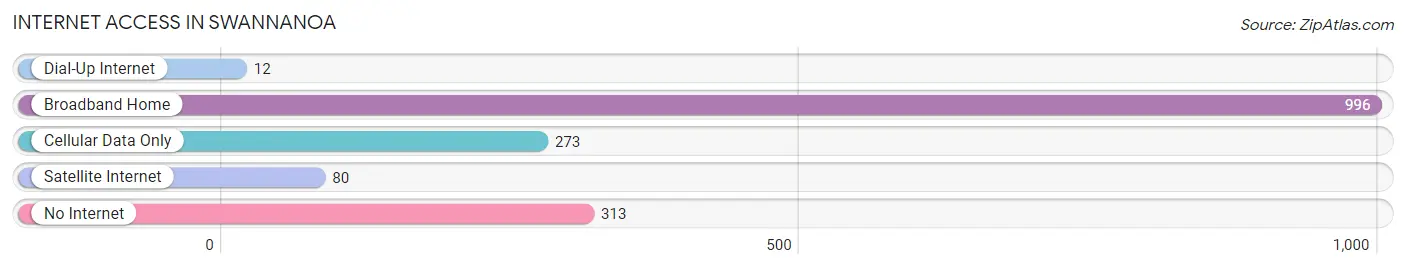
| Internet Type | # Households | % Households |
| Dial-Up Internet | 12 | 0.7% |
| Broadband Home | 996 | 61.7% |
| Cellular Data Only | 273 | 16.9% |
| Satellite Internet | 80 | 5.0% |
| No Internet | 313 | 19.4% |
| Total | 1,614 | 100.0% |
Swannanoa Summary
Swannanoa is a small town located in Buncombe County, North Carolina. It is situated in the Blue Ridge Mountains, just east of Asheville. The town has a population of approximately 2,500 people and is part of the Asheville Metropolitan Statistical Area.
History
Swannanoa was first settled in the late 1700s by a group of settlers from Scotland. The town was named after the Swannanoa River, which was named after a Native American chief. The town was officially incorporated in 1883.
In the late 1800s, Swannanoa was a popular tourist destination due to its proximity to Asheville. The town was home to several resorts, including the Swannanoa Hotel, which was built in 1887. The hotel was destroyed by fire in the early 1900s.
In the early 1900s, Swannanoa was home to several industries, including a cotton mill, a furniture factory, and a brickyard. The town also had a railroad station, which was used to transport goods and passengers.
Geography
Swannanoa is located in the Blue Ridge Mountains of western North Carolina. The town is situated at an elevation of 2,000 feet above sea level. The town is located approximately 10 miles east of Asheville.
The town is surrounded by the Swannanoa River, which flows through the town. The river is a popular destination for fishing, canoeing, and kayaking.
The town is located in a temperate climate, with mild winters and warm summers. The average annual temperature is around 60 degrees Fahrenheit.
Economy
The economy of Swannanoa is largely based on tourism. The town is home to several resorts, including the Swannanoa Valley Resort and the Swannanoa Country Club. The town is also home to several restaurants, shops, and other businesses.
The town is also home to several manufacturing companies, including a furniture factory and a brickyard. The town is also home to several farms, which produce a variety of crops, including corn, soybeans, and hay.
Demographics
As of the 2010 census, the population of Swannanoa was 2,500. The town is predominantly white, with approximately 90% of the population being white. The town also has a small African American population, with approximately 5% of the population being African American.
The median household income in Swannanoa is approximately $40,000. The town has a poverty rate of approximately 15%.
Conclusion
Swannanoa is a small town located in Buncombe County, North Carolina. The town has a population of approximately 2,500 people and is part of the Asheville Metropolitan Statistical Area. The town is situated in the Blue Ridge Mountains and is a popular tourist destination due to its proximity to Asheville. The town is home to several resorts, restaurants, shops, and other businesses. The town is predominantly white, with a median household income of approximately $40,000 and a poverty rate of approximately 15%.
Common Questions
What is Per Capita Income in Swannanoa?
Per Capita income in Swannanoa is $25,837.
What is the Median Family Income in Swannanoa?
Median Family Income in Swannanoa is $71,350.
What is the Median Household income in Swannanoa?
Median Household Income in Swannanoa is $64,815.
What is Income or Wage Gap in Swannanoa?
Income or Wage Gap in Swannanoa is 22.9%.
Women in Swannanoa earn 77.1 cents for every dollar earned by a man.
What is Inequality or Gini Index in Swannanoa?
Inequality or Gini Index in Swannanoa is 0.36.
What is the Total Population of Swannanoa?
Total Population of Swannanoa is 5,338.
What is the Total Male Population of Swannanoa?
Total Male Population of Swannanoa is 2,730.
What is the Total Female Population of Swannanoa?
Total Female Population of Swannanoa is 2,608.
What is the Ratio of Males per 100 Females in Swannanoa?
There are 104.68 Males per 100 Females in Swannanoa.
What is the Ratio of Females per 100 Males in Swannanoa?
There are 95.53 Females per 100 Males in Swannanoa.
What is the Median Population Age in Swannanoa?
Median Population Age in Swannanoa is 33.5 Years.
What is the Average Family Size in Swannanoa
Average Family Size in Swannanoa is 3.4 People.
What is the Average Household Size in Swannanoa
Average Household Size in Swannanoa is 3.0 People.
How Large is the Labor Force in Swannanoa?
There are 2,109 People in the Labor Forcein in Swannanoa.
What is the Percentage of People in the Labor Force in Swannanoa?
50.7% of People are in the Labor Force in Swannanoa.
What is the Unemployment Rate in Swannanoa?
Unemployment Rate in Swannanoa is 1.5%.