Misenheimer, NC Map & Demographics
Misenheimer Map
Misenheimer Overview
$12,222
PER CAPITA INCOME
$84,167
AVG FAMILY INCOME
$44,063
AVG HOUSEHOLD INCOME
0.39
INEQUALITY / GINI INDEX
652
TOTAL POPULATION
368
MALE POPULATION
284
FEMALE POPULATION
129.58
MALES / 100 FEMALES
77.17
FEMALES / 100 MALES
20.6
MEDIAN AGE
3.2
AVG FAMILY SIZE
2.0
AVG HOUSEHOLD SIZE
291
LABOR FORCE [ PEOPLE ]
48.8%
PERCENT IN LABOR FORCE
13.4%
UNEMPLOYMENT RATE
Misenheimer Zip Codes
Misenheimer Area Codes
Income in Misenheimer
Income Overview in Misenheimer
Per Capita Income in Misenheimer is $12,222, while median incomes of families and households are $84,167 and $44,063 respectively.
| Characteristic | Number | Measure |
| Per Capita Income | 652 | $12,222 |
| Median Family Income | 48 | $84,167 |
| Mean Family Income | 48 | $79,402 |
| Median Household Income | 113 | $44,063 |
| Mean Household Income | 113 | $59,093 |
| Income Deficit | 48 | $0 |
| Wage / Income Gap (%) | 652 | 0.00% |
| Wage / Income Gap ($) | 652 | 100.00¢ per $1 |
| Gini / Inequality Index | 652 | 0.39 |
Earnings by Sex in Misenheimer
| Sex | Number | Average Earnings |
| Male | 185 (56.8%) | $0 |
| Female | 141 (43.2%) | $0 |
| Total | 326 (100.0%) | $0 |
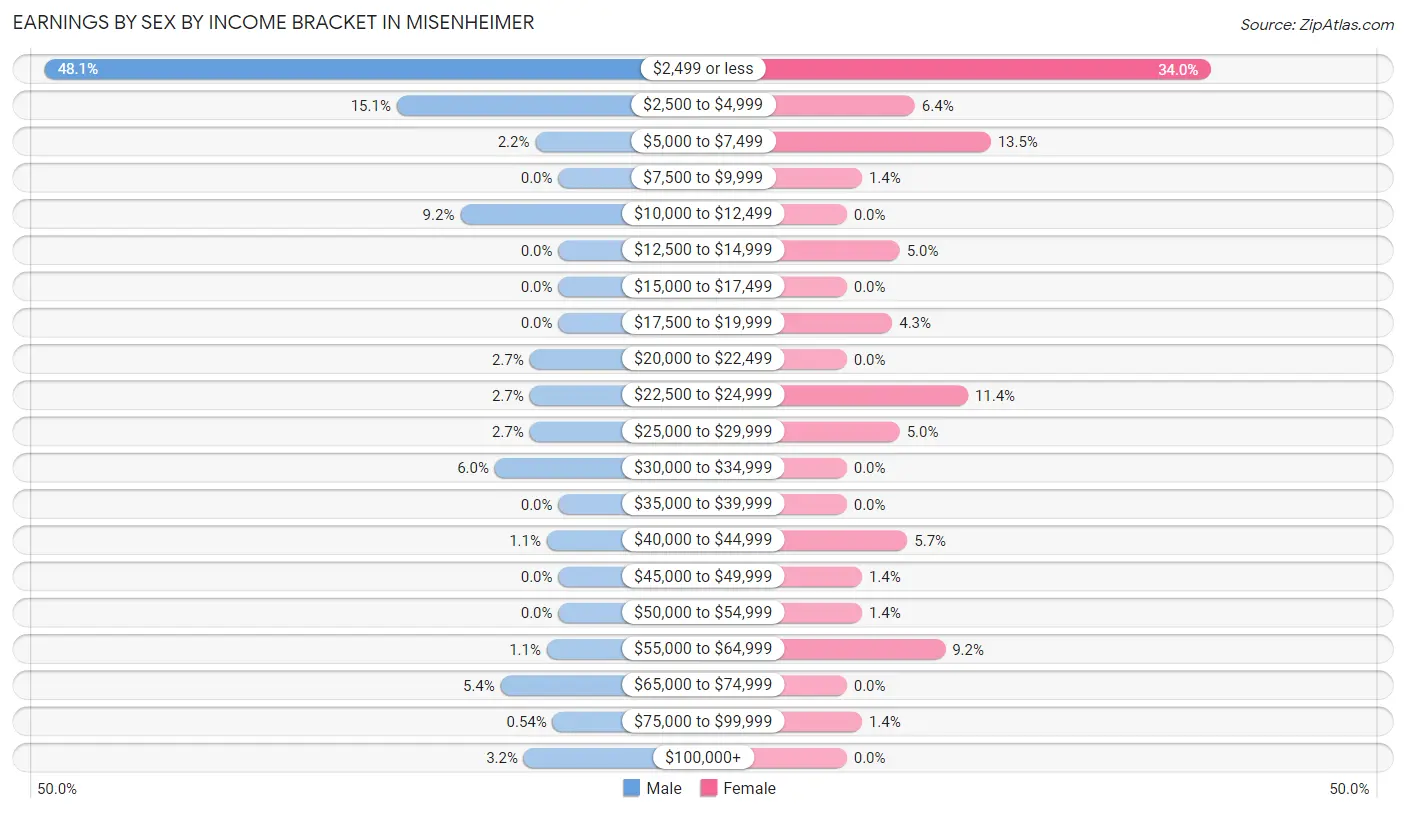
Earnings by Sex by Income Bracket in Misenheimer
The most common earnings brackets in Misenheimer are $2,499 or less for men (89 | 48.1%) and $2,499 or less for women (48 | 34.0%).
| Income | Male | Female |
| $2,499 or less | 89 (48.1%) | 48 (34.0%) |
| $2,500 to $4,999 | 28 (15.1%) | 9 (6.4%) |
| $5,000 to $7,499 | 4 (2.2%) | 19 (13.5%) |
| $7,500 to $9,999 | 0 (0.0%) | 2 (1.4%) |
| $10,000 to $12,499 | 17 (9.2%) | 0 (0.0%) |
| $12,500 to $14,999 | 0 (0.0%) | 7 (5.0%) |
| $15,000 to $17,499 | 0 (0.0%) | 0 (0.0%) |
| $17,500 to $19,999 | 0 (0.0%) | 6 (4.3%) |
| $20,000 to $22,499 | 5 (2.7%) | 0 (0.0%) |
| $22,500 to $24,999 | 5 (2.7%) | 16 (11.4%) |
| $25,000 to $29,999 | 5 (2.7%) | 7 (5.0%) |
| $30,000 to $34,999 | 11 (5.9%) | 0 (0.0%) |
| $35,000 to $39,999 | 0 (0.0%) | 0 (0.0%) |
| $40,000 to $44,999 | 2 (1.1%) | 8 (5.7%) |
| $45,000 to $49,999 | 0 (0.0%) | 2 (1.4%) |
| $50,000 to $54,999 | 0 (0.0%) | 2 (1.4%) |
| $55,000 to $64,999 | 2 (1.1%) | 13 (9.2%) |
| $65,000 to $74,999 | 10 (5.4%) | 0 (0.0%) |
| $75,000 to $99,999 | 1 (0.5%) | 2 (1.4%) |
| $100,000+ | 6 (3.2%) | 0 (0.0%) |
| Total | 185 (100.0%) | 141 (100.0%) |
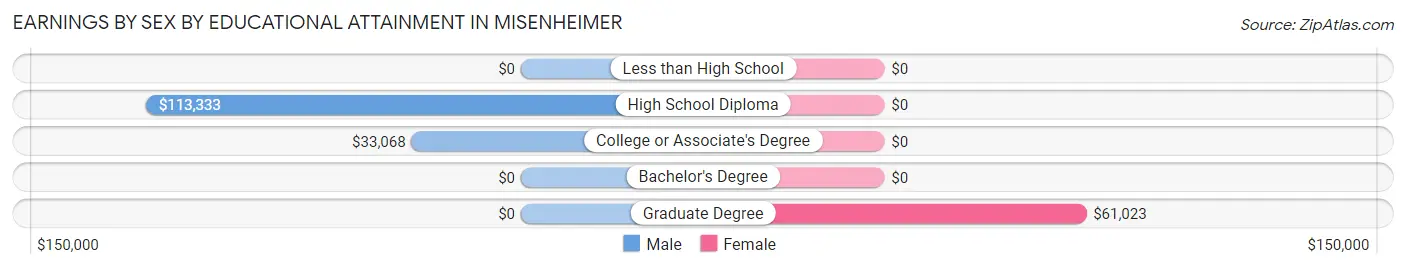
Earnings by Sex by Educational Attainment in Misenheimer
| Educational Attainment | Male Income | Female Income |
| Less than High School | - | - |
| High School Diploma | $113,333 | $0 |
| College or Associate's Degree | $33,068 | $0 |
| Bachelor's Degree | - | - |
| Graduate Degree | - | - |
| Total | - | - |
Family Income in Misenheimer
Family Income Brackets in Misenheimer
According to the Misenheimer family income data, there are 17 families falling into the $100,000 to $149,999 income range, which is the most common income bracket and makes up 35.4% of all families.
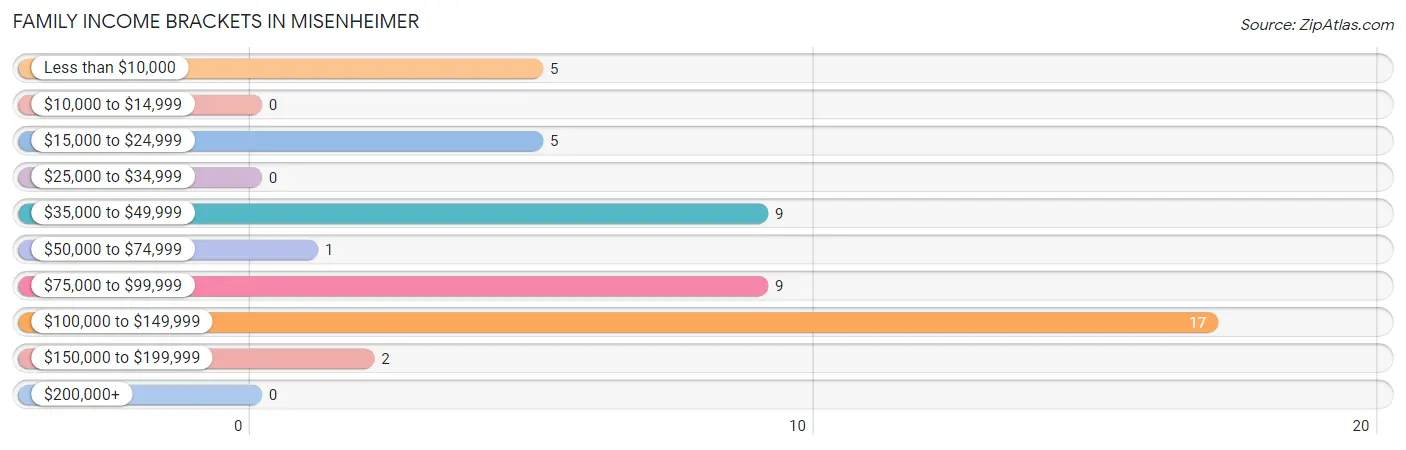
| Income Bracket | # Families | % Families |
| Less than $10,000 | 5 | 10.4% |
| $10,000 to $14,999 | 0 | 0.0% |
| $15,000 to $24,999 | 5 | 10.4% |
| $25,000 to $34,999 | 0 | 0.0% |
| $35,000 to $49,999 | 9 | 18.8% |
| $50,000 to $74,999 | 1 | 2.1% |
| $75,000 to $99,999 | 9 | 18.8% |
| $100,000 to $149,999 | 17 | 35.4% |
| $150,000 to $199,999 | 2 | 4.2% |
| $200,000+ | 0 | 0.0% |
Family Income by Famaliy Size in Misenheimer
2-person families (22 | 45.8%) account for the highest median family income in Misenheimer with $83,333 per family, while 2-person families (22 | 45.8%) have the highest median income of $41,666 per family member.
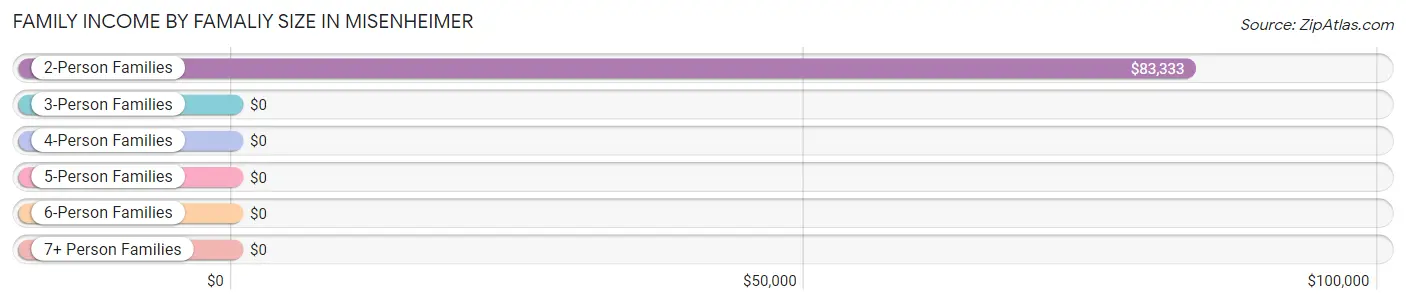
| Income Bracket | # Families | Median Income |
| 2-Person Families | 22 (45.8%) | $83,333 |
| 3-Person Families | 9 (18.8%) | $0 |
| 4-Person Families | 3 (6.2%) | $0 |
| 5-Person Families | 9 (18.8%) | $0 |
| 6-Person Families | 5 (10.4%) | $0 |
| 7+ Person Families | 0 (0.0%) | $0 |
| Total | 48 (100.0%) | $84,167 |
Family Income by Number of Earners in Misenheimer
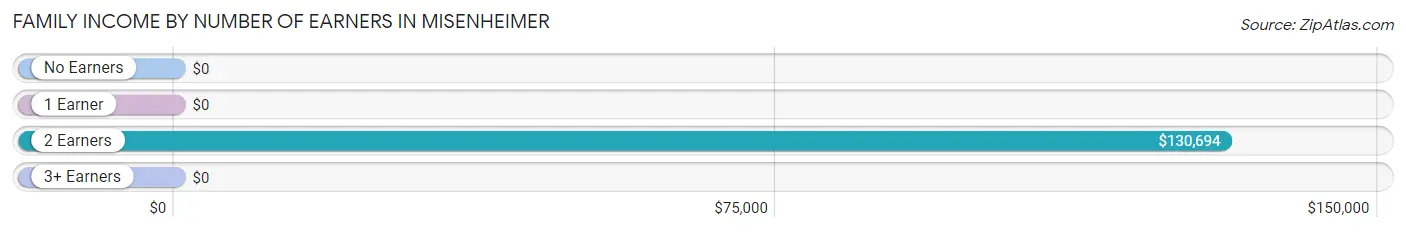
| Number of Earners | # Families | Median Income |
| No Earners | 17 (35.4%) | $0 |
| 1 Earner | 10 (20.8%) | $0 |
| 2 Earners | 17 (35.4%) | $130,694 |
| 3+ Earners | 4 (8.3%) | $0 |
| Total | 48 (100.0%) | $84,167 |
Household Income in Misenheimer
Household Income Brackets in Misenheimer
With 26 households falling in the category, the $25,000 to $34,999 income range is the most frequent in Misenheimer, accounting for 23.0% of all households.
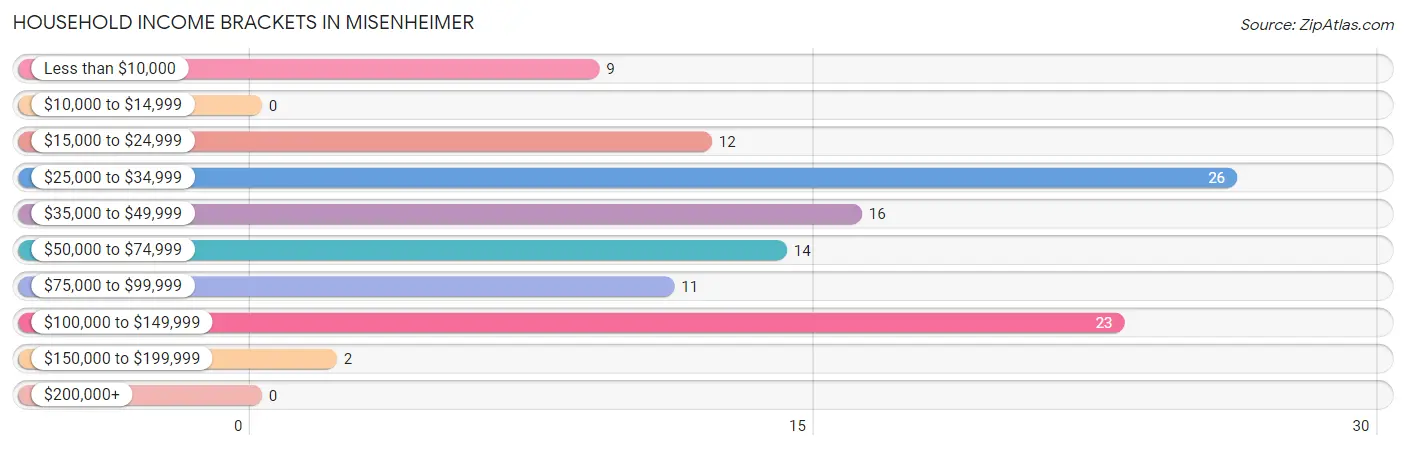
| Income Bracket | # Households | % Households |
| Less than $10,000 | 9 | 8.0% |
| $10,000 to $14,999 | 0 | 0.0% |
| $15,000 to $24,999 | 12 | 10.6% |
| $25,000 to $34,999 | 26 | 23.0% |
| $35,000 to $49,999 | 16 | 14.2% |
| $50,000 to $74,999 | 14 | 12.4% |
| $75,000 to $99,999 | 11 | 9.7% |
| $100,000 to $149,999 | 23 | 20.4% |
| $150,000 to $199,999 | 2 | 1.8% |
| $200,000+ | 0 | 0.0% |
Household Income by Householder Age in Misenheimer
The median household income in Misenheimer is $44,063, with the highest median household income of $41,250 found in the 65+ years age bracket for the primary householder. A total of 46 households (40.7%) fall into this category. Meanwhile, the 15 to 24 years age bracket for the primary householder has the lowest median household income of $0, with 7 households (6.2%) in this group.
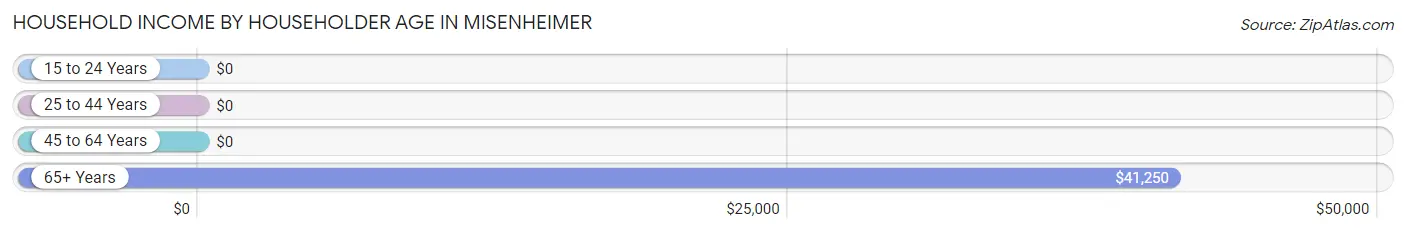
| Income Bracket | # Households | Median Income |
| 15 to 24 Years | 7 (6.2%) | $0 |
| 25 to 44 Years | 31 (27.4%) | $0 |
| 45 to 64 Years | 29 (25.7%) | $0 |
| 65+ Years | 46 (40.7%) | $41,250 |
| Total | 113 (100.0%) | $44,063 |
Poverty in Misenheimer
Income Below Poverty by Sex and Age in Misenheimer
With 3.8% poverty level for males and 10.7% for females among the residents of Misenheimer, 55 to 64 year old males and 55 to 64 year old females are the most vulnerable to poverty, with 4 males (25.0%) and 9 females (40.9%) in their respective age groups living below the poverty level.
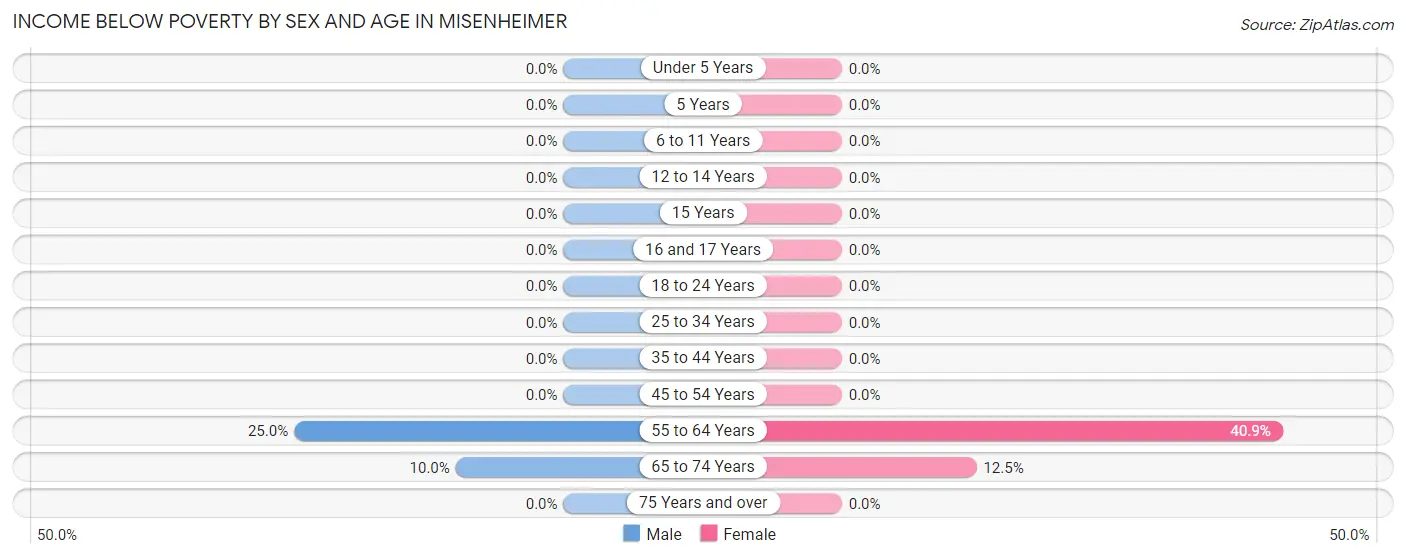
| Age Bracket | Male | Female |
| Under 5 Years | 0 (0.0%) | 0 (0.0%) |
| 5 Years | 0 (0.0%) | 0 (0.0%) |
| 6 to 11 Years | 0 (0.0%) | 0 (0.0%) |
| 12 to 14 Years | 0 (0.0%) | 0 (0.0%) |
| 15 Years | 0 (0.0%) | 0 (0.0%) |
| 16 and 17 Years | 0 (0.0%) | 0 (0.0%) |
| 18 to 24 Years | 0 (0.0%) | 0 (0.0%) |
| 25 to 34 Years | 0 (0.0%) | 0 (0.0%) |
| 35 to 44 Years | 0 (0.0%) | 0 (0.0%) |
| 45 to 54 Years | 0 (0.0%) | 0 (0.0%) |
| 55 to 64 Years | 4 (25.0%) | 9 (40.9%) |
| 65 to 74 Years | 1 (10.0%) | 1 (12.5%) |
| 75 Years and over | 0 (0.0%) | 0 (0.0%) |
| Total | 5 (3.8%) | 10 (10.7%) |
Income Above Poverty by Sex and Age in Misenheimer
According to the poverty statistics in Misenheimer, males aged under 5 years and females aged under 5 years are the age groups that are most secure financially, with 100.0% of males and 100.0% of females in these age groups living above the poverty line.
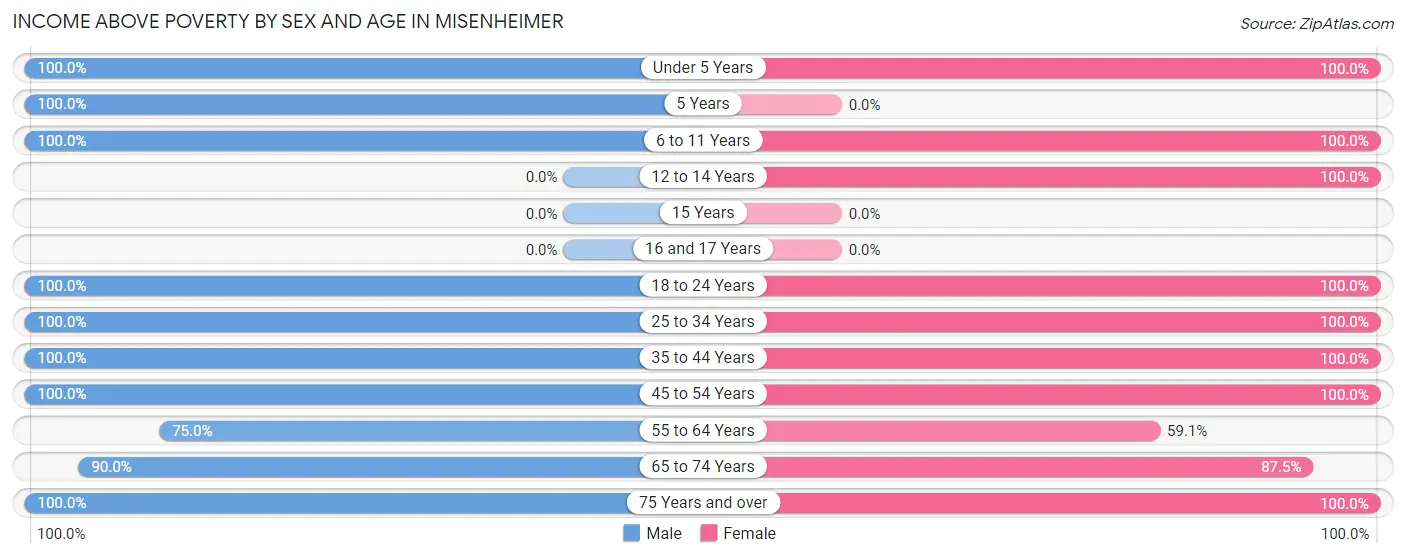
| Age Bracket | Male | Female |
| Under 5 Years | 18 (100.0%) | 2 (100.0%) |
| 5 Years | 9 (100.0%) | 0 (0.0%) |
| 6 to 11 Years | 14 (100.0%) | 12 (100.0%) |
| 12 to 14 Years | 0 (0.0%) | 1 (100.0%) |
| 15 Years | 0 (0.0%) | 0 (0.0%) |
| 16 and 17 Years | 0 (0.0%) | 0 (0.0%) |
| 18 to 24 Years | 9 (100.0%) | 6 (100.0%) |
| 25 to 34 Years | 25 (100.0%) | 17 (100.0%) |
| 35 to 44 Years | 1 (100.0%) | 5 (100.0%) |
| 45 to 54 Years | 3 (100.0%) | 6 (100.0%) |
| 55 to 64 Years | 12 (75.0%) | 13 (59.1%) |
| 65 to 74 Years | 9 (90.0%) | 7 (87.5%) |
| 75 Years and over | 28 (100.0%) | 14 (100.0%) |
| Total | 128 (96.2%) | 83 (89.2%) |
Income Below Poverty Among Married-Couple Families in Misenheimer
The poverty statistics for married-couple families in Misenheimer show that 10.4% or 5 of the total 48 families live below the poverty line. Families with no children have the highest poverty rate of 20.8%, comprising of 5 families. On the other hand, families with 1 or 2 children have the lowest poverty rate of 0.0%, which includes 0 families.
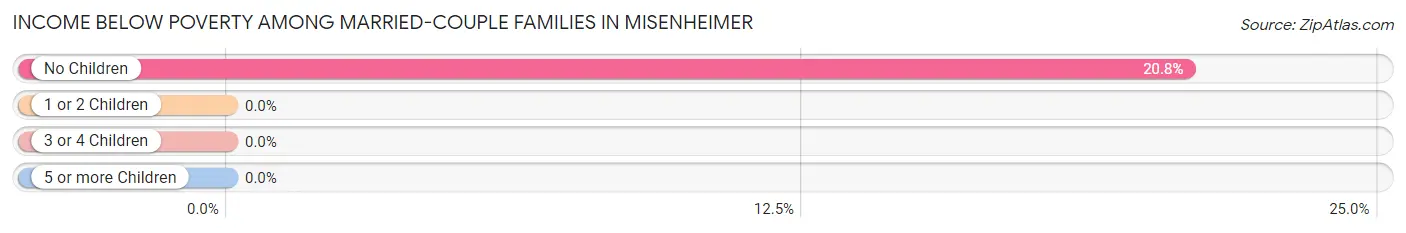
| Children | Above Poverty | Below Poverty |
| No Children | 19 (79.2%) | 5 (20.8%) |
| 1 or 2 Children | 10 (100.0%) | 0 (0.0%) |
| 3 or 4 Children | 14 (100.0%) | 0 (0.0%) |
| 5 or more Children | 0 (0.0%) | 0 (0.0%) |
| Total | 43 (89.6%) | 5 (10.4%) |
Income Below Poverty Among Single-Parent Households in Misenheimer
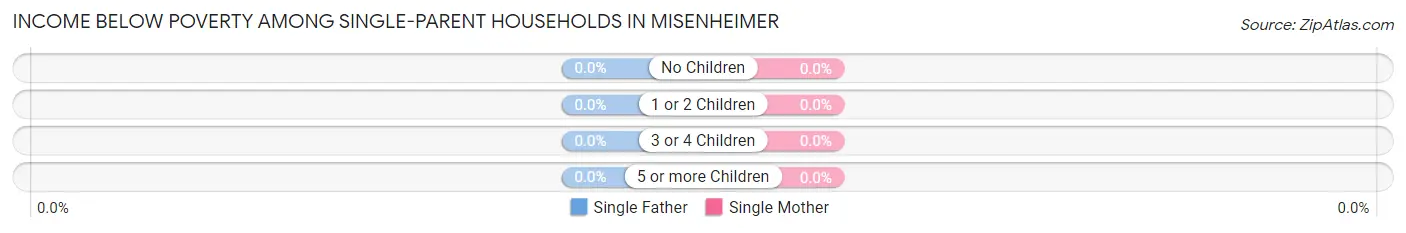
| Children | Single Father | Single Mother |
| No Children | 0 (0.0%) | 0 (0.0%) |
| 1 or 2 Children | 0 (0.0%) | 0 (0.0%) |
| 3 or 4 Children | 0 (0.0%) | 0 (0.0%) |
| 5 or more Children | 0 (0.0%) | 0 (0.0%) |
| Total | 0 (0.0%) | 0 (0.0%) |
Income Below Poverty Among Married-Couple vs Single-Parent Households in Misenheimer
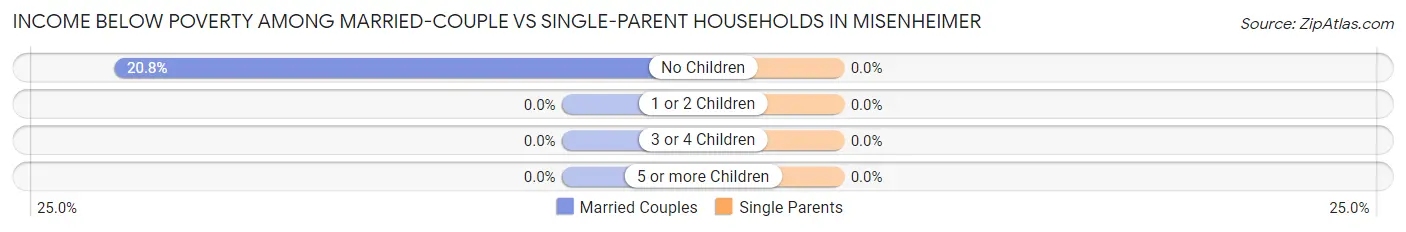
| Children | Married-Couple Families | Single-Parent Households |
| No Children | 5 (20.8%) | 0 (0.0%) |
| 1 or 2 Children | 0 (0.0%) | 0 (0.0%) |
| 3 or 4 Children | 0 (0.0%) | 0 (0.0%) |
| 5 or more Children | 0 (0.0%) | 0 (0.0%) |
| Total | 5 (10.4%) | 0 (0.0%) |
Race in Misenheimer
The most populous races in Misenheimer are White / Caucasian (465 | 71.3%), Black / African American (155 | 23.8%), and Hispanic or Latino (65 | 10.0%).
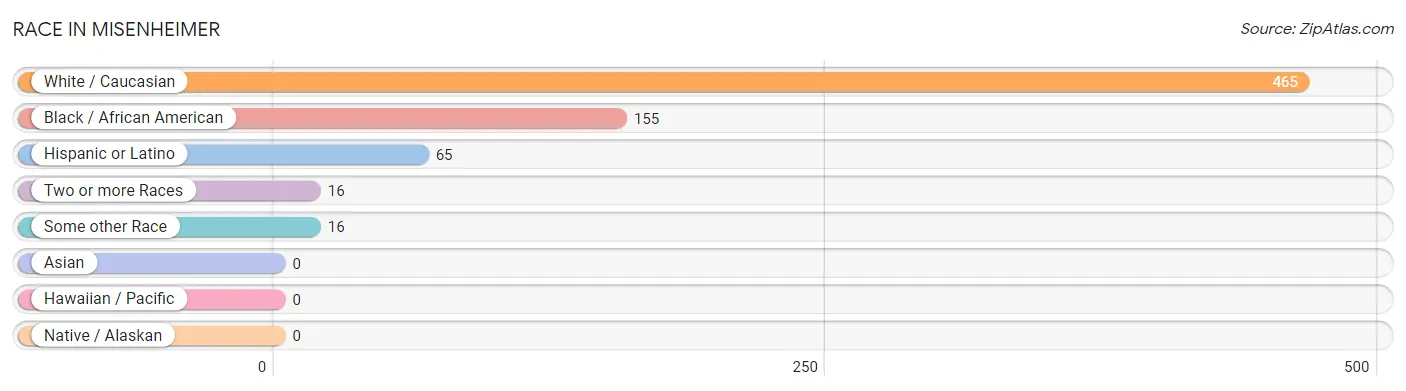
| Race | # Population | % Population |
| Asian | 0 | 0.0% |
| Black / African American | 155 | 23.8% |
| Hawaiian / Pacific | 0 | 0.0% |
| Hispanic or Latino | 65 | 10.0% |
| Native / Alaskan | 0 | 0.0% |
| White / Caucasian | 465 | 71.3% |
| Two or more Races | 16 | 2.5% |
| Some other Race | 16 | 2.5% |
| Total | 652 | 100.0% |
Ancestry in Misenheimer
The most populous ancestries reported in Misenheimer are English (86 | 13.2%), Irish (77 | 11.8%), German (43 | 6.6%), American (38 | 5.8%), and African (21 | 3.2%), together accounting for 40.7% of all Misenheimer residents.
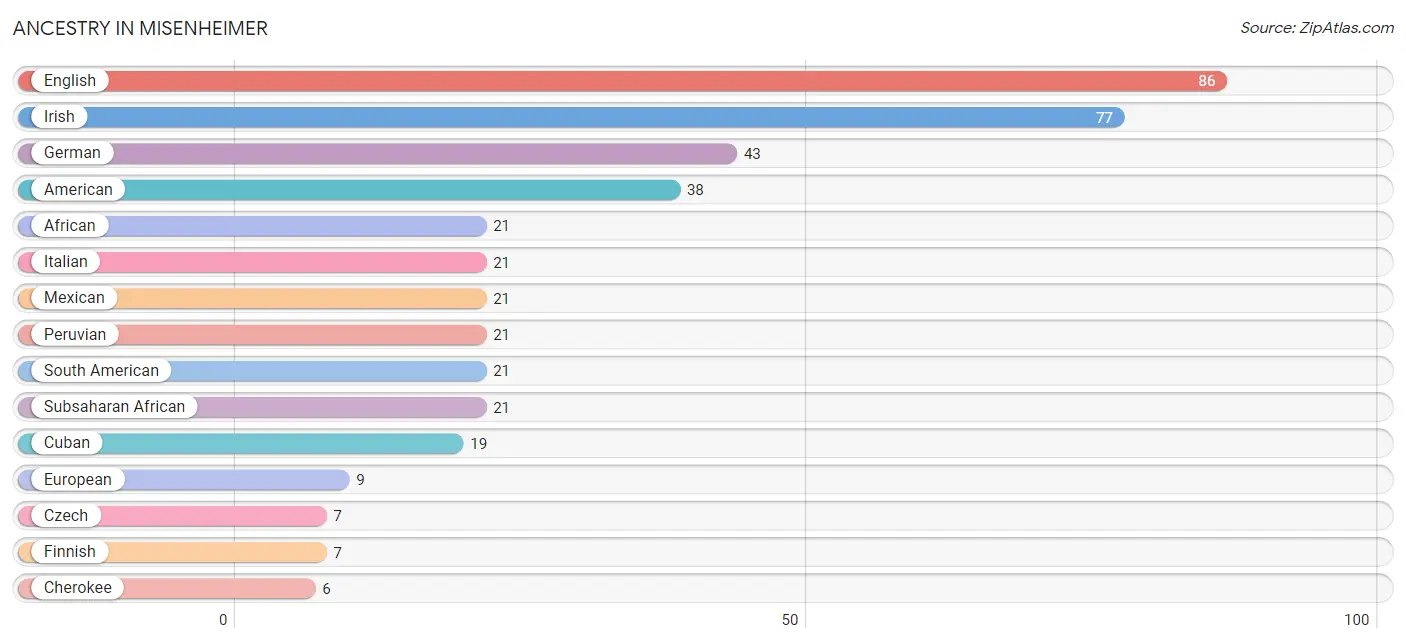
| Ancestry | # Population | % Population |
| African | 21 | 3.2% |
| American | 38 | 5.8% |
| British | 4 | 0.6% |
| Cherokee | 6 | 0.9% |
| Cuban | 19 | 2.9% |
| Czech | 7 | 1.1% |
| English | 86 | 13.2% |
| European | 9 | 1.4% |
| Finnish | 7 | 1.1% |
| German | 43 | 6.6% |
| Irish | 77 | 11.8% |
| Italian | 21 | 3.2% |
| Mexican | 21 | 3.2% |
| Peruvian | 21 | 3.2% |
| Puerto Rican | 4 | 0.6% |
| Scottish | 3 | 0.5% |
| South American | 21 | 3.2% |
| Subsaharan African | 21 | 3.2% | View All 18 Rows |
Immigrants in Misenheimer
The most numerous immigrant groups reported in Misenheimer came from , and Africa (5 | 0.8%), together accounting for 0.8% of all Misenheimer residents.

| Immigration Origin | # Population | % Population |
| Africa | 5 | 0.8% | View All 1 Rows |
Sex and Age in Misenheimer
Sex and Age in Misenheimer
The most populous age groups in Misenheimer are 20 to 24 Years (134 | 36.4%) for men and 15 to 19 Years (110 | 38.7%) for women.
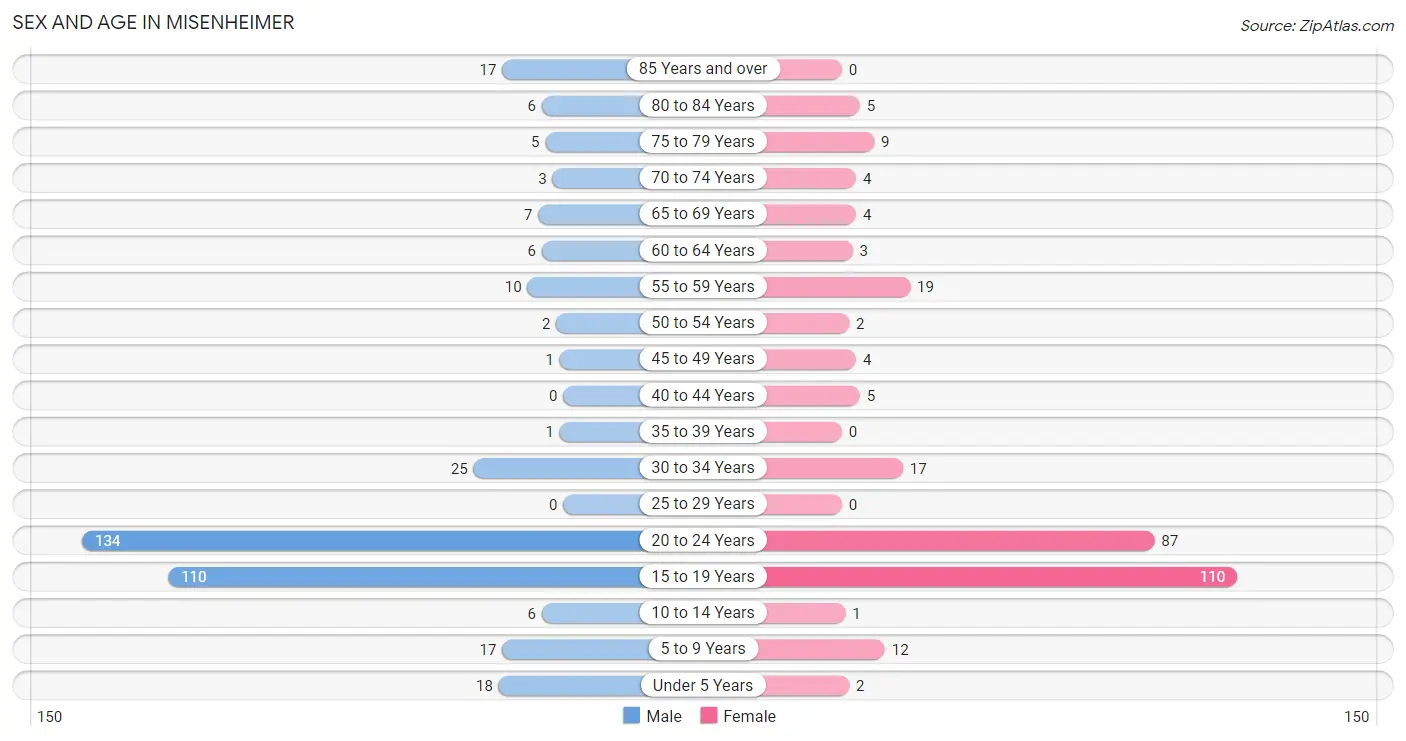
| Age Bracket | Male | Female |
| Under 5 Years | 18 (4.9%) | 2 (0.7%) |
| 5 to 9 Years | 17 (4.6%) | 12 (4.2%) |
| 10 to 14 Years | 6 (1.6%) | 1 (0.4%) |
| 15 to 19 Years | 110 (29.9%) | 110 (38.7%) |
| 20 to 24 Years | 134 (36.4%) | 87 (30.6%) |
| 25 to 29 Years | 0 (0.0%) | 0 (0.0%) |
| 30 to 34 Years | 25 (6.8%) | 17 (6.0%) |
| 35 to 39 Years | 1 (0.3%) | 0 (0.0%) |
| 40 to 44 Years | 0 (0.0%) | 5 (1.8%) |
| 45 to 49 Years | 1 (0.3%) | 4 (1.4%) |
| 50 to 54 Years | 2 (0.5%) | 2 (0.7%) |
| 55 to 59 Years | 10 (2.7%) | 19 (6.7%) |
| 60 to 64 Years | 6 (1.6%) | 3 (1.1%) |
| 65 to 69 Years | 7 (1.9%) | 4 (1.4%) |
| 70 to 74 Years | 3 (0.8%) | 4 (1.4%) |
| 75 to 79 Years | 5 (1.4%) | 9 (3.2%) |
| 80 to 84 Years | 6 (1.6%) | 5 (1.8%) |
| 85 Years and over | 17 (4.6%) | 0 (0.0%) |
| Total | 368 (100.0%) | 284 (100.0%) |
Families and Households in Misenheimer
Median Family Size in Misenheimer
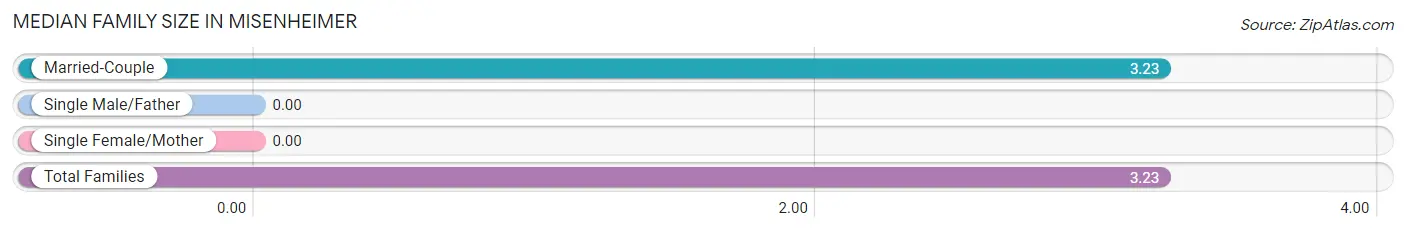
| Family Type | # Families | Family Size |
| Married-Couple | 48 (100.0%) | 3.23 |
| Single Male/Father | 0 (0.0%) | - |
| Single Female/Mother | 0 (0.0%) | - |
| Total Families | 48 (100.0%) | 3.23 |
Median Household Size in Misenheimer
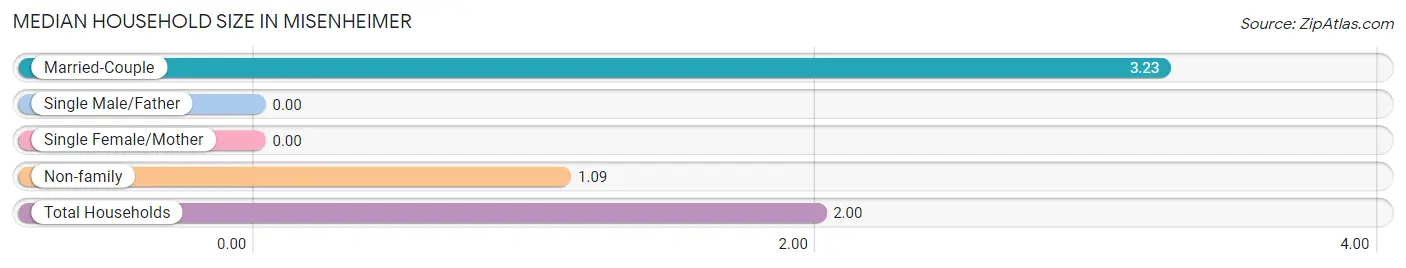
| Household Type | # Households | Household Size |
| Married-Couple | 48 (42.5%) | 3.23 |
| Single Male/Father | 0 (0.0%) | - |
| Single Female/Mother | 0 (0.0%) | - |
| Non-family | 65 (57.5%) | 1.09 |
| Total Households | 113 (100.0%) | 2.00 |
Household Size by Marriage Status in Misenheimer
Out of a total of 113 households in Misenheimer, 48 (42.5%) are family households, while 65 (57.5%) are nonfamily households. The most numerous type of family households are 2-person households, comprising 22, and the most common type of nonfamily households are 1-person households, comprising 58.
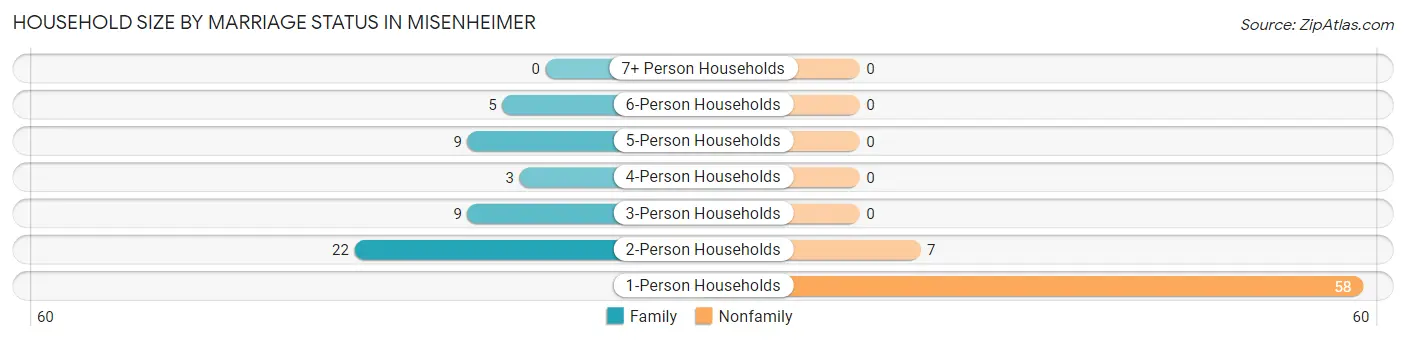
| Household Size | Family Households | Nonfamily Households |
| 1-Person Households | - | 58 (51.3%) |
| 2-Person Households | 22 (19.5%) | 7 (6.2%) |
| 3-Person Households | 9 (8.0%) | 0 (0.0%) |
| 4-Person Households | 3 (2.6%) | 0 (0.0%) |
| 5-Person Households | 9 (8.0%) | 0 (0.0%) |
| 6-Person Households | 5 (4.4%) | 0 (0.0%) |
| 7+ Person Households | 0 (0.0%) | 0 (0.0%) |
| Total | 48 (42.5%) | 65 (57.5%) |
Female Fertility in Misenheimer
Fertility by Age in Misenheimer
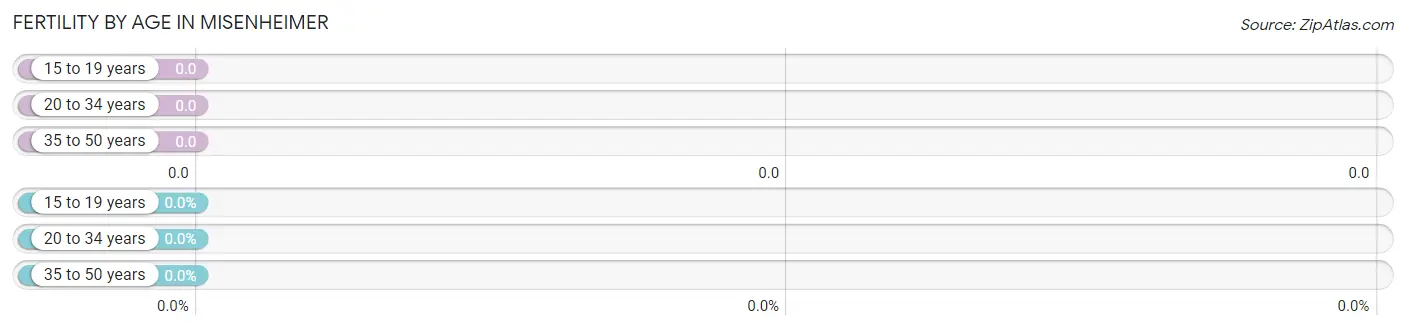
| Age Bracket | Women with Births | Births / 1,000 Women |
| 15 to 19 years | 0 (0.0%) | 0.0 |
| 20 to 34 years | 0 (0.0%) | 0.0 |
| 35 to 50 years | 0 (0.0%) | 0.0 |
| Total | 0 (0.0%) | 0.0 |
Fertility by Age by Marriage Status in Misenheimer
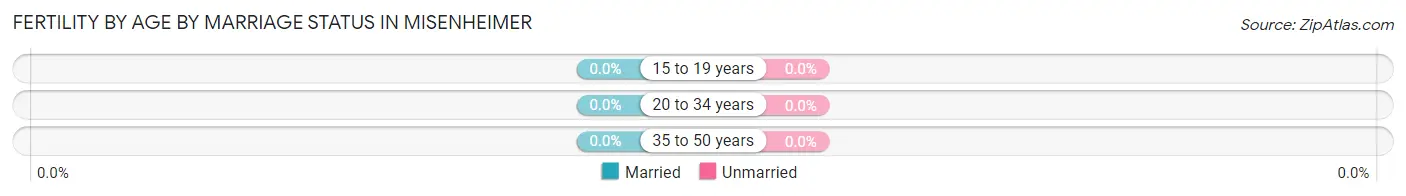
| Age Bracket | Married | Unmarried |
| 15 to 19 years | 0 (0.0%) | 0 (0.0%) |
| 20 to 34 years | 0 (0.0%) | 0 (0.0%) |
| 35 to 50 years | 0 (0.0%) | 0 (0.0%) |
| Total | 0 (0.0%) | 0 (0.0%) |
Fertility by Education in Misenheimer
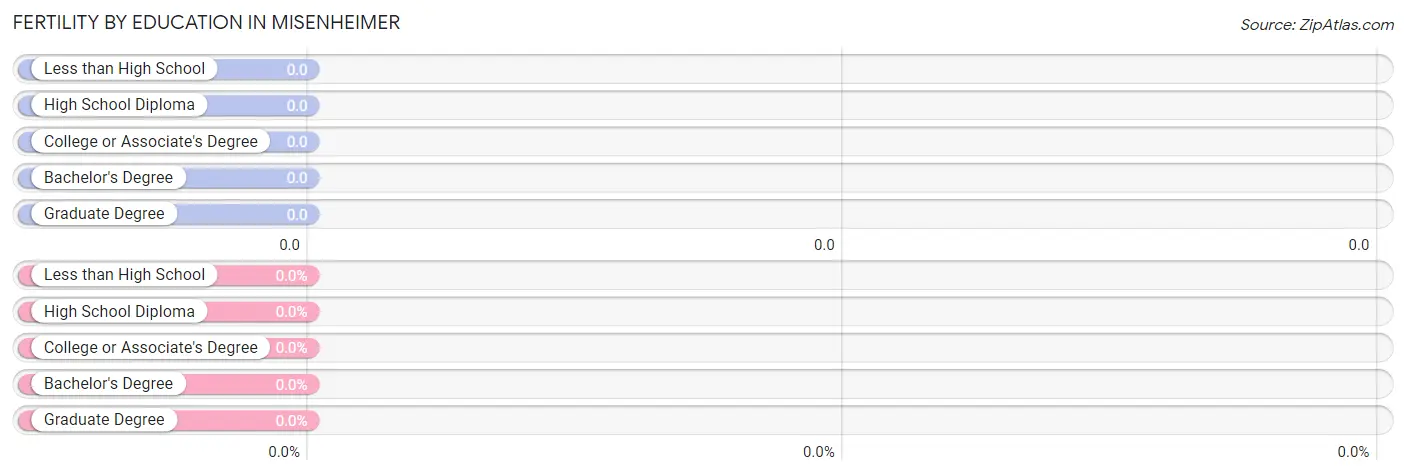
| Educational Attainment | Women with Births | Births / 1,000 Women |
| Less than High School | 0 (0.0%) | 0.0 |
| High School Diploma | 0 (0.0%) | 0.0 |
| College or Associate's Degree | 0 (0.0%) | 0.0 |
| Bachelor's Degree | 0 (0.0%) | 0.0 |
| Graduate Degree | 0 (0.0%) | 0.0 |
| Total | 0 (0.0%) | 0.0 |
Fertility by Education by Marriage Status in Misenheimer
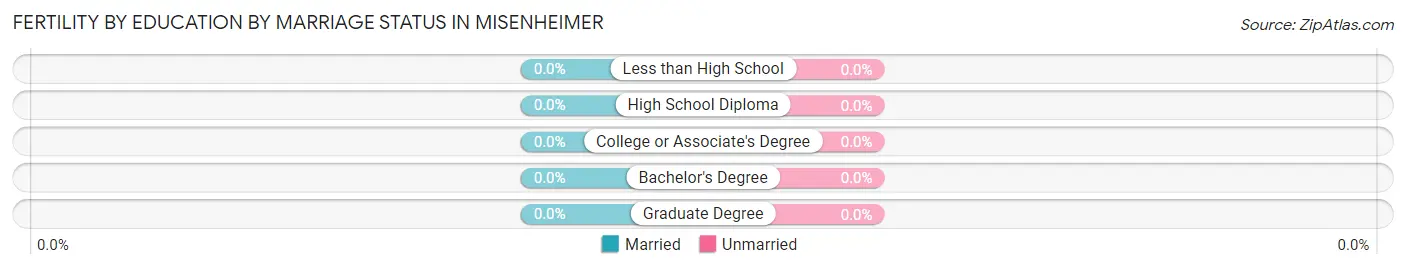
| Educational Attainment | Married | Unmarried |
| Less than High School | 0 (0.0%) | 0 (0.0%) |
| High School Diploma | 0 (0.0%) | 0 (0.0%) |
| College or Associate's Degree | 0 (0.0%) | 0 (0.0%) |
| Bachelor's Degree | 0 (0.0%) | 0 (0.0%) |
| Graduate Degree | 0 (0.0%) | 0 (0.0%) |
| Total | 0 (0.0%) | 0 (0.0%) |
Employment Characteristics in Misenheimer
Employment by Class of Employer in Misenheimer
Among the 248 employed individuals in Misenheimer, private company employees (194 | 78.2%), not-for-profit organizations (23 | 9.3%), and state government employees (13 | 5.2%) make up the most common classes of employment.
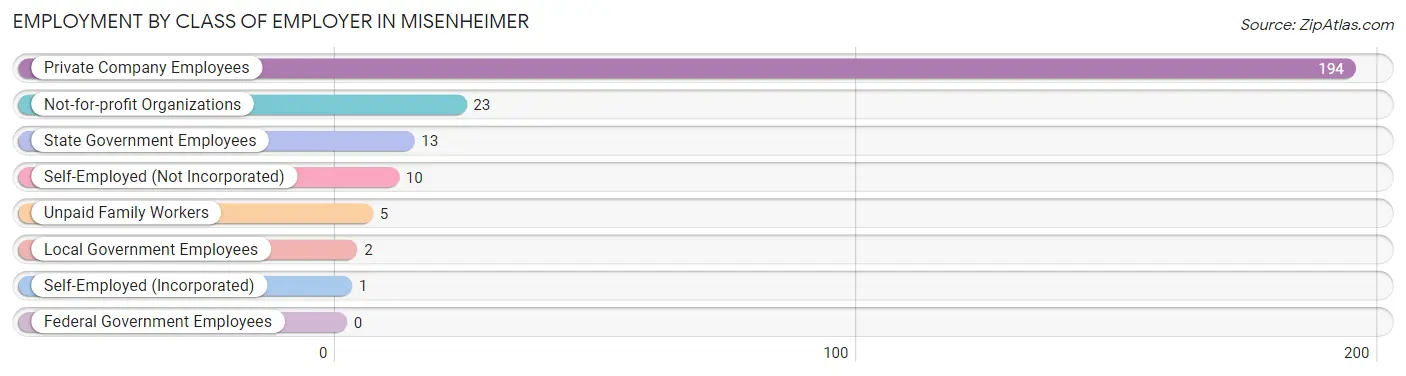
| Employer Class | # Employees | % Employees |
| Private Company Employees | 194 | 78.2% |
| Self-Employed (Incorporated) | 1 | 0.4% |
| Self-Employed (Not Incorporated) | 10 | 4.0% |
| Not-for-profit Organizations | 23 | 9.3% |
| Local Government Employees | 2 | 0.8% |
| State Government Employees | 13 | 5.2% |
| Federal Government Employees | 0 | 0.0% |
| Unpaid Family Workers | 5 | 2.0% |
| Total | 248 | 100.0% |
Employment Status by Age in Misenheimer
According to the labor force statistics for Misenheimer, out of the total population over 16 years of age (596), 48.8% or 291 individuals are in the labor force, with 13.4% or 39 of them unemployed. The age group with the highest labor force participation rate is 30 to 34 years, with 100.0% or 42 individuals in the labor force. Within the labor force, the 16 to 19 years age range has the highest percentage of unemployed individuals, with 55.3% or 26 of them being unemployed.
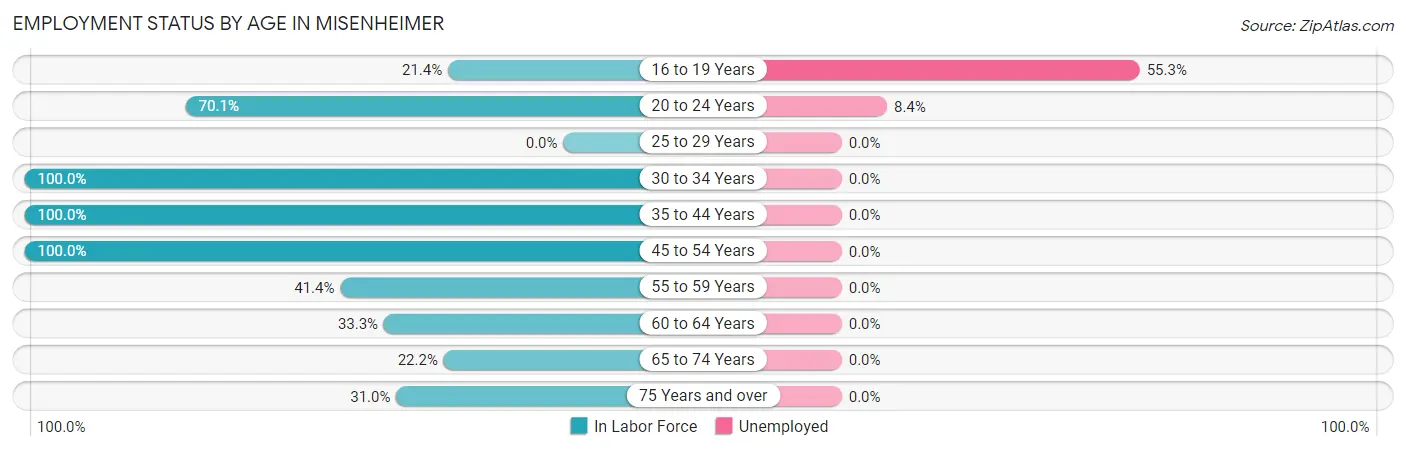
| Age Bracket | In Labor Force | Unemployed |
| 16 to 19 Years | 47 (21.4%) | 26 (55.3%) |
| 20 to 24 Years | 155 (70.1%) | 13 (8.4%) |
| 25 to 29 Years | 0 (0.0%) | 0 (0.0%) |
| 30 to 34 Years | 42 (100.0%) | 0 (0.0%) |
| 35 to 44 Years | 6 (100.0%) | 0 (0.0%) |
| 45 to 54 Years | 9 (100.0%) | 0 (0.0%) |
| 55 to 59 Years | 12 (41.4%) | 0 (0.0%) |
| 60 to 64 Years | 3 (33.3%) | 0 (0.0%) |
| 65 to 74 Years | 4 (22.2%) | 0 (0.0%) |
| 75 Years and over | 13 (31.0%) | 0 (0.0%) |
| Total | 291 (48.8%) | 39 (13.4%) |
Employment Status by Educational Attainment in Misenheimer
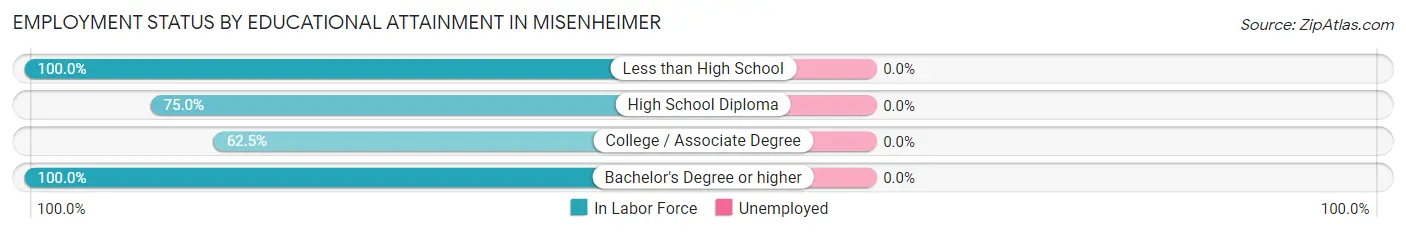
| Educational Attainment | In Labor Force | Unemployed |
| Less than High School | 9 (100.0%) | 0 (0.0%) |
| High School Diploma | 15 (75.0%) | 0 (0.0%) |
| College / Associate Degree | 30 (62.5%) | 0 (0.0%) |
| Bachelor's Degree or higher | 18 (100.0%) | 0 (0.0%) |
| Total | 72 (75.8%) | 0 (0.0%) |
Employment Occupations by Sex in Misenheimer
Management, Business, Science and Arts Occupations
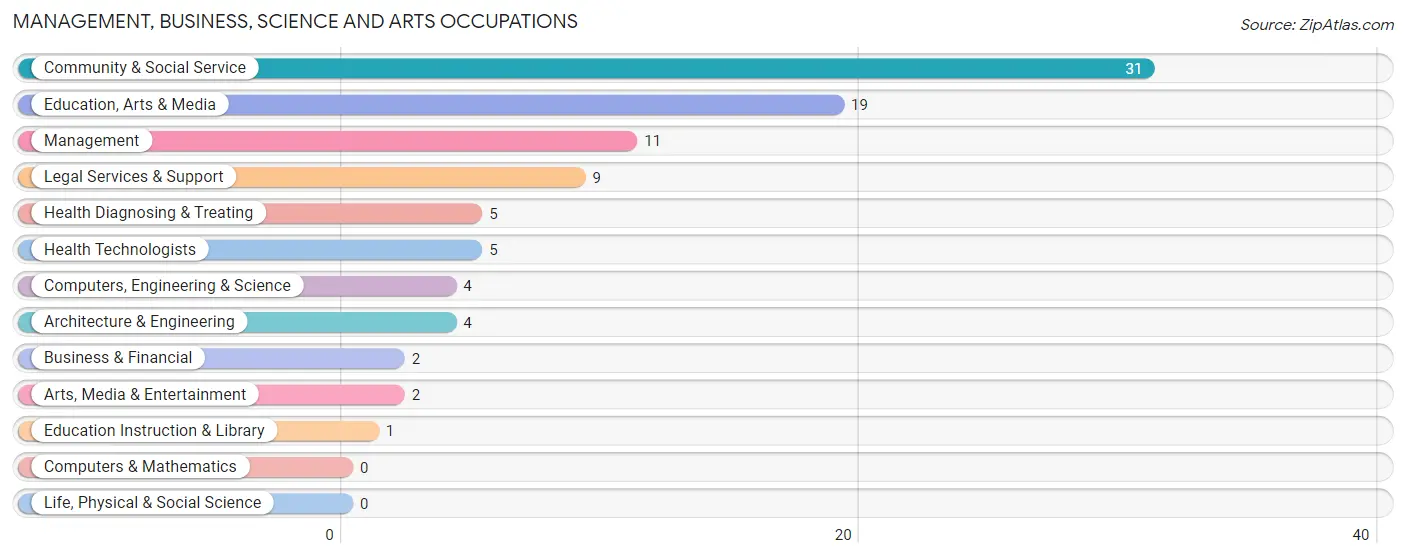
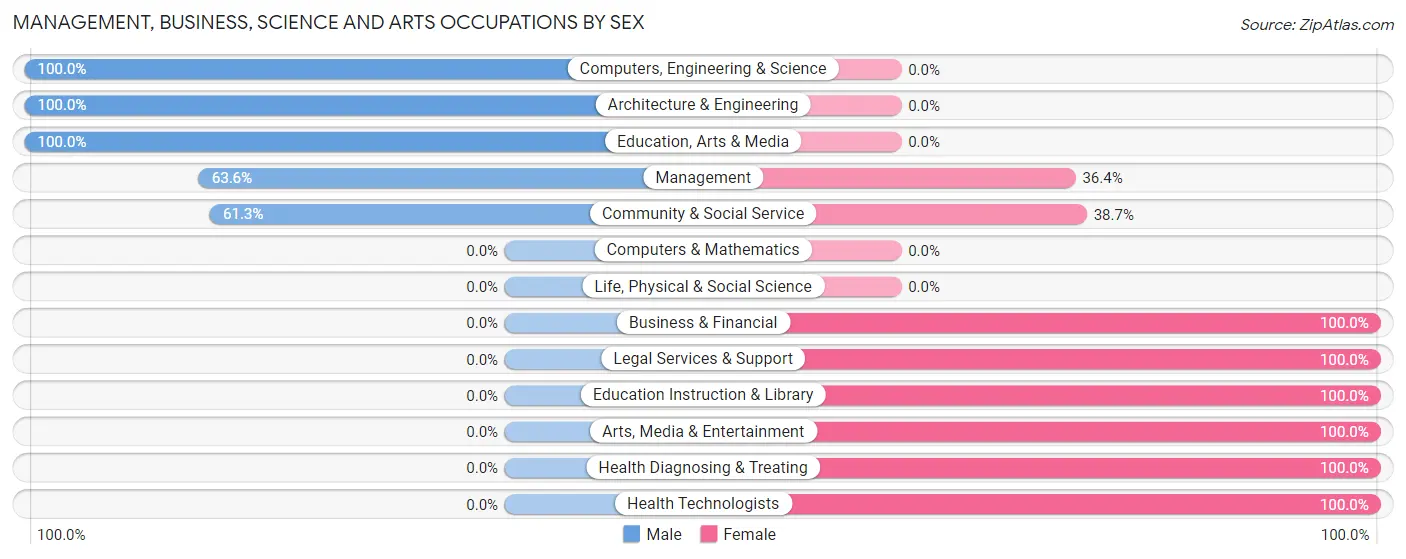
The most common Management, Business, Science and Arts occupations in Misenheimer are Community & Social Service (31 | 12.3%), Education, Arts & Media (19 | 7.5%), Management (11 | 4.4%), Legal Services & Support (9 | 3.6%), and Health Diagnosing & Treating (5 | 2.0%).
Management, Business, Science and Arts Occupations by Sex
Within the Management, Business, Science and Arts occupations in Misenheimer, the most male-oriented occupations are Computers, Engineering & Science (100.0%), Architecture & Engineering (100.0%), and Education, Arts & Media (100.0%), while the most female-oriented occupations are Business & Financial (100.0%), Legal Services & Support (100.0%), and Education Instruction & Library (100.0%).
| Occupation | Male | Female |
| Management | 7 (63.6%) | 4 (36.4%) |
| Business & Financial | 0 (0.0%) | 2 (100.0%) |
| Computers, Engineering & Science | 4 (100.0%) | 0 (0.0%) |
| Computers & Mathematics | 0 (0.0%) | 0 (0.0%) |
| Architecture & Engineering | 4 (100.0%) | 0 (0.0%) |
| Life, Physical & Social Science | 0 (0.0%) | 0 (0.0%) |
| Community & Social Service | 19 (61.3%) | 12 (38.7%) |
| Education, Arts & Media | 19 (100.0%) | 0 (0.0%) |
| Legal Services & Support | 0 (0.0%) | 9 (100.0%) |
| Education Instruction & Library | 0 (0.0%) | 1 (100.0%) |
| Arts, Media & Entertainment | 0 (0.0%) | 2 (100.0%) |
| Health Diagnosing & Treating | 0 (0.0%) | 5 (100.0%) |
| Health Technologists | 0 (0.0%) | 5 (100.0%) |
| Total (Category) | 30 (56.6%) | 23 (43.4%) |
| Total (Overall) | 133 (52.8%) | 119 (47.2%) |
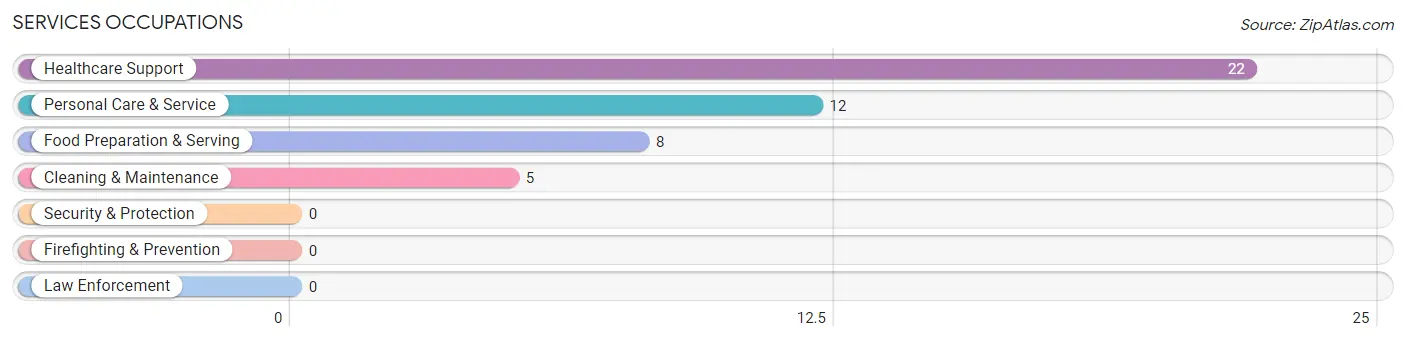
Services Occupations
The most common Services occupations in Misenheimer are Healthcare Support (22 | 8.7%), Personal Care & Service (12 | 4.8%), Food Preparation & Serving (8 | 3.2%), and Cleaning & Maintenance (5 | 2.0%).
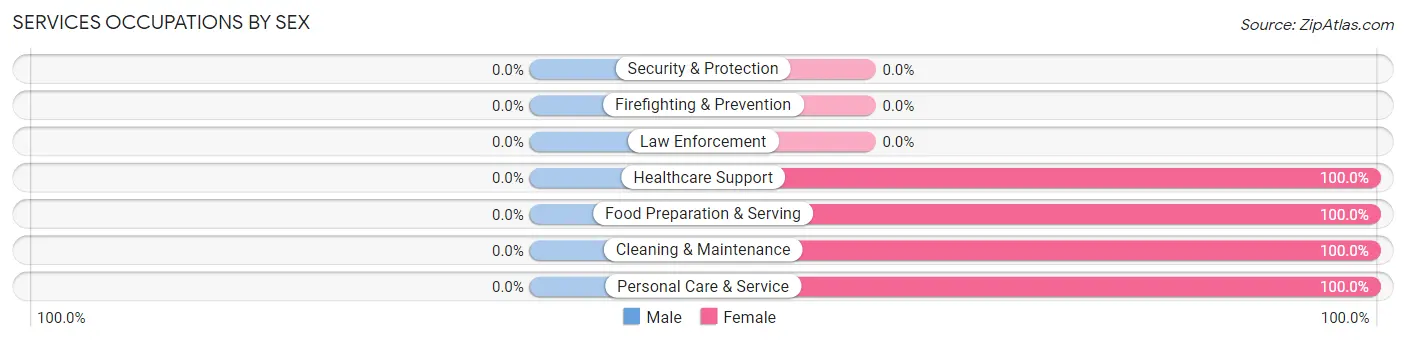
Services Occupations by Sex
| Occupation | Male | Female |
| Healthcare Support | 0 (0.0%) | 22 (100.0%) |
| Security & Protection | 0 (0.0%) | 0 (0.0%) |
| Firefighting & Prevention | 0 (0.0%) | 0 (0.0%) |
| Law Enforcement | 0 (0.0%) | 0 (0.0%) |
| Food Preparation & Serving | 0 (0.0%) | 8 (100.0%) |
| Cleaning & Maintenance | 0 (0.0%) | 5 (100.0%) |
| Personal Care & Service | 0 (0.0%) | 12 (100.0%) |
| Total (Category) | 0 (0.0%) | 47 (100.0%) |
| Total (Overall) | 133 (52.8%) | 119 (47.2%) |
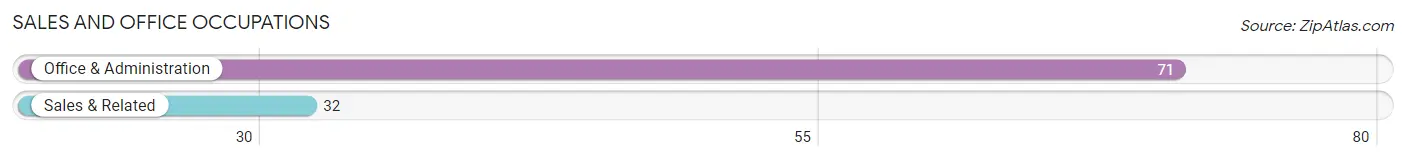
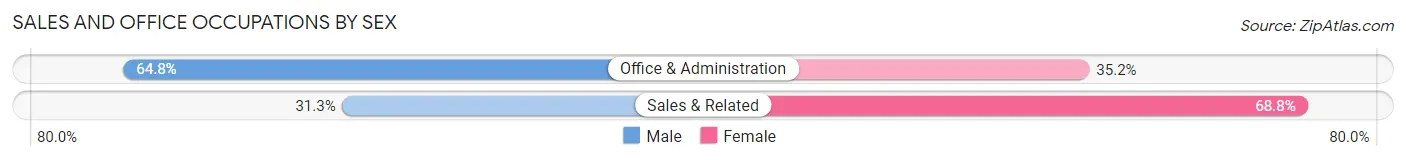
Sales and Office Occupations
The most common Sales and Office occupations in Misenheimer are Office & Administration (71 | 28.2%), and Sales & Related (32 | 12.7%).
Sales and Office Occupations by Sex
| Occupation | Male | Female |
| Sales & Related | 10 (31.2%) | 22 (68.8%) |
| Office & Administration | 46 (64.8%) | 25 (35.2%) |
| Total (Category) | 56 (54.4%) | 47 (45.6%) |
| Total (Overall) | 133 (52.8%) | 119 (47.2%) |
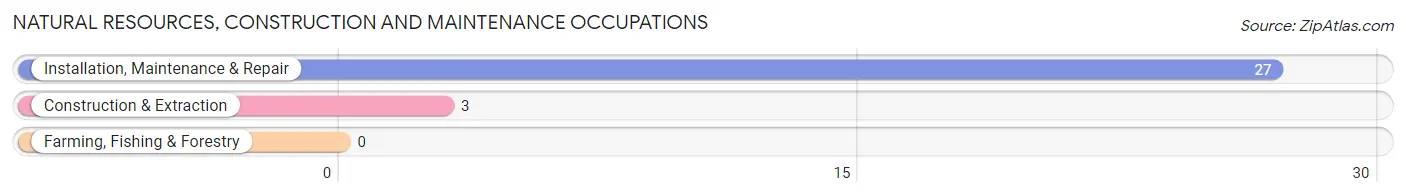
Natural Resources, Construction and Maintenance Occupations
The most common Natural Resources, Construction and Maintenance occupations in Misenheimer are Installation, Maintenance & Repair (27 | 10.7%), and Construction & Extraction (3 | 1.2%).
Natural Resources, Construction and Maintenance Occupations by Sex

| Occupation | Male | Female |
| Farming, Fishing & Forestry | 0 (0.0%) | 0 (0.0%) |
| Construction & Extraction | 3 (100.0%) | 0 (0.0%) |
| Installation, Maintenance & Repair | 27 (100.0%) | 0 (0.0%) |
| Total (Category) | 30 (100.0%) | 0 (0.0%) |
| Total (Overall) | 133 (52.8%) | 119 (47.2%) |
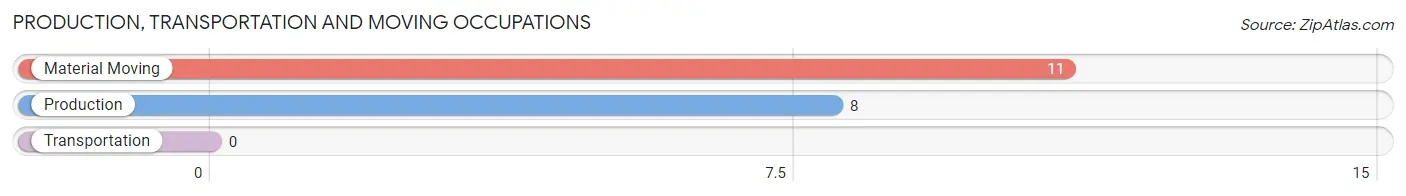
Production, Transportation and Moving Occupations
The most common Production, Transportation and Moving occupations in Misenheimer are Material Moving (11 | 4.4%), and Production (8 | 3.2%).
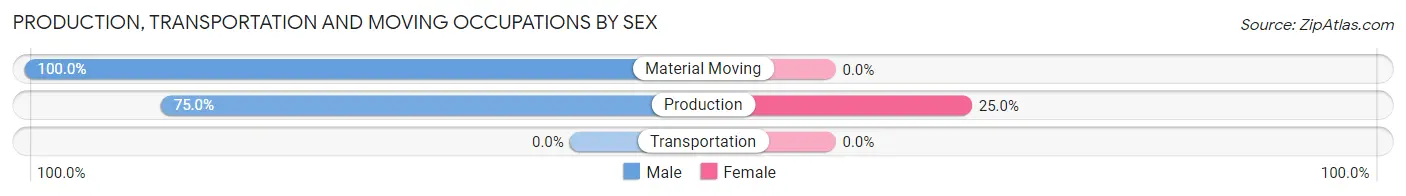
Production, Transportation and Moving Occupations by Sex
| Occupation | Male | Female |
| Production | 6 (75.0%) | 2 (25.0%) |
| Transportation | 0 (0.0%) | 0 (0.0%) |
| Material Moving | 11 (100.0%) | 0 (0.0%) |
| Total (Category) | 17 (89.5%) | 2 (10.5%) |
| Total (Overall) | 133 (52.8%) | 119 (47.2%) |
Employment Industries by Sex in Misenheimer
Employment Industries in Misenheimer
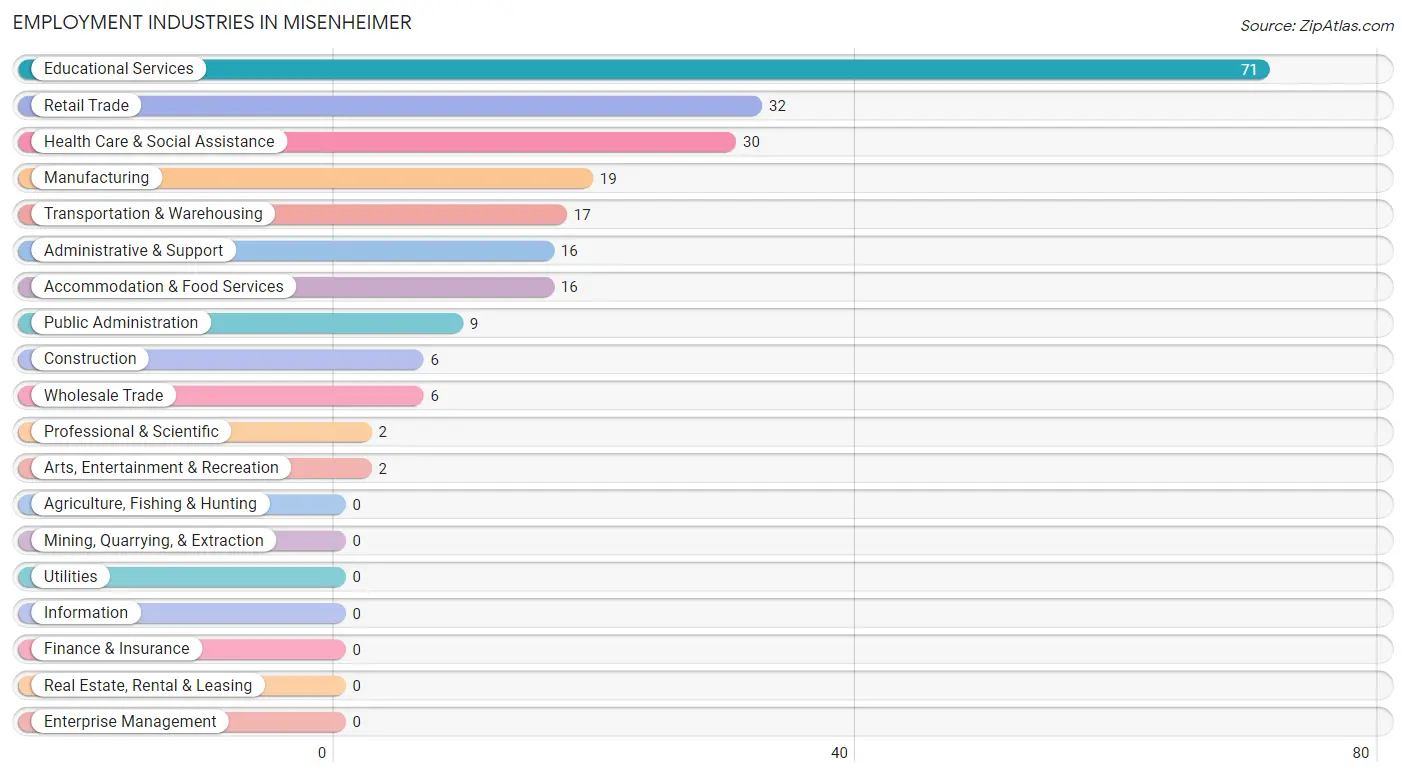
The major employment industries in Misenheimer include Educational Services (71 | 28.2%), Retail Trade (32 | 12.7%), Health Care & Social Assistance (30 | 11.9%), Manufacturing (19 | 7.5%), and Transportation & Warehousing (17 | 6.8%).
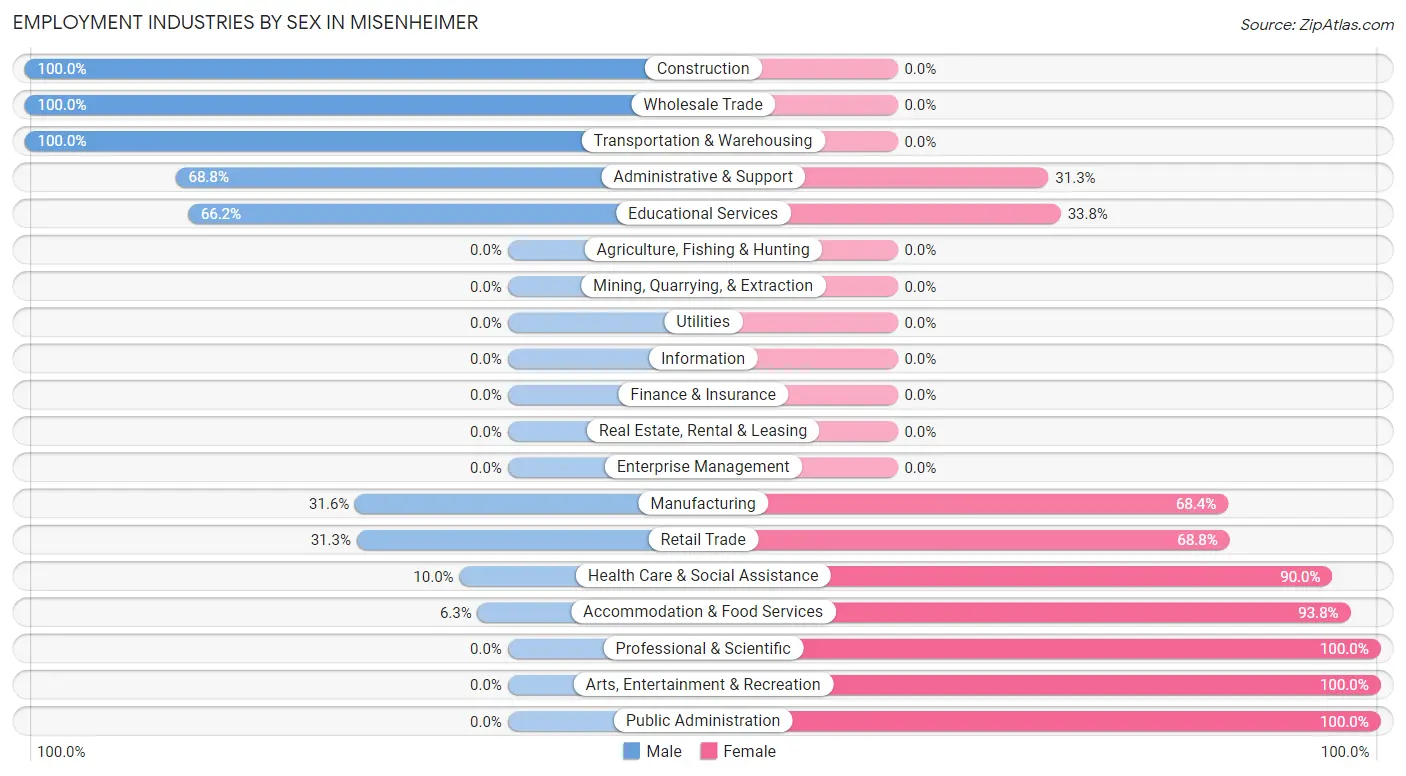
Employment Industries by Sex in Misenheimer
The Misenheimer industries that see more men than women are Construction (100.0%), Wholesale Trade (100.0%), and Transportation & Warehousing (100.0%), whereas the industries that tend to have a higher number of women are Professional & Scientific (100.0%), Arts, Entertainment & Recreation (100.0%), and Public Administration (100.0%).
| Industry | Male | Female |
| Agriculture, Fishing & Hunting | 0 (0.0%) | 0 (0.0%) |
| Mining, Quarrying, & Extraction | 0 (0.0%) | 0 (0.0%) |
| Construction | 6 (100.0%) | 0 (0.0%) |
| Manufacturing | 6 (31.6%) | 13 (68.4%) |
| Wholesale Trade | 6 (100.0%) | 0 (0.0%) |
| Retail Trade | 10 (31.2%) | 22 (68.8%) |
| Transportation & Warehousing | 17 (100.0%) | 0 (0.0%) |
| Utilities | 0 (0.0%) | 0 (0.0%) |
| Information | 0 (0.0%) | 0 (0.0%) |
| Finance & Insurance | 0 (0.0%) | 0 (0.0%) |
| Real Estate, Rental & Leasing | 0 (0.0%) | 0 (0.0%) |
| Professional & Scientific | 0 (0.0%) | 2 (100.0%) |
| Enterprise Management | 0 (0.0%) | 0 (0.0%) |
| Administrative & Support | 11 (68.8%) | 5 (31.2%) |
| Educational Services | 47 (66.2%) | 24 (33.8%) |
| Health Care & Social Assistance | 3 (10.0%) | 27 (90.0%) |
| Arts, Entertainment & Recreation | 0 (0.0%) | 2 (100.0%) |
| Accommodation & Food Services | 1 (6.2%) | 15 (93.8%) |
| Public Administration | 0 (0.0%) | 9 (100.0%) |
| Total | 133 (52.8%) | 119 (47.2%) |
Education in Misenheimer
School Enrollment in Misenheimer
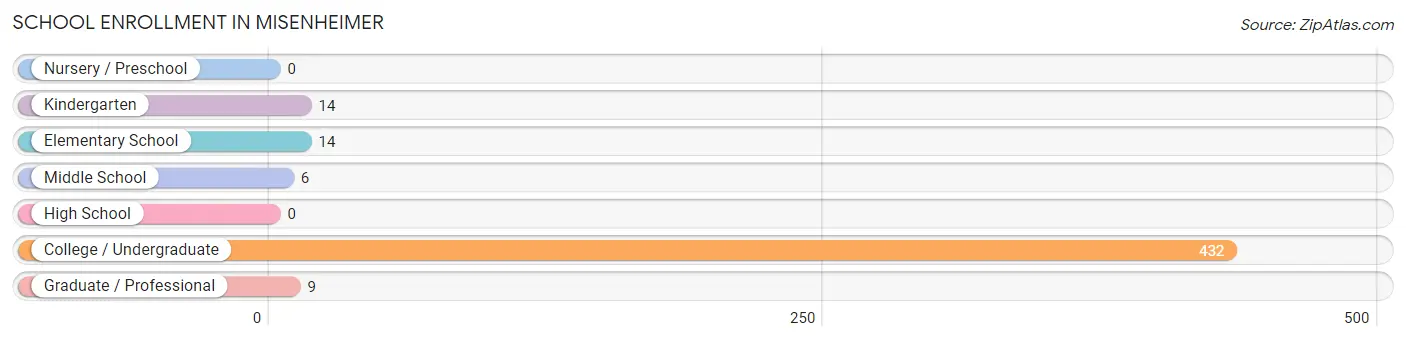
The most common levels of schooling among the 475 students in Misenheimer are college / undergraduate (432 | 90.9%), kindergarten (14 | 2.9%), and elementary school (14 | 2.9%).
| School Level | # Students | % Students |
| Nursery / Preschool | 0 | 0.0% |
| Kindergarten | 14 | 2.9% |
| Elementary School | 14 | 2.9% |
| Middle School | 6 | 1.3% |
| High School | 0 | 0.0% |
| College / Undergraduate | 432 | 90.9% |
| Graduate / Professional | 9 | 1.9% |
| Total | 475 | 100.0% |
School Enrollment by Age by Funding Source in Misenheimer
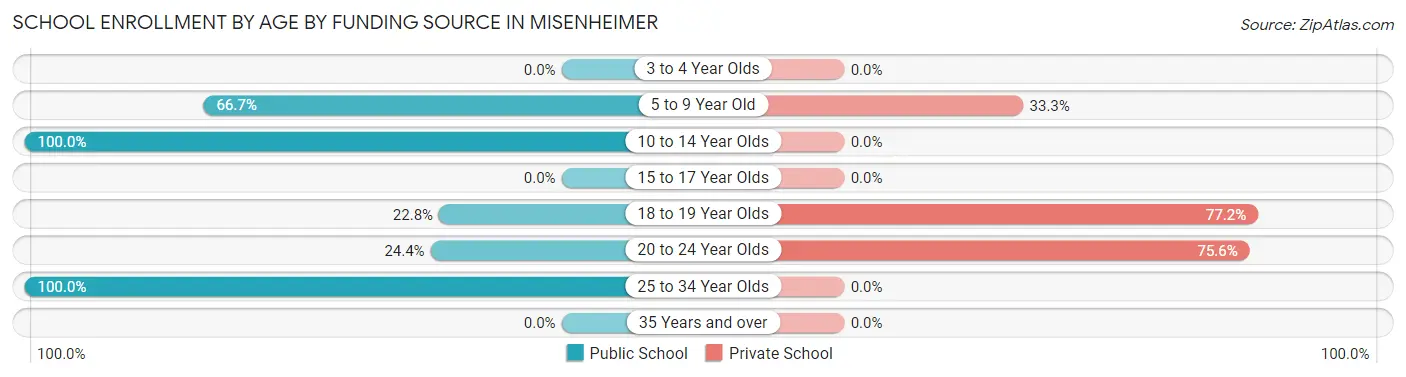
Out of a total of 475 students who are enrolled in schools in Misenheimer, 339 (71.4%) attend a private institution, while the remaining 136 (28.6%) are enrolled in public schools. The age group of 18 to 19 year olds has the highest likelihood of being enrolled in private schools, with 169 (77.2% in the age bracket) enrolled. Conversely, the age group of 10 to 14 year olds has the lowest likelihood of being enrolled in a private school, with 7 (100.0% in the age bracket) attending a public institution.
| Age Bracket | Public School | Private School |
| 3 to 4 Year Olds | 0 (0.0%) | 0 (0.0%) |
| 5 to 9 Year Old | 18 (66.7%) | 9 (33.3%) |
| 10 to 14 Year Olds | 7 (100.0%) | 0 (0.0%) |
| 15 to 17 Year Olds | 0 (0.0%) | 0 (0.0%) |
| 18 to 19 Year Olds | 50 (22.8%) | 169 (77.2%) |
| 20 to 24 Year Olds | 52 (24.4%) | 161 (75.6%) |
| 25 to 34 Year Olds | 9 (100.0%) | 0 (0.0%) |
| 35 Years and over | 0 (0.0%) | 0 (0.0%) |
| Total | 136 (28.6%) | 339 (71.4%) |
Educational Attainment by Field of Study in Misenheimer
Physical & health sciences (10 | 23.3%), science & technology (10 | 23.3%), bio, nature & agricultural (5 | 11.6%), business (5 | 11.6%), and education (5 | 11.6%) are the most common fields of study among 43 individuals in Misenheimer who have obtained a bachelor's degree or higher.
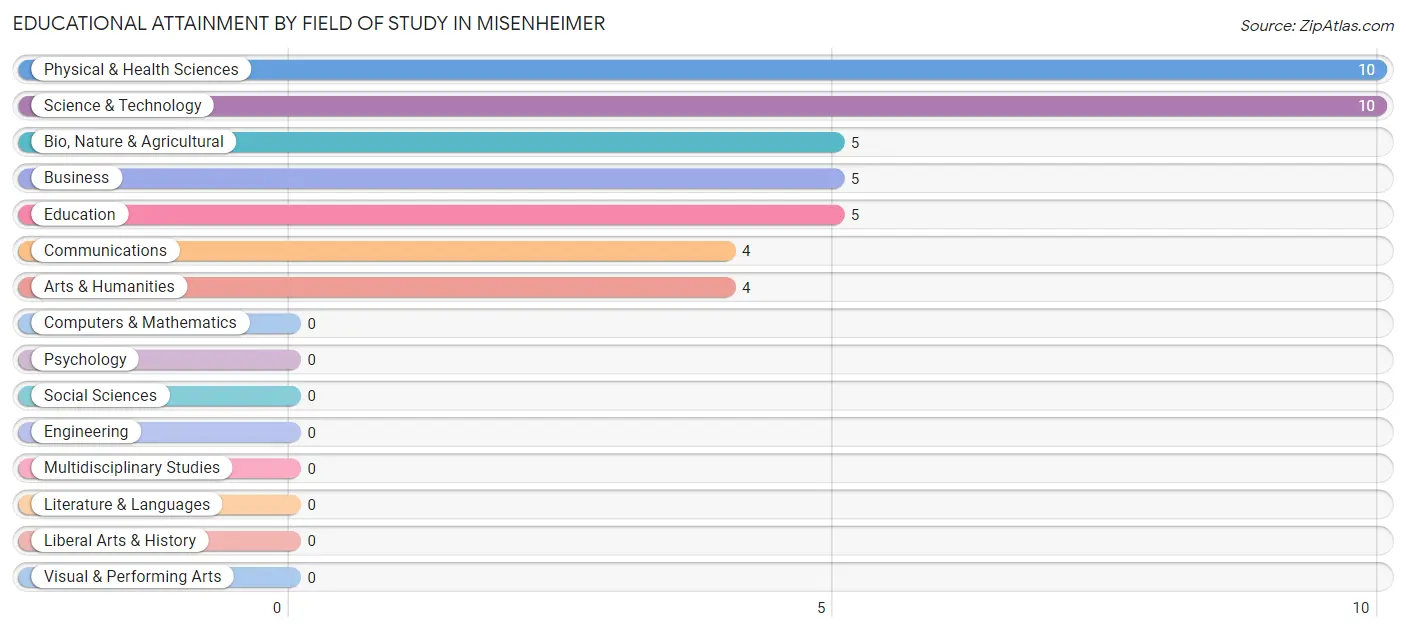
| Field of Study | # Graduates | % Graduates |
| Computers & Mathematics | 0 | 0.0% |
| Bio, Nature & Agricultural | 5 | 11.6% |
| Physical & Health Sciences | 10 | 23.3% |
| Psychology | 0 | 0.0% |
| Social Sciences | 0 | 0.0% |
| Engineering | 0 | 0.0% |
| Multidisciplinary Studies | 0 | 0.0% |
| Science & Technology | 10 | 23.3% |
| Business | 5 | 11.6% |
| Education | 5 | 11.6% |
| Literature & Languages | 0 | 0.0% |
| Liberal Arts & History | 0 | 0.0% |
| Visual & Performing Arts | 0 | 0.0% |
| Communications | 4 | 9.3% |
| Arts & Humanities | 4 | 9.3% |
| Total | 43 | 100.0% |
Transportation & Commute in Misenheimer
Vehicle Availability by Sex in Misenheimer
The most prevalent vehicle ownership categories in Misenheimer are males with 1 vehicle (29, accounting for 54.7%) and females with 1 vehicle (14, making up 61.7%).
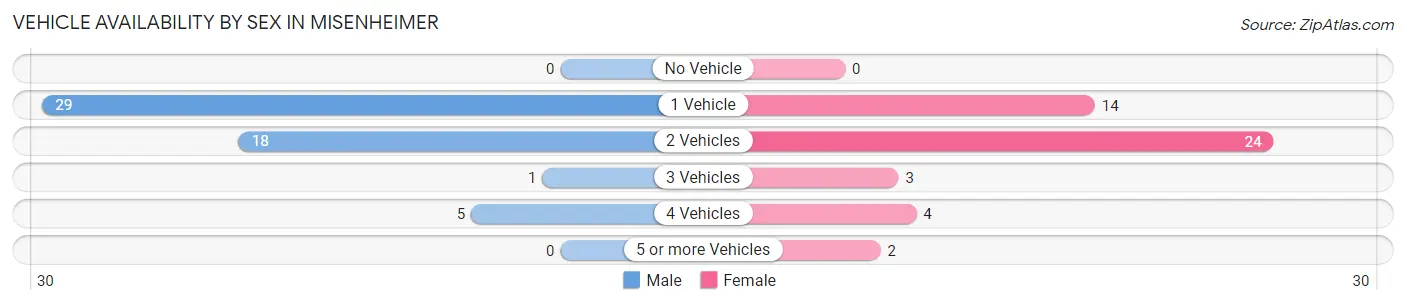
| Vehicles Available | Male | Female |
| No Vehicle | 0 (0.0%) | 0 (0.0%) |
| 1 Vehicle | 29 (54.7%) | 14 (29.8%) |
| 2 Vehicles | 18 (34.0%) | 24 (51.1%) |
| 3 Vehicles | 1 (1.9%) | 3 (6.4%) |
| 4 Vehicles | 5 (9.4%) | 4 (8.5%) |
| 5 or more Vehicles | 0 (0.0%) | 2 (4.3%) |
| Total | 53 (100.0%) | 47 (100.0%) |
Commute Time in Misenheimer
The most frequently occuring commute durations in Misenheimer are 5 to 9 minutes (72 commuters, 30.1%), less than 5 minutes (43 commuters, 18.0%), and 10 to 14 minutes (34 commuters, 14.2%).
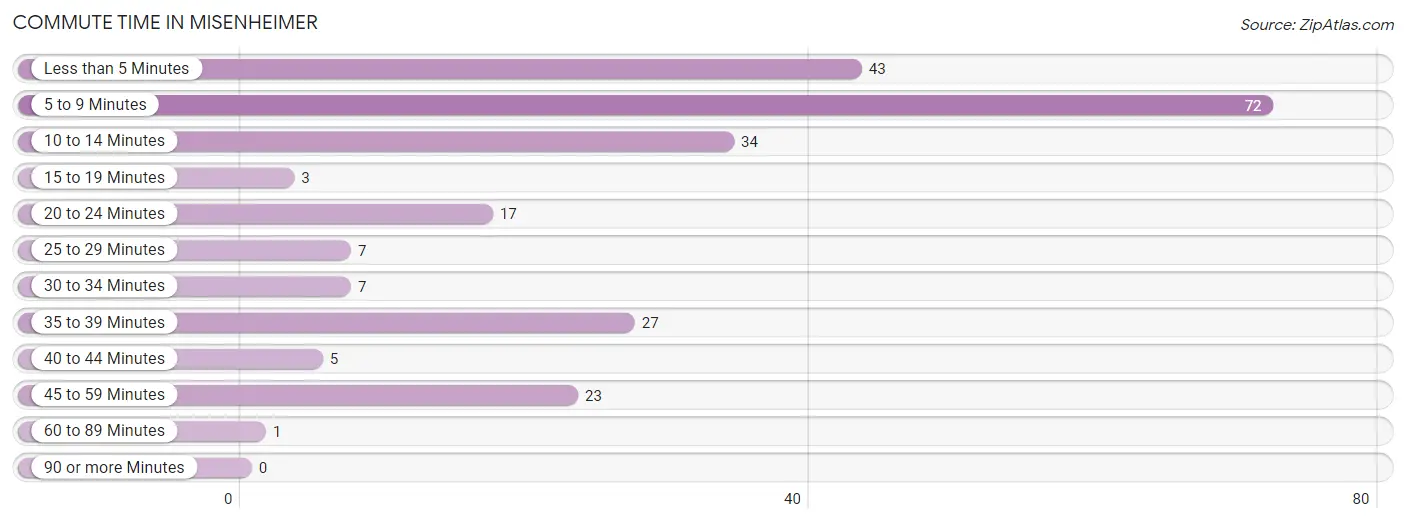
| Commute Time | # Commuters | % Commuters |
| Less than 5 Minutes | 43 | 18.0% |
| 5 to 9 Minutes | 72 | 30.1% |
| 10 to 14 Minutes | 34 | 14.2% |
| 15 to 19 Minutes | 3 | 1.3% |
| 20 to 24 Minutes | 17 | 7.1% |
| 25 to 29 Minutes | 7 | 2.9% |
| 30 to 34 Minutes | 7 | 2.9% |
| 35 to 39 Minutes | 27 | 11.3% |
| 40 to 44 Minutes | 5 | 2.1% |
| 45 to 59 Minutes | 23 | 9.6% |
| 60 to 89 Minutes | 1 | 0.4% |
| 90 or more Minutes | 0 | 0.0% |
Commute Time by Sex in Misenheimer
The most common commute times in Misenheimer are 5 to 9 minutes (44 commuters, 34.4%) for males and 5 to 9 minutes (28 commuters, 25.2%) for females.
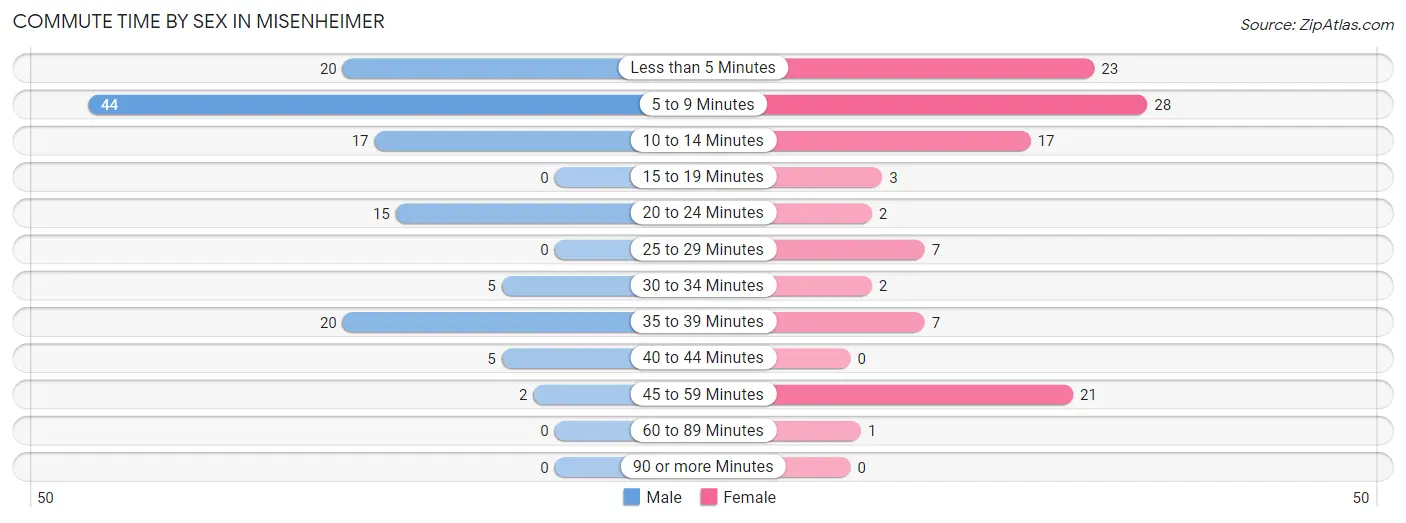
| Commute Time | Male | Female |
| Less than 5 Minutes | 20 (15.6%) | 23 (20.7%) |
| 5 to 9 Minutes | 44 (34.4%) | 28 (25.2%) |
| 10 to 14 Minutes | 17 (13.3%) | 17 (15.3%) |
| 15 to 19 Minutes | 0 (0.0%) | 3 (2.7%) |
| 20 to 24 Minutes | 15 (11.7%) | 2 (1.8%) |
| 25 to 29 Minutes | 0 (0.0%) | 7 (6.3%) |
| 30 to 34 Minutes | 5 (3.9%) | 2 (1.8%) |
| 35 to 39 Minutes | 20 (15.6%) | 7 (6.3%) |
| 40 to 44 Minutes | 5 (3.9%) | 0 (0.0%) |
| 45 to 59 Minutes | 2 (1.6%) | 21 (18.9%) |
| 60 to 89 Minutes | 0 (0.0%) | 1 (0.9%) |
| 90 or more Minutes | 0 (0.0%) | 0 (0.0%) |
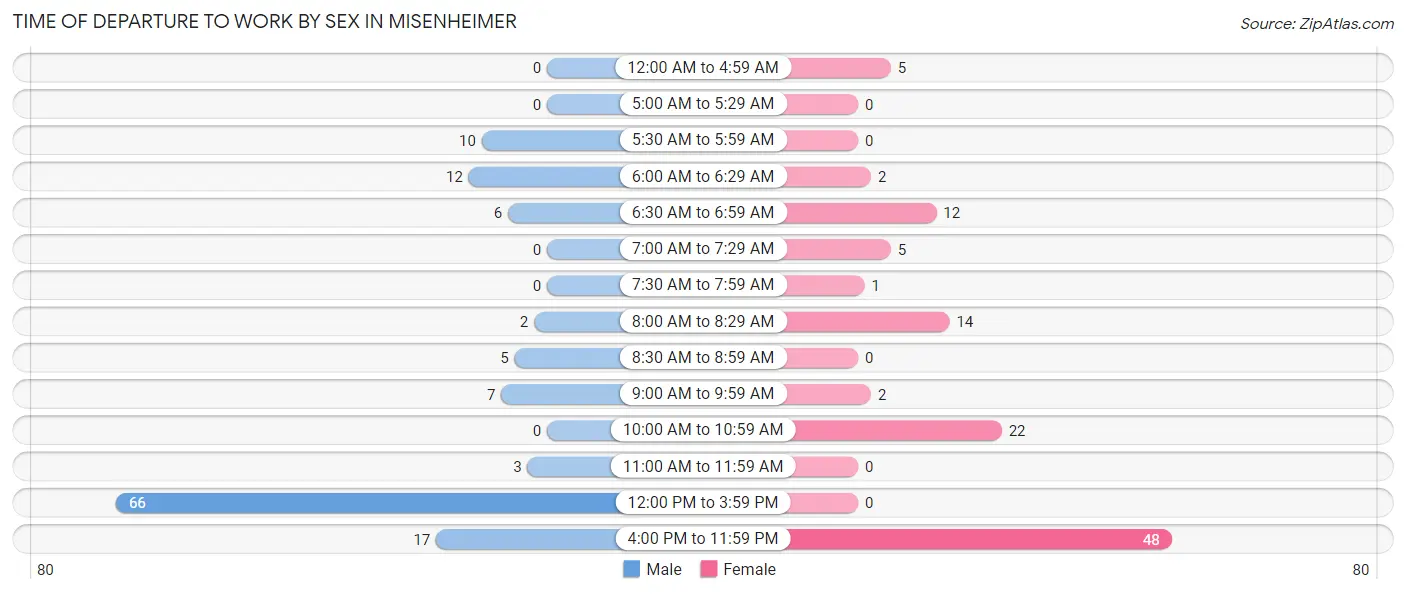
Time of Departure to Work by Sex in Misenheimer
The most frequent times of departure to work in Misenheimer are 12:00 PM to 3:59 PM (66, 51.6%) for males and 4:00 PM to 11:59 PM (48, 43.2%) for females.
| Time of Departure | Male | Female |
| 12:00 AM to 4:59 AM | 0 (0.0%) | 5 (4.5%) |
| 5:00 AM to 5:29 AM | 0 (0.0%) | 0 (0.0%) |
| 5:30 AM to 5:59 AM | 10 (7.8%) | 0 (0.0%) |
| 6:00 AM to 6:29 AM | 12 (9.4%) | 2 (1.8%) |
| 6:30 AM to 6:59 AM | 6 (4.7%) | 12 (10.8%) |
| 7:00 AM to 7:29 AM | 0 (0.0%) | 5 (4.5%) |
| 7:30 AM to 7:59 AM | 0 (0.0%) | 1 (0.9%) |
| 8:00 AM to 8:29 AM | 2 (1.6%) | 14 (12.6%) |
| 8:30 AM to 8:59 AM | 5 (3.9%) | 0 (0.0%) |
| 9:00 AM to 9:59 AM | 7 (5.5%) | 2 (1.8%) |
| 10:00 AM to 10:59 AM | 0 (0.0%) | 22 (19.8%) |
| 11:00 AM to 11:59 AM | 3 (2.3%) | 0 (0.0%) |
| 12:00 PM to 3:59 PM | 66 (51.6%) | 0 (0.0%) |
| 4:00 PM to 11:59 PM | 17 (13.3%) | 48 (43.2%) |
| Total | 128 (100.0%) | 111 (100.0%) |
Housing Occupancy in Misenheimer
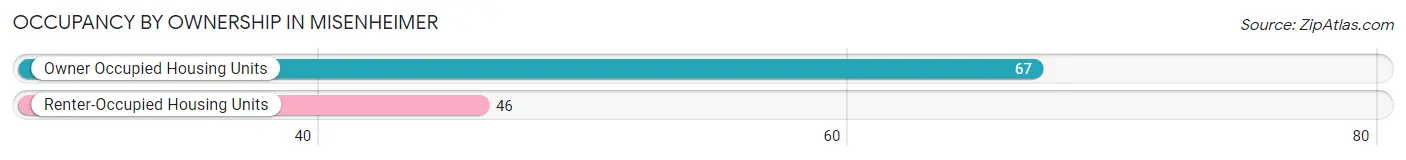
Occupancy by Ownership in Misenheimer
Of the total 113 dwellings in Misenheimer, owner-occupied units account for 67 (59.3%), while renter-occupied units make up 46 (40.7%).
| Occupancy | # Housing Units | % Housing Units |
| Owner Occupied Housing Units | 67 | 59.3% |
| Renter-Occupied Housing Units | 46 | 40.7% |
| Total Occupied Housing Units | 113 | 100.0% |
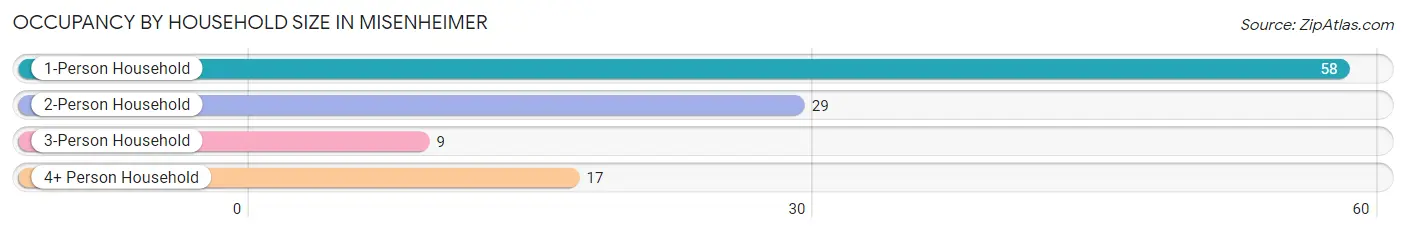
Occupancy by Household Size in Misenheimer
| Household Size | # Housing Units | % Housing Units |
| 1-Person Household | 58 | 51.3% |
| 2-Person Household | 29 | 25.7% |
| 3-Person Household | 9 | 8.0% |
| 4+ Person Household | 17 | 15.0% |
| Total Housing Units | 113 | 100.0% |
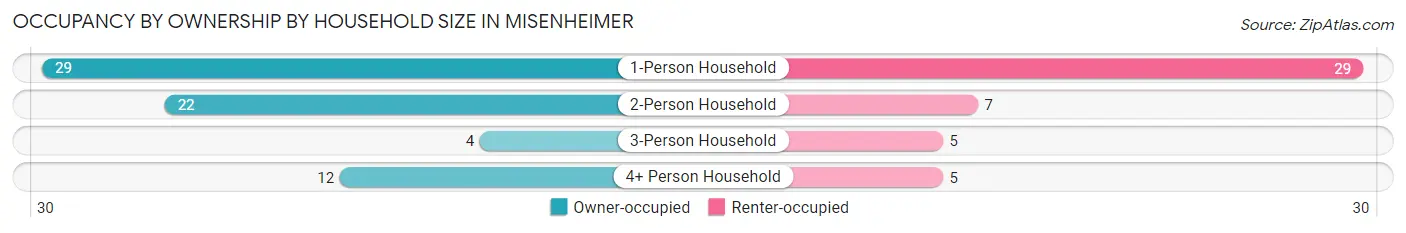
Occupancy by Ownership by Household Size in Misenheimer
| Household Size | Owner-occupied | Renter-occupied |
| 1-Person Household | 29 (50.0%) | 29 (50.0%) |
| 2-Person Household | 22 (75.9%) | 7 (24.1%) |
| 3-Person Household | 4 (44.4%) | 5 (55.6%) |
| 4+ Person Household | 12 (70.6%) | 5 (29.4%) |
| Total Housing Units | 67 (59.3%) | 46 (40.7%) |
Occupancy by Educational Attainment in Misenheimer

| Household Size | Owner-occupied | Renter-occupied |
| Less than High School | 17 (100.0%) | 0 (0.0%) |
| High School Diploma | 6 (31.6%) | 13 (68.4%) |
| College/Associate Degree | 28 (45.9%) | 33 (54.1%) |
| Bachelor's Degree or higher | 16 (100.0%) | 0 (0.0%) |
Occupancy by Age of Householder in Misenheimer
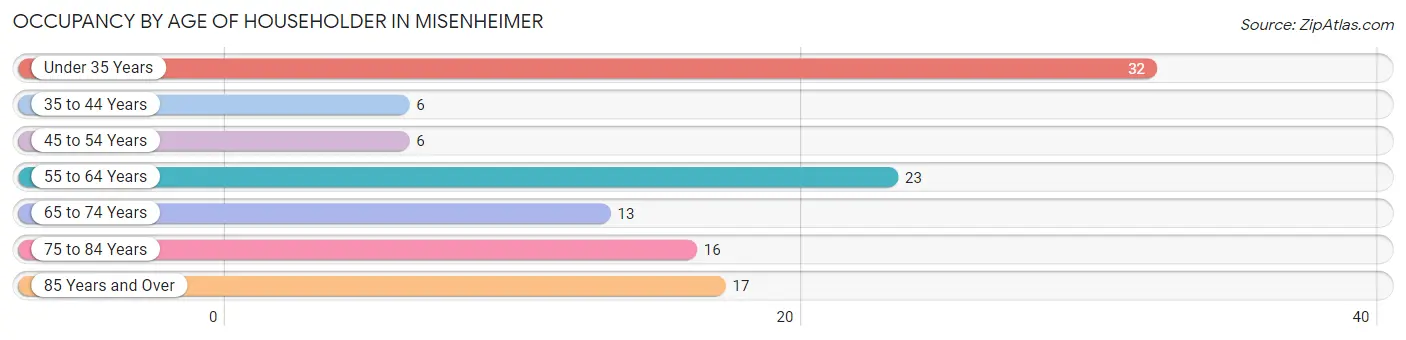
| Age Bracket | # Households | % Households |
| Under 35 Years | 32 | 28.3% |
| 35 to 44 Years | 6 | 5.3% |
| 45 to 54 Years | 6 | 5.3% |
| 55 to 64 Years | 23 | 20.3% |
| 65 to 74 Years | 13 | 11.5% |
| 75 to 84 Years | 16 | 14.2% |
| 85 Years and Over | 17 | 15.0% |
| Total | 113 | 100.0% |
Housing Finances in Misenheimer
Median Income by Occupancy in Misenheimer
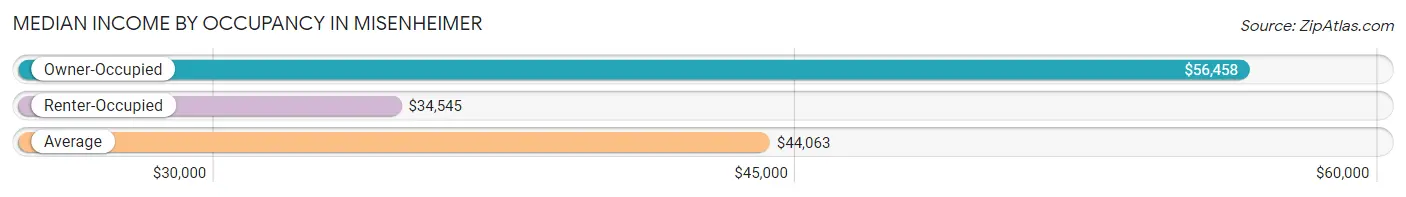
| Occupancy Type | # Households | Median Income |
| Owner-Occupied | 67 (59.3%) | $56,458 |
| Renter-Occupied | 46 (40.7%) | $34,545 |
| Average | 113 (100.0%) | $44,063 |
Occupancy by Householder Income Bracket in Misenheimer
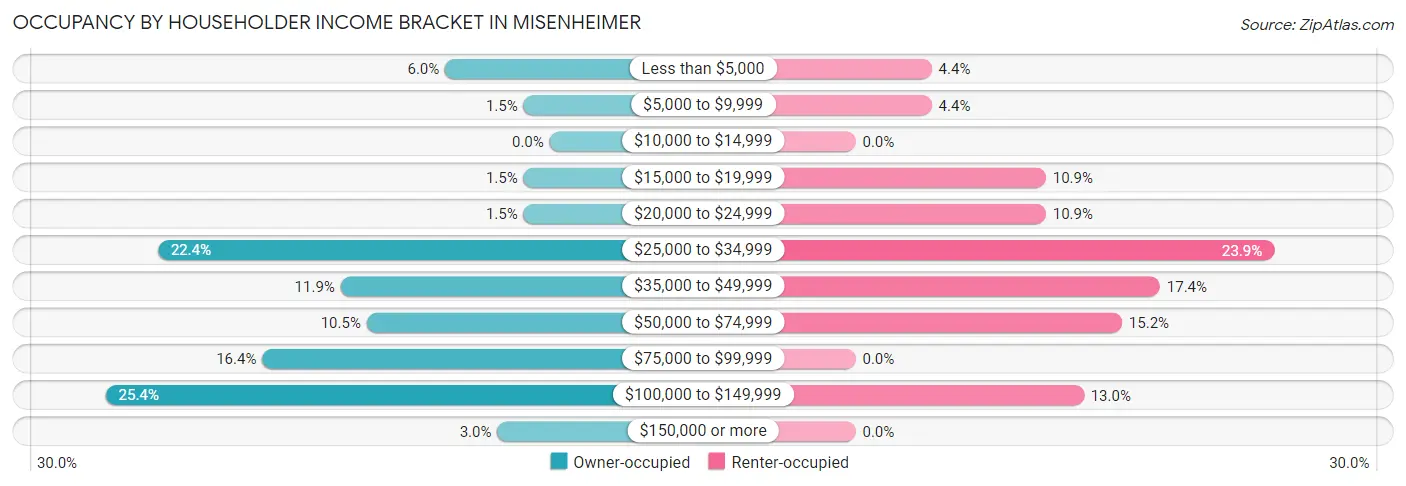
| Income Bracket | Owner-occupied | Renter-occupied |
| Less than $5,000 | 4 (6.0%) | 2 (4.3%) |
| $5,000 to $9,999 | 1 (1.5%) | 2 (4.3%) |
| $10,000 to $14,999 | 0 (0.0%) | 0 (0.0%) |
| $15,000 to $19,999 | 1 (1.5%) | 5 (10.9%) |
| $20,000 to $24,999 | 1 (1.5%) | 5 (10.9%) |
| $25,000 to $34,999 | 15 (22.4%) | 11 (23.9%) |
| $35,000 to $49,999 | 8 (11.9%) | 8 (17.4%) |
| $50,000 to $74,999 | 7 (10.4%) | 7 (15.2%) |
| $75,000 to $99,999 | 11 (16.4%) | 0 (0.0%) |
| $100,000 to $149,999 | 17 (25.4%) | 6 (13.0%) |
| $150,000 or more | 2 (3.0%) | 0 (0.0%) |
| Total | 67 (100.0%) | 46 (100.0%) |
Monthly Housing Cost Tiers in Misenheimer
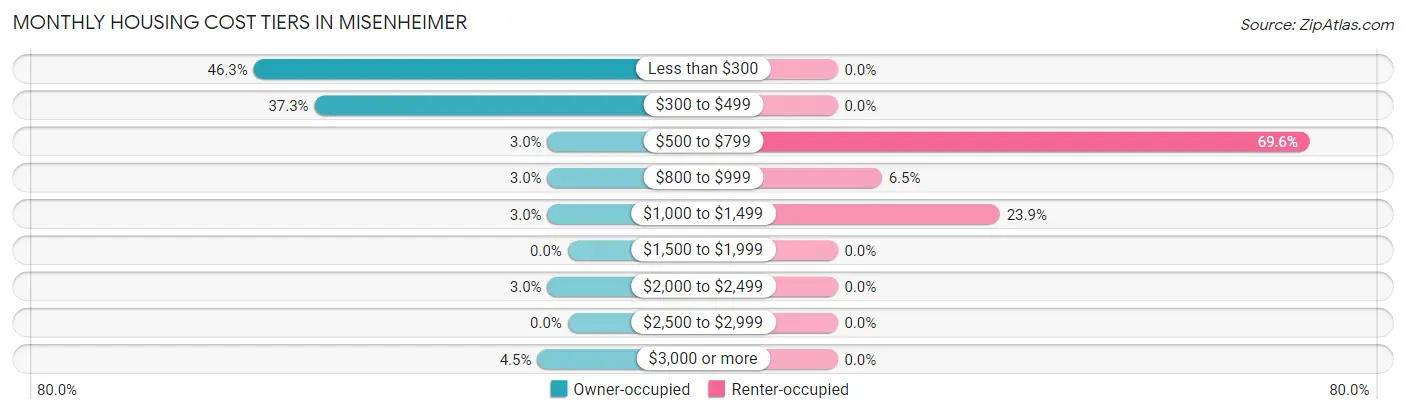
| Monthly Cost | Owner-occupied | Renter-occupied |
| Less than $300 | 31 (46.3%) | 0 (0.0%) |
| $300 to $499 | 25 (37.3%) | 0 (0.0%) |
| $500 to $799 | 2 (3.0%) | 32 (69.6%) |
| $800 to $999 | 2 (3.0%) | 3 (6.5%) |
| $1,000 to $1,499 | 2 (3.0%) | 11 (23.9%) |
| $1,500 to $1,999 | 0 (0.0%) | 0 (0.0%) |
| $2,000 to $2,499 | 2 (3.0%) | 0 (0.0%) |
| $2,500 to $2,999 | 0 (0.0%) | 0 (0.0%) |
| $3,000 or more | 3 (4.5%) | 0 (0.0%) |
| Total | 67 (100.0%) | 46 (100.0%) |
Physical Housing Characteristics in Misenheimer
Housing Structures in Misenheimer
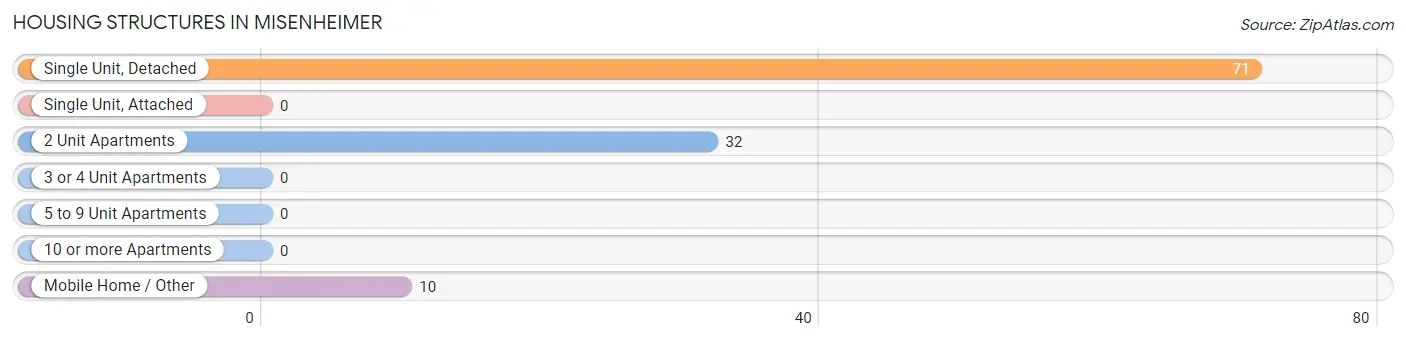
| Structure Type | # Housing Units | % Housing Units |
| Single Unit, Detached | 71 | 62.8% |
| Single Unit, Attached | 0 | 0.0% |
| 2 Unit Apartments | 32 | 28.3% |
| 3 or 4 Unit Apartments | 0 | 0.0% |
| 5 to 9 Unit Apartments | 0 | 0.0% |
| 10 or more Apartments | 0 | 0.0% |
| Mobile Home / Other | 10 | 8.8% |
| Total | 113 | 100.0% |
Housing Structures by Occupancy in Misenheimer

| Structure Type | Owner-occupied | Renter-occupied |
| Single Unit, Detached | 57 (80.3%) | 14 (19.7%) |
| Single Unit, Attached | 0 (0.0%) | 0 (0.0%) |
| 2 Unit Apartments | 0 (0.0%) | 32 (100.0%) |
| 3 or 4 Unit Apartments | 0 (0.0%) | 0 (0.0%) |
| 5 to 9 Unit Apartments | 0 (0.0%) | 0 (0.0%) |
| 10 or more Apartments | 0 (0.0%) | 0 (0.0%) |
| Mobile Home / Other | 10 (100.0%) | 0 (0.0%) |
| Total | 67 (59.3%) | 46 (40.7%) |
Housing Structures by Number of Rooms in Misenheimer
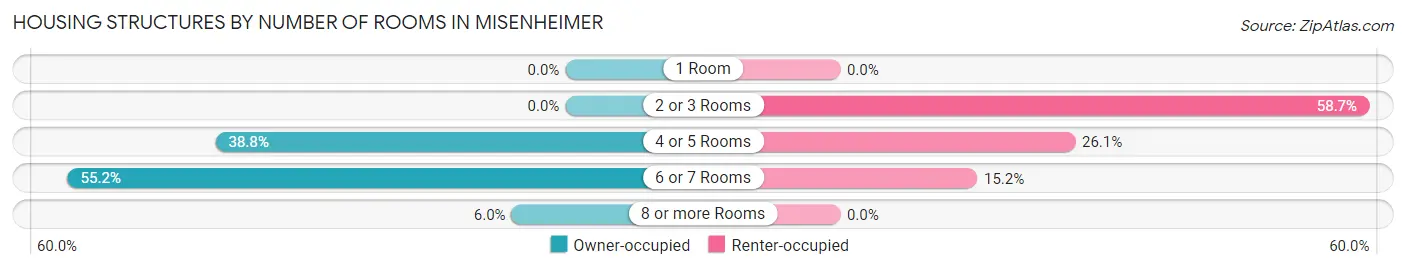
| Number of Rooms | Owner-occupied | Renter-occupied |
| 1 Room | 0 (0.0%) | 0 (0.0%) |
| 2 or 3 Rooms | 0 (0.0%) | 27 (58.7%) |
| 4 or 5 Rooms | 26 (38.8%) | 12 (26.1%) |
| 6 or 7 Rooms | 37 (55.2%) | 7 (15.2%) |
| 8 or more Rooms | 4 (6.0%) | 0 (0.0%) |
| Total | 67 (100.0%) | 46 (100.0%) |
Housing Structure by Heating Type in Misenheimer
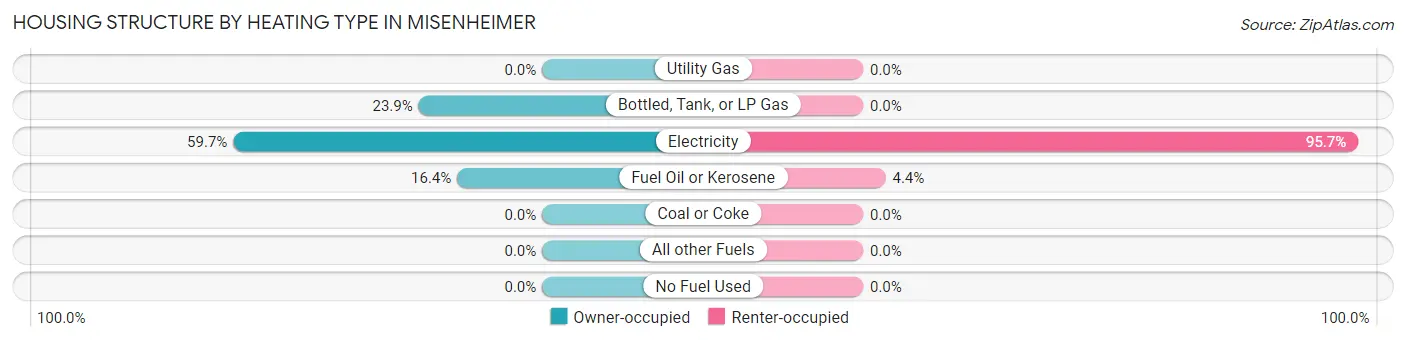
| Heating Type | Owner-occupied | Renter-occupied |
| Utility Gas | 0 (0.0%) | 0 (0.0%) |
| Bottled, Tank, or LP Gas | 16 (23.9%) | 0 (0.0%) |
| Electricity | 40 (59.7%) | 44 (95.7%) |
| Fuel Oil or Kerosene | 11 (16.4%) | 2 (4.3%) |
| Coal or Coke | 0 (0.0%) | 0 (0.0%) |
| All other Fuels | 0 (0.0%) | 0 (0.0%) |
| No Fuel Used | 0 (0.0%) | 0 (0.0%) |
| Total | 67 (100.0%) | 46 (100.0%) |
Household Vehicle Usage in Misenheimer
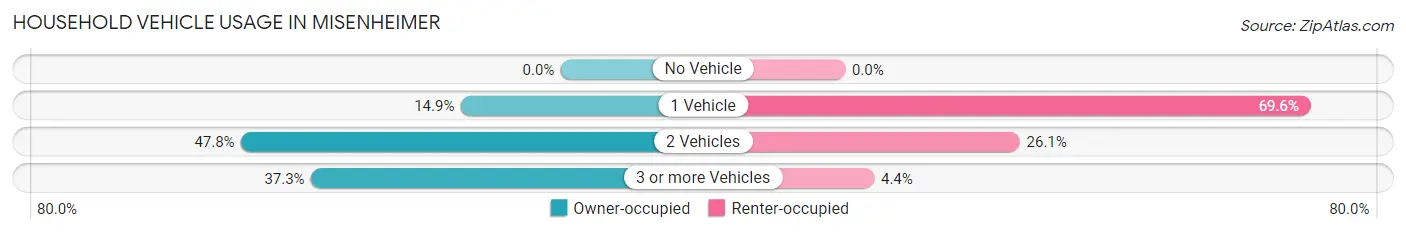
| Vehicles per Household | Owner-occupied | Renter-occupied |
| No Vehicle | 0 (0.0%) | 0 (0.0%) |
| 1 Vehicle | 10 (14.9%) | 32 (69.6%) |
| 2 Vehicles | 32 (47.8%) | 12 (26.1%) |
| 3 or more Vehicles | 25 (37.3%) | 2 (4.3%) |
| Total | 67 (100.0%) | 46 (100.0%) |
Real Estate & Mortgages in Misenheimer
Real Estate and Mortgage Overview in Misenheimer
| Characteristic | Without Mortgage | With Mortgage |
| Housing Units | 53 | 14 |
| Median Property Value | $157,500 | $137,500 |
| Median Household Income | - | - |
| Monthly Housing Costs | $286 | $2 |
| Real Estate Taxes | $863 | $0 |
Property Value by Mortgage Status in Misenheimer
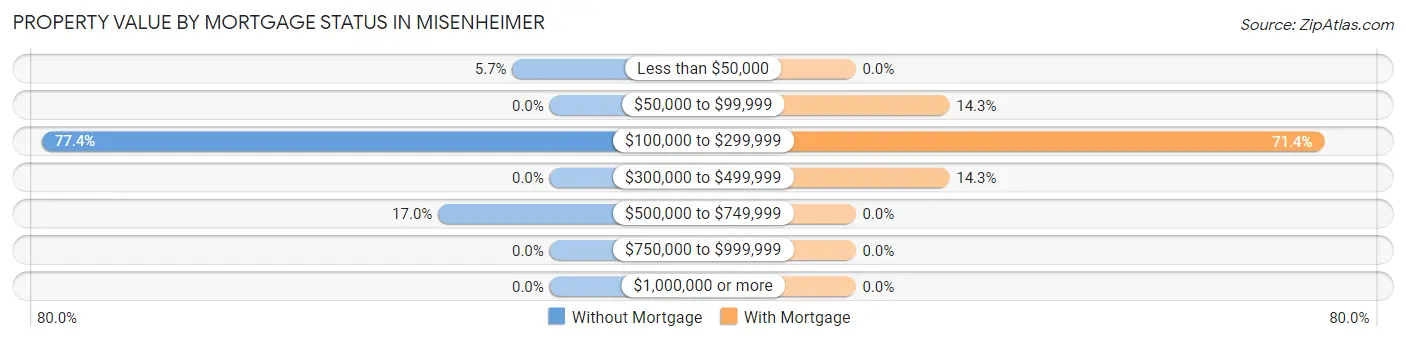
| Property Value | Without Mortgage | With Mortgage |
| Less than $50,000 | 3 (5.7%) | 0 (0.0%) |
| $50,000 to $99,999 | 0 (0.0%) | 2 (14.3%) |
| $100,000 to $299,999 | 41 (77.4%) | 10 (71.4%) |
| $300,000 to $499,999 | 0 (0.0%) | 2 (14.3%) |
| $500,000 to $749,999 | 9 (17.0%) | 0 (0.0%) |
| $750,000 to $999,999 | 0 (0.0%) | 0 (0.0%) |
| $1,000,000 or more | 0 (0.0%) | 0 (0.0%) |
| Total | 53 (100.0%) | 14 (100.0%) |
Household Income by Mortgage Status in Misenheimer
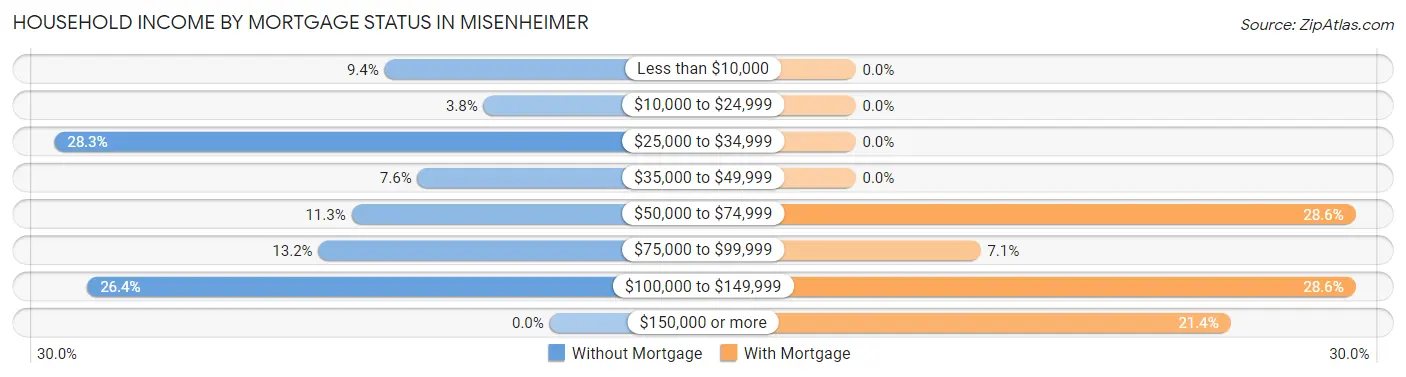
| Household Income | Without Mortgage | With Mortgage |
| Less than $10,000 | 5 (9.4%) | 0 (0.0%) |
| $10,000 to $24,999 | 2 (3.8%) | 0 (0.0%) |
| $25,000 to $34,999 | 15 (28.3%) | 0 (0.0%) |
| $35,000 to $49,999 | 4 (7.5%) | 0 (0.0%) |
| $50,000 to $74,999 | 6 (11.3%) | 4 (28.6%) |
| $75,000 to $99,999 | 7 (13.2%) | 1 (7.1%) |
| $100,000 to $149,999 | 14 (26.4%) | 4 (28.6%) |
| $150,000 or more | 0 (0.0%) | 3 (21.4%) |
| Total | 53 (100.0%) | 14 (100.0%) |
Property Value to Household Income Ratio in Misenheimer
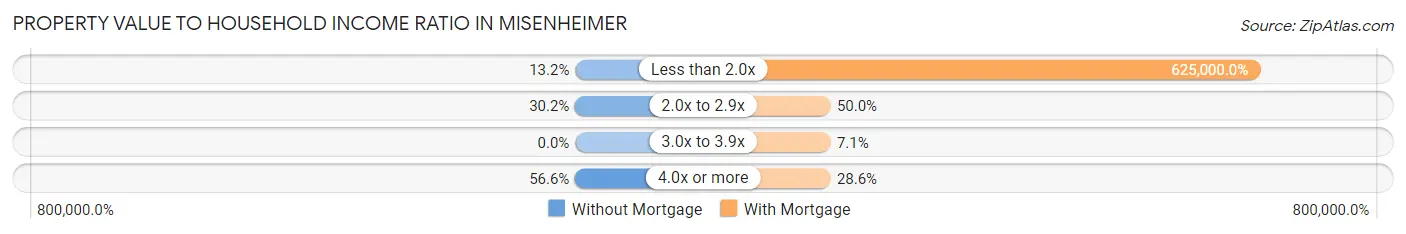
| Value-to-Income Ratio | Without Mortgage | With Mortgage |
| Less than 2.0x | 7 (13.2%) | 87,500 (625,000.0%) |
| 2.0x to 2.9x | 16 (30.2%) | 7 (50.0%) |
| 3.0x to 3.9x | 0 (0.0%) | 1 (7.1%) |
| 4.0x or more | 30 (56.6%) | 4 (28.6%) |
| Total | 53 (100.0%) | 14 (100.0%) |
Real Estate Taxes by Mortgage Status in Misenheimer
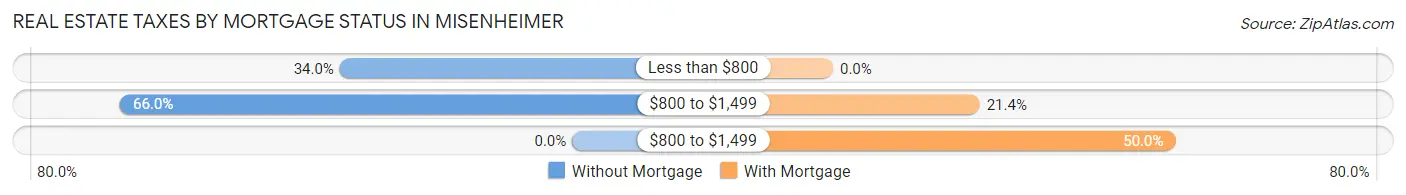
| Property Taxes | Without Mortgage | With Mortgage |
| Less than $800 | 18 (34.0%) | 0 (0.0%) |
| $800 to $1,499 | 35 (66.0%) | 3 (21.4%) |
| $800 to $1,499 | 0 (0.0%) | 7 (50.0%) |
| Total | 53 (100.0%) | 14 (100.0%) |
Health & Disability in Misenheimer
Health Insurance Coverage by Age in Misenheimer
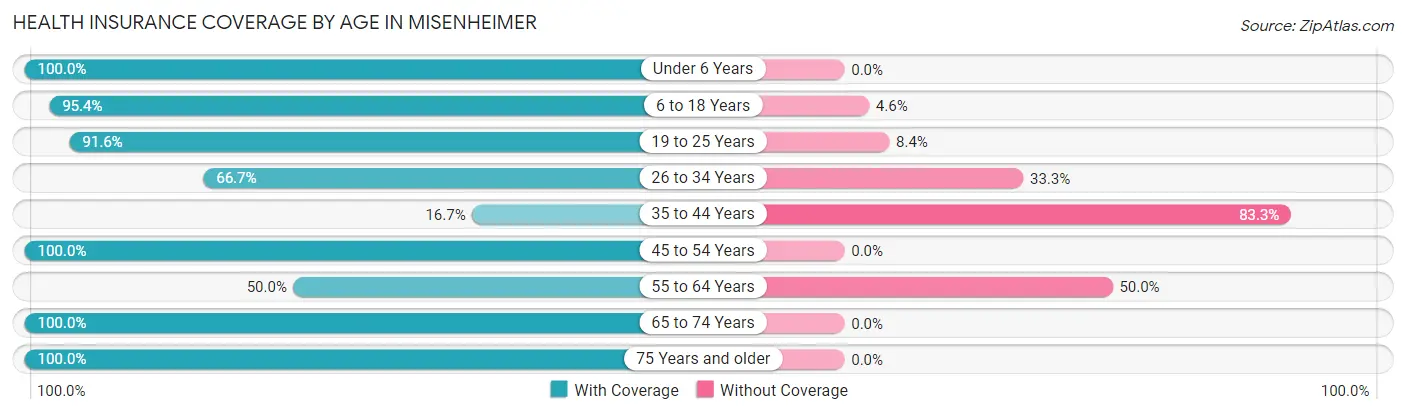
| Age Bracket | With Coverage | Without Coverage |
| Under 6 Years | 29 (100.0%) | 0 (0.0%) |
| 6 to 18 Years | 104 (95.4%) | 5 (4.6%) |
| 19 to 25 Years | 329 (91.6%) | 30 (8.4%) |
| 26 to 34 Years | 28 (66.7%) | 14 (33.3%) |
| 35 to 44 Years | 1 (16.7%) | 5 (83.3%) |
| 45 to 54 Years | 9 (100.0%) | 0 (0.0%) |
| 55 to 64 Years | 19 (50.0%) | 19 (50.0%) |
| 65 to 74 Years | 18 (100.0%) | 0 (0.0%) |
| 75 Years and older | 42 (100.0%) | 0 (0.0%) |
| Total | 579 (88.8%) | 73 (11.2%) |
Health Insurance Coverage by Citizenship Status in Misenheimer
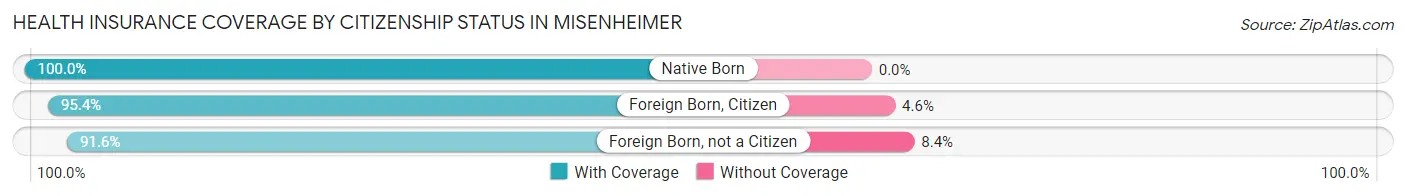
| Citizenship Status | With Coverage | Without Coverage |
| Native Born | 29 (100.0%) | 0 (0.0%) |
| Foreign Born, Citizen | 104 (95.4%) | 5 (4.6%) |
| Foreign Born, not a Citizen | 329 (91.6%) | 30 (8.4%) |
Health Insurance Coverage by Household Income in Misenheimer
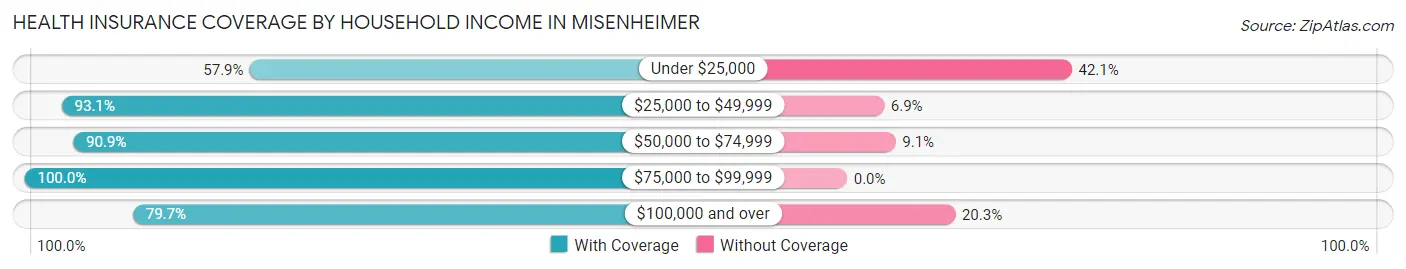
| Household Income | With Coverage | Without Coverage |
| Under $25,000 | 22 (57.9%) | 16 (42.1%) |
| $25,000 to $49,999 | 67 (93.1%) | 5 (6.9%) |
| $50,000 to $74,999 | 20 (90.9%) | 2 (9.1%) |
| $75,000 to $99,999 | 20 (100.0%) | 0 (0.0%) |
| $100,000 and over | 59 (79.7%) | 15 (20.3%) |
Public vs Private Health Insurance Coverage by Age in Misenheimer
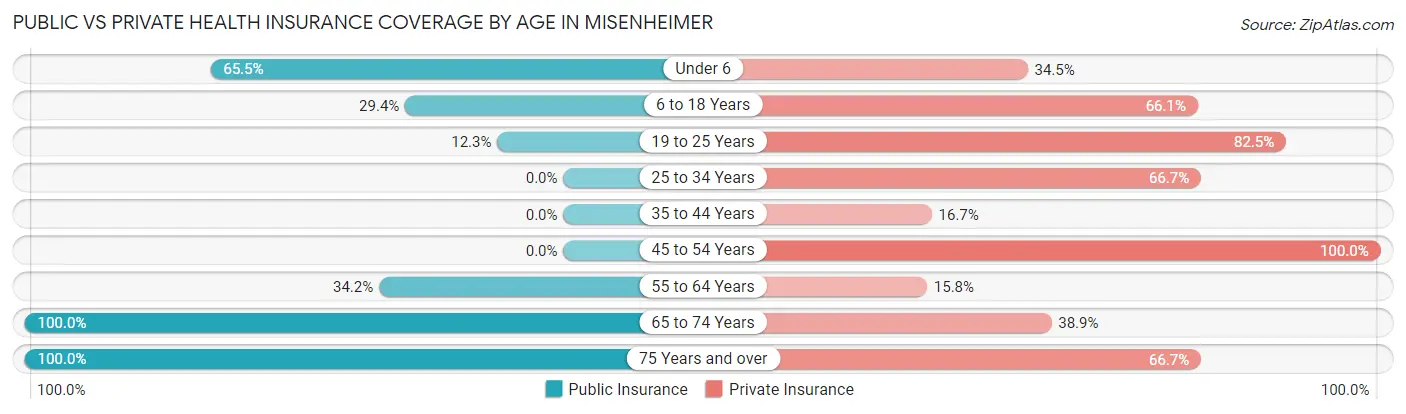
| Age Bracket | Public Insurance | Private Insurance |
| Under 6 | 19 (65.5%) | 10 (34.5%) |
| 6 to 18 Years | 32 (29.4%) | 72 (66.1%) |
| 19 to 25 Years | 44 (12.3%) | 296 (82.5%) |
| 25 to 34 Years | 0 (0.0%) | 28 (66.7%) |
| 35 to 44 Years | 0 (0.0%) | 1 (16.7%) |
| 45 to 54 Years | 0 (0.0%) | 9 (100.0%) |
| 55 to 64 Years | 13 (34.2%) | 6 (15.8%) |
| 65 to 74 Years | 18 (100.0%) | 7 (38.9%) |
| 75 Years and over | 42 (100.0%) | 28 (66.7%) |
| Total | 168 (25.8%) | 457 (70.1%) |
Disability Status by Sex by Age in Misenheimer
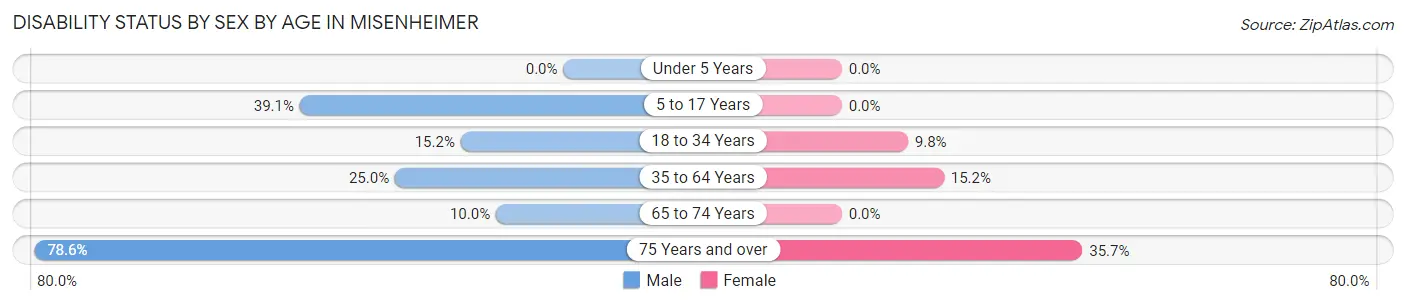
| Age Bracket | Male | Female |
| Under 5 Years | 0 (0.0%) | 0 (0.0%) |
| 5 to 17 Years | 9 (39.1%) | 0 (0.0%) |
| 18 to 34 Years | 41 (15.2%) | 21 (9.8%) |
| 35 to 64 Years | 5 (25.0%) | 5 (15.1%) |
| 65 to 74 Years | 1 (10.0%) | 0 (0.0%) |
| 75 Years and over | 22 (78.6%) | 5 (35.7%) |
Disability Class by Sex by Age in Misenheimer
Disability Class: Hearing Difficulty
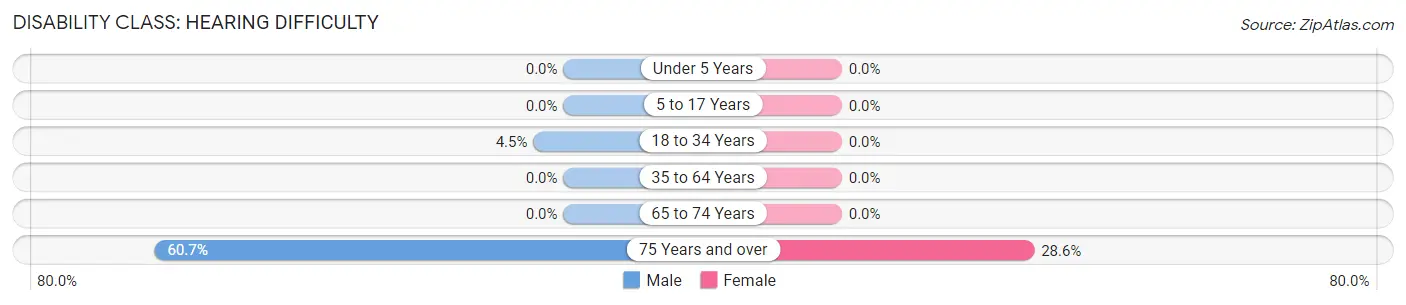
| Age Bracket | Male | Female |
| Under 5 Years | 0 (0.0%) | 0 (0.0%) |
| 5 to 17 Years | 0 (0.0%) | 0 (0.0%) |
| 18 to 34 Years | 12 (4.5%) | 0 (0.0%) |
| 35 to 64 Years | 0 (0.0%) | 0 (0.0%) |
| 65 to 74 Years | 0 (0.0%) | 0 (0.0%) |
| 75 Years and over | 17 (60.7%) | 4 (28.6%) |
Disability Class: Vision Difficulty
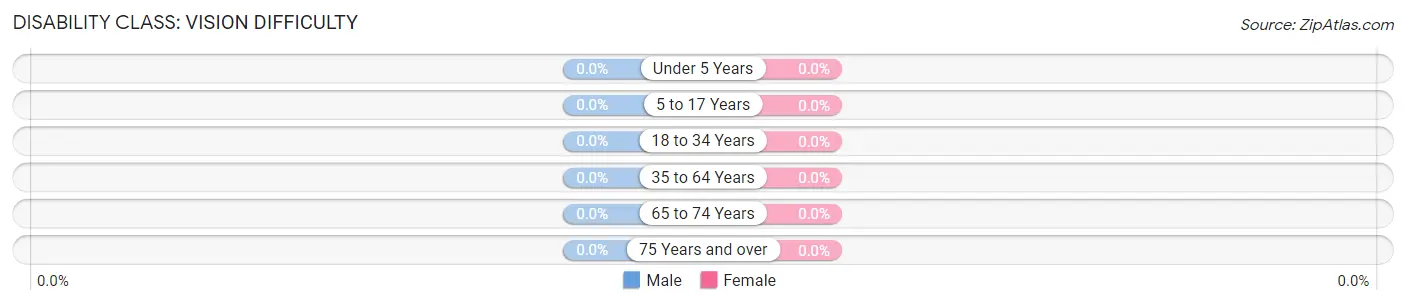
| Age Bracket | Male | Female |
| Under 5 Years | 0 (0.0%) | 0 (0.0%) |
| 5 to 17 Years | 0 (0.0%) | 0 (0.0%) |
| 18 to 34 Years | 0 (0.0%) | 0 (0.0%) |
| 35 to 64 Years | 0 (0.0%) | 0 (0.0%) |
| 65 to 74 Years | 0 (0.0%) | 0 (0.0%) |
| 75 Years and over | 0 (0.0%) | 0 (0.0%) |
Disability Class: Cognitive Difficulty
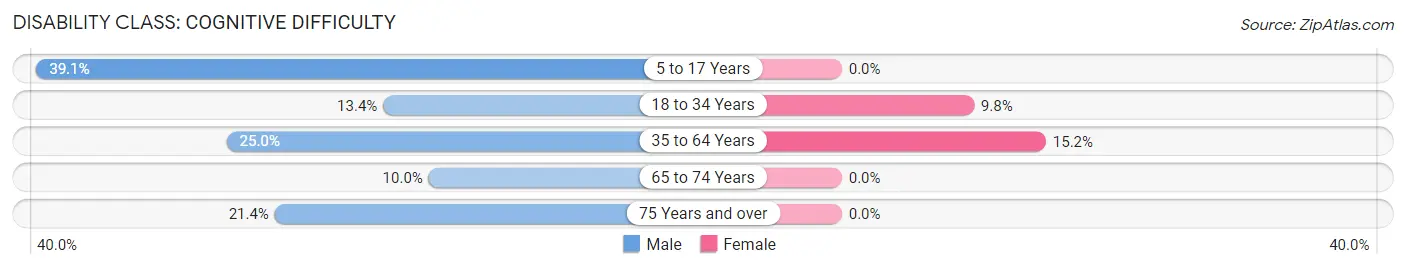
| Age Bracket | Male | Female |
| 5 to 17 Years | 9 (39.1%) | 0 (0.0%) |
| 18 to 34 Years | 36 (13.4%) | 21 (9.8%) |
| 35 to 64 Years | 5 (25.0%) | 5 (15.1%) |
| 65 to 74 Years | 1 (10.0%) | 0 (0.0%) |
| 75 Years and over | 6 (21.4%) | 0 (0.0%) |
Disability Class: Ambulatory Difficulty
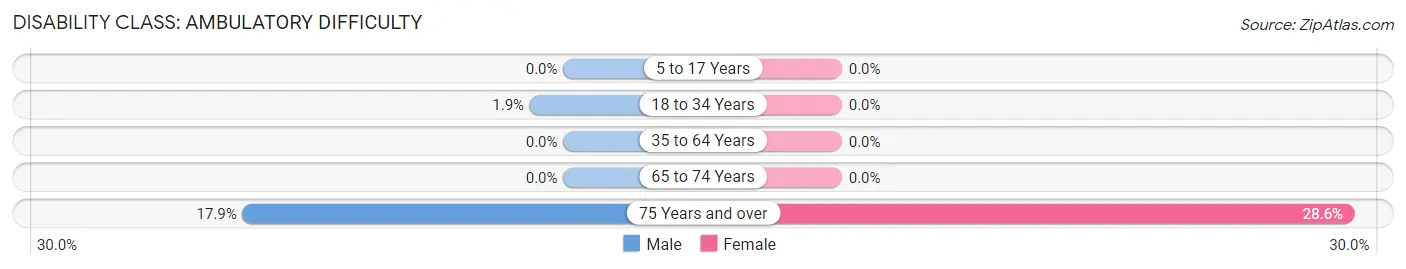
| Age Bracket | Male | Female |
| 5 to 17 Years | 0 (0.0%) | 0 (0.0%) |
| 18 to 34 Years | 5 (1.9%) | 0 (0.0%) |
| 35 to 64 Years | 0 (0.0%) | 0 (0.0%) |
| 65 to 74 Years | 0 (0.0%) | 0 (0.0%) |
| 75 Years and over | 5 (17.9%) | 4 (28.6%) |
Disability Class: Self-Care Difficulty
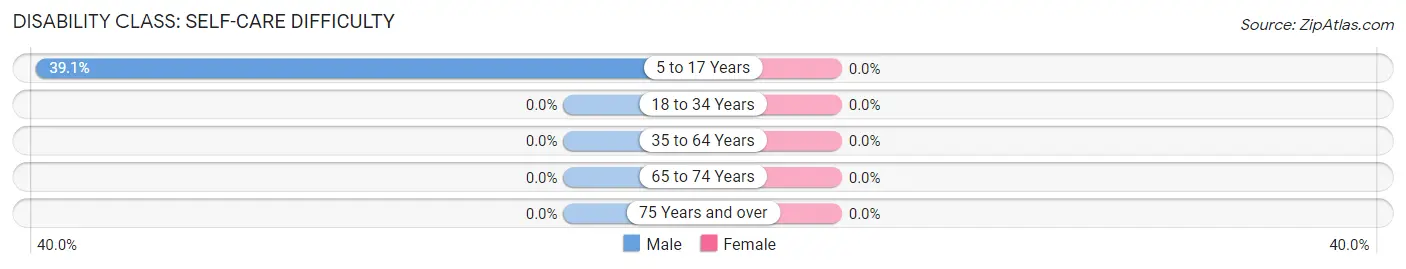
| Age Bracket | Male | Female |
| 5 to 17 Years | 9 (39.1%) | 0 (0.0%) |
| 18 to 34 Years | 0 (0.0%) | 0 (0.0%) |
| 35 to 64 Years | 0 (0.0%) | 0 (0.0%) |
| 65 to 74 Years | 0 (0.0%) | 0 (0.0%) |
| 75 Years and over | 0 (0.0%) | 0 (0.0%) |
Technology Access in Misenheimer
Computing Device Access in Misenheimer
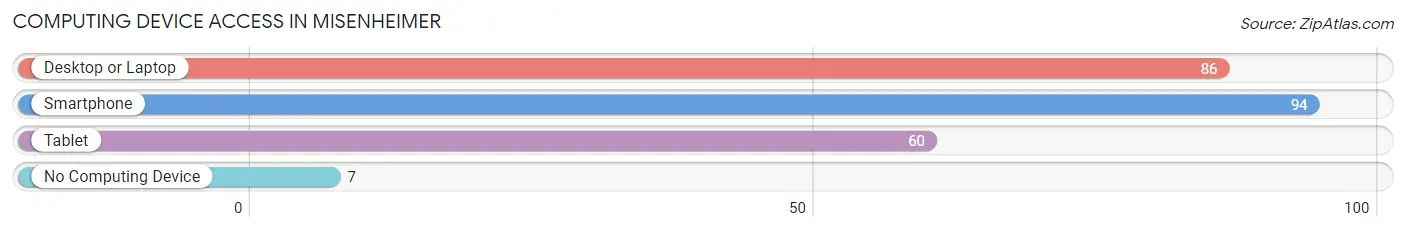
| Device Type | # Households | % Households |
| Desktop or Laptop | 86 | 76.1% |
| Smartphone | 94 | 83.2% |
| Tablet | 60 | 53.1% |
| No Computing Device | 7 | 6.2% |
| Total | 113 | 100.0% |
Internet Access in Misenheimer
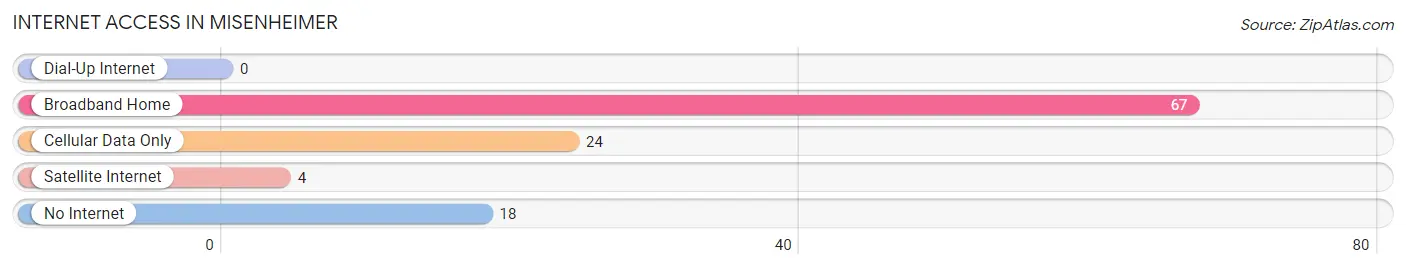
| Internet Type | # Households | % Households |
| Dial-Up Internet | 0 | 0.0% |
| Broadband Home | 67 | 59.3% |
| Cellular Data Only | 24 | 21.2% |
| Satellite Internet | 4 | 3.5% |
| No Internet | 18 | 15.9% |
| Total | 113 | 100.0% |
Misenheimer Summary
Misenheimer is a small town located in Stanly County, North Carolina. It is situated in the Piedmont region of the state, approximately 40 miles northeast of Charlotte. The town was founded in 1887 and is named after the Misenheimer family, who were early settlers in the area. The population of Misenheimer was 1,093 as of the 2010 census.
Geography
Misenheimer is located at 35°25'25"N 80°14'17"W. It is situated in the Piedmont region of North Carolina, approximately 40 miles northeast of Charlotte. The town is located in Stanly County, which is part of the Charlotte-Gastonia-Concord Metropolitan Statistical Area. The town is situated on the banks of the Rocky River, which is a tributary of the Yadkin River. The town is surrounded by rolling hills and forests, and is located near the Uwharrie National Forest.
Climate
Misenheimer has a humid subtropical climate, with hot, humid summers and mild winters. The average annual temperature is around 61°F, with an average high of around 87°F in the summer and an average low of around 35°F in the winter. The average annual precipitation is around 45 inches, with most of the precipitation occurring in the summer months.
Economy
Misenheimer’s economy is largely based on agriculture and manufacturing. The town is home to several small businesses, including a feed mill, a sawmill, and a furniture factory. The town is also home to several farms, which produce a variety of crops, including corn, soybeans, and tobacco.
Demographics
As of the 2010 census, the population of Misenheimer was 1,093. The racial makeup of the town was 94.2% White, 3.2% African American, 0.7% Native American, 0.2% Asian, 0.1% Pacific Islander, and 1.6% from other races. The median household income was $31,250, and the median family income was $37,500. The per capita income was $17,845.
Education
Misenheimer is served by the Stanly County Schools system. The town is home to Misenheimer Elementary School, which serves students in grades K-5. The town is also home to North Stanly High School, which serves students in grades 9-12.
Conclusion
Misenheimer is a small town located in Stanly County, North Carolina. It is situated in the Piedmont region of the state, approximately 40 miles northeast of Charlotte. The town was founded in 1887 and is named after the Misenheimer family, who were early settlers in the area. The population of Misenheimer was 1,093 as of the 2010 census. The town’s economy is largely based on agriculture and manufacturing, and the town is served by the Stanly County Schools system. Misenheimer is a small but vibrant community, and is a great place to live and work.
Common Questions
What is Per Capita Income in Misenheimer?
Per Capita income in Misenheimer is $12,222.
What is the Median Family Income in Misenheimer?
Median Family Income in Misenheimer is $84,167.
What is the Median Household income in Misenheimer?
Median Household Income in Misenheimer is $44,063.
What is Inequality or Gini Index in Misenheimer?
Inequality or Gini Index in Misenheimer is 0.39.
What is the Total Population of Misenheimer?
Total Population of Misenheimer is 652.
What is the Total Male Population of Misenheimer?
Total Male Population of Misenheimer is 368.
What is the Total Female Population of Misenheimer?
Total Female Population of Misenheimer is 284.
What is the Ratio of Males per 100 Females in Misenheimer?
There are 129.58 Males per 100 Females in Misenheimer.
What is the Ratio of Females per 100 Males in Misenheimer?
There are 77.17 Females per 100 Males in Misenheimer.
What is the Median Population Age in Misenheimer?
Median Population Age in Misenheimer is 20.6 Years.
What is the Average Family Size in Misenheimer
Average Family Size in Misenheimer is 3.2 People.
What is the Average Household Size in Misenheimer
Average Household Size in Misenheimer is 2.0 People.
How Large is the Labor Force in Misenheimer?
There are 291 People in the Labor Forcein in Misenheimer.
What is the Percentage of People in the Labor Force in Misenheimer?
48.8% of People are in the Labor Force in Misenheimer.
What is the Unemployment Rate in Misenheimer?
Unemployment Rate in Misenheimer is 13.4%.