Frisco, NC Map & Demographics
Frisco Map
Frisco Overview
$43,375
PER CAPITA INCOME
$125,192
AVG FAMILY INCOME
$65,368
AVG HOUSEHOLD INCOME
4.1%
WAGE / INCOME GAP [ % ]
95.9¢/ $1
WAGE / INCOME GAP [ $ ]
0.40
INEQUALITY / GINI INDEX
659
TOTAL POPULATION
359
MALE POPULATION
300
FEMALE POPULATION
119.67
MALES / 100 FEMALES
83.57
FEMALES / 100 MALES
52.1
MEDIAN AGE
2.7
AVG FAMILY SIZE
1.9
AVG HOUSEHOLD SIZE
404
LABOR FORCE [ PEOPLE ]
75.8%
PERCENT IN LABOR FORCE
Frisco Zip Codes
Frisco Area Codes
Income in Frisco
Income Overview in Frisco
Per Capita Income in Frisco is $43,375, while median incomes of families and households are $125,192 and $65,368 respectively.
| Characteristic | Number | Measure |
| Per Capita Income | 659 | $43,375 |
| Median Family Income | 178 | $125,192 |
| Mean Family Income | 178 | $121,344 |
| Median Household Income | 347 | $65,368 |
| Mean Household Income | 347 | $83,053 |
| Income Deficit | 178 | $0 |
| Wage / Income Gap (%) | 659 | 4.07% |
| Wage / Income Gap ($) | 659 | 95.93¢ per $1 |
| Gini / Inequality Index | 659 | 0.40 |
Earnings by Sex in Frisco
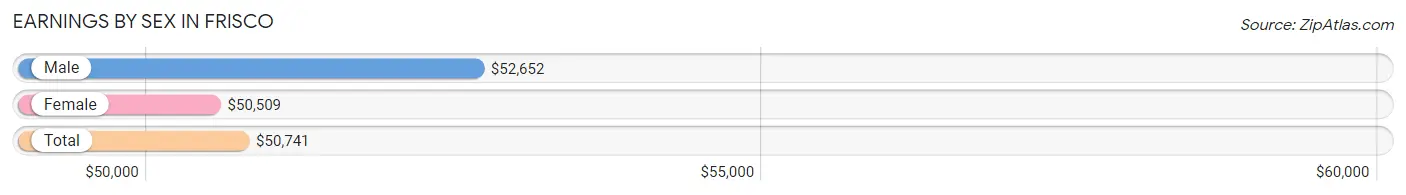
Average Earnings in Frisco are $50,741, $52,652 for men and $50,509 for women, a difference of 4.1%.
| Sex | Number | Average Earnings |
| Male | 181 (43.5%) | $52,652 |
| Female | 235 (56.5%) | $50,509 |
| Total | 416 (100.0%) | $50,741 |
Earnings by Sex by Income Bracket in Frisco
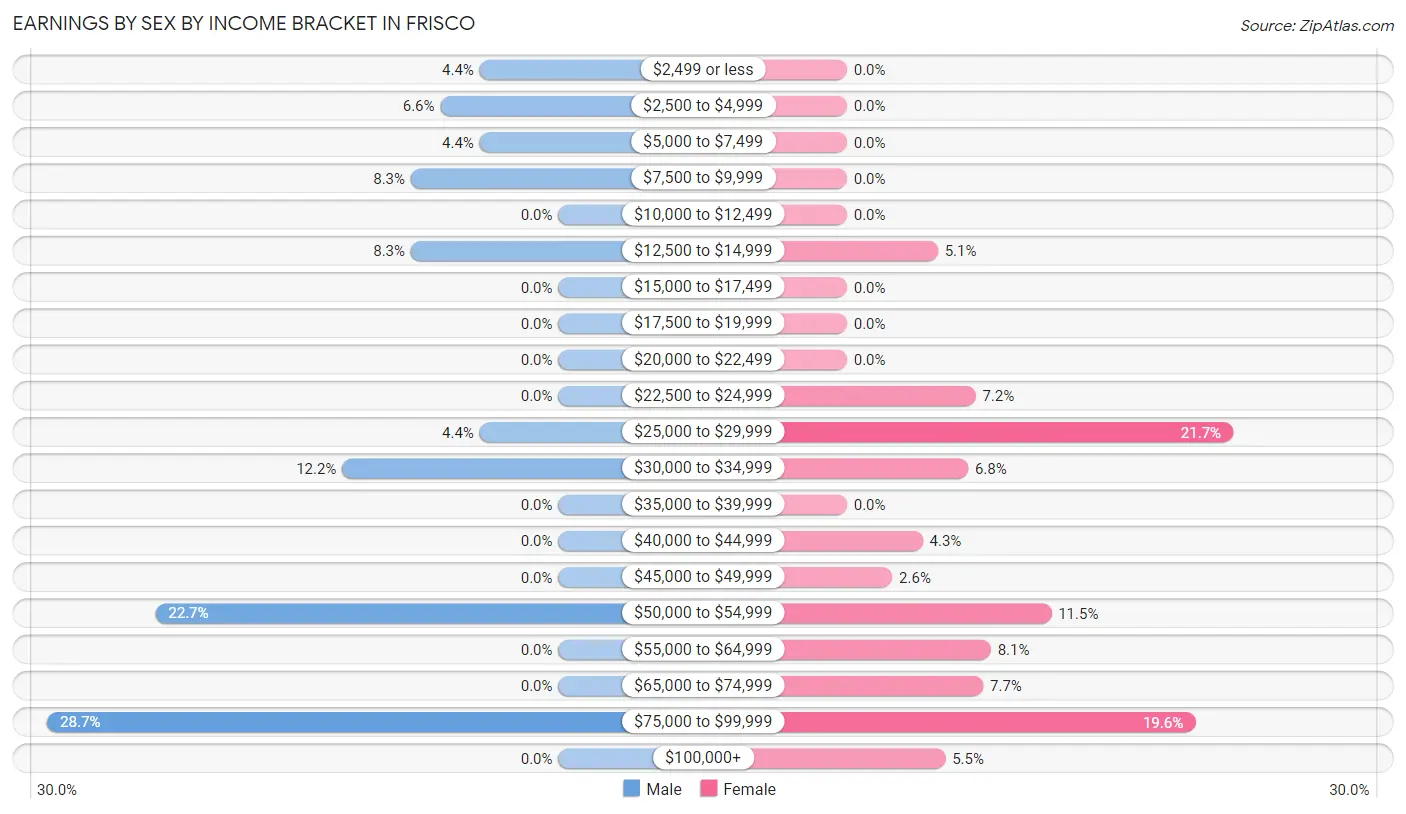
The most common earnings brackets in Frisco are $75,000 to $99,999 for men (52 | 28.7%) and $25,000 to $29,999 for women (51 | 21.7%).
| Income | Male | Female |
| $2,499 or less | 8 (4.4%) | 0 (0.0%) |
| $2,500 to $4,999 | 12 (6.6%) | 0 (0.0%) |
| $5,000 to $7,499 | 8 (4.4%) | 0 (0.0%) |
| $7,500 to $9,999 | 15 (8.3%) | 0 (0.0%) |
| $10,000 to $12,499 | 0 (0.0%) | 0 (0.0%) |
| $12,500 to $14,999 | 15 (8.3%) | 12 (5.1%) |
| $15,000 to $17,499 | 0 (0.0%) | 0 (0.0%) |
| $17,500 to $19,999 | 0 (0.0%) | 0 (0.0%) |
| $20,000 to $22,499 | 0 (0.0%) | 0 (0.0%) |
| $22,500 to $24,999 | 0 (0.0%) | 17 (7.2%) |
| $25,000 to $29,999 | 8 (4.4%) | 51 (21.7%) |
| $30,000 to $34,999 | 22 (12.1%) | 16 (6.8%) |
| $35,000 to $39,999 | 0 (0.0%) | 0 (0.0%) |
| $40,000 to $44,999 | 0 (0.0%) | 10 (4.3%) |
| $45,000 to $49,999 | 0 (0.0%) | 6 (2.5%) |
| $50,000 to $54,999 | 41 (22.7%) | 27 (11.5%) |
| $55,000 to $64,999 | 0 (0.0%) | 19 (8.1%) |
| $65,000 to $74,999 | 0 (0.0%) | 18 (7.7%) |
| $75,000 to $99,999 | 52 (28.7%) | 46 (19.6%) |
| $100,000+ | 0 (0.0%) | 13 (5.5%) |
| Total | 181 (100.0%) | 235 (100.0%) |
Earnings by Sex by Educational Attainment in Frisco
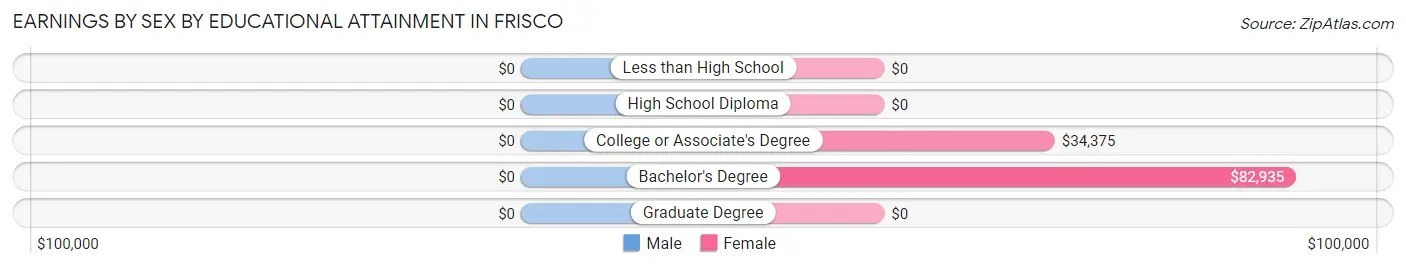
| Educational Attainment | Male Income | Female Income |
| Less than High School | - | - |
| High School Diploma | - | - |
| College or Associate's Degree | - | - |
| Bachelor's Degree | - | - |
| Graduate Degree | - | - |
| Total | - | - |
Family Income in Frisco
Family Income Brackets in Frisco
According to the Frisco family income data, there are 64 families falling into the $150,000 to $199,999 income range, which is the most common income bracket and makes up 36.0% of all families.
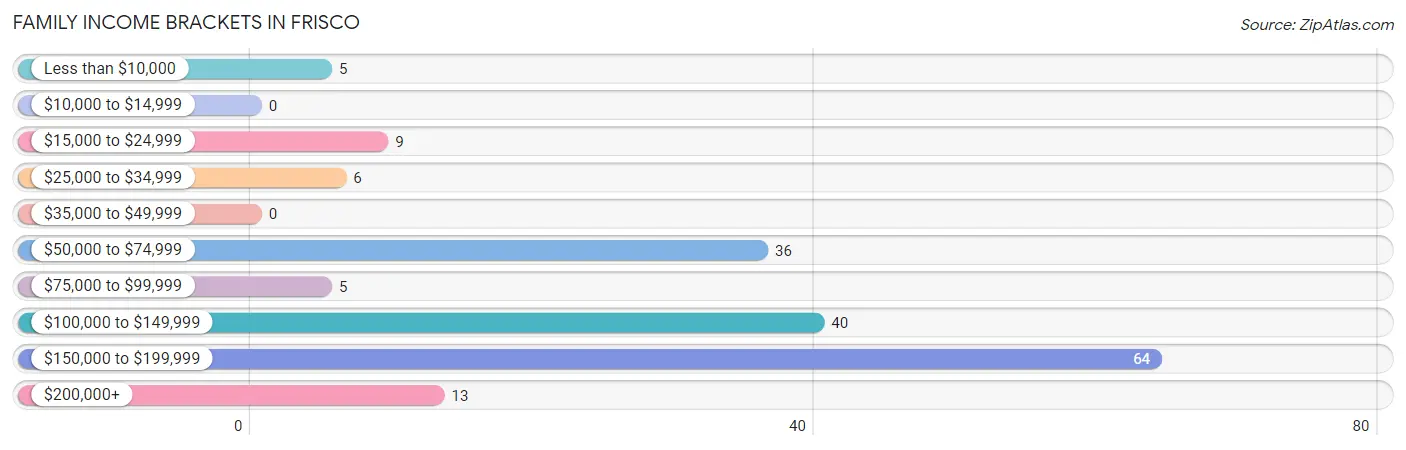
| Income Bracket | # Families | % Families |
| Less than $10,000 | 5 | 2.8% |
| $10,000 to $14,999 | 0 | 0.0% |
| $15,000 to $24,999 | 9 | 5.1% |
| $25,000 to $34,999 | 6 | 3.4% |
| $35,000 to $49,999 | 0 | 0.0% |
| $50,000 to $74,999 | 36 | 20.2% |
| $75,000 to $99,999 | 5 | 2.8% |
| $100,000 to $149,999 | 40 | 22.5% |
| $150,000 to $199,999 | 64 | 36.0% |
| $200,000+ | 13 | 7.3% |
Family Income by Famaliy Size in Frisco
2-person families (91 | 51.1%) account for the highest median family income in Frisco with $103,657 per family, while 2-person families (91 | 51.1%) have the highest median income of $51,828 per family member.
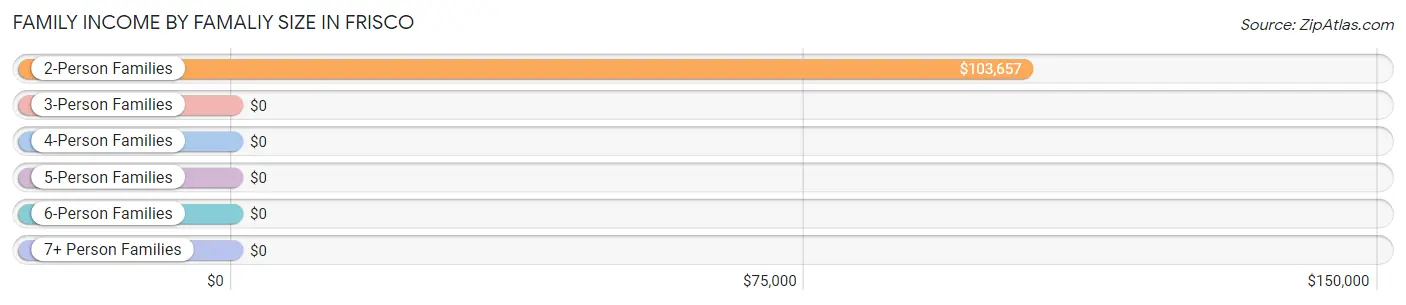
| Income Bracket | # Families | Median Income |
| 2-Person Families | 91 (51.1%) | $103,657 |
| 3-Person Families | 32 (18.0%) | $0 |
| 4-Person Families | 0 (0.0%) | $0 |
| 5-Person Families | 55 (30.9%) | $0 |
| 6-Person Families | 0 (0.0%) | $0 |
| 7+ Person Families | 0 (0.0%) | $0 |
| Total | 178 (100.0%) | $125,192 |
Family Income by Number of Earners in Frisco
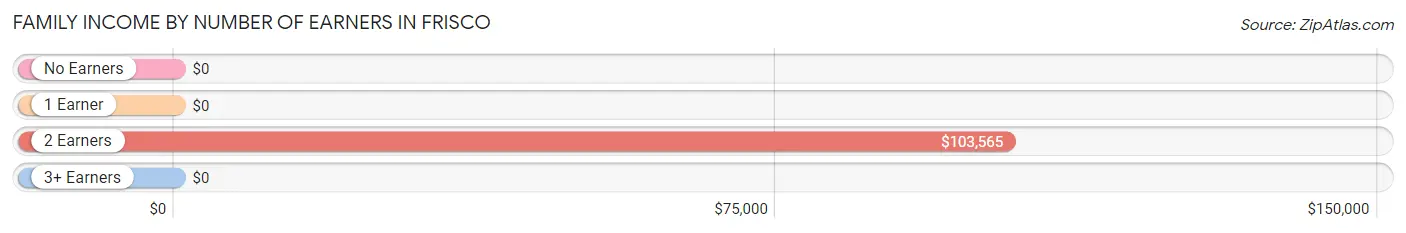
| Number of Earners | # Families | Median Income |
| No Earners | 29 (16.3%) | $0 |
| 1 Earner | 13 (7.3%) | $0 |
| 2 Earners | 123 (69.1%) | $103,565 |
| 3+ Earners | 13 (7.3%) | $0 |
| Total | 178 (100.0%) | $125,192 |
Household Income in Frisco
Household Income Brackets in Frisco
With 107 households falling in the category, the $35,000 to $49,999 income range is the most frequent in Frisco, accounting for 30.8% of all households. In contrast, only 5 households (1.4%) fall into the $75,000 to $99,999 income bracket, making it the least populous group.
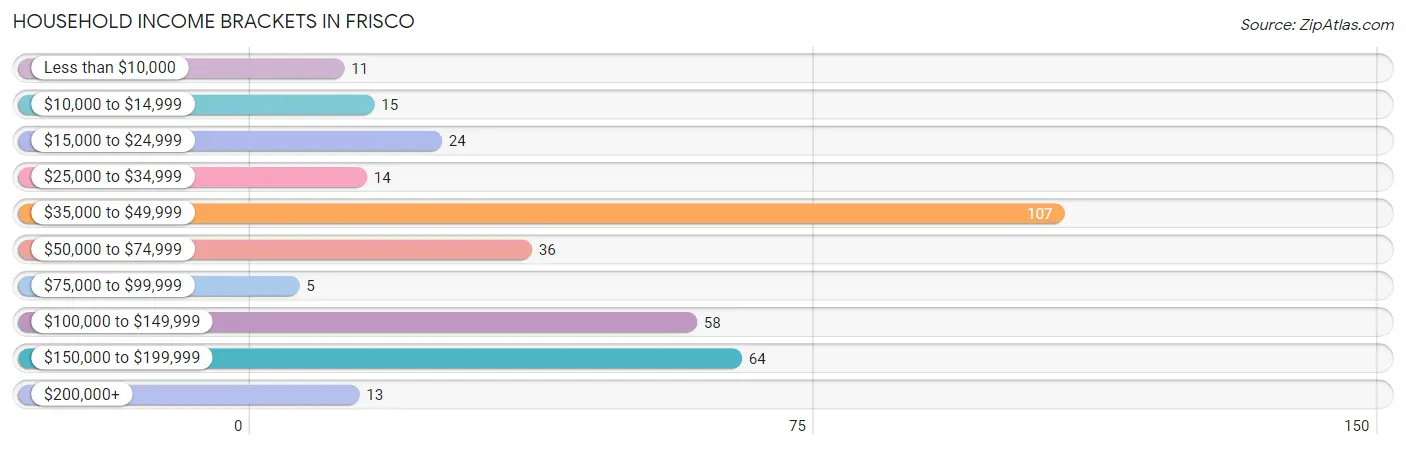
| Income Bracket | # Households | % Households |
| Less than $10,000 | 11 | 3.2% |
| $10,000 to $14,999 | 15 | 4.3% |
| $15,000 to $24,999 | 24 | 6.9% |
| $25,000 to $34,999 | 14 | 4.0% |
| $35,000 to $49,999 | 107 | 30.8% |
| $50,000 to $74,999 | 36 | 10.4% |
| $75,000 to $99,999 | 5 | 1.4% |
| $100,000 to $149,999 | 58 | 16.7% |
| $150,000 to $199,999 | 64 | 18.4% |
| $200,000+ | 13 | 3.7% |
Household Income by Householder Age in Frisco
The median household income in Frisco is $65,368, with the highest median household income of $170,788 found in the 25 to 44 years age bracket for the primary householder. A total of 63 households (18.2%) fall into this category.
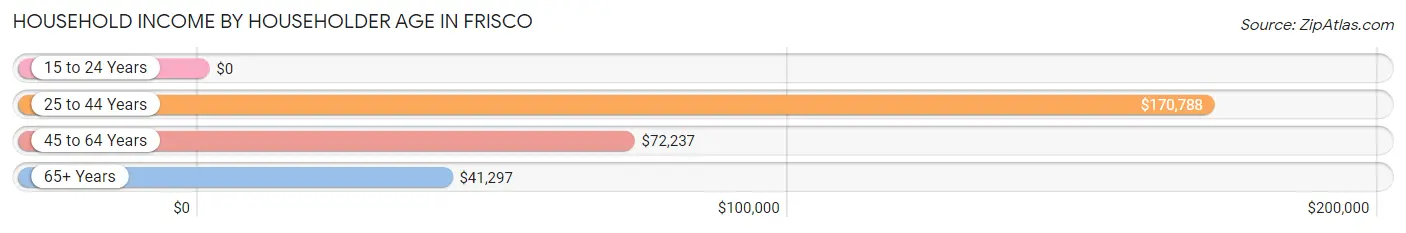
| Income Bracket | # Households | Median Income |
| 15 to 24 Years | 0 (0.0%) | $0 |
| 25 to 44 Years | 63 (18.2%) | $170,788 |
| 45 to 64 Years | 130 (37.5%) | $72,237 |
| 65+ Years | 154 (44.4%) | $41,297 |
| Total | 347 (100.0%) | $65,368 |
Poverty in Frisco
Income Below Poverty by Sex and Age in Frisco
With 27.6% poverty level for males and 4.0% for females among the residents of Frisco, 75 year old and over males and 25 to 34 year old females are the most vulnerable to poverty, with 5 males (100.0%) and 9 females (100.0%) in their respective age groups living below the poverty level.
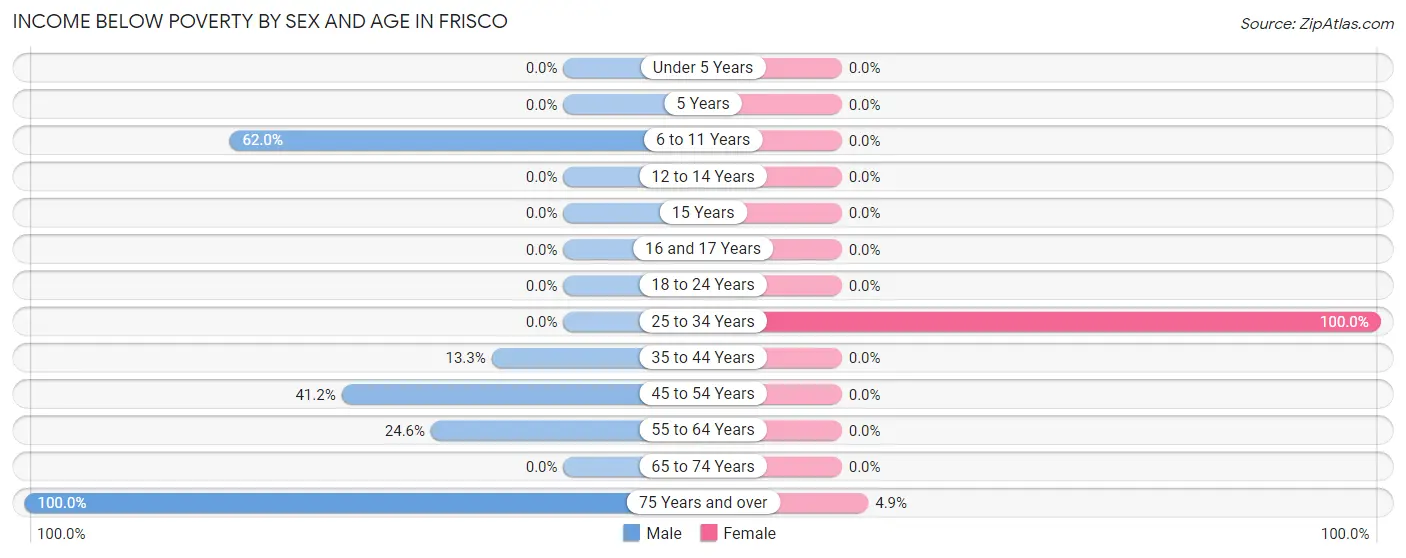
| Age Bracket | Male | Female |
| Under 5 Years | 0 (0.0%) | 0 (0.0%) |
| 5 Years | 0 (0.0%) | 0 (0.0%) |
| 6 to 11 Years | 57 (62.0%) | 0 (0.0%) |
| 12 to 14 Years | 0 (0.0%) | 0 (0.0%) |
| 15 Years | 0 (0.0%) | 0 (0.0%) |
| 16 and 17 Years | 0 (0.0%) | 0 (0.0%) |
| 18 to 24 Years | 0 (0.0%) | 0 (0.0%) |
| 25 to 34 Years | 0 (0.0%) | 9 (100.0%) |
| 35 to 44 Years | 8 (13.3%) | 0 (0.0%) |
| 45 to 54 Years | 14 (41.2%) | 0 (0.0%) |
| 55 to 64 Years | 15 (24.6%) | 0 (0.0%) |
| 65 to 74 Years | 0 (0.0%) | 0 (0.0%) |
| 75 Years and over | 5 (100.0%) | 3 (4.9%) |
| Total | 99 (27.6%) | 12 (4.0%) |
Income Above Poverty by Sex and Age in Frisco
According to the poverty statistics in Frisco, males aged 18 to 24 years and females aged under 5 years are the age groups that are most secure financially, with 100.0% of males and 100.0% of females in these age groups living above the poverty line.
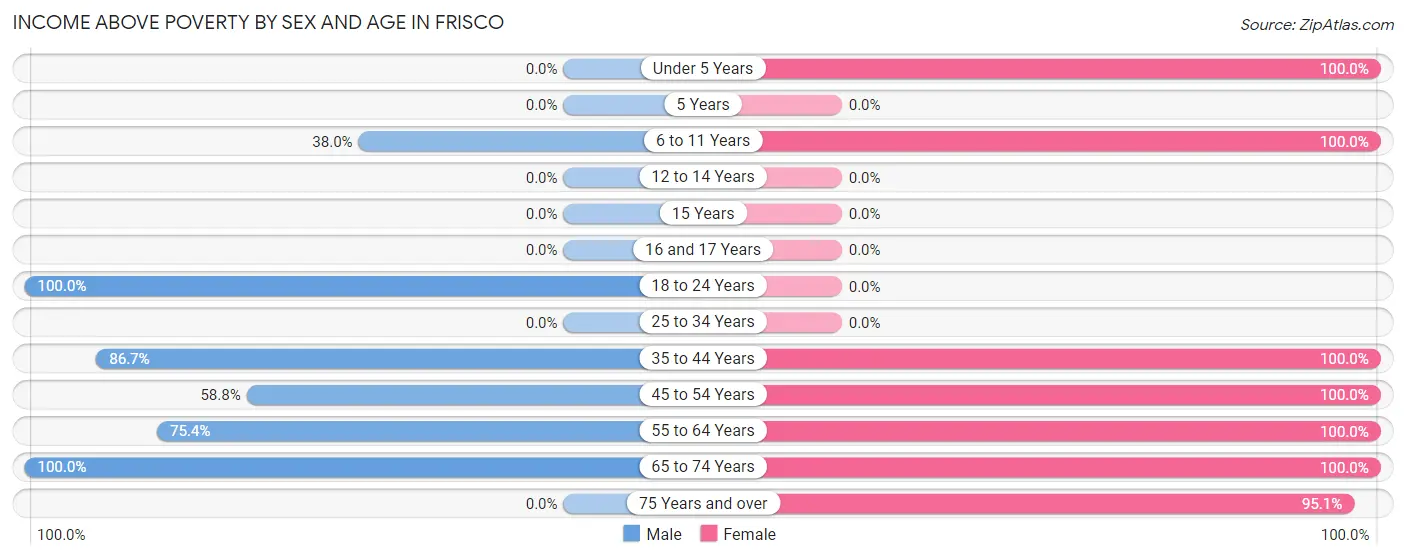
| Age Bracket | Male | Female |
| Under 5 Years | 0 (0.0%) | 17 (100.0%) |
| 5 Years | 0 (0.0%) | 0 (0.0%) |
| 6 to 11 Years | 35 (38.0%) | 17 (100.0%) |
| 12 to 14 Years | 0 (0.0%) | 0 (0.0%) |
| 15 Years | 0 (0.0%) | 0 (0.0%) |
| 16 and 17 Years | 0 (0.0%) | 0 (0.0%) |
| 18 to 24 Years | 24 (100.0%) | 0 (0.0%) |
| 25 to 34 Years | 0 (0.0%) | 0 (0.0%) |
| 35 to 44 Years | 52 (86.7%) | 54 (100.0%) |
| 45 to 54 Years | 20 (58.8%) | 66 (100.0%) |
| 55 to 64 Years | 46 (75.4%) | 43 (100.0%) |
| 65 to 74 Years | 83 (100.0%) | 33 (100.0%) |
| 75 Years and over | 0 (0.0%) | 58 (95.1%) |
| Total | 260 (72.4%) | 288 (96.0%) |
Income Below Poverty Among Married-Couple Families in Frisco
The poverty statistics for married-couple families in Frisco show that 8.5% or 14 of the total 165 families live below the poverty line. Families with 3 or 4 children have the highest poverty rate of 16.4%, comprising of 9 families. On the other hand, families with 1 or 2 children have the lowest poverty rate of 0.0%, which includes 0 families.
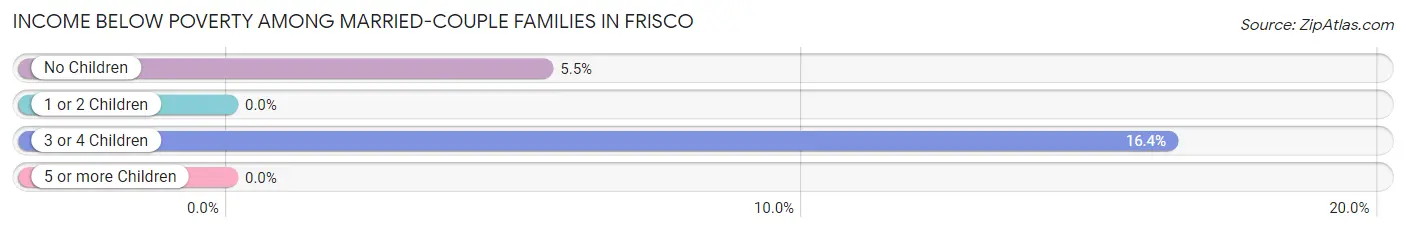
| Children | Above Poverty | Below Poverty |
| No Children | 86 (94.5%) | 5 (5.5%) |
| 1 or 2 Children | 19 (100.0%) | 0 (0.0%) |
| 3 or 4 Children | 46 (83.6%) | 9 (16.4%) |
| 5 or more Children | 0 (0.0%) | 0 (0.0%) |
| Total | 151 (91.5%) | 14 (8.5%) |
Income Below Poverty Among Single-Parent Households in Frisco
| Children | Single Father | Single Mother |
| No Children | 0 (0.0%) | 0 (0.0%) |
| 1 or 2 Children | 0 (0.0%) | 0 (0.0%) |
| 3 or 4 Children | 0 (0.0%) | 0 (0.0%) |
| 5 or more Children | 0 (0.0%) | 0 (0.0%) |
| Total | 0 (0.0%) | 0 (0.0%) |
Income Below Poverty Among Married-Couple vs Single-Parent Households in Frisco
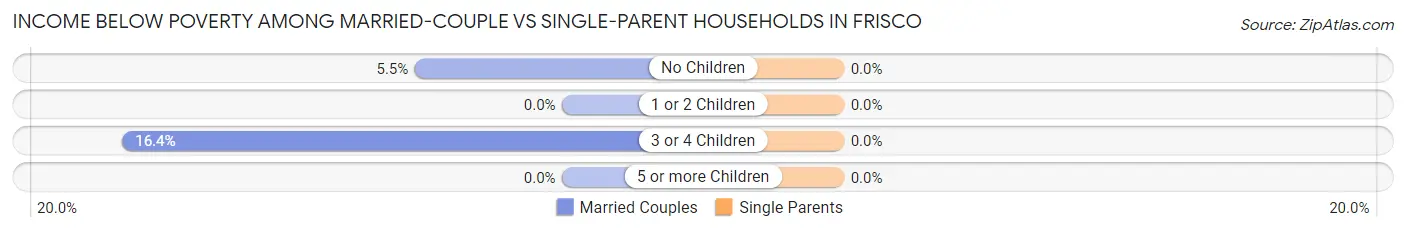
| Children | Married-Couple Families | Single-Parent Households |
| No Children | 5 (5.5%) | 0 (0.0%) |
| 1 or 2 Children | 0 (0.0%) | 0 (0.0%) |
| 3 or 4 Children | 9 (16.4%) | 0 (0.0%) |
| 5 or more Children | 0 (0.0%) | 0 (0.0%) |
| Total | 14 (8.5%) | 0 (0.0%) |
Race in Frisco
The most populous races in Frisco are White / Caucasian (562 | 85.3%), Two or more Races (97 | 14.7%), and Hispanic or Latino (74 | 11.2%).
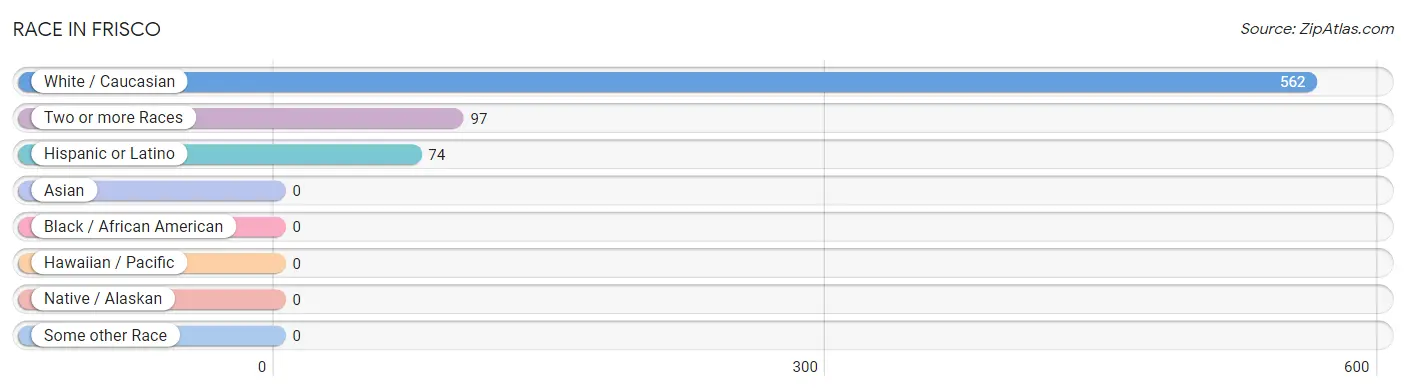
| Race | # Population | % Population |
| Asian | 0 | 0.0% |
| Black / African American | 0 | 0.0% |
| Hawaiian / Pacific | 0 | 0.0% |
| Hispanic or Latino | 74 | 11.2% |
| Native / Alaskan | 0 | 0.0% |
| White / Caucasian | 562 | 85.3% |
| Two or more Races | 97 | 14.7% |
| Some other Race | 0 | 0.0% |
| Total | 659 | 100.0% |
Ancestry in Frisco
The most populous ancestries reported in Frisco are English (121 | 18.4%), German (109 | 16.5%), Korean (97 | 14.7%), Mexican (74 | 11.2%), and American (70 | 10.6%), together accounting for 71.5% of all Frisco residents.
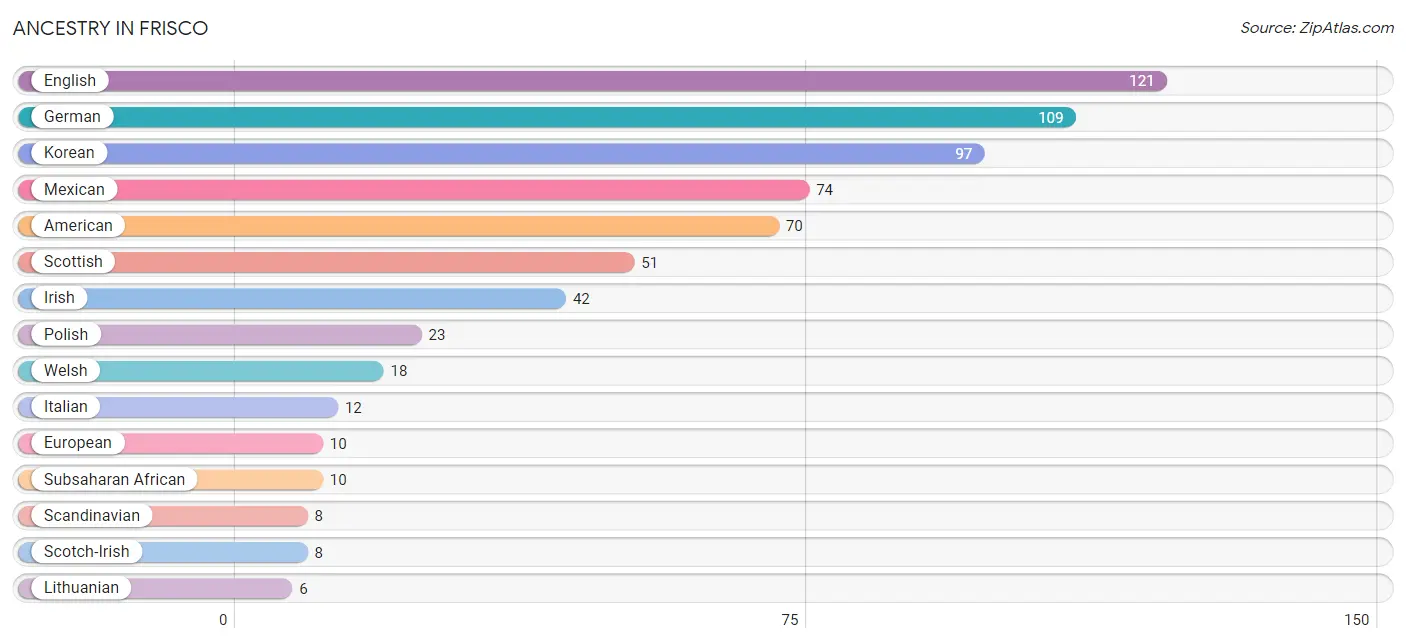
| Ancestry | # Population | % Population |
| American | 70 | 10.6% |
| Dutch | 5 | 0.8% |
| English | 121 | 18.4% |
| European | 10 | 1.5% |
| German | 109 | 16.5% |
| Irish | 42 | 6.4% |
| Italian | 12 | 1.8% |
| Korean | 97 | 14.7% |
| Lithuanian | 6 | 0.9% |
| Mexican | 74 | 11.2% |
| Polish | 23 | 3.5% |
| Scandinavian | 8 | 1.2% |
| Scotch-Irish | 8 | 1.2% |
| Scottish | 51 | 7.7% |
| Subsaharan African | 10 | 1.5% |
| Swedish | 6 | 0.9% |
| Welsh | 18 | 2.7% | View All 17 Rows |
Immigrants in Frisco
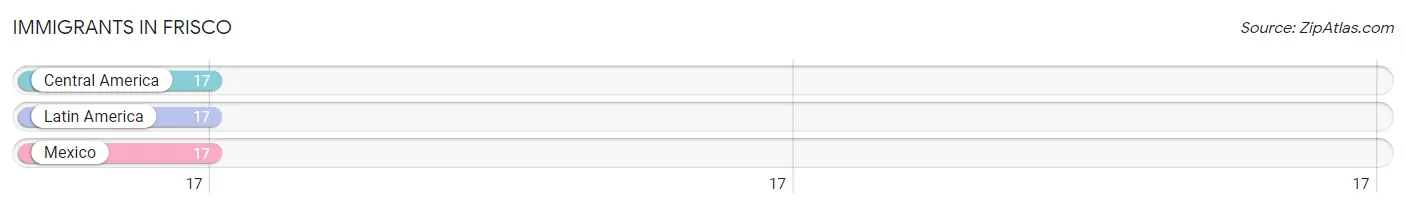
The most numerous immigrant groups reported in Frisco came from Central America (17 | 2.6%), Latin America (17 | 2.6%), and Mexico (17 | 2.6%), together accounting for 7.7% of all Frisco residents.
| Immigration Origin | # Population | % Population |
| Central America | 17 | 2.6% |
| Latin America | 17 | 2.6% |
| Mexico | 17 | 2.6% | View All 3 Rows |
Sex and Age in Frisco
Sex and Age in Frisco
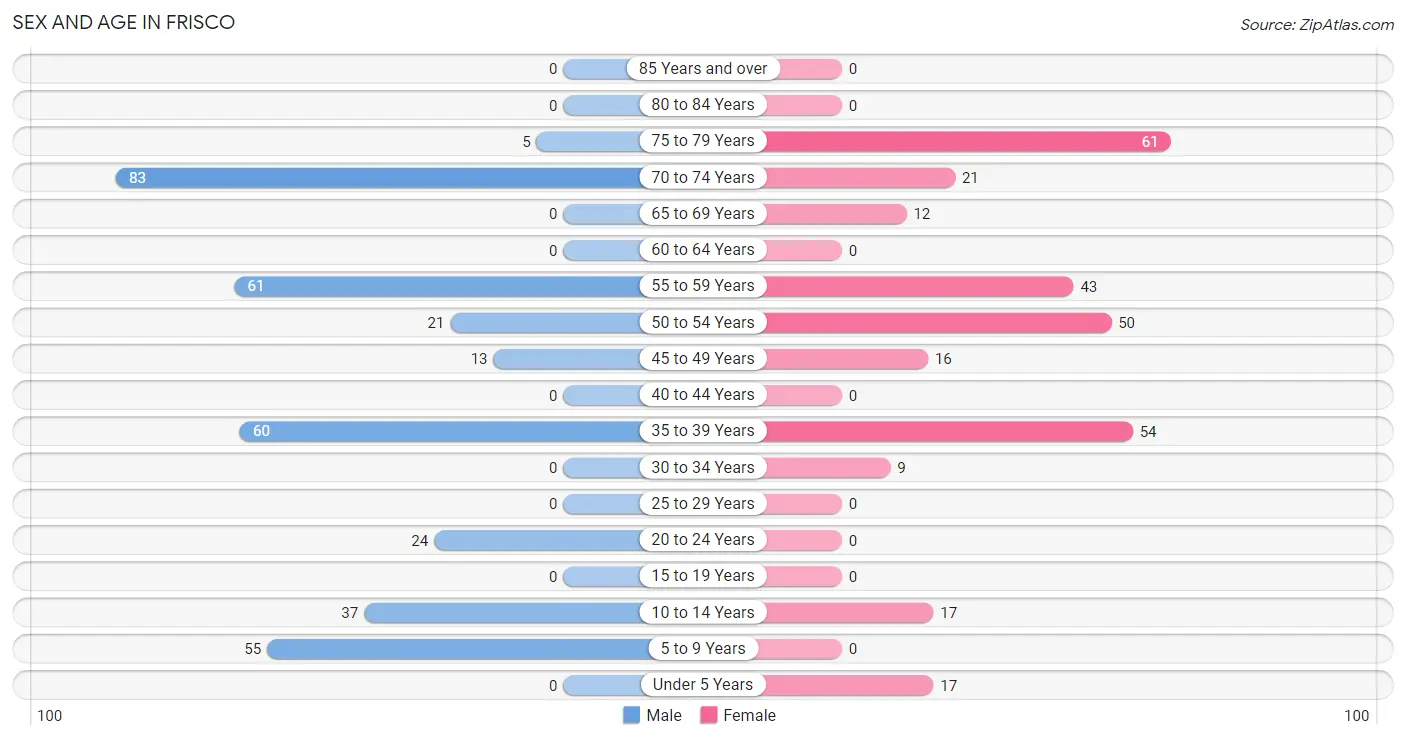
The most populous age groups in Frisco are 70 to 74 Years (83 | 23.1%) for men and 75 to 79 Years (61 | 20.3%) for women.
| Age Bracket | Male | Female |
| Under 5 Years | 0 (0.0%) | 17 (5.7%) |
| 5 to 9 Years | 55 (15.3%) | 0 (0.0%) |
| 10 to 14 Years | 37 (10.3%) | 17 (5.7%) |
| 15 to 19 Years | 0 (0.0%) | 0 (0.0%) |
| 20 to 24 Years | 24 (6.7%) | 0 (0.0%) |
| 25 to 29 Years | 0 (0.0%) | 0 (0.0%) |
| 30 to 34 Years | 0 (0.0%) | 9 (3.0%) |
| 35 to 39 Years | 60 (16.7%) | 54 (18.0%) |
| 40 to 44 Years | 0 (0.0%) | 0 (0.0%) |
| 45 to 49 Years | 13 (3.6%) | 16 (5.3%) |
| 50 to 54 Years | 21 (5.9%) | 50 (16.7%) |
| 55 to 59 Years | 61 (17.0%) | 43 (14.3%) |
| 60 to 64 Years | 0 (0.0%) | 0 (0.0%) |
| 65 to 69 Years | 0 (0.0%) | 12 (4.0%) |
| 70 to 74 Years | 83 (23.1%) | 21 (7.0%) |
| 75 to 79 Years | 5 (1.4%) | 61 (20.3%) |
| 80 to 84 Years | 0 (0.0%) | 0 (0.0%) |
| 85 Years and over | 0 (0.0%) | 0 (0.0%) |
| Total | 359 (100.0%) | 300 (100.0%) |
Families and Households in Frisco
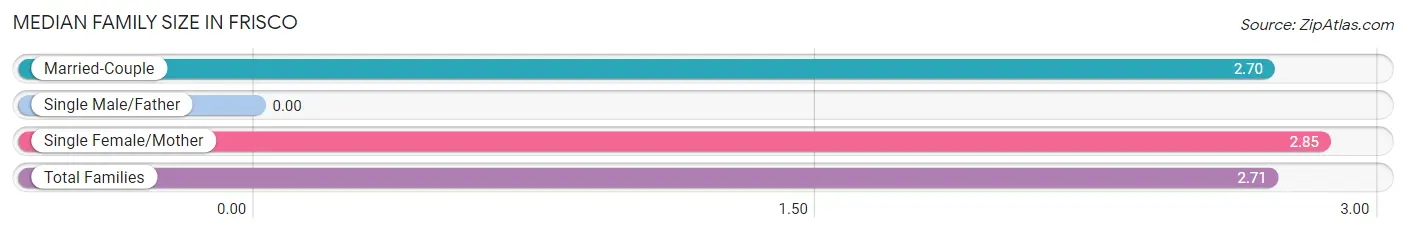
Median Family Size in Frisco
| Family Type | # Families | Family Size |
| Married-Couple | 165 (92.7%) | 2.70 |
| Single Male/Father | 0 (0.0%) | - |
| Single Female/Mother | 13 (7.3%) | 2.85 |
| Total Families | 178 (100.0%) | 2.71 |
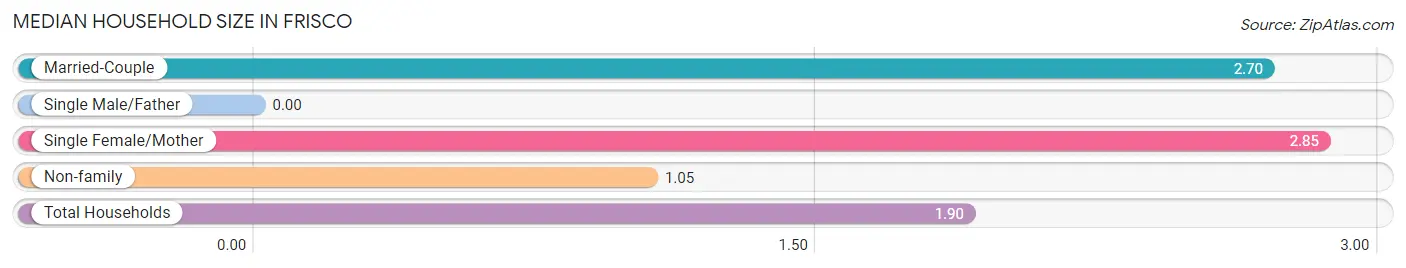
Median Household Size in Frisco
| Household Type | # Households | Household Size |
| Married-Couple | 165 (47.5%) | 2.70 |
| Single Male/Father | 0 (0.0%) | - |
| Single Female/Mother | 13 (3.7%) | 2.85 |
| Non-family | 169 (48.7%) | 1.05 |
| Total Households | 347 (100.0%) | 1.90 |
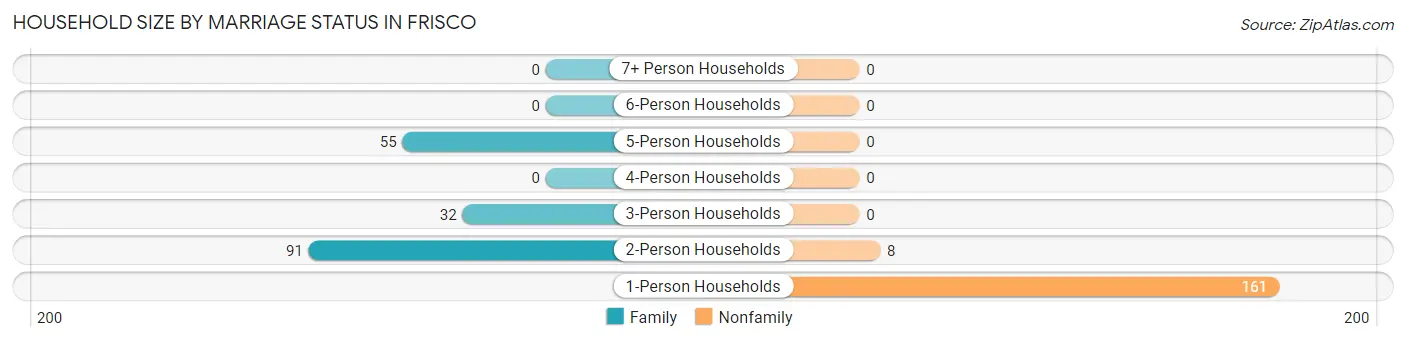
Household Size by Marriage Status in Frisco
Out of a total of 347 households in Frisco, 178 (51.3%) are family households, while 169 (48.7%) are nonfamily households. The most numerous type of family households are 2-person households, comprising 91, and the most common type of nonfamily households are 1-person households, comprising 161.
| Household Size | Family Households | Nonfamily Households |
| 1-Person Households | - | 161 (46.4%) |
| 2-Person Households | 91 (26.2%) | 8 (2.3%) |
| 3-Person Households | 32 (9.2%) | 0 (0.0%) |
| 4-Person Households | 0 (0.0%) | 0 (0.0%) |
| 5-Person Households | 55 (15.9%) | 0 (0.0%) |
| 6-Person Households | 0 (0.0%) | 0 (0.0%) |
| 7+ Person Households | 0 (0.0%) | 0 (0.0%) |
| Total | 178 (51.3%) | 169 (48.7%) |
Female Fertility in Frisco
Fertility by Age in Frisco
| Age Bracket | Women with Births | Births / 1,000 Women |
| 15 to 19 years | 0 (0.0%) | 0.0 |
| 20 to 34 years | 0 (0.0%) | 0.0 |
| 35 to 50 years | 0 (0.0%) | 0.0 |
| Total | 0 (0.0%) | 0.0 |
Fertility by Age by Marriage Status in Frisco
| Age Bracket | Married | Unmarried |
| 15 to 19 years | 0 (0.0%) | 0 (0.0%) |
| 20 to 34 years | 0 (0.0%) | 0 (0.0%) |
| 35 to 50 years | 0 (0.0%) | 0 (0.0%) |
| Total | 0 (0.0%) | 0 (0.0%) |
Fertility by Education in Frisco
| Educational Attainment | Women with Births | Births / 1,000 Women |
| Less than High School | 0 (0.0%) | 0.0 |
| High School Diploma | 0 (0.0%) | 0.0 |
| College or Associate's Degree | 0 (0.0%) | 0.0 |
| Bachelor's Degree | 0 (0.0%) | 0.0 |
| Graduate Degree | 0 (0.0%) | 0.0 |
| Total | 0 (0.0%) | 0.0 |
Fertility by Education by Marriage Status in Frisco
| Educational Attainment | Married | Unmarried |
| Less than High School | 0 (0.0%) | 0 (0.0%) |
| High School Diploma | 0 (0.0%) | 0 (0.0%) |
| College or Associate's Degree | 0 (0.0%) | 0 (0.0%) |
| Bachelor's Degree | 0 (0.0%) | 0 (0.0%) |
| Graduate Degree | 0 (0.0%) | 0 (0.0%) |
| Total | 0 (0.0%) | 0 (0.0%) |
Employment Characteristics in Frisco
Employment by Class of Employer in Frisco
Among the 389 employed individuals in Frisco, private company employees (164 | 42.2%), self-employed (incorporated) (96 | 24.7%), and self-employed (not incorporated) (67 | 17.2%) make up the most common classes of employment.
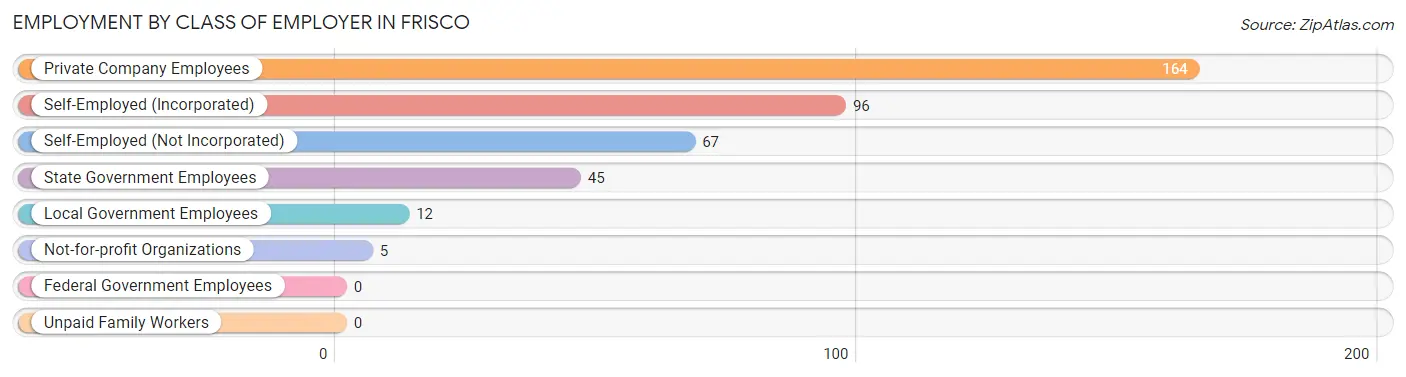
| Employer Class | # Employees | % Employees |
| Private Company Employees | 164 | 42.2% |
| Self-Employed (Incorporated) | 96 | 24.7% |
| Self-Employed (Not Incorporated) | 67 | 17.2% |
| Not-for-profit Organizations | 5 | 1.3% |
| Local Government Employees | 12 | 3.1% |
| State Government Employees | 45 | 11.6% |
| Federal Government Employees | 0 | 0.0% |
| Unpaid Family Workers | 0 | 0.0% |
| Total | 389 | 100.0% |
Employment Status by Age in Frisco
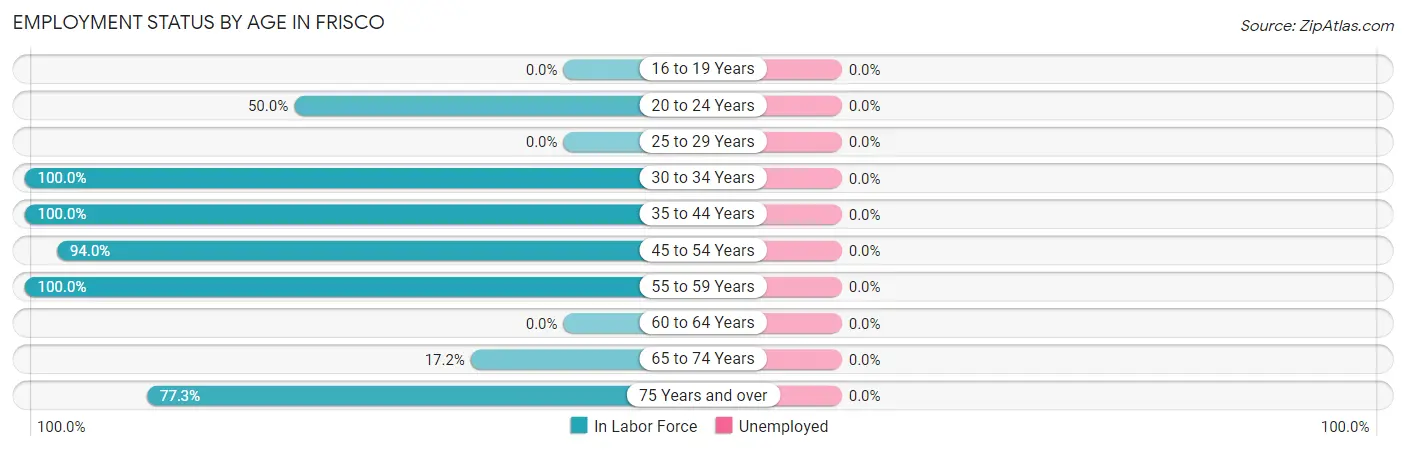
| Age Bracket | In Labor Force | Unemployed |
| 16 to 19 Years | 0 (0.0%) | 0 (0.0%) |
| 20 to 24 Years | 12 (50.0%) | 0 (0.0%) |
| 25 to 29 Years | 0 (0.0%) | 0 (0.0%) |
| 30 to 34 Years | 9 (100.0%) | 0 (0.0%) |
| 35 to 44 Years | 114 (100.0%) | 0 (0.0%) |
| 45 to 54 Years | 94 (94.0%) | 0 (0.0%) |
| 55 to 59 Years | 104 (100.0%) | 0 (0.0%) |
| 60 to 64 Years | 0 (0.0%) | 0 (0.0%) |
| 65 to 74 Years | 20 (17.2%) | 0 (0.0%) |
| 75 Years and over | 51 (77.3%) | 0 (0.0%) |
| Total | 404 (75.8%) | 0 (0.0%) |
Employment Status by Educational Attainment in Frisco
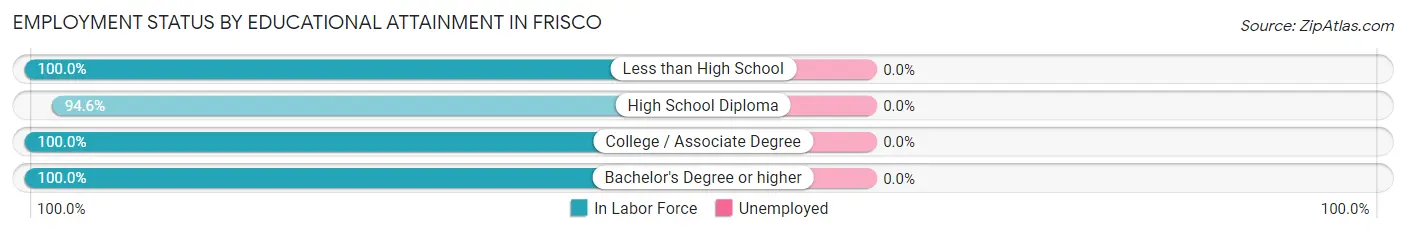
| Educational Attainment | In Labor Force | Unemployed |
| Less than High School | 23 (100.0%) | 0 (0.0%) |
| High School Diploma | 106 (94.6%) | 0 (0.0%) |
| College / Associate Degree | 70 (100.0%) | 0 (0.0%) |
| Bachelor's Degree or higher | 122 (100.0%) | 0 (0.0%) |
| Total | 321 (98.2%) | 0 (0.0%) |
Employment Occupations by Sex in Frisco
Management, Business, Science and Arts Occupations
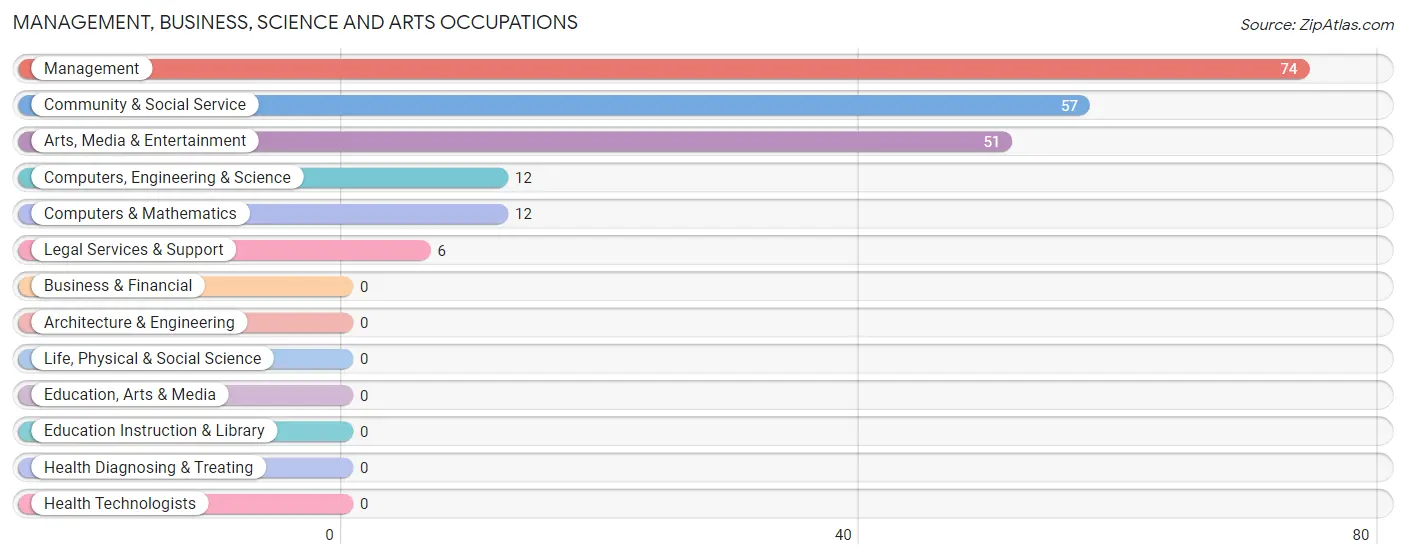
The most common Management, Business, Science and Arts occupations in Frisco are Management (74 | 18.3%), Community & Social Service (57 | 14.1%), Arts, Media & Entertainment (51 | 12.6%), Computers, Engineering & Science (12 | 3.0%), and Computers & Mathematics (12 | 3.0%).
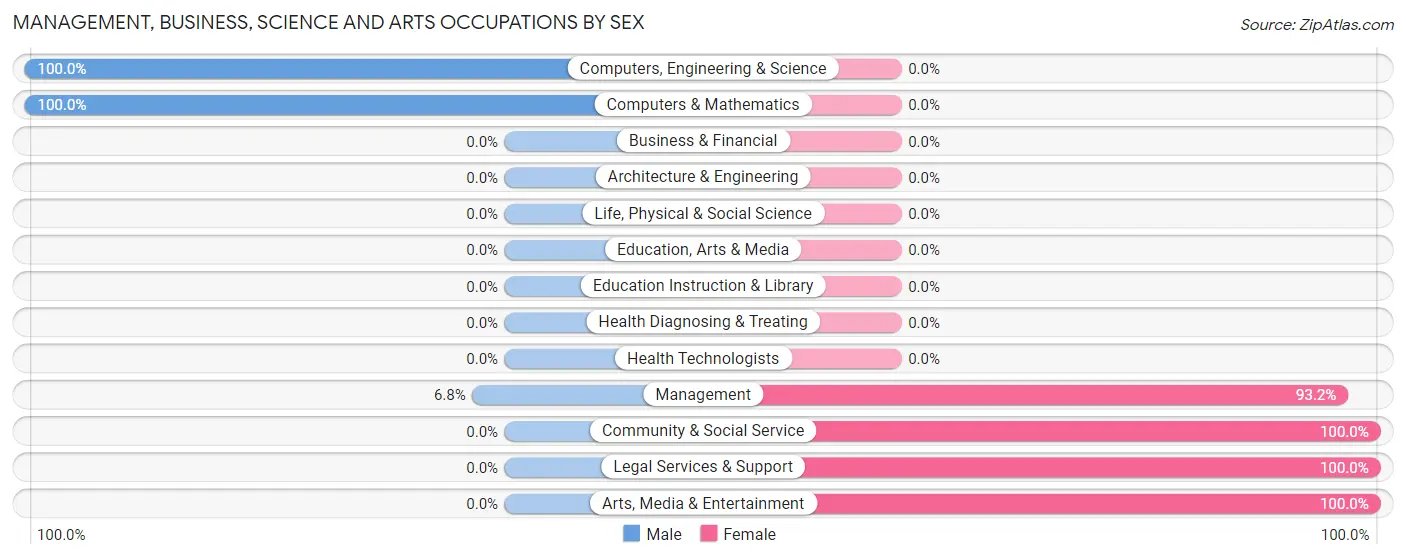
Management, Business, Science and Arts Occupations by Sex
Within the Management, Business, Science and Arts occupations in Frisco, the most male-oriented occupations are Computers, Engineering & Science (100.0%), Computers & Mathematics (100.0%), and Management (6.8%), while the most female-oriented occupations are Community & Social Service (100.0%), Legal Services & Support (100.0%), and Arts, Media & Entertainment (100.0%).
| Occupation | Male | Female |
| Management | 5 (6.8%) | 69 (93.2%) |
| Business & Financial | 0 (0.0%) | 0 (0.0%) |
| Computers, Engineering & Science | 12 (100.0%) | 0 (0.0%) |
| Computers & Mathematics | 12 (100.0%) | 0 (0.0%) |
| Architecture & Engineering | 0 (0.0%) | 0 (0.0%) |
| Life, Physical & Social Science | 0 (0.0%) | 0 (0.0%) |
| Community & Social Service | 0 (0.0%) | 57 (100.0%) |
| Education, Arts & Media | 0 (0.0%) | 0 (0.0%) |
| Legal Services & Support | 0 (0.0%) | 6 (100.0%) |
| Education Instruction & Library | 0 (0.0%) | 0 (0.0%) |
| Arts, Media & Entertainment | 0 (0.0%) | 51 (100.0%) |
| Health Diagnosing & Treating | 0 (0.0%) | 0 (0.0%) |
| Health Technologists | 0 (0.0%) | 0 (0.0%) |
| Total (Category) | 17 (11.9%) | 126 (88.1%) |
| Total (Overall) | 169 (41.8%) | 235 (58.2%) |
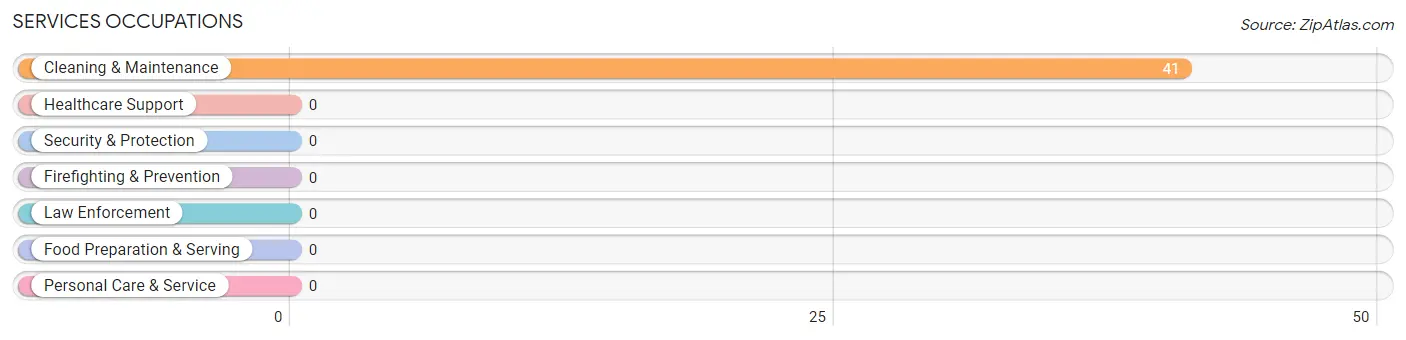
Services Occupations
The most common Services occupations in Frisco are , and Cleaning & Maintenance (41 | 10.2%).
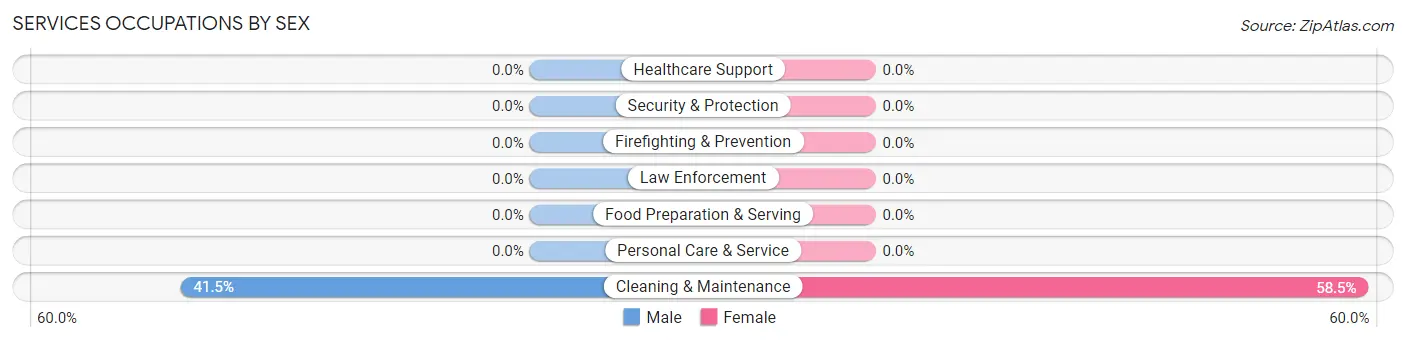
Services Occupations by Sex
| Occupation | Male | Female |
| Healthcare Support | 0 (0.0%) | 0 (0.0%) |
| Security & Protection | 0 (0.0%) | 0 (0.0%) |
| Firefighting & Prevention | 0 (0.0%) | 0 (0.0%) |
| Law Enforcement | 0 (0.0%) | 0 (0.0%) |
| Food Preparation & Serving | 0 (0.0%) | 0 (0.0%) |
| Cleaning & Maintenance | 17 (41.5%) | 24 (58.5%) |
| Personal Care & Service | 0 (0.0%) | 0 (0.0%) |
| Total (Category) | 17 (41.5%) | 24 (58.5%) |
| Total (Overall) | 169 (41.8%) | 235 (58.2%) |
Sales and Office Occupations
The most common Sales and Office occupations in Frisco are Office & Administration (85 | 21.0%), and Sales & Related (8 | 2.0%).
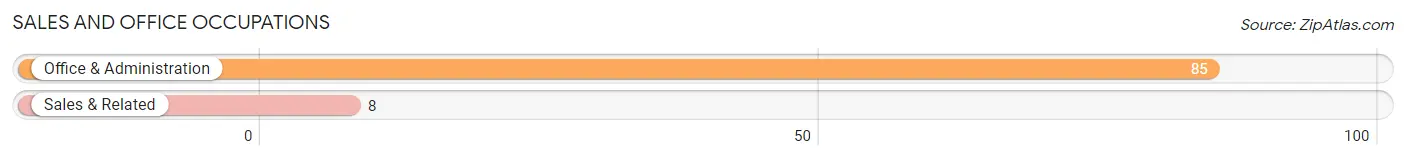
Sales and Office Occupations by Sex

| Occupation | Male | Female |
| Sales & Related | 8 (100.0%) | 0 (0.0%) |
| Office & Administration | 0 (0.0%) | 85 (100.0%) |
| Total (Category) | 8 (8.6%) | 85 (91.4%) |
| Total (Overall) | 169 (41.8%) | 235 (58.2%) |
Natural Resources, Construction and Maintenance Occupations
The most common Natural Resources, Construction and Maintenance occupations in Frisco are Construction & Extraction (89 | 22.0%), and Farming, Fishing & Forestry (30 | 7.4%).
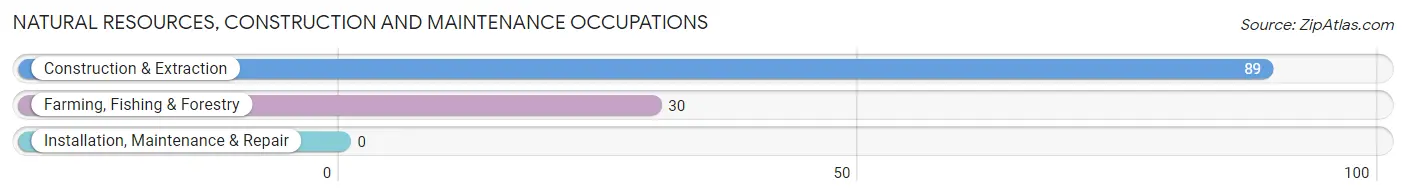
Natural Resources, Construction and Maintenance Occupations by Sex
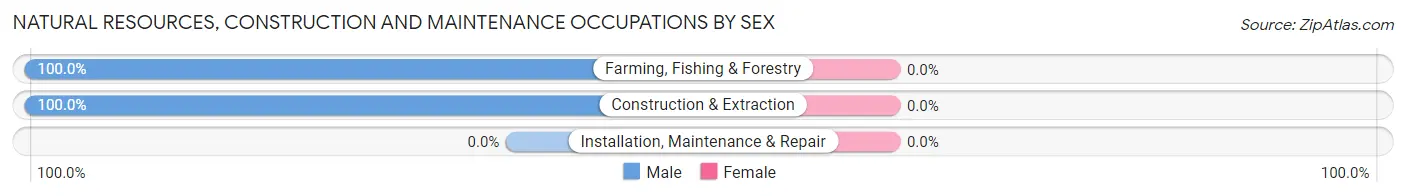
| Occupation | Male | Female |
| Farming, Fishing & Forestry | 30 (100.0%) | 0 (0.0%) |
| Construction & Extraction | 89 (100.0%) | 0 (0.0%) |
| Installation, Maintenance & Repair | 0 (0.0%) | 0 (0.0%) |
| Total (Category) | 119 (100.0%) | 0 (0.0%) |
| Total (Overall) | 169 (41.8%) | 235 (58.2%) |
Production, Transportation and Moving Occupations
The most common Production, Transportation and Moving occupations in Frisco are , and Transportation (8 | 2.0%).
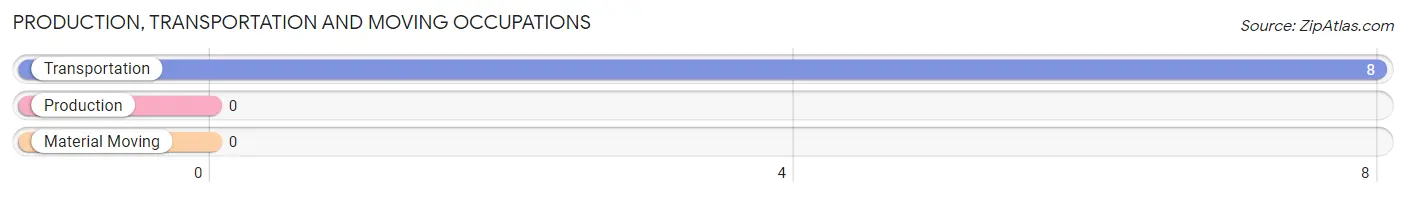
Production, Transportation and Moving Occupations by Sex
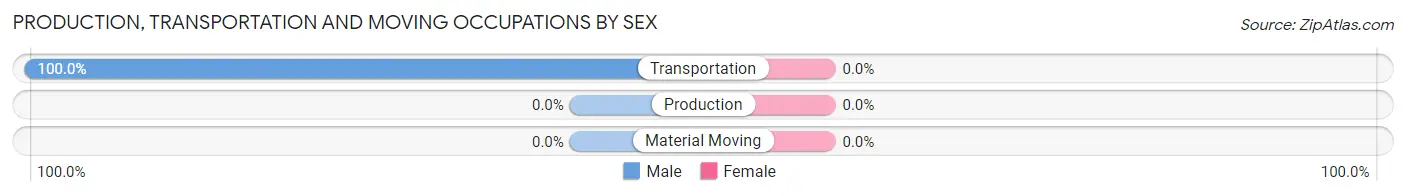
| Occupation | Male | Female |
| Production | 0 (0.0%) | 0 (0.0%) |
| Transportation | 8 (100.0%) | 0 (0.0%) |
| Material Moving | 0 (0.0%) | 0 (0.0%) |
| Total (Category) | 8 (100.0%) | 0 (0.0%) |
| Total (Overall) | 169 (41.8%) | 235 (58.2%) |
Employment Industries by Sex in Frisco
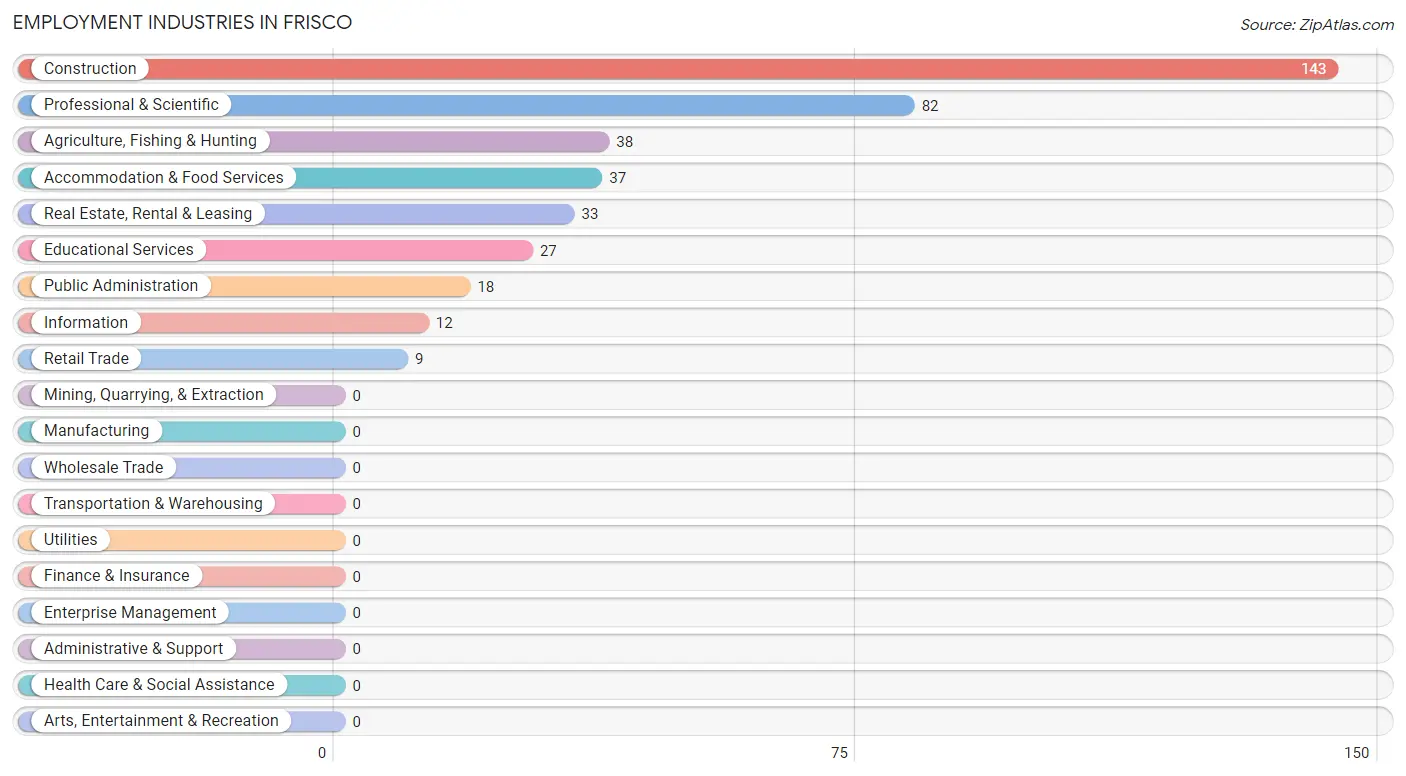
Employment Industries in Frisco
The major employment industries in Frisco include Construction (143 | 35.4%), Professional & Scientific (82 | 20.3%), Agriculture, Fishing & Hunting (38 | 9.4%), Accommodation & Food Services (37 | 9.2%), and Real Estate, Rental & Leasing (33 | 8.2%).
Employment Industries by Sex in Frisco
The Frisco industries that see more men than women are Agriculture, Fishing & Hunting (100.0%), Construction (67.8%), and Real Estate, Rental & Leasing (51.5%), whereas the industries that tend to have a higher number of women are Retail Trade (100.0%), Information (100.0%), and Educational Services (100.0%).
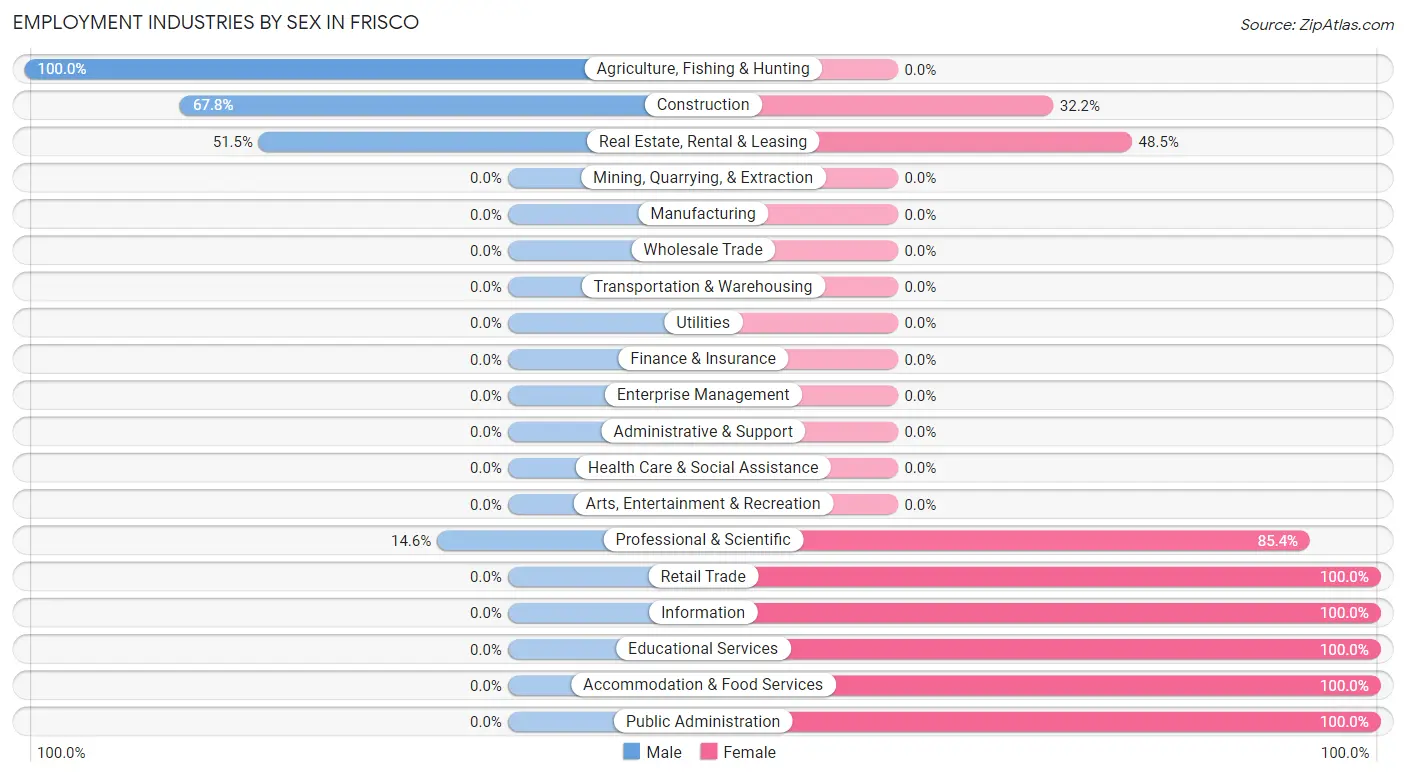
| Industry | Male | Female |
| Agriculture, Fishing & Hunting | 38 (100.0%) | 0 (0.0%) |
| Mining, Quarrying, & Extraction | 0 (0.0%) | 0 (0.0%) |
| Construction | 97 (67.8%) | 46 (32.2%) |
| Manufacturing | 0 (0.0%) | 0 (0.0%) |
| Wholesale Trade | 0 (0.0%) | 0 (0.0%) |
| Retail Trade | 0 (0.0%) | 9 (100.0%) |
| Transportation & Warehousing | 0 (0.0%) | 0 (0.0%) |
| Utilities | 0 (0.0%) | 0 (0.0%) |
| Information | 0 (0.0%) | 12 (100.0%) |
| Finance & Insurance | 0 (0.0%) | 0 (0.0%) |
| Real Estate, Rental & Leasing | 17 (51.5%) | 16 (48.5%) |
| Professional & Scientific | 12 (14.6%) | 70 (85.4%) |
| Enterprise Management | 0 (0.0%) | 0 (0.0%) |
| Administrative & Support | 0 (0.0%) | 0 (0.0%) |
| Educational Services | 0 (0.0%) | 27 (100.0%) |
| Health Care & Social Assistance | 0 (0.0%) | 0 (0.0%) |
| Arts, Entertainment & Recreation | 0 (0.0%) | 0 (0.0%) |
| Accommodation & Food Services | 0 (0.0%) | 37 (100.0%) |
| Public Administration | 0 (0.0%) | 18 (100.0%) |
| Total | 169 (41.8%) | 235 (58.2%) |
Education in Frisco
School Enrollment in Frisco
The most common levels of schooling among the 133 students in Frisco are elementary school (72 | 54.1%), middle school (37 | 27.8%), and college / undergraduate (24 | 18.0%).
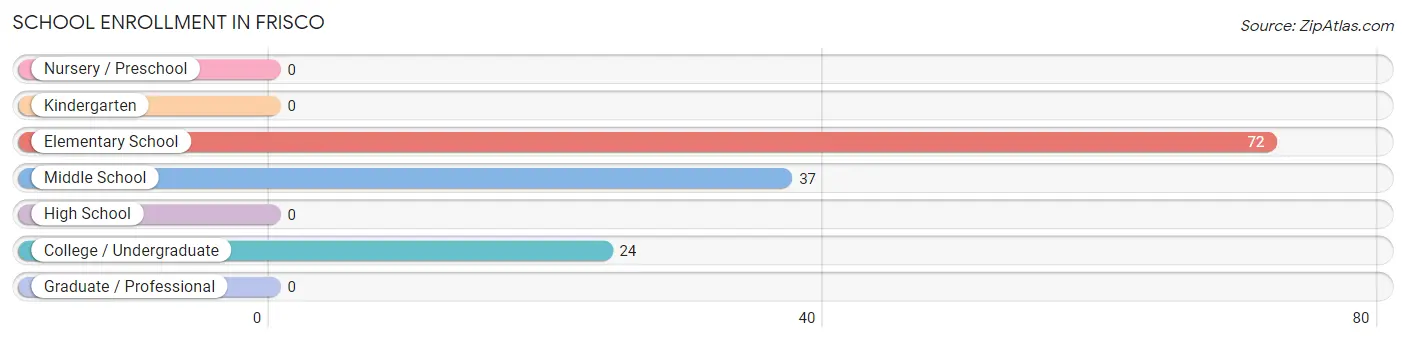
| School Level | # Students | % Students |
| Nursery / Preschool | 0 | 0.0% |
| Kindergarten | 0 | 0.0% |
| Elementary School | 72 | 54.1% |
| Middle School | 37 | 27.8% |
| High School | 0 | 0.0% |
| College / Undergraduate | 24 | 18.0% |
| Graduate / Professional | 0 | 0.0% |
| Total | 133 | 100.0% |
School Enrollment by Age by Funding Source in Frisco
Out of a total of 133 students who are enrolled in schools in Frisco, 12 (9.0%) attend a private institution, while the remaining 121 (91.0%) are enrolled in public schools. The age group of 35 years and over has the highest likelihood of being enrolled in private schools, with 12 (100.0% in the age bracket) enrolled. Conversely, the age group of 5 to 9 year old has the lowest likelihood of being enrolled in a private school, with 55 (100.0% in the age bracket) attending a public institution.

| Age Bracket | Public School | Private School |
| 3 to 4 Year Olds | 0 (0.0%) | 0 (0.0%) |
| 5 to 9 Year Old | 55 (100.0%) | 0 (0.0%) |
| 10 to 14 Year Olds | 54 (100.0%) | 0 (0.0%) |
| 15 to 17 Year Olds | 0 (0.0%) | 0 (0.0%) |
| 18 to 19 Year Olds | 0 (0.0%) | 0 (0.0%) |
| 20 to 24 Year Olds | 12 (100.0%) | 0 (0.0%) |
| 25 to 34 Year Olds | 0 (0.0%) | 0 (0.0%) |
| 35 Years and over | 0 (0.0%) | 12 (100.0%) |
| Total | 121 (91.0%) | 12 (9.0%) |
Educational Attainment by Field of Study in Frisco
Business (98 | 59.0%), bio, nature & agricultural (18 | 10.8%), engineering (18 | 10.8%), social sciences (13 | 7.8%), and communications (13 | 7.8%) are the most common fields of study among 166 individuals in Frisco who have obtained a bachelor's degree or higher.
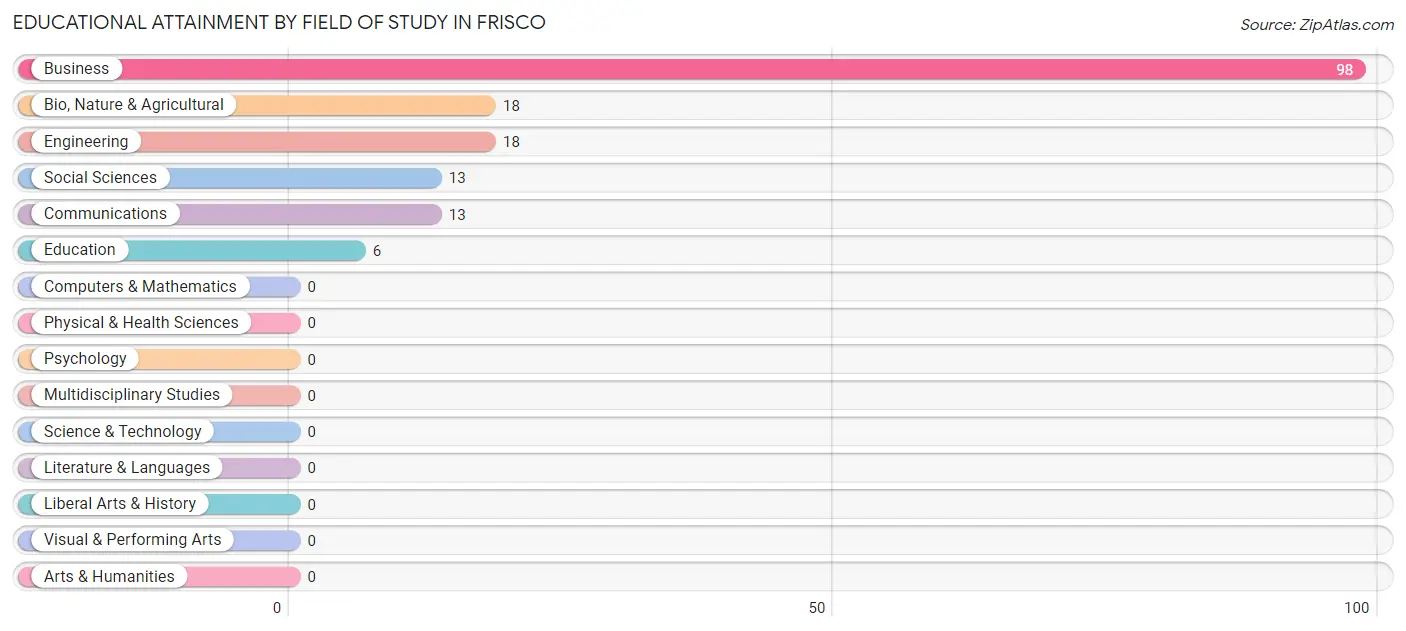
| Field of Study | # Graduates | % Graduates |
| Computers & Mathematics | 0 | 0.0% |
| Bio, Nature & Agricultural | 18 | 10.8% |
| Physical & Health Sciences | 0 | 0.0% |
| Psychology | 0 | 0.0% |
| Social Sciences | 13 | 7.8% |
| Engineering | 18 | 10.8% |
| Multidisciplinary Studies | 0 | 0.0% |
| Science & Technology | 0 | 0.0% |
| Business | 98 | 59.0% |
| Education | 6 | 3.6% |
| Literature & Languages | 0 | 0.0% |
| Liberal Arts & History | 0 | 0.0% |
| Visual & Performing Arts | 0 | 0.0% |
| Communications | 13 | 7.8% |
| Arts & Humanities | 0 | 0.0% |
| Total | 166 | 100.0% |
Transportation & Commute in Frisco
Vehicle Availability by Sex in Frisco
The most prevalent vehicle ownership categories in Frisco are males with 3 vehicles (81, accounting for 52.6%) and females with 3 vehicles (94, making up 34.5%).
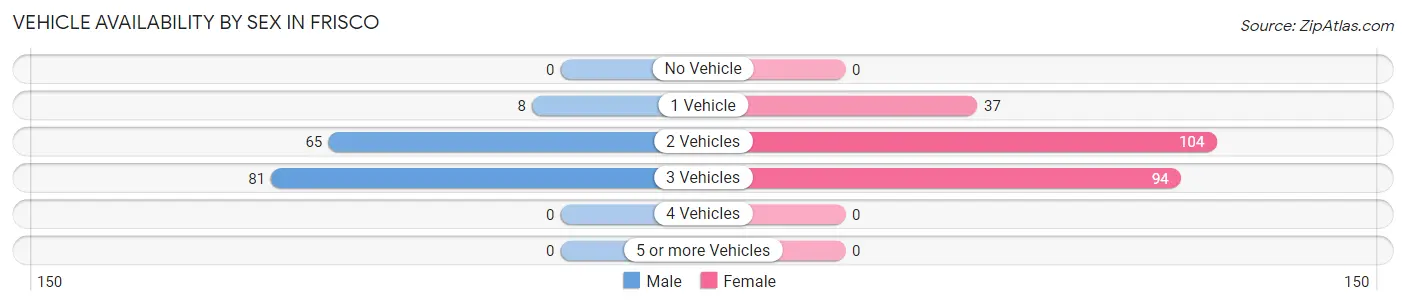
| Vehicles Available | Male | Female |
| No Vehicle | 0 (0.0%) | 0 (0.0%) |
| 1 Vehicle | 8 (5.2%) | 37 (15.7%) |
| 2 Vehicles | 65 (42.2%) | 104 (44.3%) |
| 3 Vehicles | 81 (52.6%) | 94 (40.0%) |
| 4 Vehicles | 0 (0.0%) | 0 (0.0%) |
| 5 or more Vehicles | 0 (0.0%) | 0 (0.0%) |
| Total | 154 (100.0%) | 235 (100.0%) |
Commute Time in Frisco
The most frequently occuring commute durations in Frisco are 20 to 24 minutes (62 commuters, 24.3%), 30 to 34 minutes (59 commuters, 23.1%), and 15 to 19 minutes (39 commuters, 15.3%).
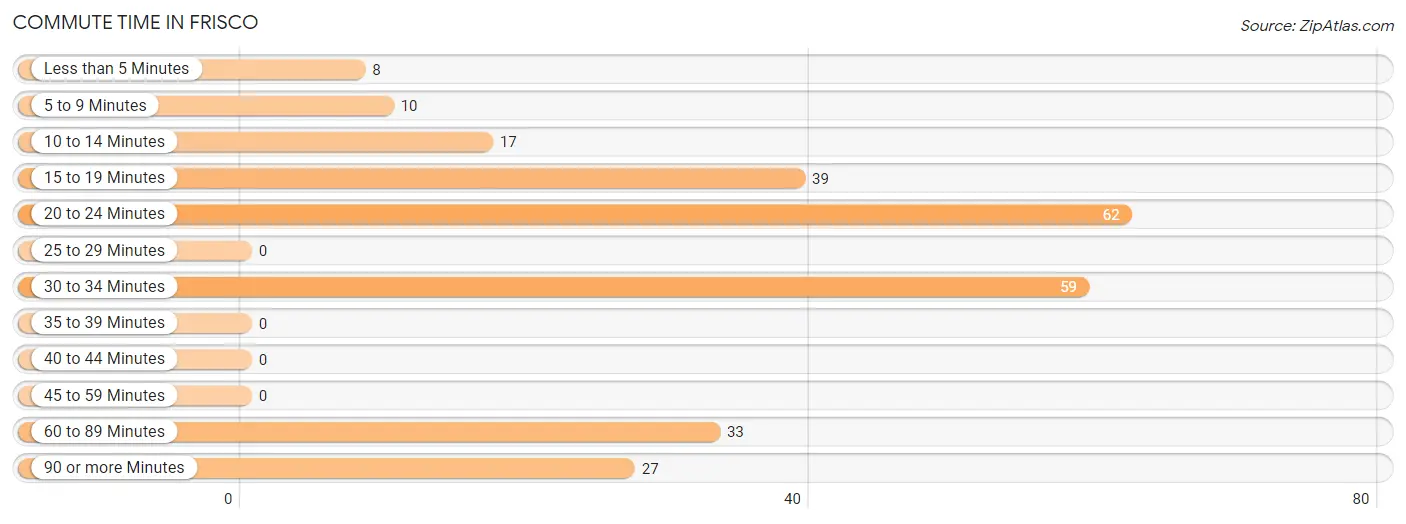
| Commute Time | # Commuters | % Commuters |
| Less than 5 Minutes | 8 | 3.1% |
| 5 to 9 Minutes | 10 | 3.9% |
| 10 to 14 Minutes | 17 | 6.7% |
| 15 to 19 Minutes | 39 | 15.3% |
| 20 to 24 Minutes | 62 | 24.3% |
| 25 to 29 Minutes | 0 | 0.0% |
| 30 to 34 Minutes | 59 | 23.1% |
| 35 to 39 Minutes | 0 | 0.0% |
| 40 to 44 Minutes | 0 | 0.0% |
| 45 to 59 Minutes | 0 | 0.0% |
| 60 to 89 Minutes | 33 | 12.9% |
| 90 or more Minutes | 27 | 10.6% |
Commute Time by Sex in Frisco
The most common commute times in Frisco are 20 to 24 minutes (46 commuters, 54.1%) for males and 30 to 34 minutes (51 commuters, 30.0%) for females.
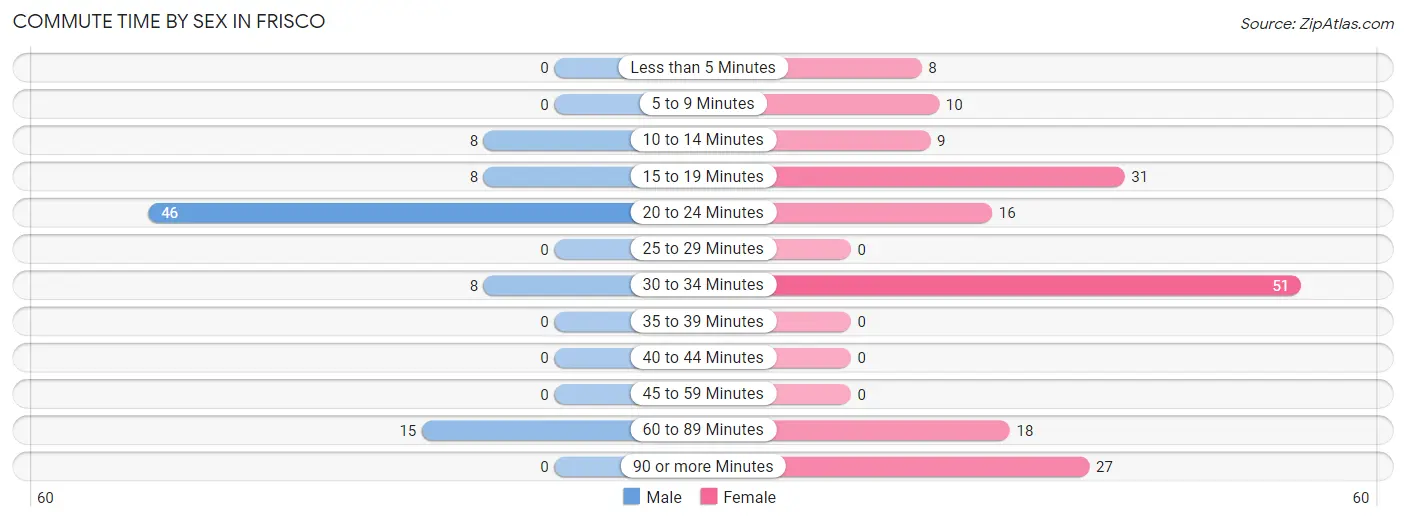
| Commute Time | Male | Female |
| Less than 5 Minutes | 0 (0.0%) | 8 (4.7%) |
| 5 to 9 Minutes | 0 (0.0%) | 10 (5.9%) |
| 10 to 14 Minutes | 8 (9.4%) | 9 (5.3%) |
| 15 to 19 Minutes | 8 (9.4%) | 31 (18.2%) |
| 20 to 24 Minutes | 46 (54.1%) | 16 (9.4%) |
| 25 to 29 Minutes | 0 (0.0%) | 0 (0.0%) |
| 30 to 34 Minutes | 8 (9.4%) | 51 (30.0%) |
| 35 to 39 Minutes | 0 (0.0%) | 0 (0.0%) |
| 40 to 44 Minutes | 0 (0.0%) | 0 (0.0%) |
| 45 to 59 Minutes | 0 (0.0%) | 0 (0.0%) |
| 60 to 89 Minutes | 15 (17.6%) | 18 (10.6%) |
| 90 or more Minutes | 0 (0.0%) | 27 (15.9%) |
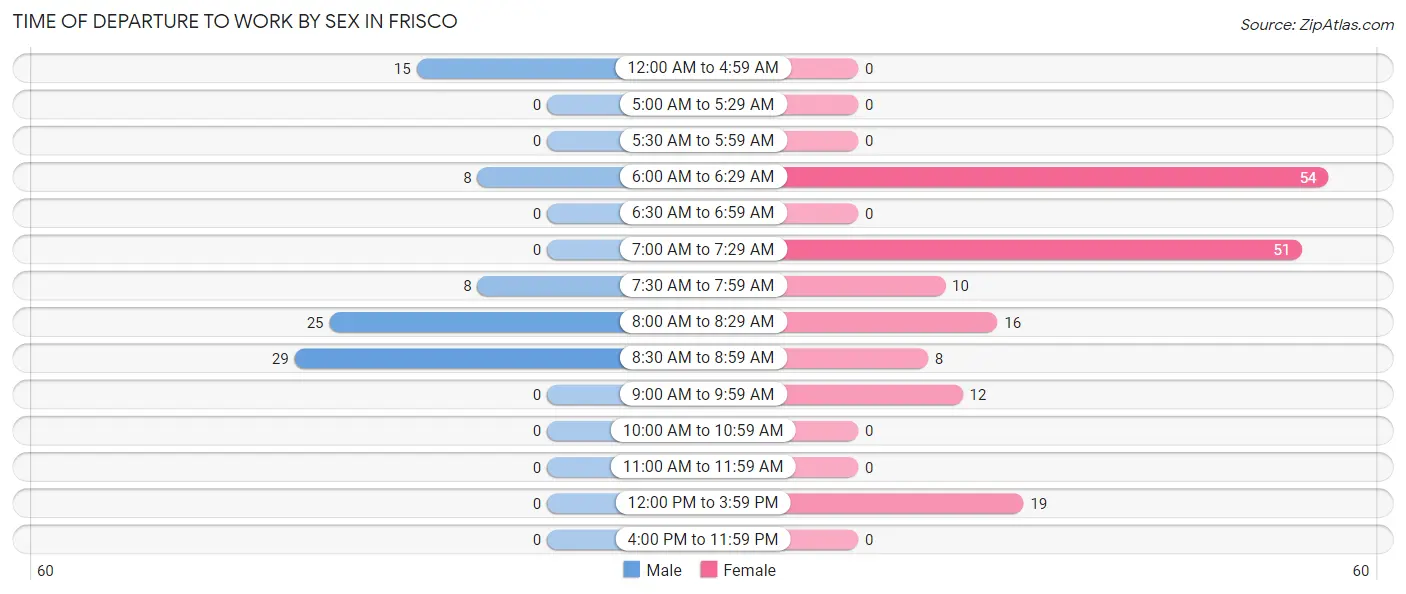
Time of Departure to Work by Sex in Frisco
The most frequent times of departure to work in Frisco are 8:30 AM to 8:59 AM (29, 34.1%) for males and 6:00 AM to 6:29 AM (54, 31.8%) for females.
| Time of Departure | Male | Female |
| 12:00 AM to 4:59 AM | 15 (17.6%) | 0 (0.0%) |
| 5:00 AM to 5:29 AM | 0 (0.0%) | 0 (0.0%) |
| 5:30 AM to 5:59 AM | 0 (0.0%) | 0 (0.0%) |
| 6:00 AM to 6:29 AM | 8 (9.4%) | 54 (31.8%) |
| 6:30 AM to 6:59 AM | 0 (0.0%) | 0 (0.0%) |
| 7:00 AM to 7:29 AM | 0 (0.0%) | 51 (30.0%) |
| 7:30 AM to 7:59 AM | 8 (9.4%) | 10 (5.9%) |
| 8:00 AM to 8:29 AM | 25 (29.4%) | 16 (9.4%) |
| 8:30 AM to 8:59 AM | 29 (34.1%) | 8 (4.7%) |
| 9:00 AM to 9:59 AM | 0 (0.0%) | 12 (7.1%) |
| 10:00 AM to 10:59 AM | 0 (0.0%) | 0 (0.0%) |
| 11:00 AM to 11:59 AM | 0 (0.0%) | 0 (0.0%) |
| 12:00 PM to 3:59 PM | 0 (0.0%) | 19 (11.2%) |
| 4:00 PM to 11:59 PM | 0 (0.0%) | 0 (0.0%) |
| Total | 85 (100.0%) | 170 (100.0%) |
Housing Occupancy in Frisco
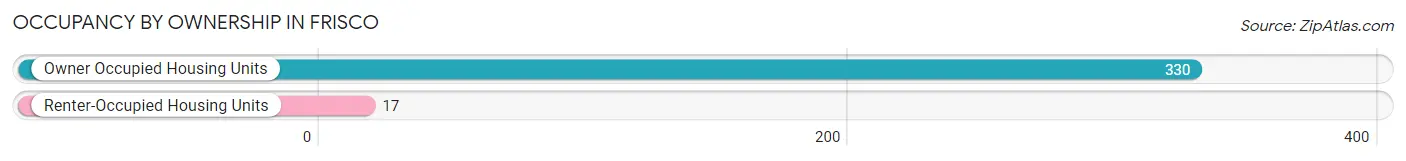
Occupancy by Ownership in Frisco
Of the total 347 dwellings in Frisco, owner-occupied units account for 330 (95.1%), while renter-occupied units make up 17 (4.9%).
| Occupancy | # Housing Units | % Housing Units |
| Owner Occupied Housing Units | 330 | 95.1% |
| Renter-Occupied Housing Units | 17 | 4.9% |
| Total Occupied Housing Units | 347 | 100.0% |
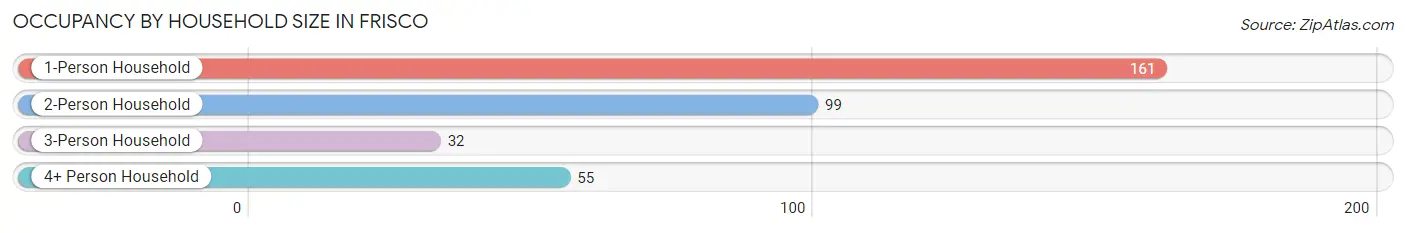
Occupancy by Household Size in Frisco
| Household Size | # Housing Units | % Housing Units |
| 1-Person Household | 161 | 46.4% |
| 2-Person Household | 99 | 28.5% |
| 3-Person Household | 32 | 9.2% |
| 4+ Person Household | 55 | 15.9% |
| Total Housing Units | 347 | 100.0% |
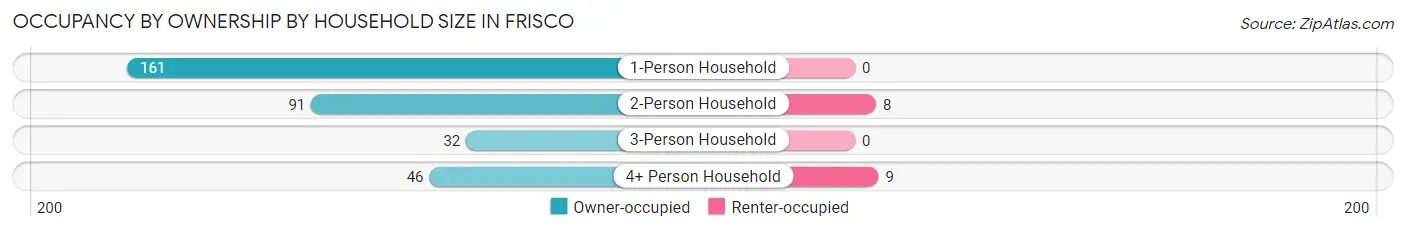
Occupancy by Ownership by Household Size in Frisco
| Household Size | Owner-occupied | Renter-occupied |
| 1-Person Household | 161 (100.0%) | 0 (0.0%) |
| 2-Person Household | 91 (91.9%) | 8 (8.1%) |
| 3-Person Household | 32 (100.0%) | 0 (0.0%) |
| 4+ Person Household | 46 (83.6%) | 9 (16.4%) |
| Total Housing Units | 330 (95.1%) | 17 (4.9%) |
Occupancy by Educational Attainment in Frisco
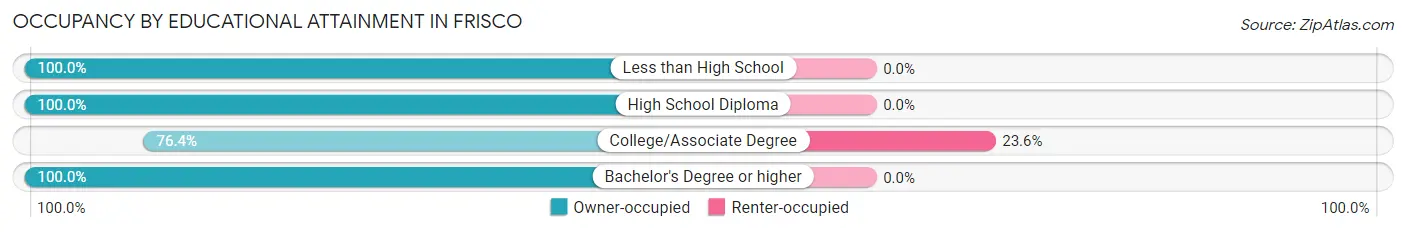
| Household Size | Owner-occupied | Renter-occupied |
| Less than High School | 57 (100.0%) | 0 (0.0%) |
| High School Diploma | 71 (100.0%) | 0 (0.0%) |
| College/Associate Degree | 55 (76.4%) | 17 (23.6%) |
| Bachelor's Degree or higher | 147 (100.0%) | 0 (0.0%) |
Occupancy by Age of Householder in Frisco
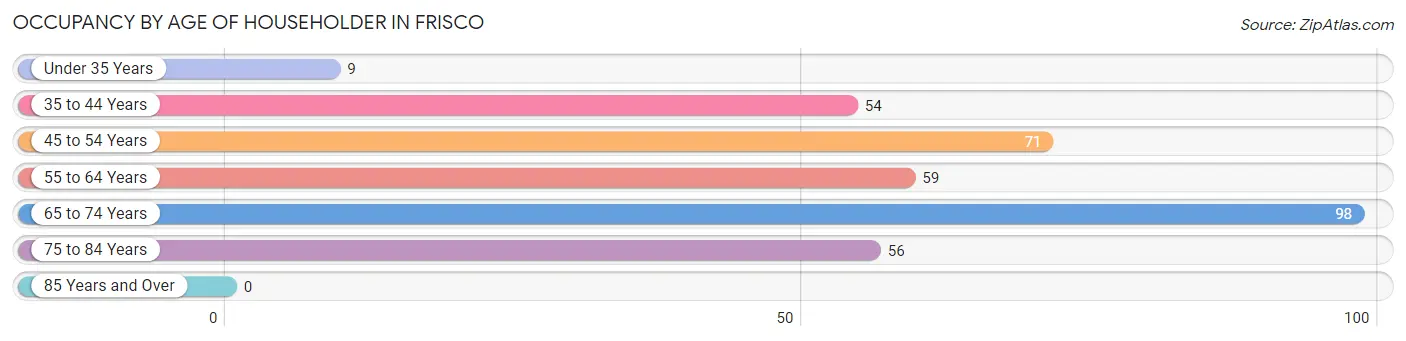
| Age Bracket | # Households | % Households |
| Under 35 Years | 9 | 2.6% |
| 35 to 44 Years | 54 | 15.6% |
| 45 to 54 Years | 71 | 20.5% |
| 55 to 64 Years | 59 | 17.0% |
| 65 to 74 Years | 98 | 28.2% |
| 75 to 84 Years | 56 | 16.1% |
| 85 Years and Over | 0 | 0.0% |
| Total | 347 | 100.0% |
Housing Finances in Frisco
Median Income by Occupancy in Frisco
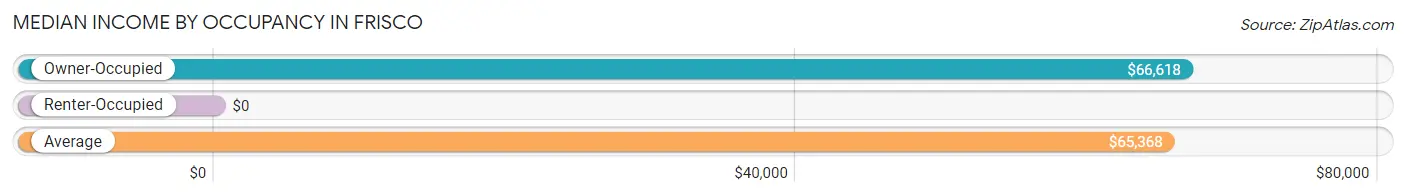
| Occupancy Type | # Households | Median Income |
| Owner-Occupied | 330 (95.1%) | $66,618 |
| Renter-Occupied | 17 (4.9%) | $0 |
| Average | 347 (100.0%) | $65,368 |
Occupancy by Householder Income Bracket in Frisco
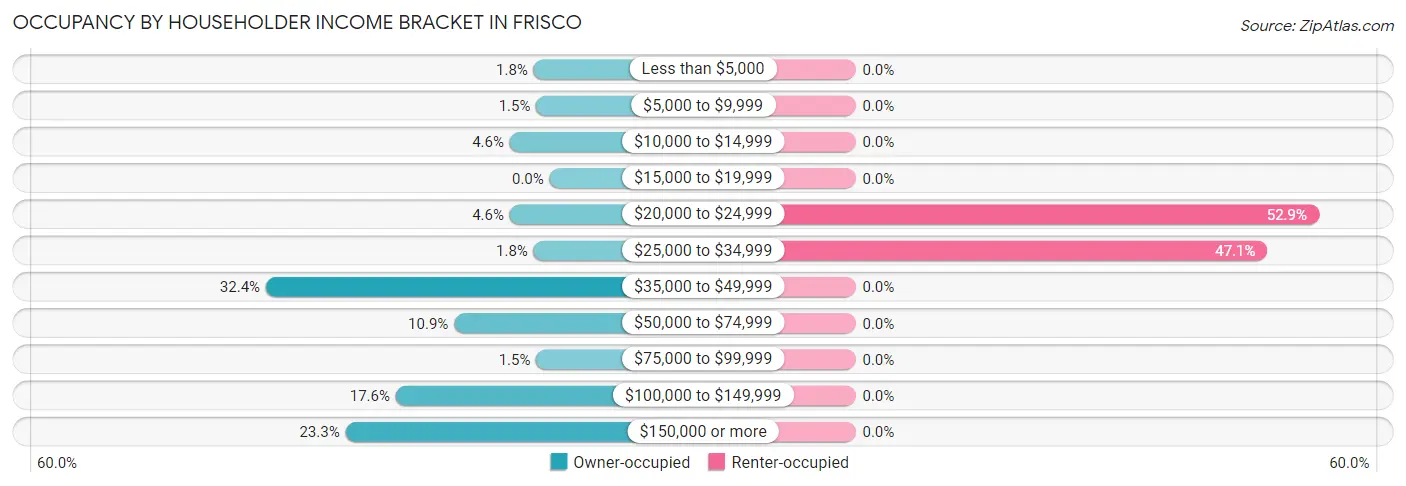
| Income Bracket | Owner-occupied | Renter-occupied |
| Less than $5,000 | 6 (1.8%) | 0 (0.0%) |
| $5,000 to $9,999 | 5 (1.5%) | 0 (0.0%) |
| $10,000 to $14,999 | 15 (4.5%) | 0 (0.0%) |
| $15,000 to $19,999 | 0 (0.0%) | 0 (0.0%) |
| $20,000 to $24,999 | 15 (4.5%) | 9 (52.9%) |
| $25,000 to $34,999 | 6 (1.8%) | 8 (47.1%) |
| $35,000 to $49,999 | 107 (32.4%) | 0 (0.0%) |
| $50,000 to $74,999 | 36 (10.9%) | 0 (0.0%) |
| $75,000 to $99,999 | 5 (1.5%) | 0 (0.0%) |
| $100,000 to $149,999 | 58 (17.6%) | 0 (0.0%) |
| $150,000 or more | 77 (23.3%) | 0 (0.0%) |
| Total | 330 (100.0%) | 17 (100.0%) |
Monthly Housing Cost Tiers in Frisco
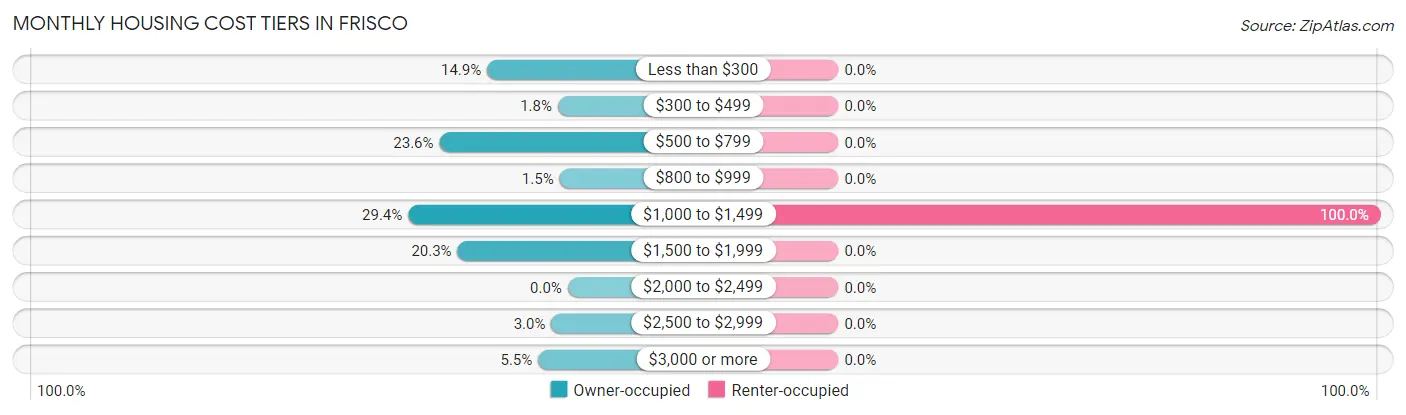
| Monthly Cost | Owner-occupied | Renter-occupied |
| Less than $300 | 49 (14.8%) | 0 (0.0%) |
| $300 to $499 | 6 (1.8%) | 0 (0.0%) |
| $500 to $799 | 78 (23.6%) | 0 (0.0%) |
| $800 to $999 | 5 (1.5%) | 0 (0.0%) |
| $1,000 to $1,499 | 97 (29.4%) | 17 (100.0%) |
| $1,500 to $1,999 | 67 (20.3%) | 0 (0.0%) |
| $2,000 to $2,499 | 0 (0.0%) | 0 (0.0%) |
| $2,500 to $2,999 | 10 (3.0%) | 0 (0.0%) |
| $3,000 or more | 18 (5.4%) | 0 (0.0%) |
| Total | 330 (100.0%) | 17 (100.0%) |
Physical Housing Characteristics in Frisco
Housing Structures in Frisco
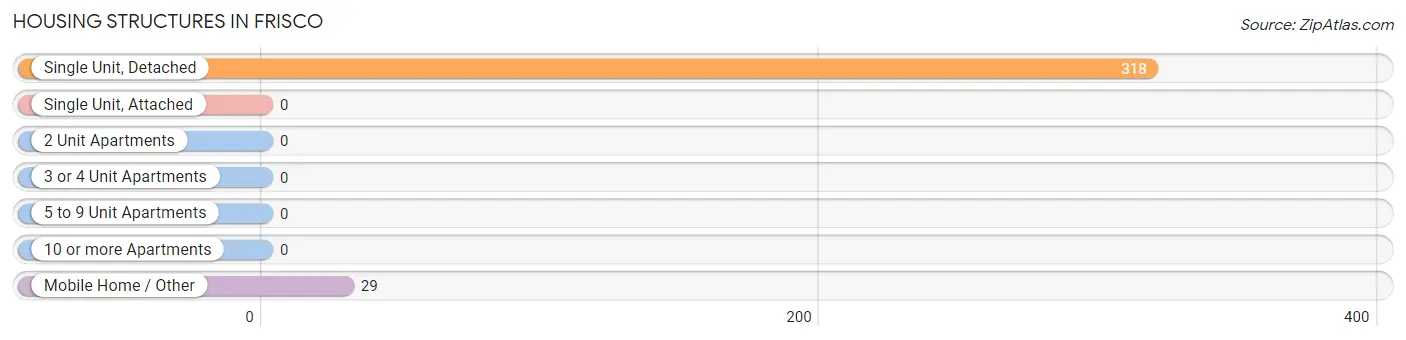
| Structure Type | # Housing Units | % Housing Units |
| Single Unit, Detached | 318 | 91.6% |
| Single Unit, Attached | 0 | 0.0% |
| 2 Unit Apartments | 0 | 0.0% |
| 3 or 4 Unit Apartments | 0 | 0.0% |
| 5 to 9 Unit Apartments | 0 | 0.0% |
| 10 or more Apartments | 0 | 0.0% |
| Mobile Home / Other | 29 | 8.4% |
| Total | 347 | 100.0% |
Housing Structures by Occupancy in Frisco
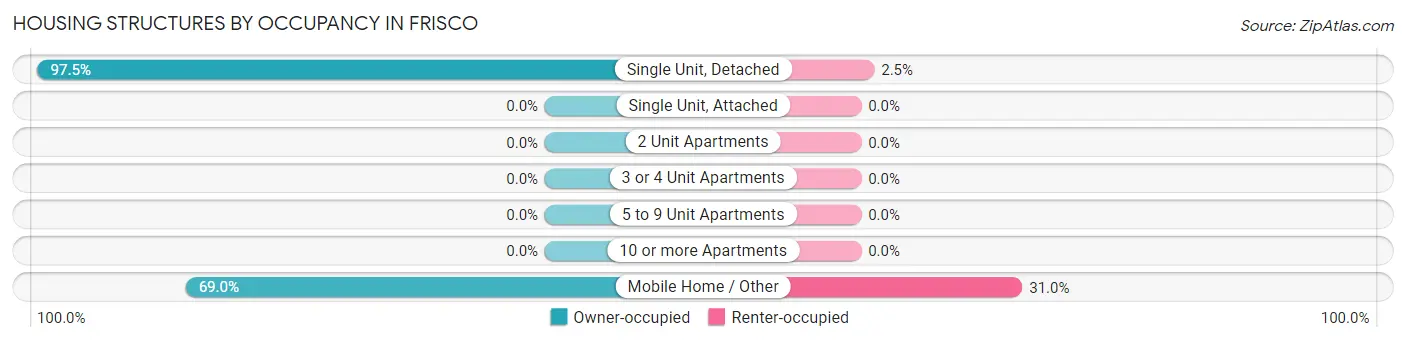
| Structure Type | Owner-occupied | Renter-occupied |
| Single Unit, Detached | 310 (97.5%) | 8 (2.5%) |
| Single Unit, Attached | 0 (0.0%) | 0 (0.0%) |
| 2 Unit Apartments | 0 (0.0%) | 0 (0.0%) |
| 3 or 4 Unit Apartments | 0 (0.0%) | 0 (0.0%) |
| 5 to 9 Unit Apartments | 0 (0.0%) | 0 (0.0%) |
| 10 or more Apartments | 0 (0.0%) | 0 (0.0%) |
| Mobile Home / Other | 20 (69.0%) | 9 (31.0%) |
| Total | 330 (95.1%) | 17 (4.9%) |
Housing Structures by Number of Rooms in Frisco
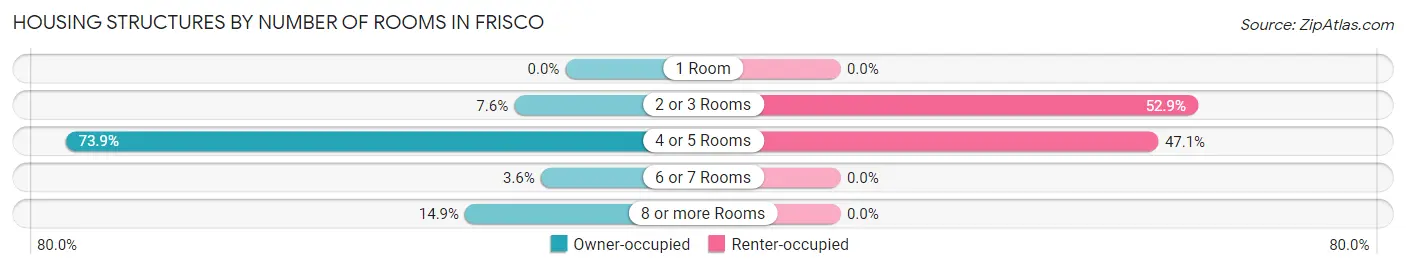
| Number of Rooms | Owner-occupied | Renter-occupied |
| 1 Room | 0 (0.0%) | 0 (0.0%) |
| 2 or 3 Rooms | 25 (7.6%) | 9 (52.9%) |
| 4 or 5 Rooms | 244 (73.9%) | 8 (47.1%) |
| 6 or 7 Rooms | 12 (3.6%) | 0 (0.0%) |
| 8 or more Rooms | 49 (14.8%) | 0 (0.0%) |
| Total | 330 (100.0%) | 17 (100.0%) |
Housing Structure by Heating Type in Frisco
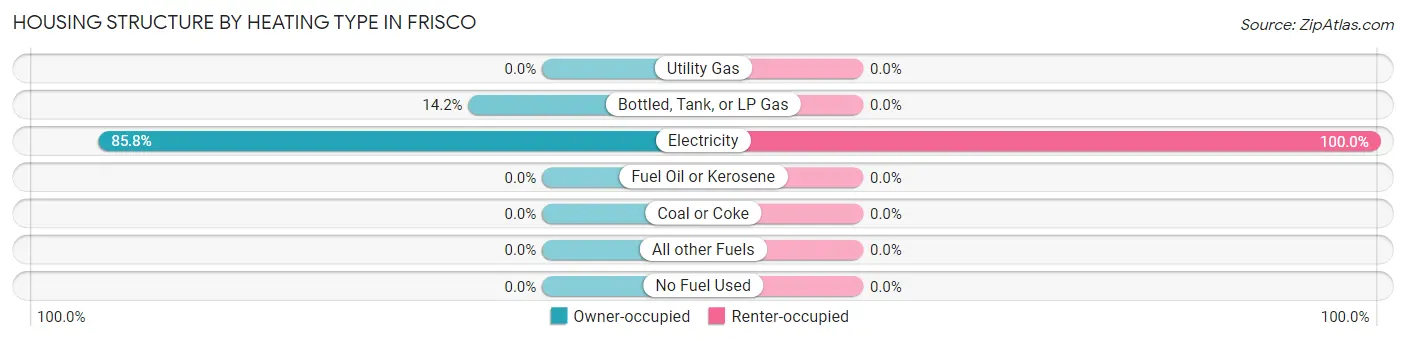
| Heating Type | Owner-occupied | Renter-occupied |
| Utility Gas | 0 (0.0%) | 0 (0.0%) |
| Bottled, Tank, or LP Gas | 47 (14.2%) | 0 (0.0%) |
| Electricity | 283 (85.8%) | 17 (100.0%) |
| Fuel Oil or Kerosene | 0 (0.0%) | 0 (0.0%) |
| Coal or Coke | 0 (0.0%) | 0 (0.0%) |
| All other Fuels | 0 (0.0%) | 0 (0.0%) |
| No Fuel Used | 0 (0.0%) | 0 (0.0%) |
| Total | 330 (100.0%) | 17 (100.0%) |
Household Vehicle Usage in Frisco
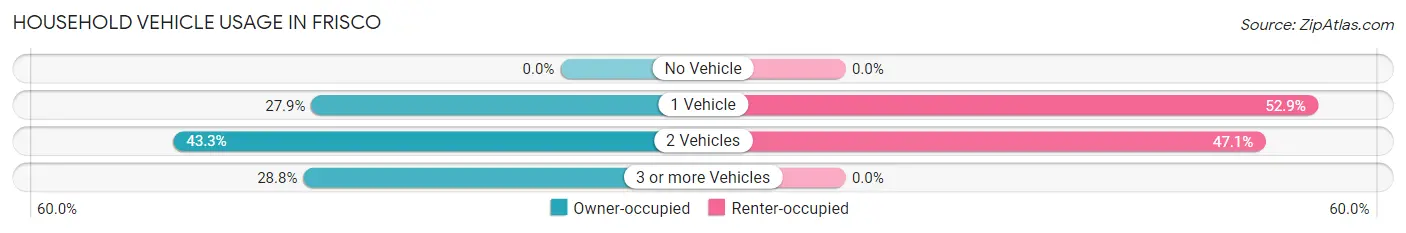
| Vehicles per Household | Owner-occupied | Renter-occupied |
| No Vehicle | 0 (0.0%) | 0 (0.0%) |
| 1 Vehicle | 92 (27.9%) | 9 (52.9%) |
| 2 Vehicles | 143 (43.3%) | 8 (47.1%) |
| 3 or more Vehicles | 95 (28.8%) | 0 (0.0%) |
| Total | 330 (100.0%) | 17 (100.0%) |
Real Estate & Mortgages in Frisco
Real Estate and Mortgage Overview in Frisco
| Characteristic | Without Mortgage | With Mortgage |
| Housing Units | 205 | 125 |
| Median Property Value | $367,700 | $368,800 |
| Median Household Income | - | - |
| Monthly Housing Costs | $675 | $18 |
| Real Estate Taxes | $2,254 | $0 |
Property Value by Mortgage Status in Frisco
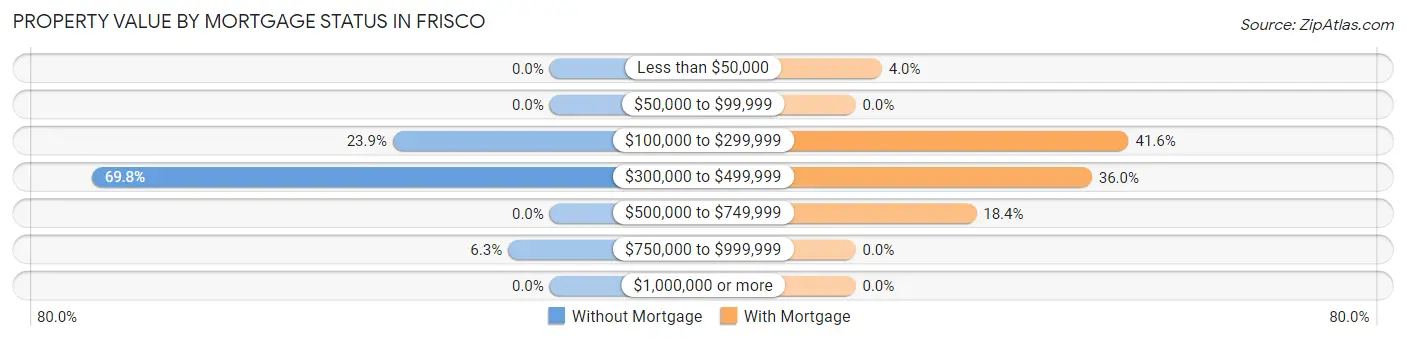
| Property Value | Without Mortgage | With Mortgage |
| Less than $50,000 | 0 (0.0%) | 5 (4.0%) |
| $50,000 to $99,999 | 0 (0.0%) | 0 (0.0%) |
| $100,000 to $299,999 | 49 (23.9%) | 52 (41.6%) |
| $300,000 to $499,999 | 143 (69.8%) | 45 (36.0%) |
| $500,000 to $749,999 | 0 (0.0%) | 23 (18.4%) |
| $750,000 to $999,999 | 13 (6.3%) | 0 (0.0%) |
| $1,000,000 or more | 0 (0.0%) | 0 (0.0%) |
| Total | 205 (100.0%) | 125 (100.0%) |
Household Income by Mortgage Status in Frisco
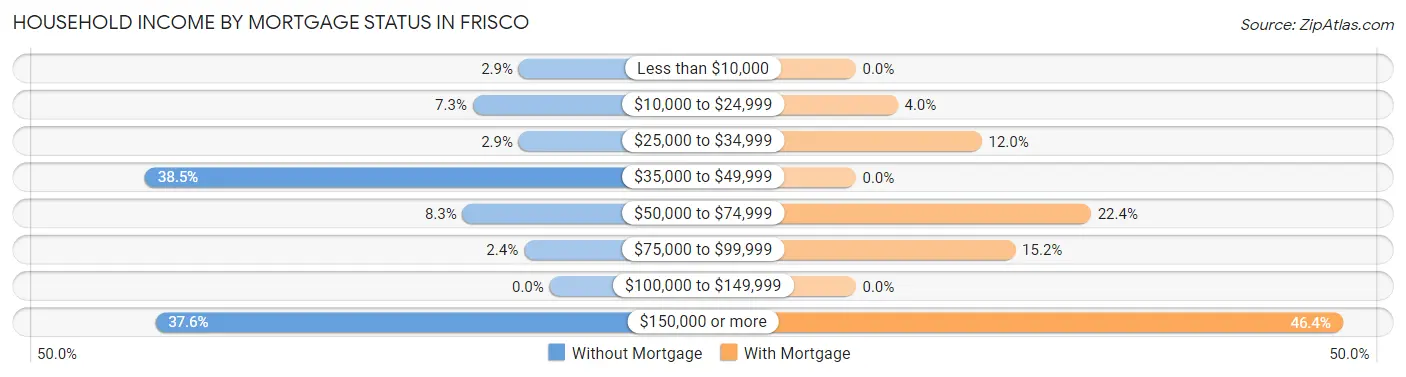
| Household Income | Without Mortgage | With Mortgage |
| Less than $10,000 | 6 (2.9%) | 0 (0.0%) |
| $10,000 to $24,999 | 15 (7.3%) | 5 (4.0%) |
| $25,000 to $34,999 | 6 (2.9%) | 15 (12.0%) |
| $35,000 to $49,999 | 79 (38.5%) | 0 (0.0%) |
| $50,000 to $74,999 | 17 (8.3%) | 28 (22.4%) |
| $75,000 to $99,999 | 5 (2.4%) | 19 (15.2%) |
| $100,000 to $149,999 | 0 (0.0%) | 0 (0.0%) |
| $150,000 or more | 77 (37.6%) | 58 (46.4%) |
| Total | 205 (100.0%) | 125 (100.0%) |
Property Value to Household Income Ratio in Frisco
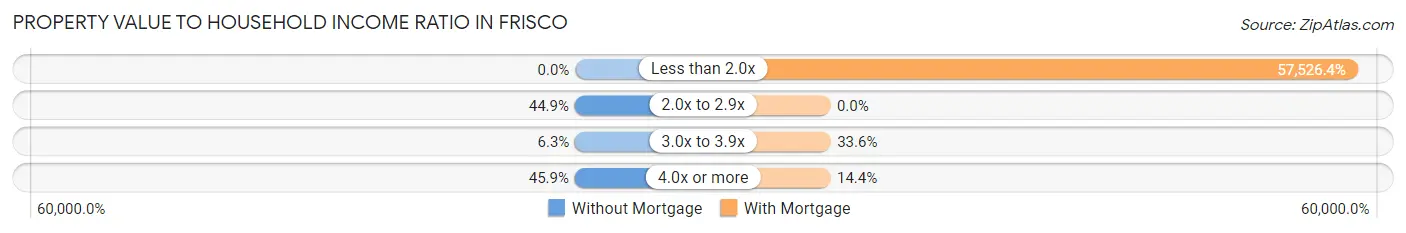
| Value-to-Income Ratio | Without Mortgage | With Mortgage |
| Less than 2.0x | 0 (0.0%) | 71,908 (57,526.4%) |
| 2.0x to 2.9x | 92 (44.9%) | 0 (0.0%) |
| 3.0x to 3.9x | 13 (6.3%) | 42 (33.6%) |
| 4.0x or more | 94 (45.9%) | 18 (14.4%) |
| Total | 205 (100.0%) | 125 (100.0%) |
Real Estate Taxes by Mortgage Status in Frisco
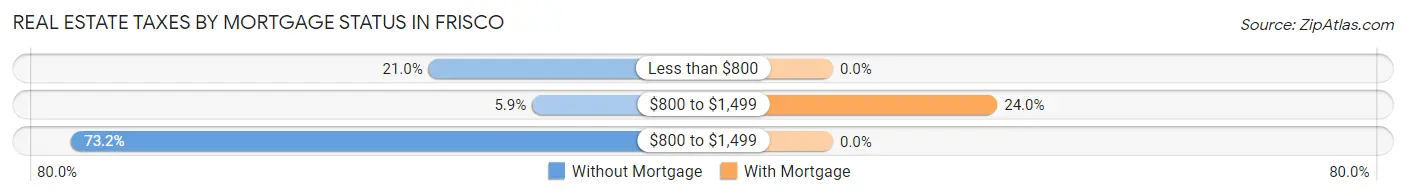
| Property Taxes | Without Mortgage | With Mortgage |
| Less than $800 | 43 (21.0%) | 0 (0.0%) |
| $800 to $1,499 | 12 (5.9%) | 30 (24.0%) |
| $800 to $1,499 | 150 (73.2%) | 0 (0.0%) |
| Total | 205 (100.0%) | 125 (100.0%) |
Health & Disability in Frisco
Health Insurance Coverage by Age in Frisco
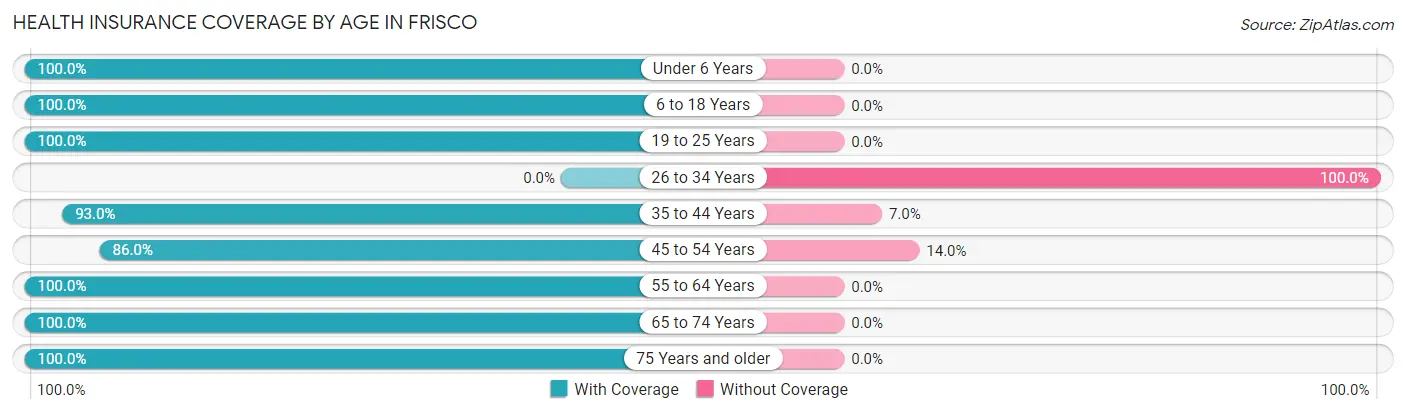
| Age Bracket | With Coverage | Without Coverage |
| Under 6 Years | 17 (100.0%) | 0 (0.0%) |
| 6 to 18 Years | 109 (100.0%) | 0 (0.0%) |
| 19 to 25 Years | 24 (100.0%) | 0 (0.0%) |
| 26 to 34 Years | 0 (0.0%) | 9 (100.0%) |
| 35 to 44 Years | 106 (93.0%) | 8 (7.0%) |
| 45 to 54 Years | 86 (86.0%) | 14 (14.0%) |
| 55 to 64 Years | 104 (100.0%) | 0 (0.0%) |
| 65 to 74 Years | 116 (100.0%) | 0 (0.0%) |
| 75 Years and older | 66 (100.0%) | 0 (0.0%) |
| Total | 628 (95.3%) | 31 (4.7%) |
Health Insurance Coverage by Citizenship Status in Frisco
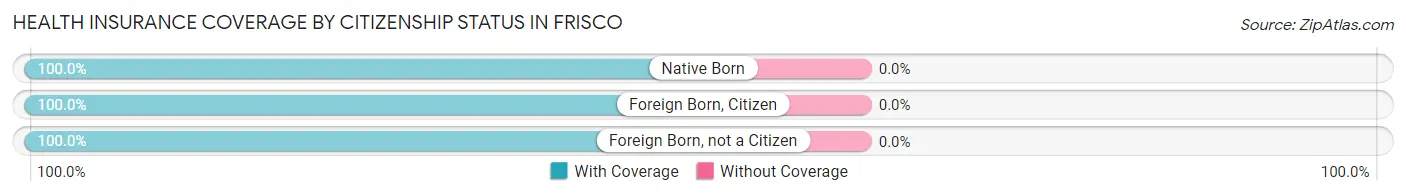
| Citizenship Status | With Coverage | Without Coverage |
| Native Born | 17 (100.0%) | 0 (0.0%) |
| Foreign Born, Citizen | 109 (100.0%) | 0 (0.0%) |
| Foreign Born, not a Citizen | 24 (100.0%) | 0 (0.0%) |
Health Insurance Coverage by Household Income in Frisco
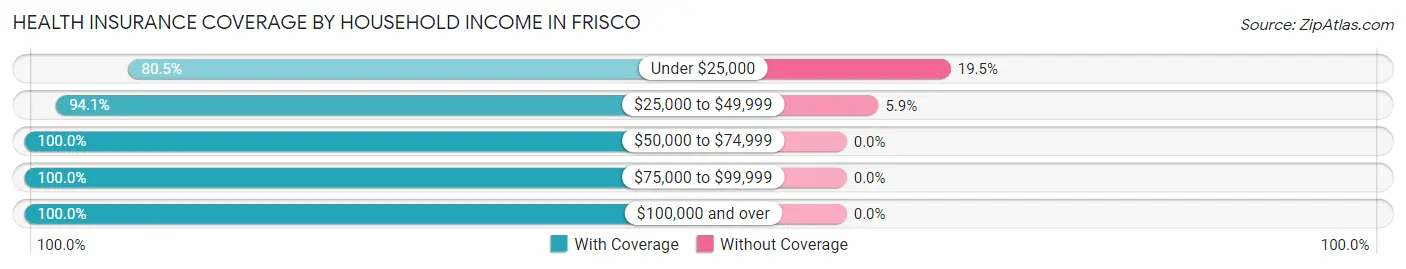
| Household Income | With Coverage | Without Coverage |
| Under $25,000 | 95 (80.5%) | 23 (19.5%) |
| $25,000 to $49,999 | 127 (94.1%) | 8 (5.9%) |
| $50,000 to $74,999 | 85 (100.0%) | 0 (0.0%) |
| $75,000 to $99,999 | 11 (100.0%) | 0 (0.0%) |
| $100,000 and over | 310 (100.0%) | 0 (0.0%) |
Public vs Private Health Insurance Coverage by Age in Frisco
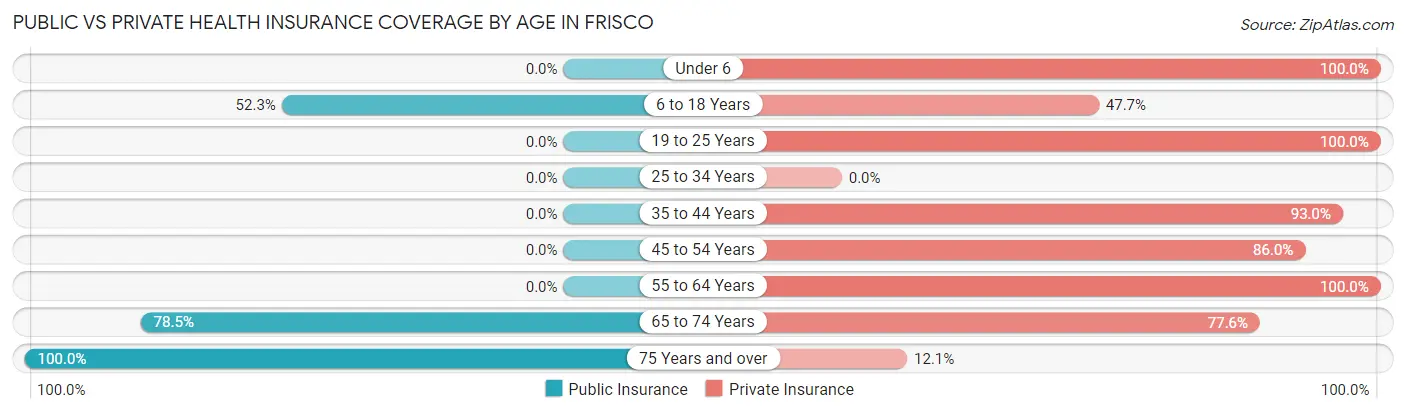
| Age Bracket | Public Insurance | Private Insurance |
| Under 6 | 0 (0.0%) | 17 (100.0%) |
| 6 to 18 Years | 57 (52.3%) | 52 (47.7%) |
| 19 to 25 Years | 0 (0.0%) | 24 (100.0%) |
| 25 to 34 Years | 0 (0.0%) | 0 (0.0%) |
| 35 to 44 Years | 0 (0.0%) | 106 (93.0%) |
| 45 to 54 Years | 0 (0.0%) | 86 (86.0%) |
| 55 to 64 Years | 0 (0.0%) | 104 (100.0%) |
| 65 to 74 Years | 91 (78.4%) | 90 (77.6%) |
| 75 Years and over | 66 (100.0%) | 8 (12.1%) |
| Total | 214 (32.5%) | 487 (73.9%) |
Disability Status by Sex by Age in Frisco
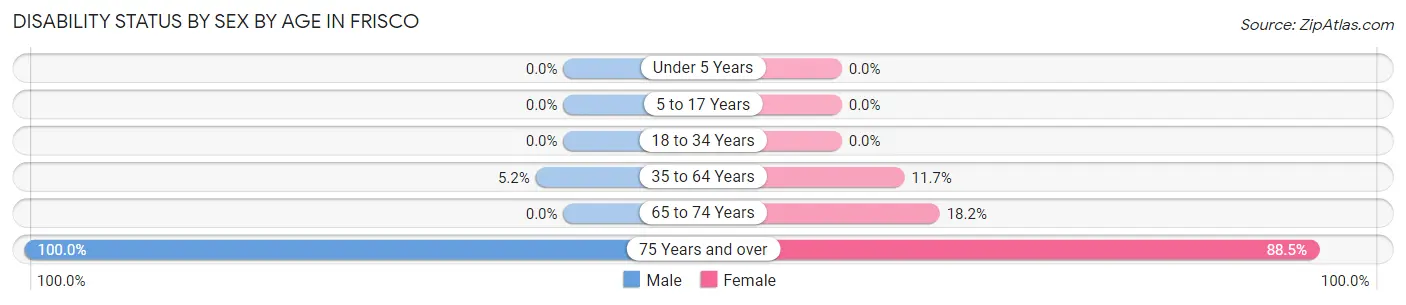
| Age Bracket | Male | Female |
| Under 5 Years | 0 (0.0%) | 0 (0.0%) |
| 5 to 17 Years | 0 (0.0%) | 0 (0.0%) |
| 18 to 34 Years | 0 (0.0%) | 0 (0.0%) |
| 35 to 64 Years | 8 (5.2%) | 19 (11.7%) |
| 65 to 74 Years | 0 (0.0%) | 6 (18.2%) |
| 75 Years and over | 5 (100.0%) | 54 (88.5%) |
Disability Class by Sex by Age in Frisco
Disability Class: Hearing Difficulty
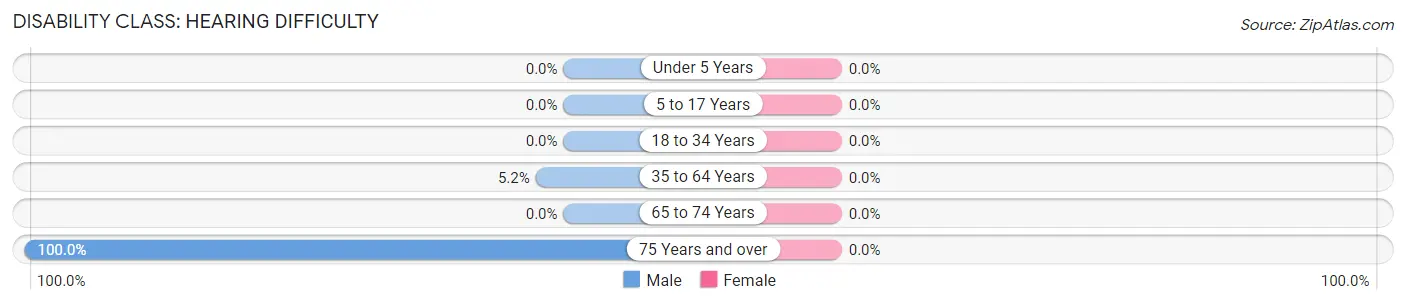
| Age Bracket | Male | Female |
| Under 5 Years | 0 (0.0%) | 0 (0.0%) |
| 5 to 17 Years | 0 (0.0%) | 0 (0.0%) |
| 18 to 34 Years | 0 (0.0%) | 0 (0.0%) |
| 35 to 64 Years | 8 (5.2%) | 0 (0.0%) |
| 65 to 74 Years | 0 (0.0%) | 0 (0.0%) |
| 75 Years and over | 5 (100.0%) | 0 (0.0%) |
Disability Class: Vision Difficulty
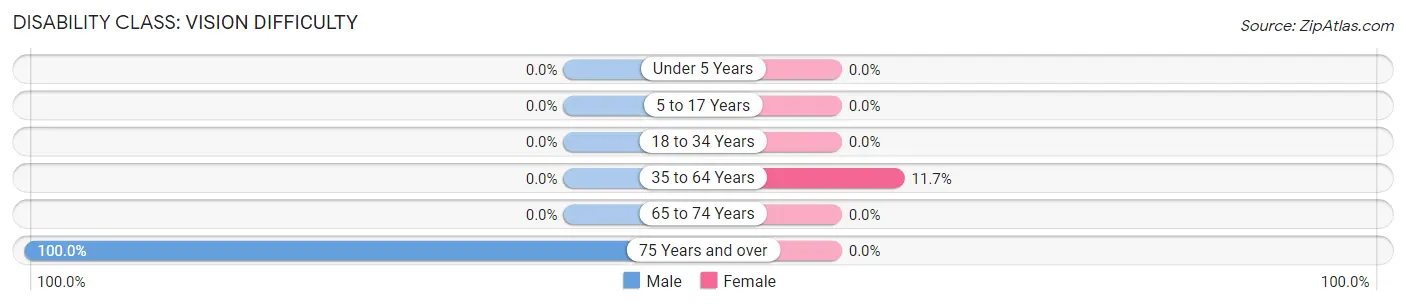
| Age Bracket | Male | Female |
| Under 5 Years | 0 (0.0%) | 0 (0.0%) |
| 5 to 17 Years | 0 (0.0%) | 0 (0.0%) |
| 18 to 34 Years | 0 (0.0%) | 0 (0.0%) |
| 35 to 64 Years | 0 (0.0%) | 19 (11.7%) |
| 65 to 74 Years | 0 (0.0%) | 0 (0.0%) |
| 75 Years and over | 5 (100.0%) | 0 (0.0%) |
Disability Class: Cognitive Difficulty
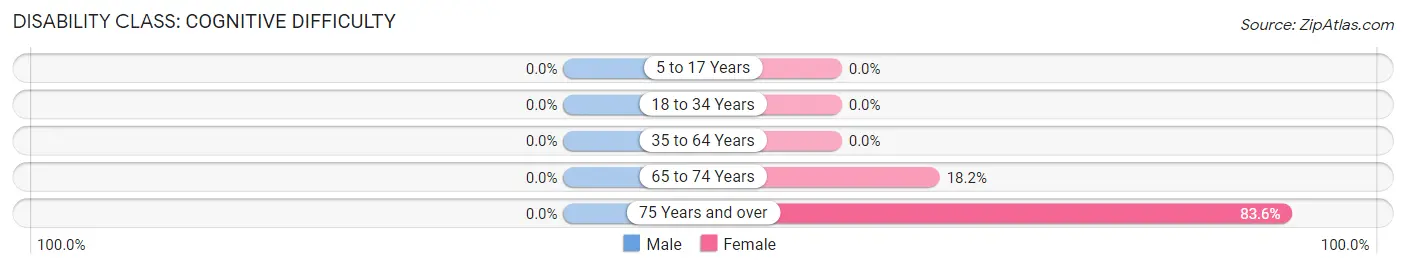
| Age Bracket | Male | Female |
| 5 to 17 Years | 0 (0.0%) | 0 (0.0%) |
| 18 to 34 Years | 0 (0.0%) | 0 (0.0%) |
| 35 to 64 Years | 0 (0.0%) | 0 (0.0%) |
| 65 to 74 Years | 0 (0.0%) | 6 (18.2%) |
| 75 Years and over | 0 (0.0%) | 51 (83.6%) |
Disability Class: Ambulatory Difficulty
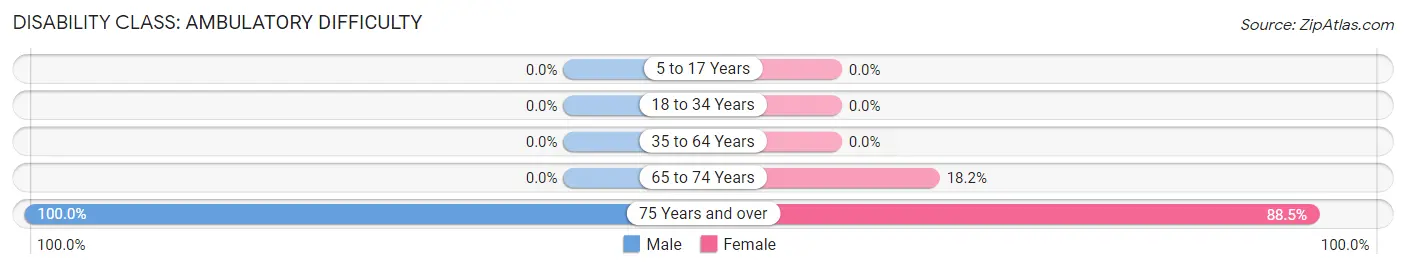
| Age Bracket | Male | Female |
| 5 to 17 Years | 0 (0.0%) | 0 (0.0%) |
| 18 to 34 Years | 0 (0.0%) | 0 (0.0%) |
| 35 to 64 Years | 0 (0.0%) | 0 (0.0%) |
| 65 to 74 Years | 0 (0.0%) | 6 (18.2%) |
| 75 Years and over | 5 (100.0%) | 54 (88.5%) |
Disability Class: Self-Care Difficulty
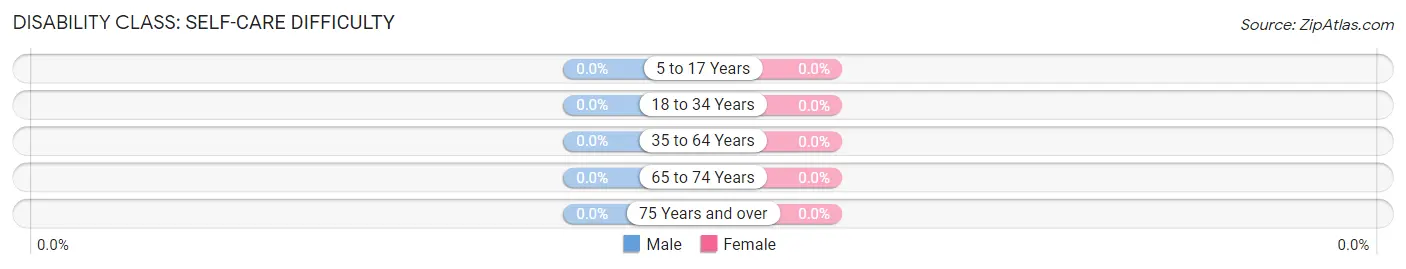
| Age Bracket | Male | Female |
| 5 to 17 Years | 0 (0.0%) | 0 (0.0%) |
| 18 to 34 Years | 0 (0.0%) | 0 (0.0%) |
| 35 to 64 Years | 0 (0.0%) | 0 (0.0%) |
| 65 to 74 Years | 0 (0.0%) | 0 (0.0%) |
| 75 Years and over | 0 (0.0%) | 0 (0.0%) |
Technology Access in Frisco
Computing Device Access in Frisco
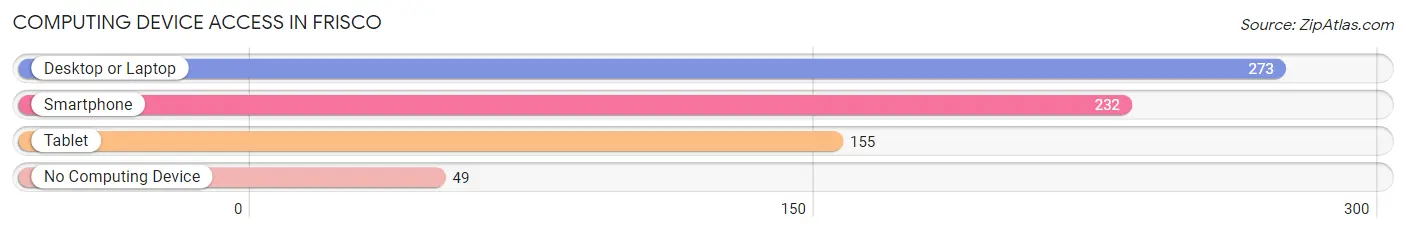
| Device Type | # Households | % Households |
| Desktop or Laptop | 273 | 78.7% |
| Smartphone | 232 | 66.9% |
| Tablet | 155 | 44.7% |
| No Computing Device | 49 | 14.1% |
| Total | 347 | 100.0% |
Internet Access in Frisco
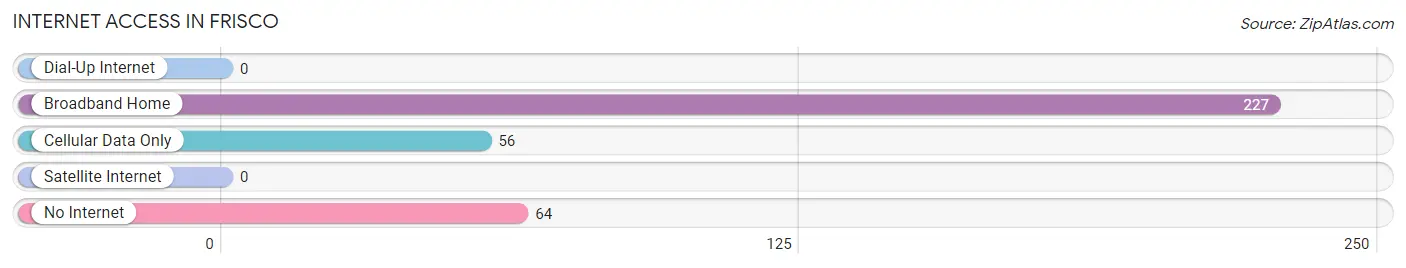
| Internet Type | # Households | % Households |
| Dial-Up Internet | 0 | 0.0% |
| Broadband Home | 227 | 65.4% |
| Cellular Data Only | 56 | 16.1% |
| Satellite Internet | 0 | 0.0% |
| No Internet | 64 | 18.4% |
| Total | 347 | 100.0% |
Frisco Summary
Frisco, North Carolina is a small town located in the Outer Banks of North Carolina. It is situated on the northern end of Hatteras Island, which is part of the larger Cape Hatteras National Seashore. The town is known for its beautiful beaches, fishing, and other outdoor activities.
History
Frisco was first settled in the late 1700s by a group of English settlers. The town was originally called “Frisco” after the nearby Frisco Inlet. The inlet was named after the Frisco Indians, who were the original inhabitants of the area. The town was incorporated in 1883 and was a popular fishing and hunting destination for many years.
In the early 1900s, the town began to attract tourists from all over the country. The town was known for its beautiful beaches and fishing opportunities. In the 1950s, the town began to develop as a resort destination. The town was also home to a number of seafood restaurants and other businesses.
Geography
Frisco is located on the northern end of Hatteras Island, which is part of the larger Cape Hatteras National Seashore. The town is situated on the Pamlico Sound, which is a large body of water that separates the Outer Banks from the mainland. The town is surrounded by the Atlantic Ocean to the east and the Pamlico Sound to the west.
The town is located in Dare County and is part of the Outer Banks region. The town is located approximately 40 miles south of Nags Head and approximately 60 miles north of Cape Hatteras. The town is located at an elevation of approximately 10 feet above sea level.
Economy
Frisco’s economy is largely based on tourism. The town is home to a number of hotels, restaurants, and other businesses that cater to tourists. The town is also home to a number of seafood restaurants and other businesses that serve the local population.
The town is also home to a number of fishing charters and other businesses that cater to the fishing industry. The town is also home to a number of boat builders and other businesses that cater to the boating industry.
Demographics
As of the 2010 census, the population of Frisco was 1,093. The town has a total area of 1.2 square miles, all of which is land. The town has a population density of 890.7 people per square mile.
The racial makeup of the town is 97.3% White, 0.7% African American, 0.2% Native American, 0.2% Asian, 0.1% Pacific Islander, 0.7% from other races, and 0.9% from two or more races. The median household income in the town is $45,000. The per capita income in the town is $25,000.
Conclusion
Frisco, North Carolina is a small town located in the Outer Banks of North Carolina. It is situated on the northern end of Hatteras Island, which is part of the larger Cape Hatteras National Seashore. The town is known for its beautiful beaches, fishing, and other outdoor activities. The town’s economy is largely based on tourism and the fishing industry. The town has a population of 1,093 and a median household income of $45,000.
Common Questions
What is Per Capita Income in Frisco?
Per Capita income in Frisco is $43,375.
What is the Median Family Income in Frisco?
Median Family Income in Frisco is $125,192.
What is the Median Household income in Frisco?
Median Household Income in Frisco is $65,368.
What is Income or Wage Gap in Frisco?
Income or Wage Gap in Frisco is 4.1%.
Women in Frisco earn 95.9 cents for every dollar earned by a man.
What is Inequality or Gini Index in Frisco?
Inequality or Gini Index in Frisco is 0.40.
What is the Total Population of Frisco?
Total Population of Frisco is 659.
What is the Total Male Population of Frisco?
Total Male Population of Frisco is 359.
What is the Total Female Population of Frisco?
Total Female Population of Frisco is 300.
What is the Ratio of Males per 100 Females in Frisco?
There are 119.67 Males per 100 Females in Frisco.
What is the Ratio of Females per 100 Males in Frisco?
There are 83.57 Females per 100 Males in Frisco.
What is the Median Population Age in Frisco?
Median Population Age in Frisco is 52.1 Years.
What is the Average Family Size in Frisco
Average Family Size in Frisco is 2.7 People.
What is the Average Household Size in Frisco
Average Household Size in Frisco is 1.9 People.
How Large is the Labor Force in Frisco?
There are 404 People in the Labor Forcein in Frisco.
What is the Percentage of People in the Labor Force in Frisco?
75.8% of People are in the Labor Force in Frisco.