Mountain Home, NC Map & Demographics
Mountain Home Map
Mountain Home Overview
$33,422
PER CAPITA INCOME
$75,833
AVG FAMILY INCOME
$59,010
AVG HOUSEHOLD INCOME
18.4%
WAGE / INCOME GAP [ % ]
81.6¢/ $1
WAGE / INCOME GAP [ $ ]
0.43
INEQUALITY / GINI INDEX
4,028
TOTAL POPULATION
2,282
MALE POPULATION
1,746
FEMALE POPULATION
130.70
MALES / 100 FEMALES
76.51
FEMALES / 100 MALES
49.5
MEDIAN AGE
2.8
AVG FAMILY SIZE
2.4
AVG HOUSEHOLD SIZE
2,351
LABOR FORCE [ PEOPLE ]
66.5%
PERCENT IN LABOR FORCE
0.8%
UNEMPLOYMENT RATE
Mountain Home Area Codes
Income in Mountain Home
Income Overview in Mountain Home
Per Capita Income in Mountain Home is $33,422, while median incomes of families and households are $75,833 and $59,010 respectively.
| Characteristic | Number | Measure |
| Per Capita Income | 4,028 | $33,422 |
| Median Family Income | 1,162 | $75,833 |
| Mean Family Income | 1,162 | $91,457 |
| Median Household Income | 1,609 | $59,010 |
| Mean Household Income | 1,609 | $80,341 |
| Income Deficit | 1,162 | $0 |
| Wage / Income Gap (%) | 4,028 | 18.41% |
| Wage / Income Gap ($) | 4,028 | 81.59¢ per $1 |
| Gini / Inequality Index | 4,028 | 0.43 |
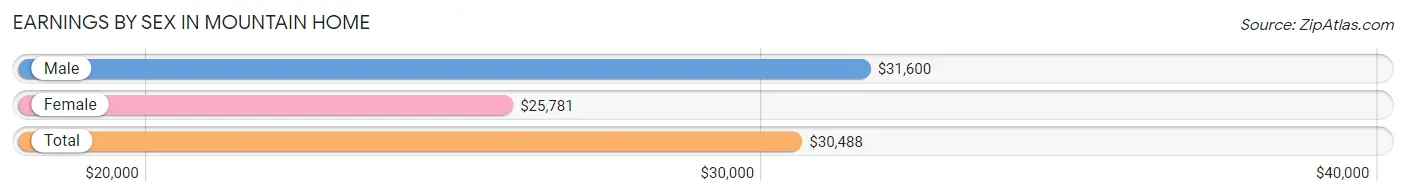
Earnings by Sex in Mountain Home
Average Earnings in Mountain Home are $30,488, $31,600 for men and $25,781 for women, a difference of 18.4%.
| Sex | Number | Average Earnings |
| Male | 1,546 (64.0%) | $31,600 |
| Female | 869 (36.0%) | $25,781 |
| Total | 2,415 (100.0%) | $30,488 |
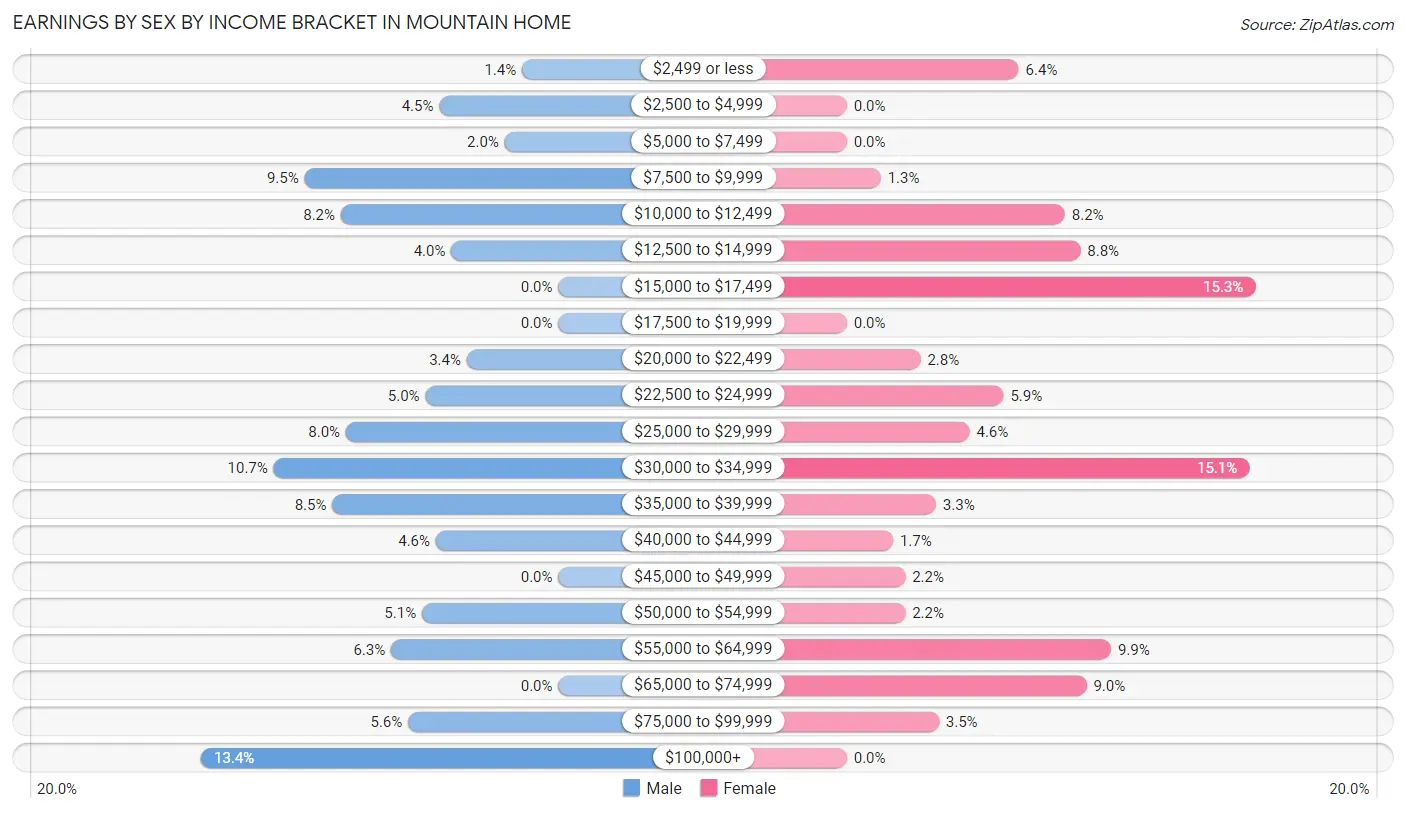
Earnings by Sex by Income Bracket in Mountain Home
The most common earnings brackets in Mountain Home are $100,000+ for men (207 | 13.4%) and $15,000 to $17,499 for women (133 | 15.3%).
| Income | Male | Female |
| $2,499 or less | 21 (1.4%) | 56 (6.4%) |
| $2,500 to $4,999 | 69 (4.5%) | 0 (0.0%) |
| $5,000 to $7,499 | 31 (2.0%) | 0 (0.0%) |
| $7,500 to $9,999 | 147 (9.5%) | 11 (1.3%) |
| $10,000 to $12,499 | 126 (8.2%) | 71 (8.2%) |
| $12,500 to $14,999 | 62 (4.0%) | 76 (8.7%) |
| $15,000 to $17,499 | 0 (0.0%) | 133 (15.3%) |
| $17,500 to $19,999 | 0 (0.0%) | 0 (0.0%) |
| $20,000 to $22,499 | 53 (3.4%) | 24 (2.8%) |
| $22,500 to $24,999 | 77 (5.0%) | 51 (5.9%) |
| $25,000 to $29,999 | 123 (8.0%) | 40 (4.6%) |
| $30,000 to $34,999 | 165 (10.7%) | 131 (15.1%) |
| $35,000 to $39,999 | 131 (8.5%) | 29 (3.3%) |
| $40,000 to $44,999 | 71 (4.6%) | 15 (1.7%) |
| $45,000 to $49,999 | 0 (0.0%) | 19 (2.2%) |
| $50,000 to $54,999 | 79 (5.1%) | 19 (2.2%) |
| $55,000 to $64,999 | 97 (6.3%) | 86 (9.9%) |
| $65,000 to $74,999 | 0 (0.0%) | 78 (9.0%) |
| $75,000 to $99,999 | 87 (5.6%) | 30 (3.5%) |
| $100,000+ | 207 (13.4%) | 0 (0.0%) |
| Total | 1,546 (100.0%) | 869 (100.0%) |
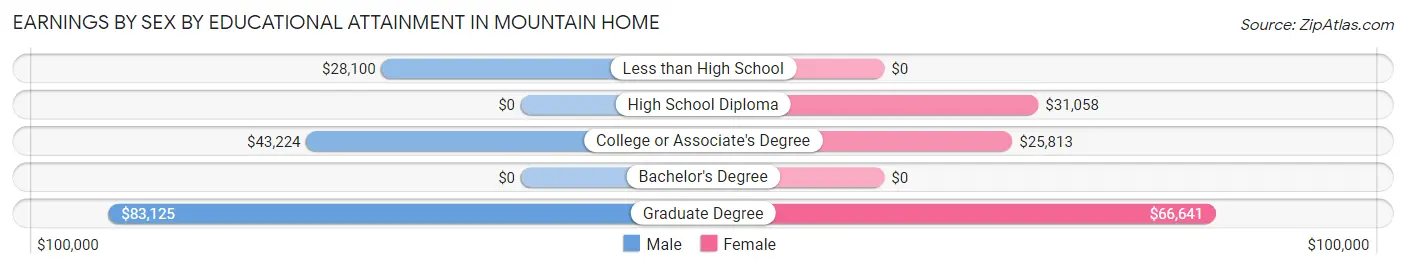
Earnings by Sex by Educational Attainment in Mountain Home
Average earnings in Mountain Home are $34,692 for men and $30,245 for women, a difference of 12.8%. Men with an educational attainment of graduate degree enjoy the highest average annual earnings of $83,125, while those with less than high school education earn the least with $28,100. Women with an educational attainment of graduate degree earn the most with the average annual earnings of $66,641, while those with college or associate's degree education have the smallest earnings of $25,813.
| Educational Attainment | Male Income | Female Income |
| Less than High School | $28,100 | $0 |
| High School Diploma | - | - |
| College or Associate's Degree | $43,224 | $25,813 |
| Bachelor's Degree | - | - |
| Graduate Degree | $83,125 | $66,641 |
| Total | $34,692 | $30,245 |
Family Income in Mountain Home
Family Income Brackets in Mountain Home
According to the Mountain Home family income data, there are 220 families falling into the $100,000 to $149,999 income range, which is the most common income bracket and makes up 18.9% of all families. Conversely, the $15,000 to $24,999 income bracket is the least frequent group with only 33 families (2.8%) belonging to this category.
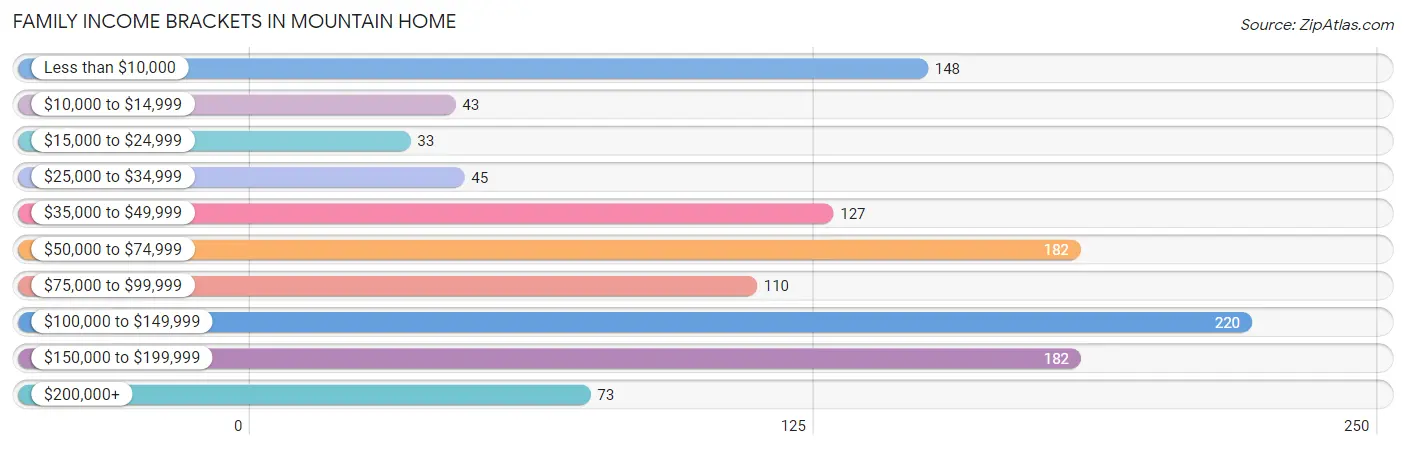
| Income Bracket | # Families | % Families |
| Less than $10,000 | 148 | 12.7% |
| $10,000 to $14,999 | 43 | 3.7% |
| $15,000 to $24,999 | 33 | 2.8% |
| $25,000 to $34,999 | 45 | 3.9% |
| $35,000 to $49,999 | 127 | 10.9% |
| $50,000 to $74,999 | 182 | 15.7% |
| $75,000 to $99,999 | 110 | 9.5% |
| $100,000 to $149,999 | 220 | 18.9% |
| $150,000 to $199,999 | 182 | 15.7% |
| $200,000+ | 73 | 6.3% |
Family Income by Famaliy Size in Mountain Home
3-person families (445 | 38.3%) account for the highest median family income in Mountain Home with $104,938 per family, while 3-person families (445 | 38.3%) have the highest median income of $34,979 per family member.
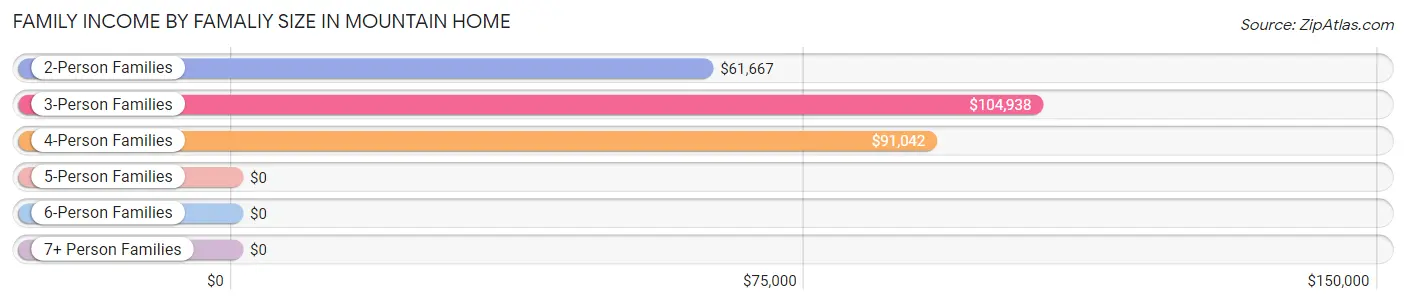
| Income Bracket | # Families | Median Income |
| 2-Person Families | 514 (44.2%) | $61,667 |
| 3-Person Families | 445 (38.3%) | $104,938 |
| 4-Person Families | 98 (8.4%) | $91,042 |
| 5-Person Families | 105 (9.0%) | $0 |
| 6-Person Families | 0 (0.0%) | $0 |
| 7+ Person Families | 0 (0.0%) | $0 |
| Total | 1,162 (100.0%) | $75,833 |
Family Income by Number of Earners in Mountain Home
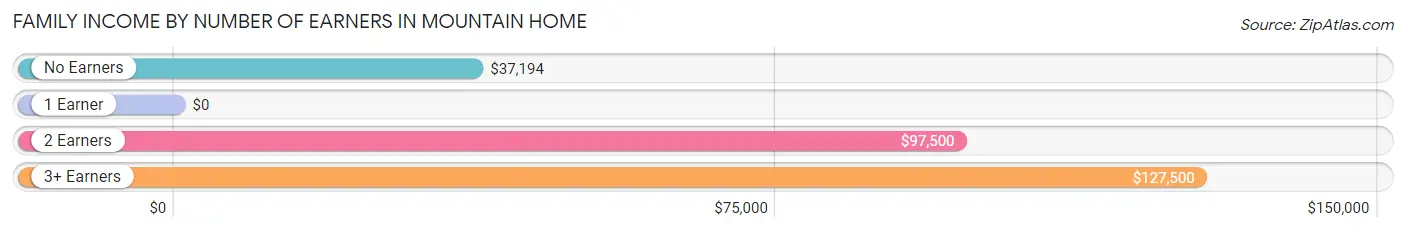
| Number of Earners | # Families | Median Income |
| No Earners | 238 (20.5%) | $37,194 |
| 1 Earner | 282 (24.3%) | $0 |
| 2 Earners | 320 (27.5%) | $97,500 |
| 3+ Earners | 322 (27.7%) | $127,500 |
| Total | 1,162 (100.0%) | $75,833 |
Household Income in Mountain Home
Household Income Brackets in Mountain Home
With 261 households falling in the category, the $35,000 to $49,999 income range is the most frequent in Mountain Home, accounting for 16.2% of all households. In contrast, only 43 households (2.7%) fall into the $10,000 to $14,999 income bracket, making it the least populous group.
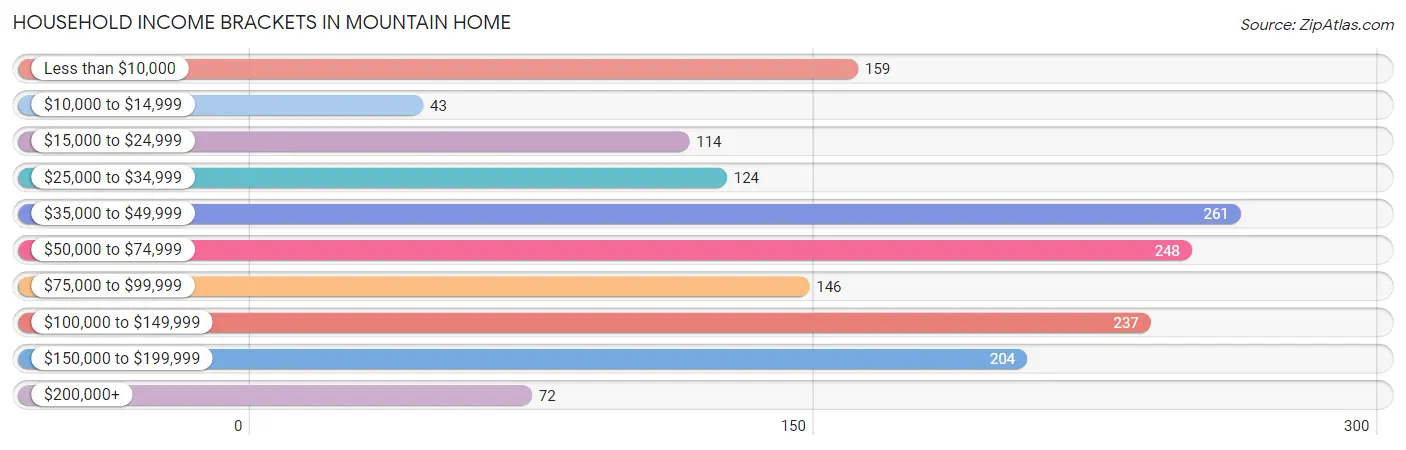
| Income Bracket | # Households | % Households |
| Less than $10,000 | 159 | 9.9% |
| $10,000 to $14,999 | 43 | 2.7% |
| $15,000 to $24,999 | 114 | 7.1% |
| $25,000 to $34,999 | 124 | 7.7% |
| $35,000 to $49,999 | 261 | 16.2% |
| $50,000 to $74,999 | 248 | 15.4% |
| $75,000 to $99,999 | 146 | 9.1% |
| $100,000 to $149,999 | 237 | 14.7% |
| $150,000 to $199,999 | 204 | 12.7% |
| $200,000+ | 72 | 4.5% |
Household Income by Householder Age in Mountain Home
The median household income in Mountain Home is $59,010, with the highest median household income of $117,887 found in the 45 to 64 years age bracket for the primary householder. A total of 565 households (35.1%) fall into this category. Meanwhile, the 15 to 24 years age bracket for the primary householder has the lowest median household income of $0, with 95 households (5.9%) in this group.
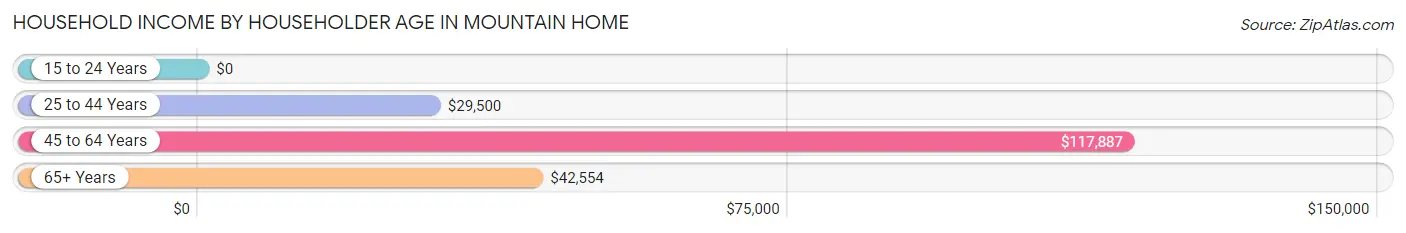
| Income Bracket | # Households | Median Income |
| 15 to 24 Years | 95 (5.9%) | $0 |
| 25 to 44 Years | 424 (26.4%) | $29,500 |
| 45 to 64 Years | 565 (35.1%) | $117,887 |
| 65+ Years | 525 (32.6%) | $42,554 |
| Total | 1,609 (100.0%) | $59,010 |
Poverty in Mountain Home
Income Below Poverty by Sex and Age in Mountain Home
With 13.7% poverty level for males and 11.3% for females among the residents of Mountain Home, 25 to 34 year old males and 18 to 24 year old females are the most vulnerable to poverty, with 147 males (42.6%) and 108 females (40.0%) in their respective age groups living below the poverty level.
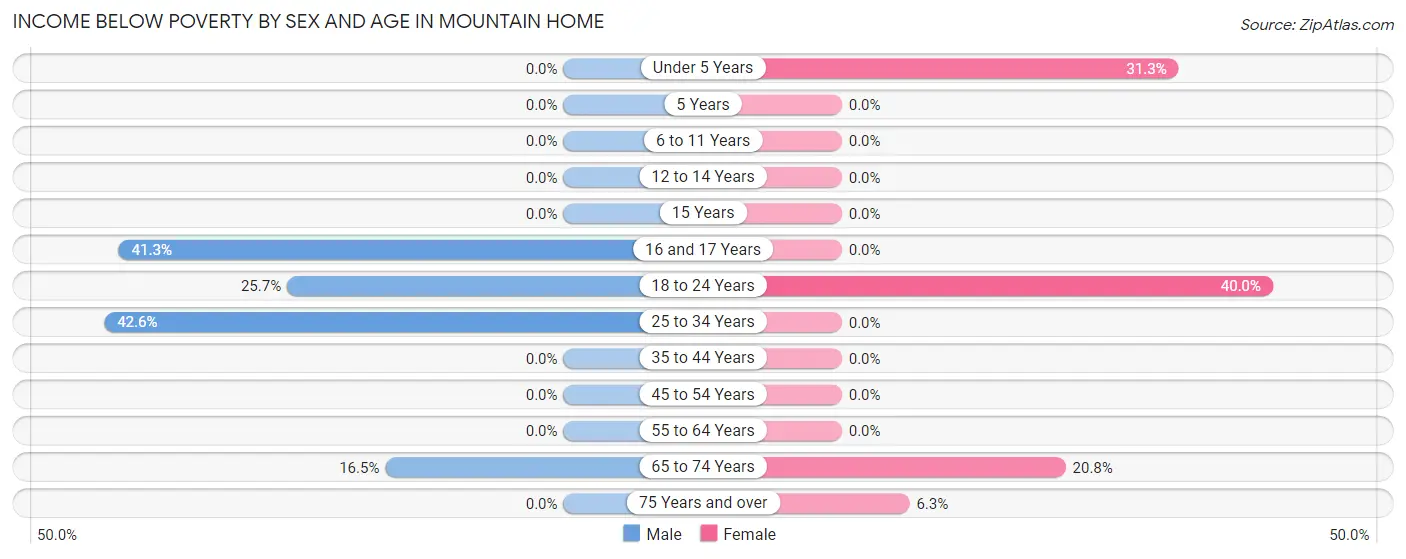
| Age Bracket | Male | Female |
| Under 5 Years | 0 (0.0%) | 30 (31.2%) |
| 5 Years | 0 (0.0%) | 0 (0.0%) |
| 6 to 11 Years | 0 (0.0%) | 0 (0.0%) |
| 12 to 14 Years | 0 (0.0%) | 0 (0.0%) |
| 15 Years | 0 (0.0%) | 0 (0.0%) |
| 16 and 17 Years | 52 (41.3%) | 0 (0.0%) |
| 18 to 24 Years | 59 (25.7%) | 108 (40.0%) |
| 25 to 34 Years | 147 (42.6%) | 0 (0.0%) |
| 35 to 44 Years | 0 (0.0%) | 0 (0.0%) |
| 45 to 54 Years | 0 (0.0%) | 0 (0.0%) |
| 55 to 64 Years | 0 (0.0%) | 0 (0.0%) |
| 65 to 74 Years | 40 (16.5%) | 43 (20.8%) |
| 75 Years and over | 0 (0.0%) | 12 (6.3%) |
| Total | 298 (13.7%) | 193 (11.3%) |
Income Above Poverty by Sex and Age in Mountain Home
According to the poverty statistics in Mountain Home, males aged under 5 years and females aged 6 to 11 years are the age groups that are most secure financially, with 100.0% of males and 100.0% of females in these age groups living above the poverty line.
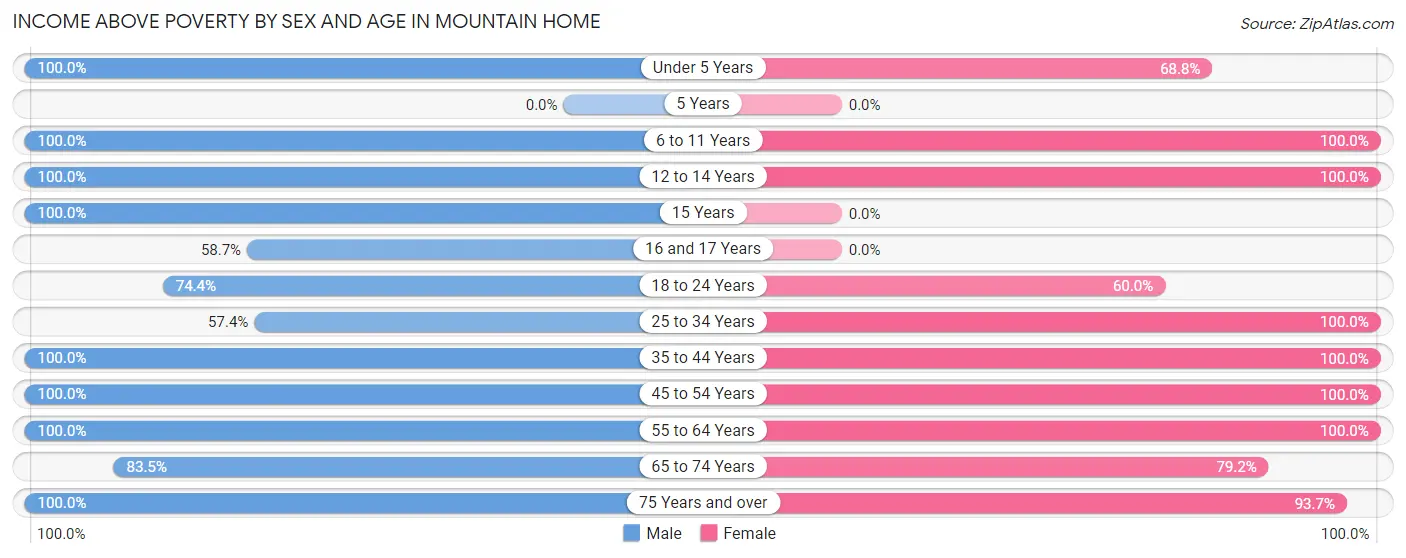
| Age Bracket | Male | Female |
| Under 5 Years | 31 (100.0%) | 66 (68.8%) |
| 5 Years | 0 (0.0%) | 0 (0.0%) |
| 6 to 11 Years | 39 (100.0%) | 99 (100.0%) |
| 12 to 14 Years | 147 (100.0%) | 66 (100.0%) |
| 15 Years | 15 (100.0%) | 0 (0.0%) |
| 16 and 17 Years | 74 (58.7%) | 0 (0.0%) |
| 18 to 24 Years | 171 (74.4%) | 162 (60.0%) |
| 25 to 34 Years | 198 (57.4%) | 162 (100.0%) |
| 35 to 44 Years | 173 (100.0%) | 81 (100.0%) |
| 45 to 54 Years | 350 (100.0%) | 287 (100.0%) |
| 55 to 64 Years | 337 (100.0%) | 253 (100.0%) |
| 65 to 74 Years | 202 (83.5%) | 164 (79.2%) |
| 75 Years and over | 145 (100.0%) | 179 (93.7%) |
| Total | 1,882 (86.3%) | 1,519 (88.7%) |
Income Below Poverty Among Married-Couple Families in Mountain Home
The poverty statistics for married-couple families in Mountain Home show that 17.7% or 190 of the total 1,075 families live below the poverty line. Families with 1 or 2 children have the highest poverty rate of 29.0%, comprising of 147 families. On the other hand, families with no children have the lowest poverty rate of 7.6%, which includes 43 families.
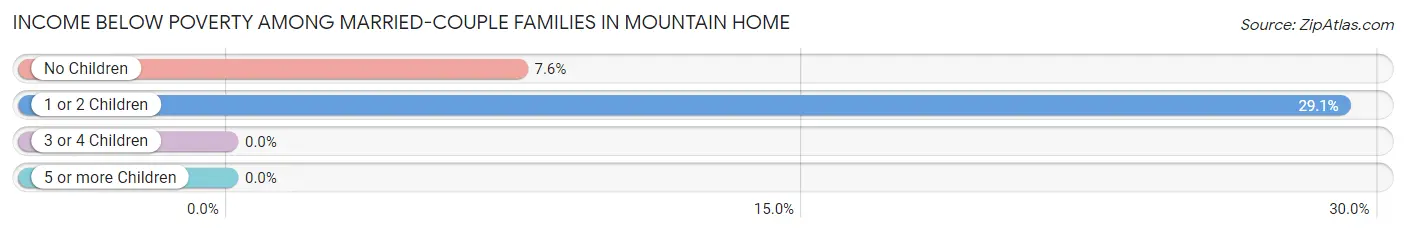
| Children | Above Poverty | Below Poverty |
| No Children | 526 (92.4%) | 43 (7.6%) |
| 1 or 2 Children | 359 (71.0%) | 147 (29.0%) |
| 3 or 4 Children | 0 (0.0%) | 0 (0.0%) |
| 5 or more Children | 0 (0.0%) | 0 (0.0%) |
| Total | 885 (82.3%) | 190 (17.7%) |
Income Below Poverty Among Single-Parent Households in Mountain Home
| Children | Single Father | Single Mother |
| No Children | 0 (0.0%) | 0 (0.0%) |
| 1 or 2 Children | 0 (0.0%) | 0 (0.0%) |
| 3 or 4 Children | 0 (0.0%) | 0 (0.0%) |
| 5 or more Children | 0 (0.0%) | 0 (0.0%) |
| Total | 0 (0.0%) | 0 (0.0%) |
Income Below Poverty Among Married-Couple vs Single-Parent Households in Mountain Home
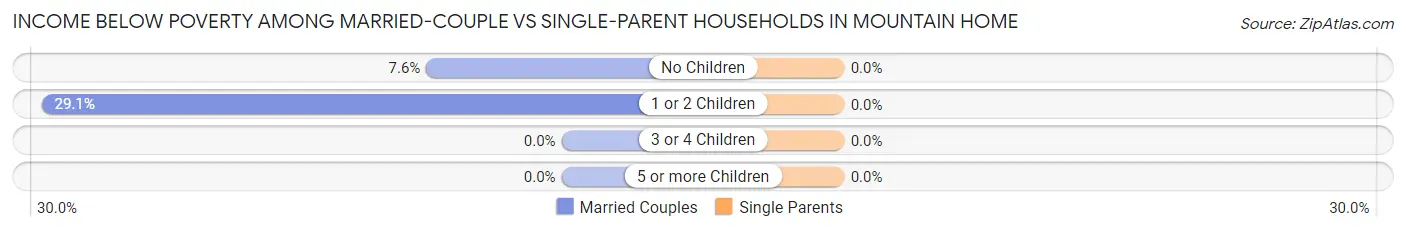
| Children | Married-Couple Families | Single-Parent Households |
| No Children | 43 (7.6%) | 0 (0.0%) |
| 1 or 2 Children | 147 (29.0%) | 0 (0.0%) |
| 3 or 4 Children | 0 (0.0%) | 0 (0.0%) |
| 5 or more Children | 0 (0.0%) | 0 (0.0%) |
| Total | 190 (17.7%) | 0 (0.0%) |
Race in Mountain Home
The most populous races in Mountain Home are White / Caucasian (3,668 | 91.1%), Hispanic or Latino (714 | 17.7%), and Two or more Races (300 | 7.4%).
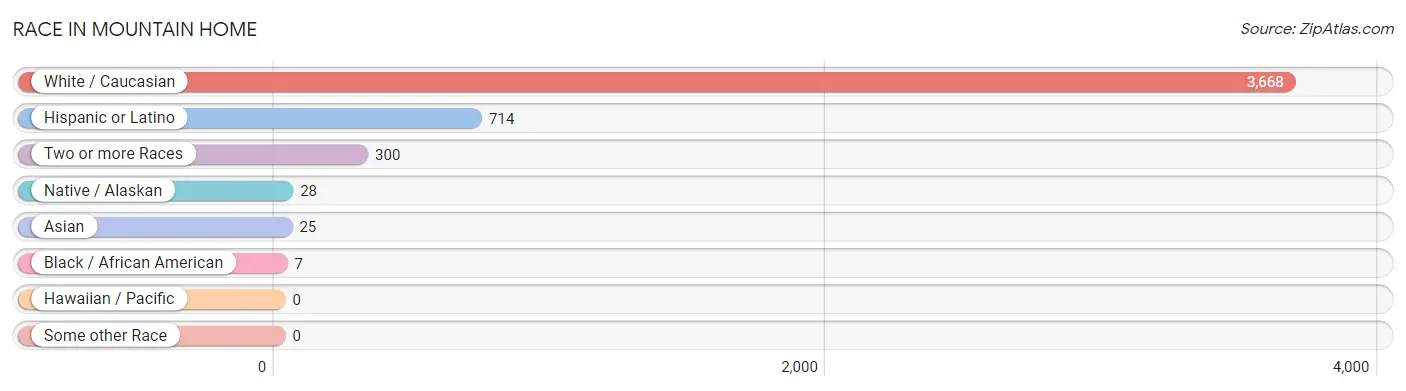
| Race | # Population | % Population |
| Asian | 25 | 0.6% |
| Black / African American | 7 | 0.2% |
| Hawaiian / Pacific | 0 | 0.0% |
| Hispanic or Latino | 714 | 17.7% |
| Native / Alaskan | 28 | 0.7% |
| White / Caucasian | 3,668 | 91.1% |
| Two or more Races | 300 | 7.4% |
| Some other Race | 0 | 0.0% |
| Total | 4,028 | 100.0% |
Ancestry in Mountain Home
The most populous ancestries reported in Mountain Home are Mexican (672 | 16.7%), American (505 | 12.5%), English (444 | 11.0%), German (430 | 10.7%), and Irish (354 | 8.8%), together accounting for 59.7% of all Mountain Home residents.
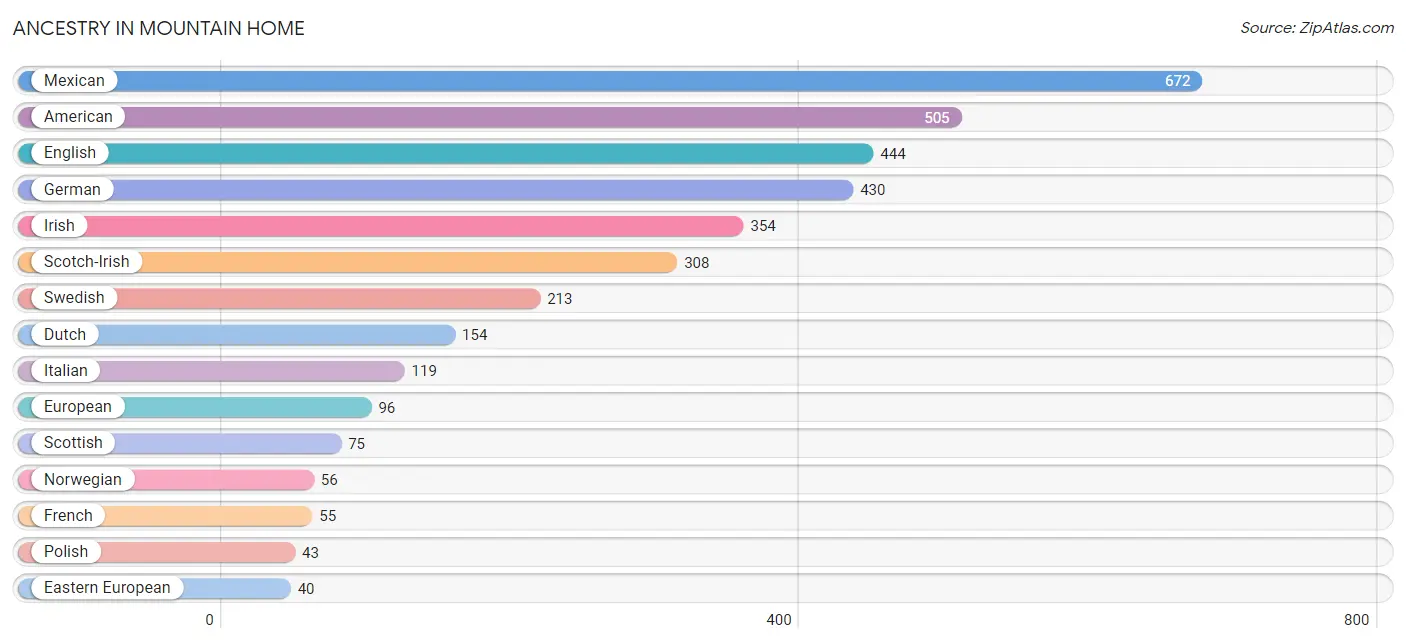
| Ancestry | # Population | % Population |
| American | 505 | 12.5% |
| Austrian | 9 | 0.2% |
| Burmese | 25 | 0.6% |
| Cherokee | 28 | 0.7% |
| Dutch | 154 | 3.8% |
| Eastern European | 40 | 1.0% |
| Ecuadorian | 27 | 0.7% |
| English | 444 | 11.0% |
| European | 96 | 2.4% |
| French | 55 | 1.4% |
| German | 430 | 10.7% |
| Hungarian | 22 | 0.5% |
| Irish | 354 | 8.8% |
| Italian | 119 | 2.9% |
| Mexican | 672 | 16.7% |
| Norwegian | 56 | 1.4% |
| Polish | 43 | 1.1% |
| Puerto Rican | 15 | 0.4% |
| Scandinavian | 14 | 0.4% |
| Scotch-Irish | 308 | 7.6% |
| Scottish | 75 | 1.9% |
| Slovak | 21 | 0.5% |
| South American | 27 | 0.7% |
| Swedish | 213 | 5.3% |
| Welsh | 34 | 0.8% | View All 25 Rows |
Immigrants in Mountain Home
The most numerous immigrant groups reported in Mountain Home came from Latin America (566 | 14.1%), Central America (539 | 13.4%), Mexico (539 | 13.4%), Ecuador (27 | 0.7%), and South America (27 | 0.7%), together accounting for 42.1% of all Mountain Home residents.
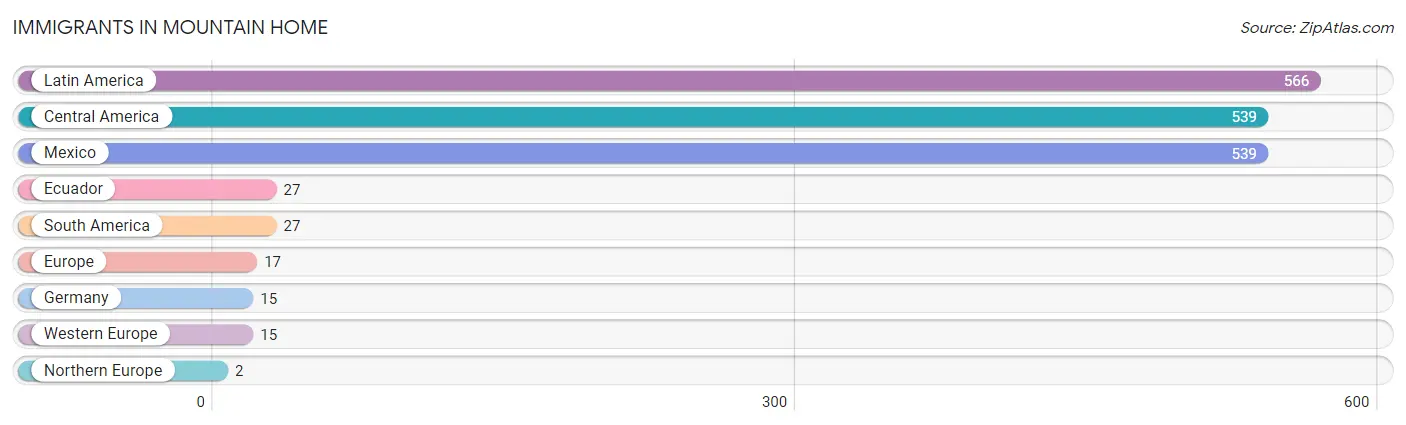
| Immigration Origin | # Population | % Population |
| Central America | 539 | 13.4% |
| Ecuador | 27 | 0.7% |
| Europe | 17 | 0.4% |
| Germany | 15 | 0.4% |
| Latin America | 566 | 14.1% |
| Mexico | 539 | 13.4% |
| Northern Europe | 2 | 0.1% |
| South America | 27 | 0.7% |
| Western Europe | 15 | 0.4% | View All 9 Rows |
Sex and Age in Mountain Home
Sex and Age in Mountain Home
The most populous age groups in Mountain Home are 55 to 59 Years (259 | 11.4%) for men and 50 to 54 Years (220 | 12.6%) for women.
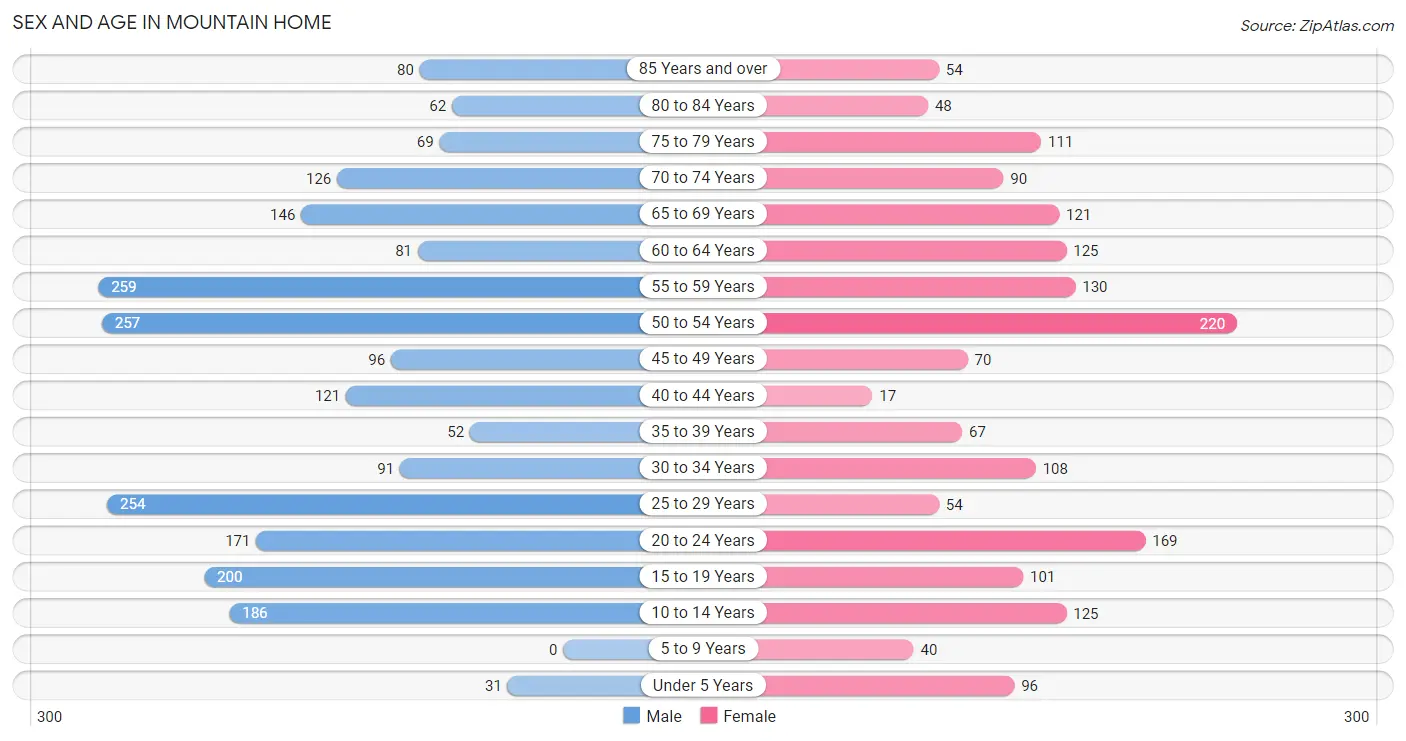
| Age Bracket | Male | Female |
| Under 5 Years | 31 (1.4%) | 96 (5.5%) |
| 5 to 9 Years | 0 (0.0%) | 40 (2.3%) |
| 10 to 14 Years | 186 (8.2%) | 125 (7.2%) |
| 15 to 19 Years | 200 (8.8%) | 101 (5.8%) |
| 20 to 24 Years | 171 (7.5%) | 169 (9.7%) |
| 25 to 29 Years | 254 (11.1%) | 54 (3.1%) |
| 30 to 34 Years | 91 (4.0%) | 108 (6.2%) |
| 35 to 39 Years | 52 (2.3%) | 67 (3.8%) |
| 40 to 44 Years | 121 (5.3%) | 17 (1.0%) |
| 45 to 49 Years | 96 (4.2%) | 70 (4.0%) |
| 50 to 54 Years | 257 (11.3%) | 220 (12.6%) |
| 55 to 59 Years | 259 (11.4%) | 130 (7.4%) |
| 60 to 64 Years | 81 (3.5%) | 125 (7.2%) |
| 65 to 69 Years | 146 (6.4%) | 121 (6.9%) |
| 70 to 74 Years | 126 (5.5%) | 90 (5.1%) |
| 75 to 79 Years | 69 (3.0%) | 111 (6.4%) |
| 80 to 84 Years | 62 (2.7%) | 48 (2.8%) |
| 85 Years and over | 80 (3.5%) | 54 (3.1%) |
| Total | 2,282 (100.0%) | 1,746 (100.0%) |
Families and Households in Mountain Home
Median Family Size in Mountain Home
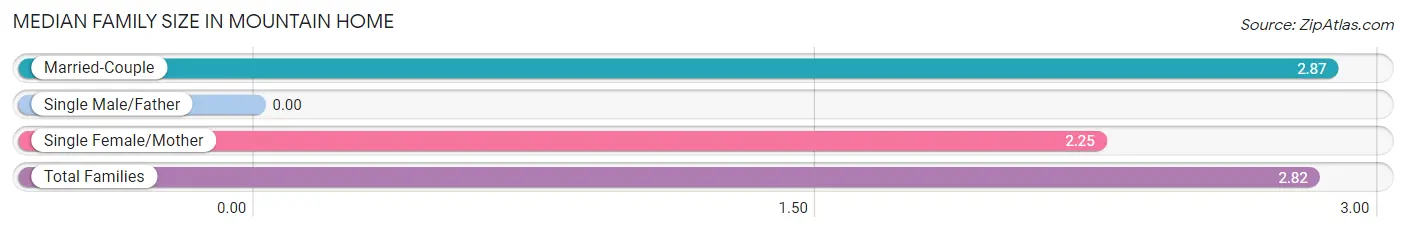
| Family Type | # Families | Family Size |
| Married-Couple | 1,075 (92.5%) | 2.87 |
| Single Male/Father | 0 (0.0%) | - |
| Single Female/Mother | 87 (7.5%) | 2.25 |
| Total Families | 1,162 (100.0%) | 2.82 |
Median Household Size in Mountain Home
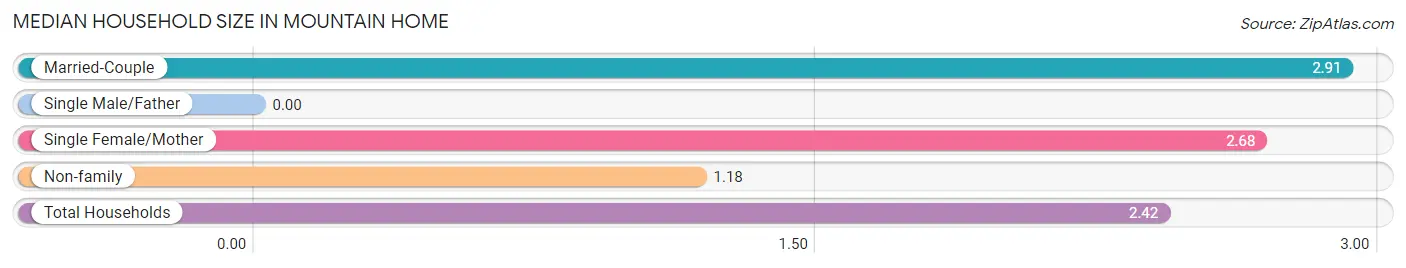
| Household Type | # Households | Household Size |
| Married-Couple | 1,075 (66.8%) | 2.91 |
| Single Male/Father | 0 (0.0%) | - |
| Single Female/Mother | 87 (5.4%) | 2.68 |
| Non-family | 447 (27.8%) | 1.18 |
| Total Households | 1,609 (100.0%) | 2.42 |
Household Size by Marriage Status in Mountain Home
Out of a total of 1,609 households in Mountain Home, 1,162 (72.2%) are family households, while 447 (27.8%) are nonfamily households. The most numerous type of family households are 3-person households, comprising 481, and the most common type of nonfamily households are 1-person households, comprising 371.
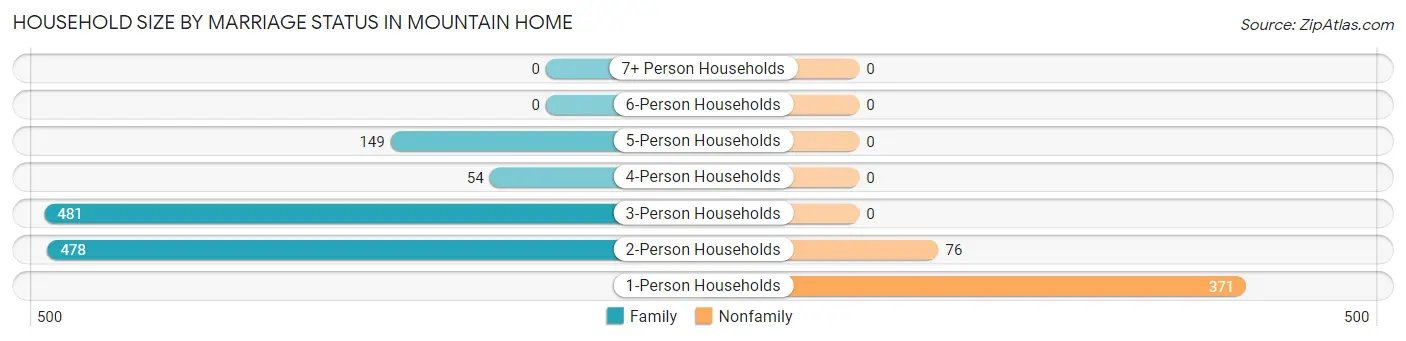
| Household Size | Family Households | Nonfamily Households |
| 1-Person Households | - | 371 (23.1%) |
| 2-Person Households | 478 (29.7%) | 76 (4.7%) |
| 3-Person Households | 481 (29.9%) | 0 (0.0%) |
| 4-Person Households | 54 (3.4%) | 0 (0.0%) |
| 5-Person Households | 149 (9.3%) | 0 (0.0%) |
| 6-Person Households | 0 (0.0%) | 0 (0.0%) |
| 7+ Person Households | 0 (0.0%) | 0 (0.0%) |
| Total | 1,162 (72.2%) | 447 (27.8%) |
Female Fertility in Mountain Home
Fertility by Age in Mountain Home
| Age Bracket | Women with Births | Births / 1,000 Women |
| 15 to 19 years | 0 (0.0%) | 0.0 |
| 20 to 34 years | 0 (0.0%) | 0.0 |
| 35 to 50 years | 0 (0.0%) | 0.0 |
| Total | 0 (0.0%) | 0.0 |
Fertility by Age by Marriage Status in Mountain Home
| Age Bracket | Married | Unmarried |
| 15 to 19 years | 0 (0.0%) | 0 (0.0%) |
| 20 to 34 years | 0 (0.0%) | 0 (0.0%) |
| 35 to 50 years | 0 (0.0%) | 0 (0.0%) |
| Total | 0 (0.0%) | 0 (0.0%) |
Fertility by Education in Mountain Home
| Educational Attainment | Women with Births | Births / 1,000 Women |
| Less than High School | 0 (0.0%) | 0.0 |
| High School Diploma | 0 (0.0%) | 0.0 |
| College or Associate's Degree | 0 (0.0%) | 0.0 |
| Bachelor's Degree | 0 (0.0%) | 0.0 |
| Graduate Degree | 0 (0.0%) | 0.0 |
| Total | 0 (0.0%) | 0.0 |
Fertility by Education by Marriage Status in Mountain Home
| Educational Attainment | Married | Unmarried |
| Less than High School | 0 (0.0%) | 0 (0.0%) |
| High School Diploma | 0 (0.0%) | 0 (0.0%) |
| College or Associate's Degree | 0 (0.0%) | 0 (0.0%) |
| Bachelor's Degree | 0 (0.0%) | 0 (0.0%) |
| Graduate Degree | 0 (0.0%) | 0 (0.0%) |
| Total | 0 (0.0%) | 0 (0.0%) |
Employment Characteristics in Mountain Home
Employment by Class of Employer in Mountain Home
Among the 2,332 employed individuals in Mountain Home, private company employees (1,667 | 71.5%), self-employed (not incorporated) (230 | 9.9%), and local government employees (195 | 8.4%) make up the most common classes of employment.
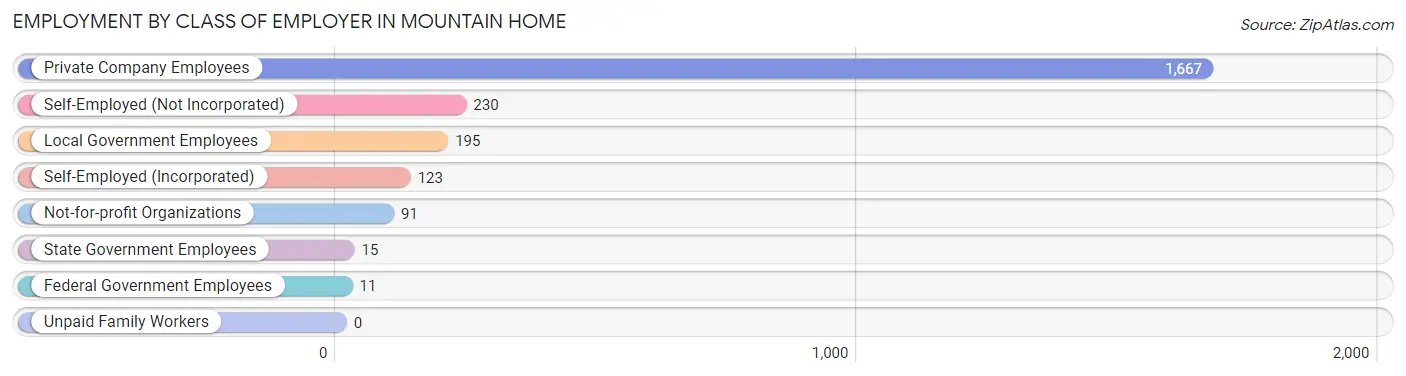
| Employer Class | # Employees | % Employees |
| Private Company Employees | 1,667 | 71.5% |
| Self-Employed (Incorporated) | 123 | 5.3% |
| Self-Employed (Not Incorporated) | 230 | 9.9% |
| Not-for-profit Organizations | 91 | 3.9% |
| Local Government Employees | 195 | 8.4% |
| State Government Employees | 15 | 0.6% |
| Federal Government Employees | 11 | 0.5% |
| Unpaid Family Workers | 0 | 0.0% |
| Total | 2,332 | 100.0% |
Employment Status by Age in Mountain Home
According to the labor force statistics for Mountain Home, out of the total population over 16 years of age (3,535), 66.5% or 2,351 individuals are in the labor force, with 0.8% or 19 of them unemployed. The age group with the highest labor force participation rate is 30 to 34 years, with 100.0% or 199 individuals in the labor force. Within the labor force, the 35 to 44 years age range has the highest percentage of unemployed individuals, with 7.9% or 18 of them being unemployed.
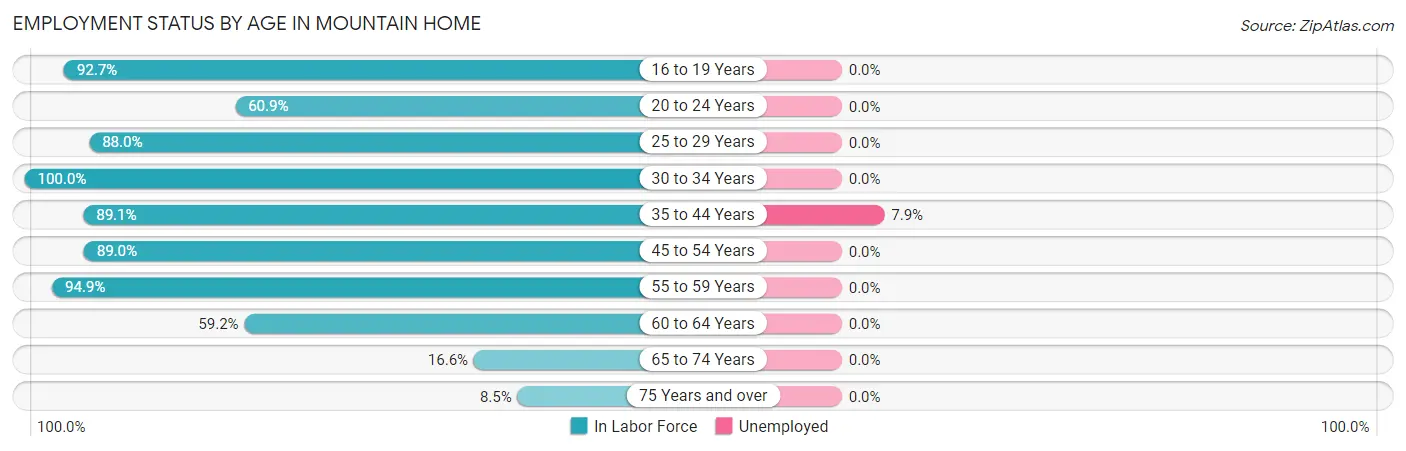
| Age Bracket | In Labor Force | Unemployed |
| 16 to 19 Years | 265 (92.7%) | 0 (0.0%) |
| 20 to 24 Years | 207 (60.9%) | 0 (0.0%) |
| 25 to 29 Years | 271 (88.0%) | 0 (0.0%) |
| 30 to 34 Years | 199 (100.0%) | 0 (0.0%) |
| 35 to 44 Years | 229 (89.1%) | 18 (7.9%) |
| 45 to 54 Years | 572 (89.0%) | 0 (0.0%) |
| 55 to 59 Years | 369 (94.9%) | 0 (0.0%) |
| 60 to 64 Years | 122 (59.2%) | 0 (0.0%) |
| 65 to 74 Years | 80 (16.6%) | 0 (0.0%) |
| 75 Years and over | 36 (8.5%) | 0 (0.0%) |
| Total | 2,351 (66.5%) | 19 (0.8%) |
Employment Status by Educational Attainment in Mountain Home
According to labor force statistics for Mountain Home, 88.0% of individuals (1,762) out of the total population between 25 and 64 years of age (2,002) are in the labor force, with 1.0% or 18 of them being unemployed. The group with the highest labor force participation rate are those with the educational attainment of high school diploma, with 95.1% or 656 individuals in the labor force. Within the labor force, individuals with bachelor's degree or higher education have the highest percentage of unemployment, with 3.0% or 18 of them being unemployed.
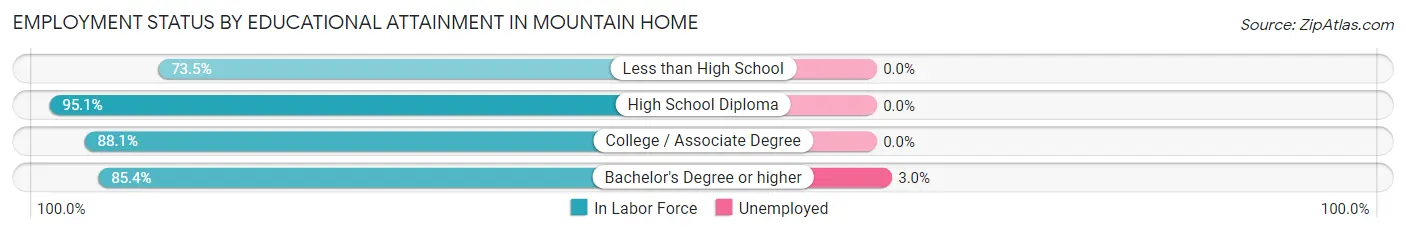
| Educational Attainment | In Labor Force | Unemployed |
| Less than High School | 158 (73.5%) | 0 (0.0%) |
| High School Diploma | 656 (95.1%) | 0 (0.0%) |
| College / Associate Degree | 355 (88.1%) | 0 (0.0%) |
| Bachelor's Degree or higher | 593 (85.4%) | 21 (3.0%) |
| Total | 1,762 (88.0%) | 20 (1.0%) |
Employment Occupations by Sex in Mountain Home
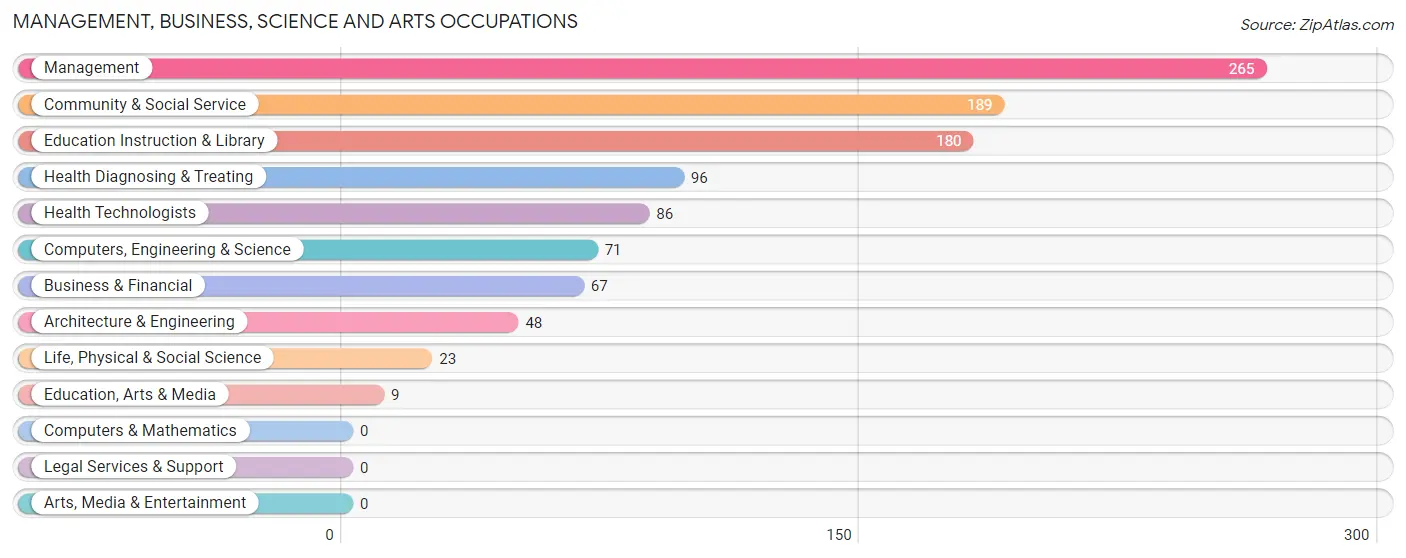
Management, Business, Science and Arts Occupations
The most common Management, Business, Science and Arts occupations in Mountain Home are Management (265 | 11.4%), Community & Social Service (189 | 8.1%), Education Instruction & Library (180 | 7.7%), Health Diagnosing & Treating (96 | 4.1%), and Health Technologists (86 | 3.7%).
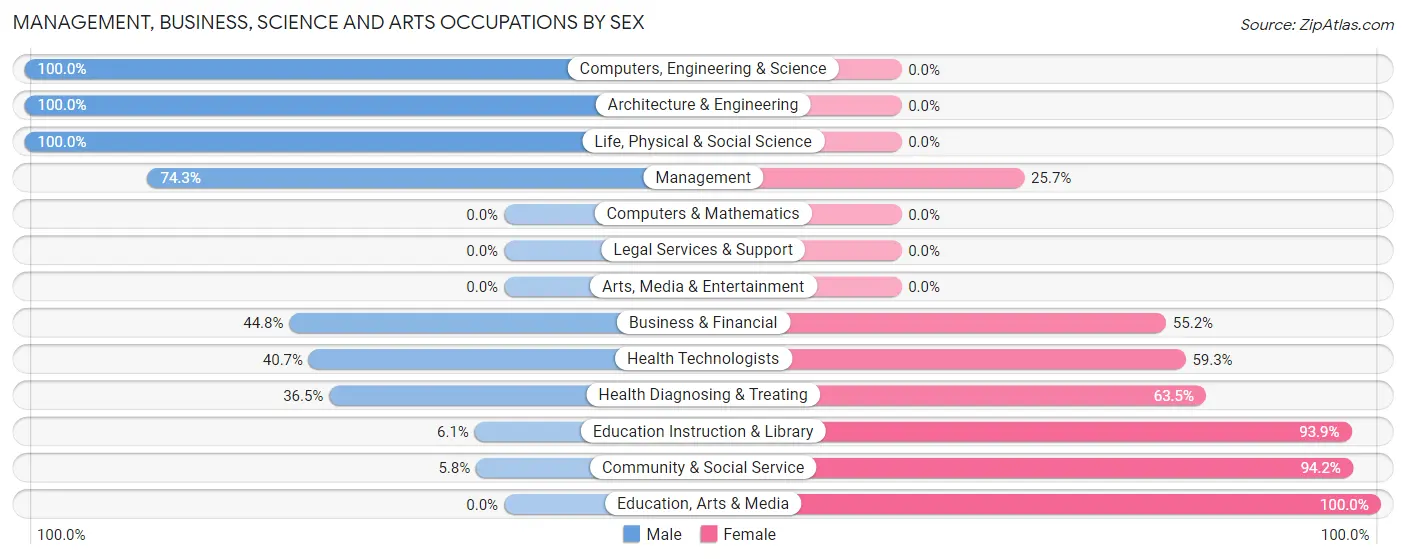
Management, Business, Science and Arts Occupations by Sex
Within the Management, Business, Science and Arts occupations in Mountain Home, the most male-oriented occupations are Computers, Engineering & Science (100.0%), Architecture & Engineering (100.0%), and Life, Physical & Social Science (100.0%), while the most female-oriented occupations are Education, Arts & Media (100.0%), Community & Social Service (94.2%), and Education Instruction & Library (93.9%).
| Occupation | Male | Female |
| Management | 197 (74.3%) | 68 (25.7%) |
| Business & Financial | 30 (44.8%) | 37 (55.2%) |
| Computers, Engineering & Science | 71 (100.0%) | 0 (0.0%) |
| Computers & Mathematics | 0 (0.0%) | 0 (0.0%) |
| Architecture & Engineering | 48 (100.0%) | 0 (0.0%) |
| Life, Physical & Social Science | 23 (100.0%) | 0 (0.0%) |
| Community & Social Service | 11 (5.8%) | 178 (94.2%) |
| Education, Arts & Media | 0 (0.0%) | 9 (100.0%) |
| Legal Services & Support | 0 (0.0%) | 0 (0.0%) |
| Education Instruction & Library | 11 (6.1%) | 169 (93.9%) |
| Arts, Media & Entertainment | 0 (0.0%) | 0 (0.0%) |
| Health Diagnosing & Treating | 35 (36.5%) | 61 (63.5%) |
| Health Technologists | 35 (40.7%) | 51 (59.3%) |
| Total (Category) | 344 (50.0%) | 344 (50.0%) |
| Total (Overall) | 1,463 (62.7%) | 869 (37.3%) |
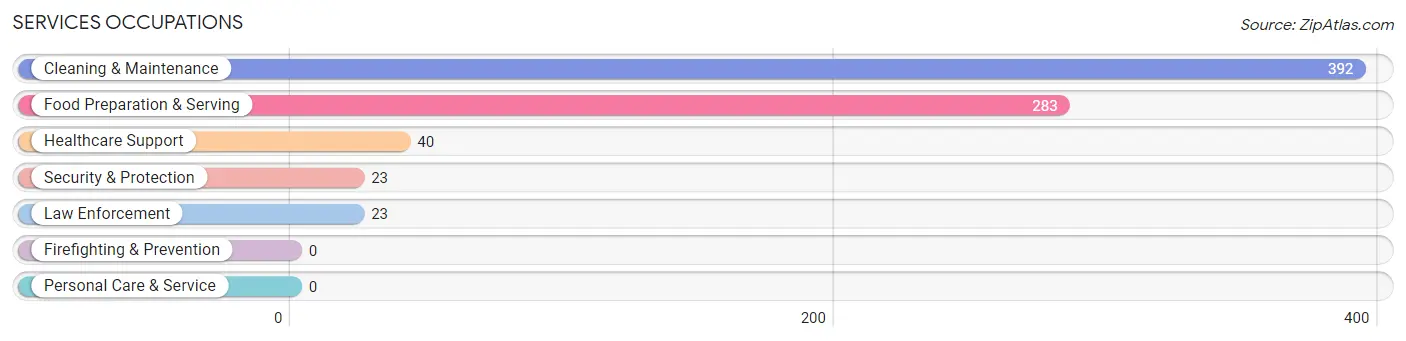
Services Occupations
The most common Services occupations in Mountain Home are Cleaning & Maintenance (392 | 16.8%), Food Preparation & Serving (283 | 12.1%), Healthcare Support (40 | 1.7%), Security & Protection (23 | 1.0%), and Law Enforcement (23 | 1.0%).
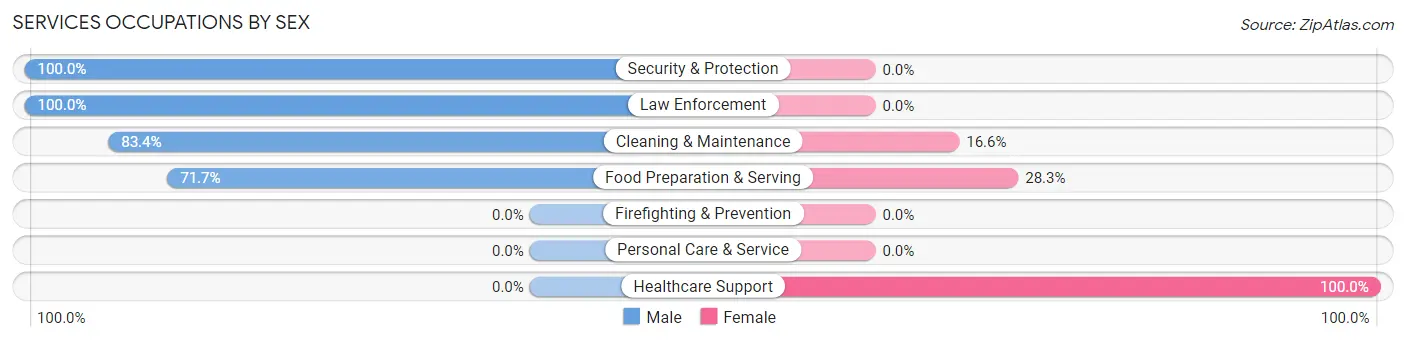
Services Occupations by Sex
Within the Services occupations in Mountain Home, the most male-oriented occupations are Security & Protection (100.0%), Law Enforcement (100.0%), and Cleaning & Maintenance (83.4%), while the most female-oriented occupations are Healthcare Support (100.0%), Food Preparation & Serving (28.3%), and Cleaning & Maintenance (16.6%).
| Occupation | Male | Female |
| Healthcare Support | 0 (0.0%) | 40 (100.0%) |
| Security & Protection | 23 (100.0%) | 0 (0.0%) |
| Firefighting & Prevention | 0 (0.0%) | 0 (0.0%) |
| Law Enforcement | 23 (100.0%) | 0 (0.0%) |
| Food Preparation & Serving | 203 (71.7%) | 80 (28.3%) |
| Cleaning & Maintenance | 327 (83.4%) | 65 (16.6%) |
| Personal Care & Service | 0 (0.0%) | 0 (0.0%) |
| Total (Category) | 553 (74.9%) | 185 (25.1%) |
| Total (Overall) | 1,463 (62.7%) | 869 (37.3%) |
Sales and Office Occupations
The most common Sales and Office occupations in Mountain Home are Sales & Related (193 | 8.3%), and Office & Administration (176 | 7.5%).
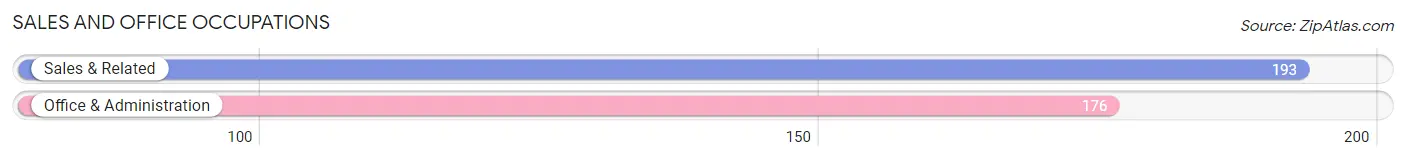
Sales and Office Occupations by Sex
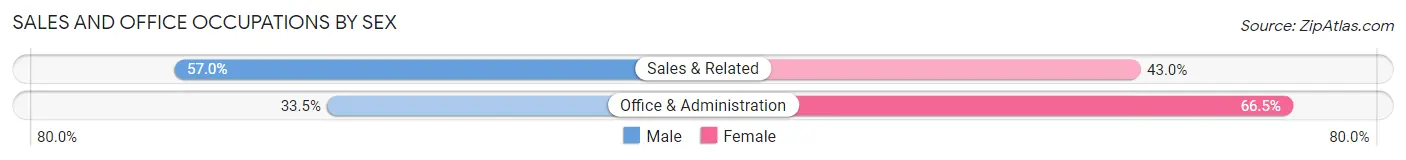
| Occupation | Male | Female |
| Sales & Related | 110 (57.0%) | 83 (43.0%) |
| Office & Administration | 59 (33.5%) | 117 (66.5%) |
| Total (Category) | 169 (45.8%) | 200 (54.2%) |
| Total (Overall) | 1,463 (62.7%) | 869 (37.3%) |
Natural Resources, Construction and Maintenance Occupations
The most common Natural Resources, Construction and Maintenance occupations in Mountain Home are Construction & Extraction (168 | 7.2%), and Installation, Maintenance & Repair (58 | 2.5%).
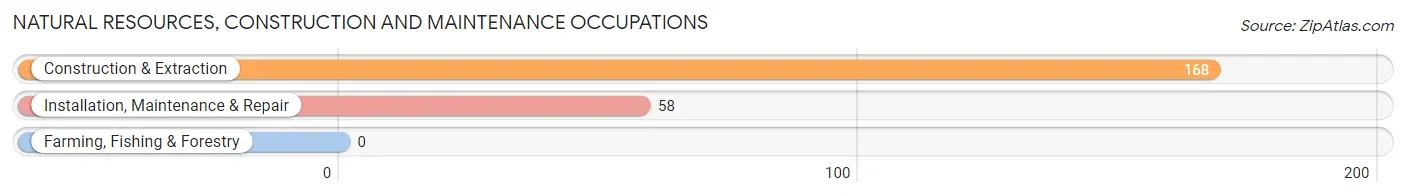
Natural Resources, Construction and Maintenance Occupations by Sex
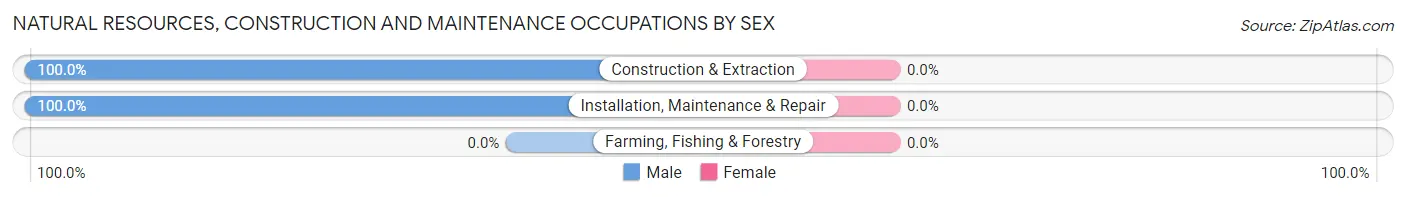
| Occupation | Male | Female |
| Farming, Fishing & Forestry | 0 (0.0%) | 0 (0.0%) |
| Construction & Extraction | 168 (100.0%) | 0 (0.0%) |
| Installation, Maintenance & Repair | 58 (100.0%) | 0 (0.0%) |
| Total (Category) | 226 (100.0%) | 0 (0.0%) |
| Total (Overall) | 1,463 (62.7%) | 869 (37.3%) |
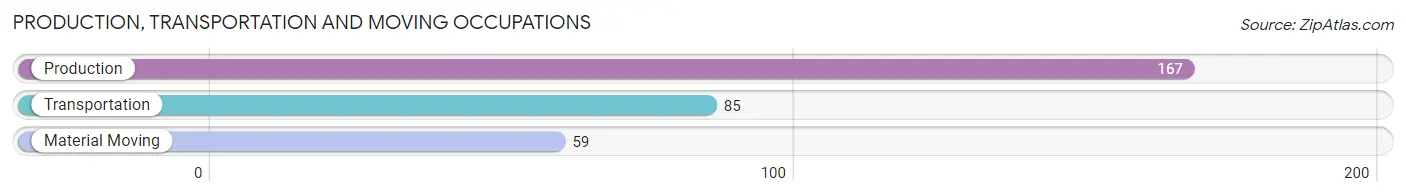
Production, Transportation and Moving Occupations
The most common Production, Transportation and Moving occupations in Mountain Home are Production (167 | 7.2%), Transportation (85 | 3.6%), and Material Moving (59 | 2.5%).
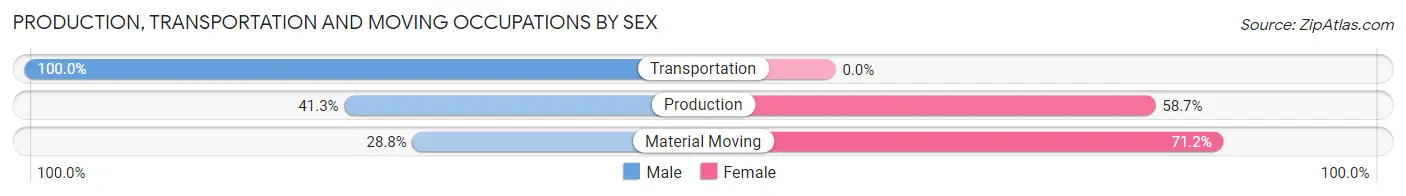
Production, Transportation and Moving Occupations by Sex
| Occupation | Male | Female |
| Production | 69 (41.3%) | 98 (58.7%) |
| Transportation | 85 (100.0%) | 0 (0.0%) |
| Material Moving | 17 (28.8%) | 42 (71.2%) |
| Total (Category) | 171 (55.0%) | 140 (45.0%) |
| Total (Overall) | 1,463 (62.7%) | 869 (37.3%) |
Employment Industries by Sex in Mountain Home
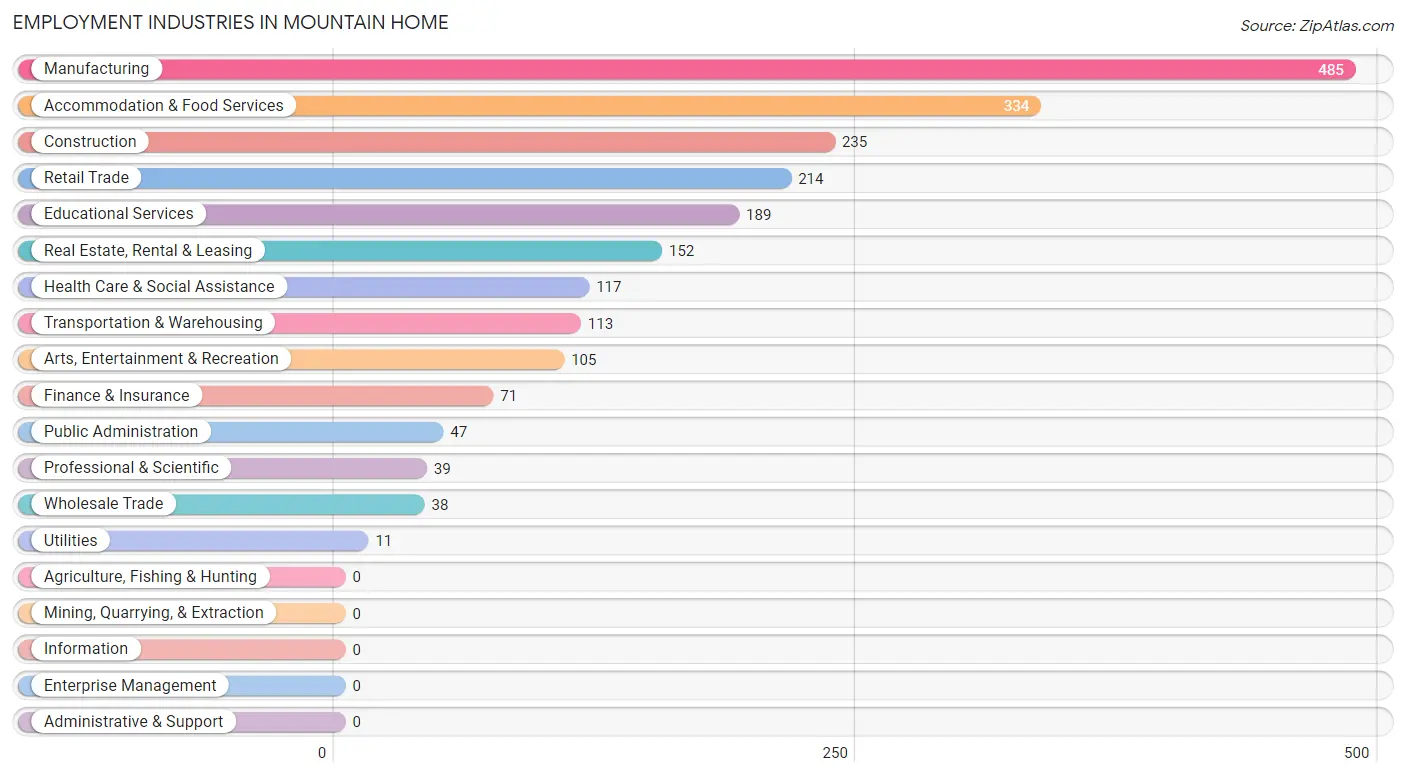
Employment Industries in Mountain Home
The major employment industries in Mountain Home include Manufacturing (485 | 20.8%), Accommodation & Food Services (334 | 14.3%), Construction (235 | 10.1%), Retail Trade (214 | 9.2%), and Educational Services (189 | 8.1%).
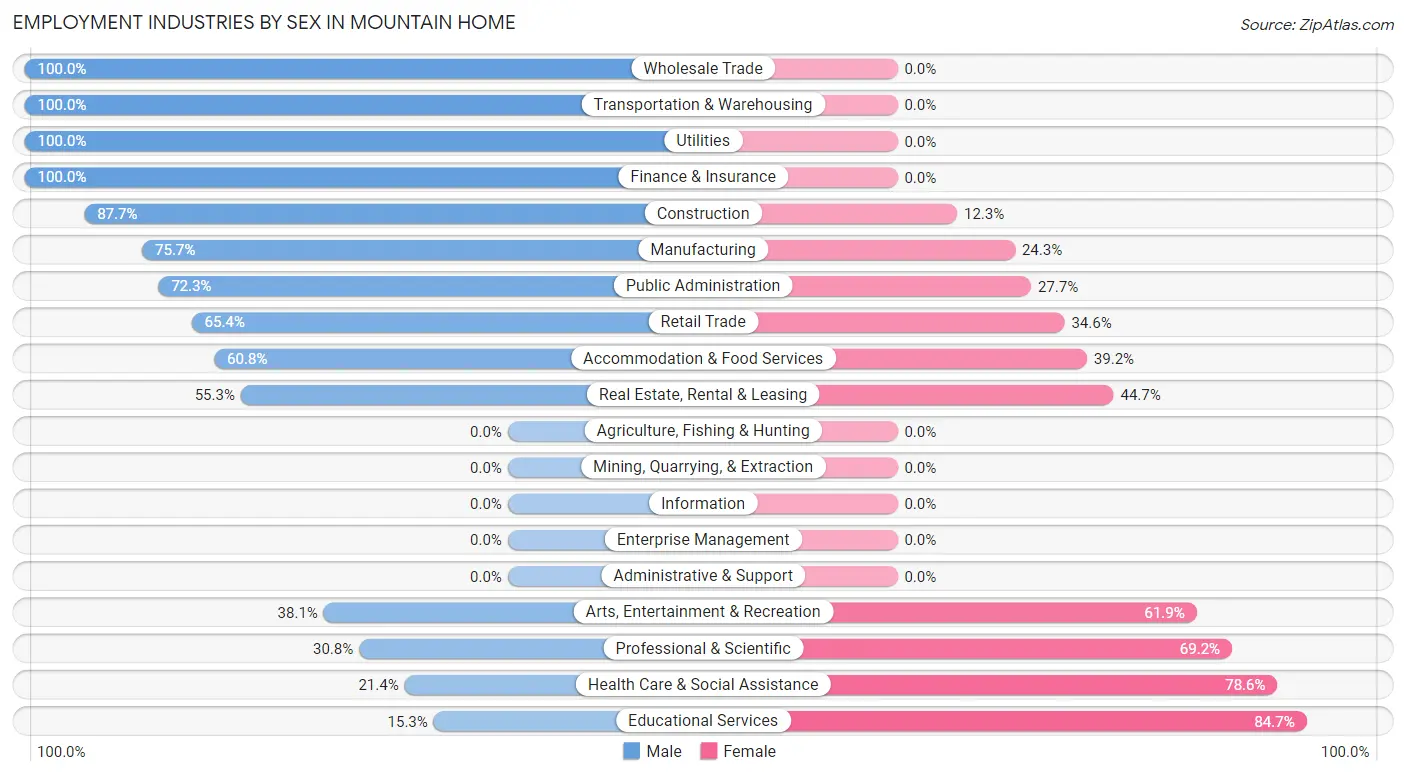
Employment Industries by Sex in Mountain Home
The Mountain Home industries that see more men than women are Wholesale Trade (100.0%), Transportation & Warehousing (100.0%), and Utilities (100.0%), whereas the industries that tend to have a higher number of women are Educational Services (84.7%), Health Care & Social Assistance (78.6%), and Professional & Scientific (69.2%).
| Industry | Male | Female |
| Agriculture, Fishing & Hunting | 0 (0.0%) | 0 (0.0%) |
| Mining, Quarrying, & Extraction | 0 (0.0%) | 0 (0.0%) |
| Construction | 206 (87.7%) | 29 (12.3%) |
| Manufacturing | 367 (75.7%) | 118 (24.3%) |
| Wholesale Trade | 38 (100.0%) | 0 (0.0%) |
| Retail Trade | 140 (65.4%) | 74 (34.6%) |
| Transportation & Warehousing | 113 (100.0%) | 0 (0.0%) |
| Utilities | 11 (100.0%) | 0 (0.0%) |
| Information | 0 (0.0%) | 0 (0.0%) |
| Finance & Insurance | 71 (100.0%) | 0 (0.0%) |
| Real Estate, Rental & Leasing | 84 (55.3%) | 68 (44.7%) |
| Professional & Scientific | 12 (30.8%) | 27 (69.2%) |
| Enterprise Management | 0 (0.0%) | 0 (0.0%) |
| Administrative & Support | 0 (0.0%) | 0 (0.0%) |
| Educational Services | 29 (15.3%) | 160 (84.7%) |
| Health Care & Social Assistance | 25 (21.4%) | 92 (78.6%) |
| Arts, Entertainment & Recreation | 40 (38.1%) | 65 (61.9%) |
| Accommodation & Food Services | 203 (60.8%) | 131 (39.2%) |
| Public Administration | 34 (72.3%) | 13 (27.7%) |
| Total | 1,463 (62.7%) | 869 (37.3%) |
Education in Mountain Home
School Enrollment in Mountain Home
The most common levels of schooling among the 708 students in Mountain Home are middle school (252 | 35.6%), high school (243 | 34.3%), and college / undergraduate (121 | 17.1%).
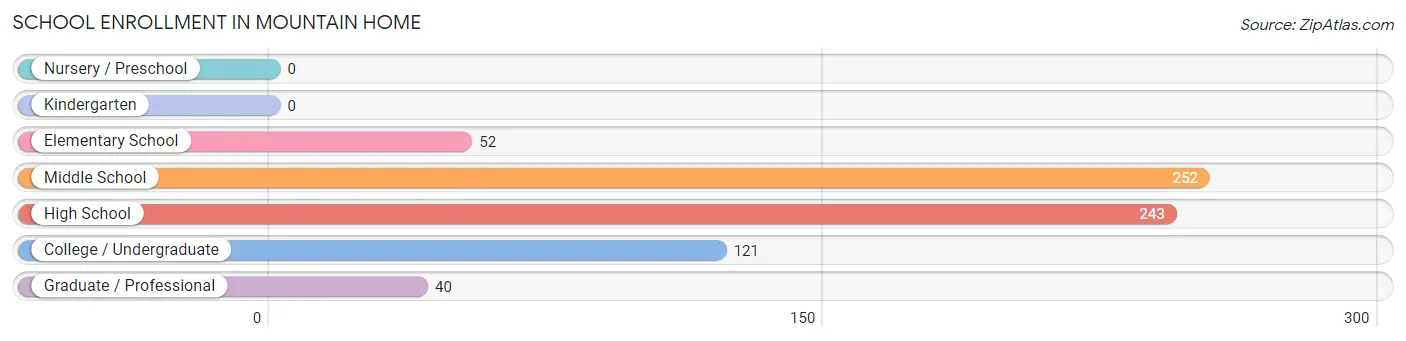
| School Level | # Students | % Students |
| Nursery / Preschool | 0 | 0.0% |
| Kindergarten | 0 | 0.0% |
| Elementary School | 52 | 7.3% |
| Middle School | 252 | 35.6% |
| High School | 243 | 34.3% |
| College / Undergraduate | 121 | 17.1% |
| Graduate / Professional | 40 | 5.7% |
| Total | 708 | 100.0% |
School Enrollment by Age by Funding Source in Mountain Home
Out of a total of 708 students who are enrolled in schools in Mountain Home, 216 (30.5%) attend a private institution, while the remaining 492 (69.5%) are enrolled in public schools. The age group of 20 to 24 year olds has the highest likelihood of being enrolled in private schools, with 22 (100.0% in the age bracket) enrolled. Conversely, the age group of 5 to 9 year old has the lowest likelihood of being enrolled in a private school, with 40 (100.0% in the age bracket) attending a public institution.
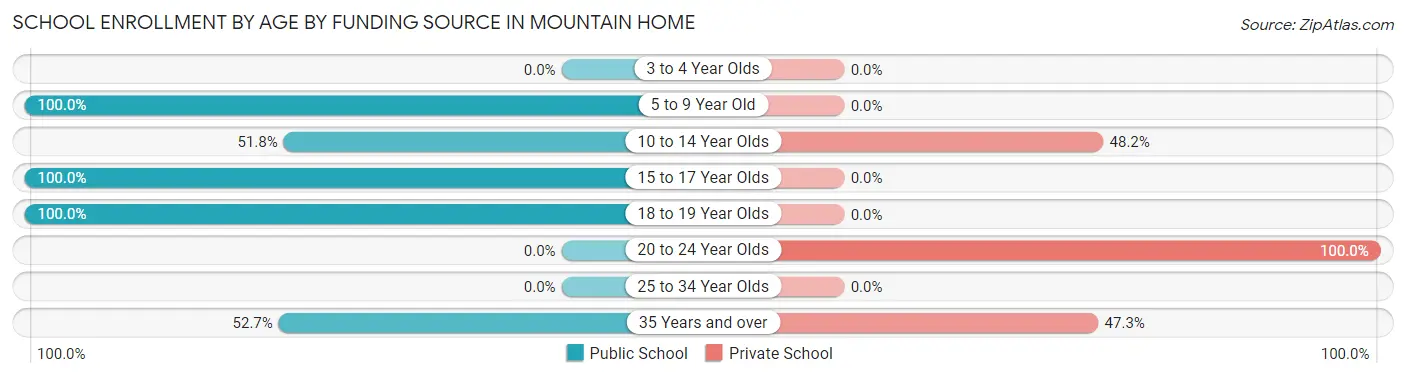
| Age Bracket | Public School | Private School |
| 3 to 4 Year Olds | 0 (0.0%) | 0 (0.0%) |
| 5 to 9 Year Old | 40 (100.0%) | 0 (0.0%) |
| 10 to 14 Year Olds | 161 (51.8%) | 150 (48.2%) |
| 15 to 17 Year Olds | 141 (100.0%) | 0 (0.0%) |
| 18 to 19 Year Olds | 101 (100.0%) | 0 (0.0%) |
| 20 to 24 Year Olds | 0 (0.0%) | 22 (100.0%) |
| 25 to 34 Year Olds | 0 (0.0%) | 0 (0.0%) |
| 35 Years and over | 49 (52.7%) | 44 (47.3%) |
| Total | 492 (69.5%) | 216 (30.5%) |
Educational Attainment by Field of Study in Mountain Home
Engineering (156 | 15.8%), communications (149 | 15.1%), computers & mathematics (145 | 14.7%), business (142 | 14.4%), and education (135 | 13.7%) are the most common fields of study among 985 individuals in Mountain Home who have obtained a bachelor's degree or higher.
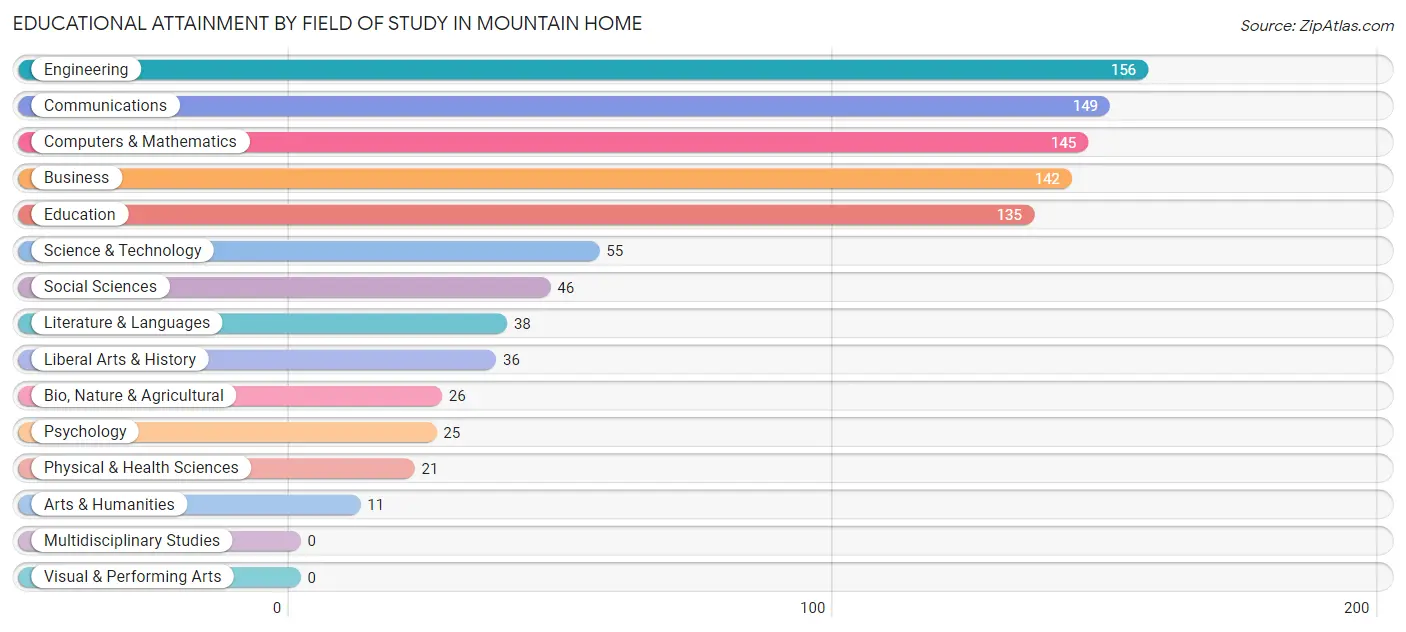
| Field of Study | # Graduates | % Graduates |
| Computers & Mathematics | 145 | 14.7% |
| Bio, Nature & Agricultural | 26 | 2.6% |
| Physical & Health Sciences | 21 | 2.1% |
| Psychology | 25 | 2.5% |
| Social Sciences | 46 | 4.7% |
| Engineering | 156 | 15.8% |
| Multidisciplinary Studies | 0 | 0.0% |
| Science & Technology | 55 | 5.6% |
| Business | 142 | 14.4% |
| Education | 135 | 13.7% |
| Literature & Languages | 38 | 3.9% |
| Liberal Arts & History | 36 | 3.6% |
| Visual & Performing Arts | 0 | 0.0% |
| Communications | 149 | 15.1% |
| Arts & Humanities | 11 | 1.1% |
| Total | 985 | 100.0% |
Transportation & Commute in Mountain Home
Vehicle Availability by Sex in Mountain Home
The most prevalent vehicle ownership categories in Mountain Home are males with 2 vehicles (610, accounting for 41.7%) and females with 2 vehicles (272, making up 70.2%).
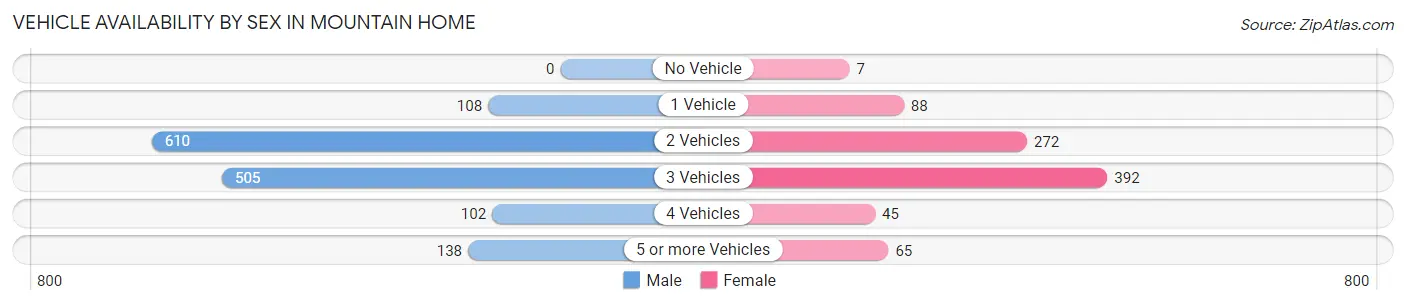
| Vehicles Available | Male | Female |
| No Vehicle | 0 (0.0%) | 7 (0.8%) |
| 1 Vehicle | 108 (7.4%) | 88 (10.1%) |
| 2 Vehicles | 610 (41.7%) | 272 (31.3%) |
| 3 Vehicles | 505 (34.5%) | 392 (45.1%) |
| 4 Vehicles | 102 (7.0%) | 45 (5.2%) |
| 5 or more Vehicles | 138 (9.4%) | 65 (7.5%) |
| Total | 1,463 (100.0%) | 869 (100.0%) |
Commute Time in Mountain Home
The most frequently occuring commute durations in Mountain Home are 20 to 24 minutes (729 commuters, 32.5%), 15 to 19 minutes (452 commuters, 20.2%), and 10 to 14 minutes (289 commuters, 12.9%).
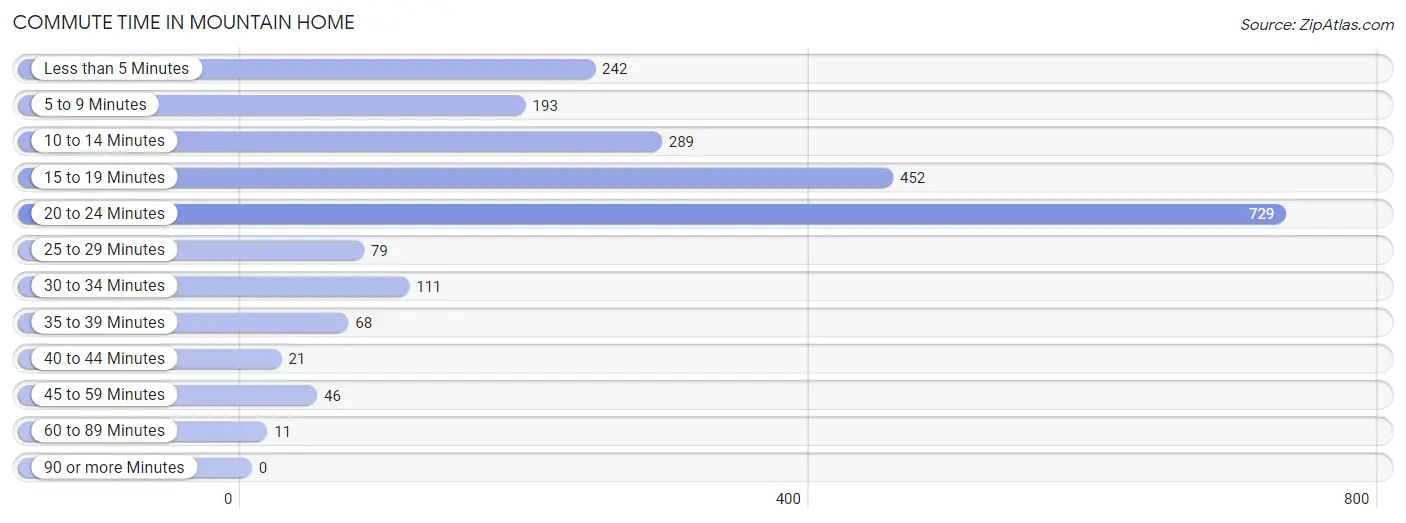
| Commute Time | # Commuters | % Commuters |
| Less than 5 Minutes | 242 | 10.8% |
| 5 to 9 Minutes | 193 | 8.6% |
| 10 to 14 Minutes | 289 | 12.9% |
| 15 to 19 Minutes | 452 | 20.2% |
| 20 to 24 Minutes | 729 | 32.5% |
| 25 to 29 Minutes | 79 | 3.5% |
| 30 to 34 Minutes | 111 | 5.0% |
| 35 to 39 Minutes | 68 | 3.0% |
| 40 to 44 Minutes | 21 | 0.9% |
| 45 to 59 Minutes | 46 | 2.1% |
| 60 to 89 Minutes | 11 | 0.5% |
| 90 or more Minutes | 0 | 0.0% |
Commute Time by Sex in Mountain Home
The most common commute times in Mountain Home are 20 to 24 minutes (466 commuters, 32.4%) for males and 20 to 24 minutes (263 commuters, 32.8%) for females.
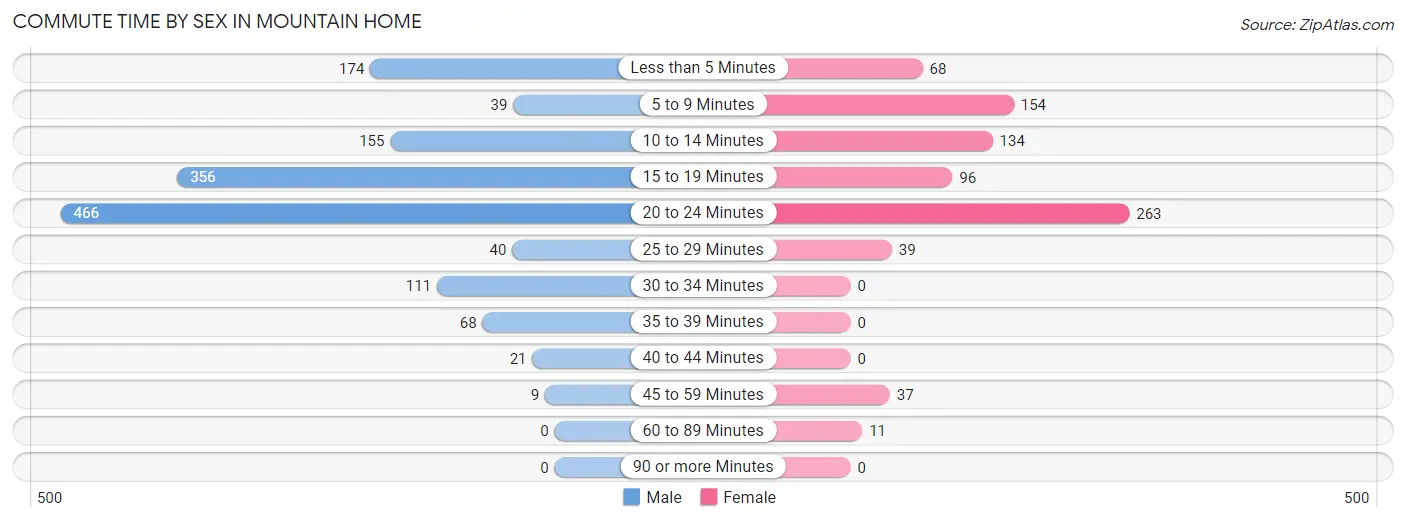
| Commute Time | Male | Female |
| Less than 5 Minutes | 174 (12.1%) | 68 (8.5%) |
| 5 to 9 Minutes | 39 (2.7%) | 154 (19.2%) |
| 10 to 14 Minutes | 155 (10.8%) | 134 (16.7%) |
| 15 to 19 Minutes | 356 (24.7%) | 96 (12.0%) |
| 20 to 24 Minutes | 466 (32.4%) | 263 (32.8%) |
| 25 to 29 Minutes | 40 (2.8%) | 39 (4.9%) |
| 30 to 34 Minutes | 111 (7.7%) | 0 (0.0%) |
| 35 to 39 Minutes | 68 (4.7%) | 0 (0.0%) |
| 40 to 44 Minutes | 21 (1.5%) | 0 (0.0%) |
| 45 to 59 Minutes | 9 (0.6%) | 37 (4.6%) |
| 60 to 89 Minutes | 0 (0.0%) | 11 (1.4%) |
| 90 or more Minutes | 0 (0.0%) | 0 (0.0%) |
Time of Departure to Work by Sex in Mountain Home
The most frequent times of departure to work in Mountain Home are 4:00 PM to 11:59 PM (297, 20.6%) for males and 7:00 AM to 7:29 AM (160, 20.0%) for females.
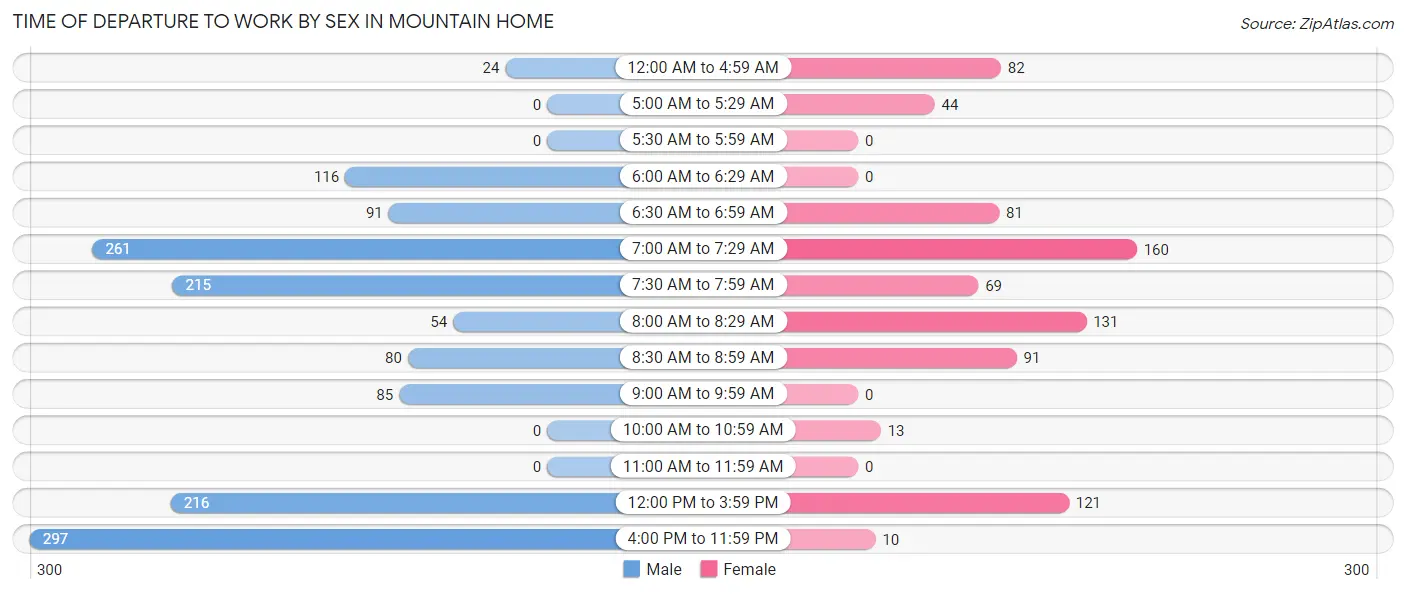
| Time of Departure | Male | Female |
| 12:00 AM to 4:59 AM | 24 (1.7%) | 82 (10.2%) |
| 5:00 AM to 5:29 AM | 0 (0.0%) | 44 (5.5%) |
| 5:30 AM to 5:59 AM | 0 (0.0%) | 0 (0.0%) |
| 6:00 AM to 6:29 AM | 116 (8.1%) | 0 (0.0%) |
| 6:30 AM to 6:59 AM | 91 (6.3%) | 81 (10.1%) |
| 7:00 AM to 7:29 AM | 261 (18.1%) | 160 (20.0%) |
| 7:30 AM to 7:59 AM | 215 (14.9%) | 69 (8.6%) |
| 8:00 AM to 8:29 AM | 54 (3.7%) | 131 (16.3%) |
| 8:30 AM to 8:59 AM | 80 (5.6%) | 91 (11.4%) |
| 9:00 AM to 9:59 AM | 85 (5.9%) | 0 (0.0%) |
| 10:00 AM to 10:59 AM | 0 (0.0%) | 13 (1.6%) |
| 11:00 AM to 11:59 AM | 0 (0.0%) | 0 (0.0%) |
| 12:00 PM to 3:59 PM | 216 (15.0%) | 121 (15.1%) |
| 4:00 PM to 11:59 PM | 297 (20.6%) | 10 (1.3%) |
| Total | 1,439 (100.0%) | 802 (100.0%) |
Housing Occupancy in Mountain Home
Occupancy by Ownership in Mountain Home
Of the total 1,609 dwellings in Mountain Home, owner-occupied units account for 1,066 (66.2%), while renter-occupied units make up 543 (33.8%).
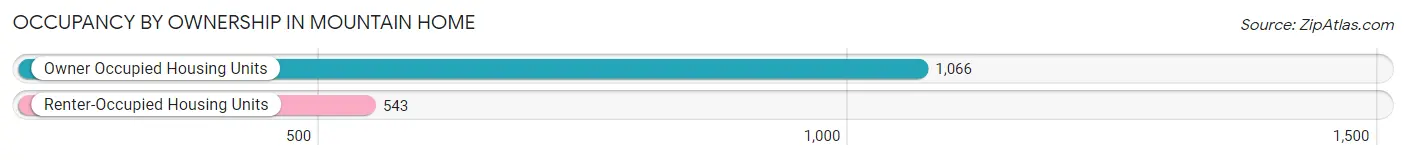
| Occupancy | # Housing Units | % Housing Units |
| Owner Occupied Housing Units | 1,066 | 66.2% |
| Renter-Occupied Housing Units | 543 | 33.8% |
| Total Occupied Housing Units | 1,609 | 100.0% |
Occupancy by Household Size in Mountain Home
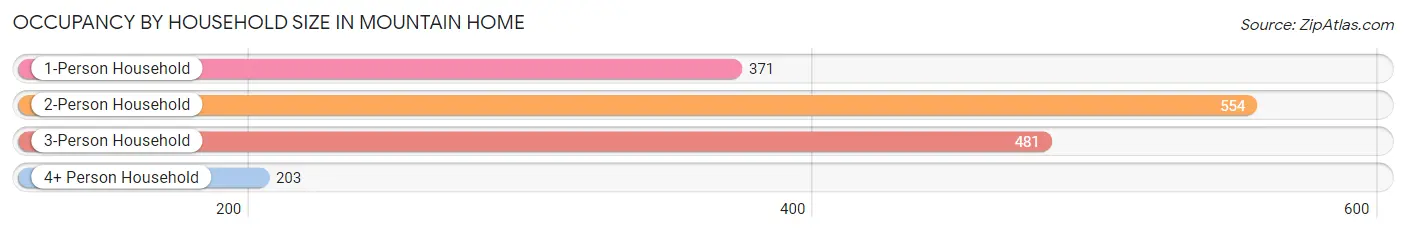
| Household Size | # Housing Units | % Housing Units |
| 1-Person Household | 371 | 23.1% |
| 2-Person Household | 554 | 34.4% |
| 3-Person Household | 481 | 29.9% |
| 4+ Person Household | 203 | 12.6% |
| Total Housing Units | 1,609 | 100.0% |
Occupancy by Ownership by Household Size in Mountain Home
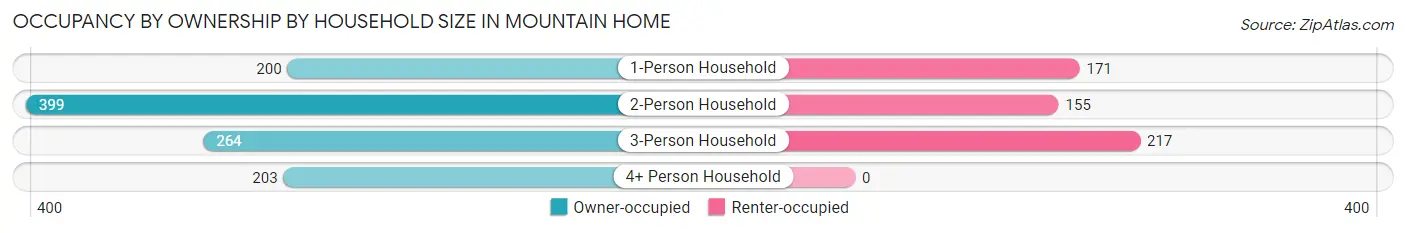
| Household Size | Owner-occupied | Renter-occupied |
| 1-Person Household | 200 (53.9%) | 171 (46.1%) |
| 2-Person Household | 399 (72.0%) | 155 (28.0%) |
| 3-Person Household | 264 (54.9%) | 217 (45.1%) |
| 4+ Person Household | 203 (100.0%) | 0 (0.0%) |
| Total Housing Units | 1,066 (66.2%) | 543 (33.8%) |
Occupancy by Educational Attainment in Mountain Home
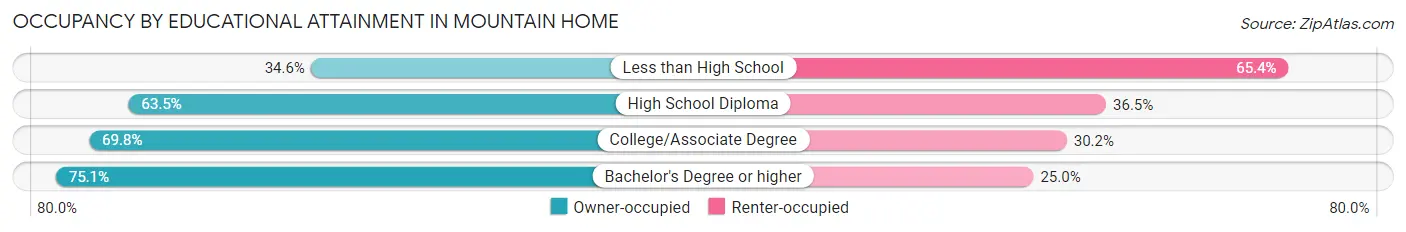
| Household Size | Owner-occupied | Renter-occupied |
| Less than High School | 45 (34.6%) | 85 (65.4%) |
| High School Diploma | 378 (63.5%) | 217 (36.5%) |
| College/Associate Degree | 270 (69.8%) | 117 (30.2%) |
| Bachelor's Degree or higher | 373 (75.0%) | 124 (24.9%) |
Occupancy by Age of Householder in Mountain Home
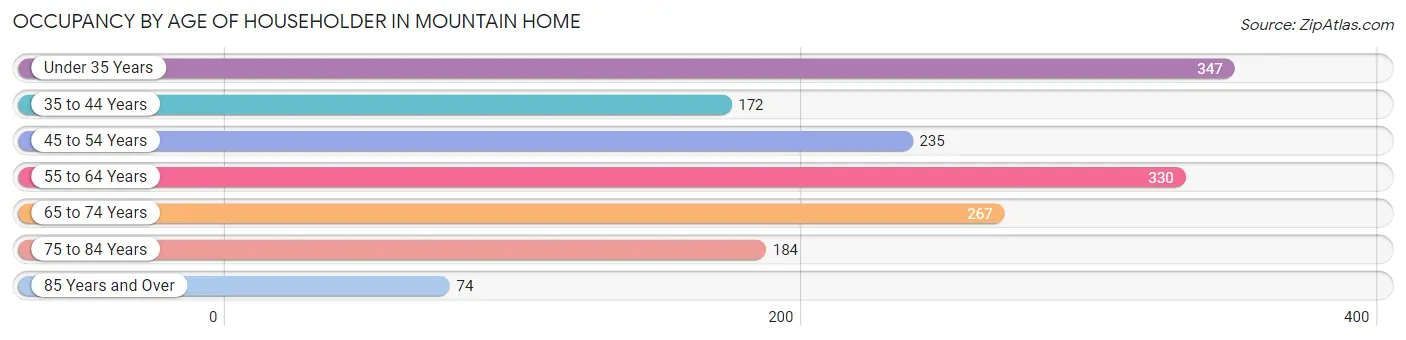
| Age Bracket | # Households | % Households |
| Under 35 Years | 347 | 21.6% |
| 35 to 44 Years | 172 | 10.7% |
| 45 to 54 Years | 235 | 14.6% |
| 55 to 64 Years | 330 | 20.5% |
| 65 to 74 Years | 267 | 16.6% |
| 75 to 84 Years | 184 | 11.4% |
| 85 Years and Over | 74 | 4.6% |
| Total | 1,609 | 100.0% |
Housing Finances in Mountain Home
Median Income by Occupancy in Mountain Home
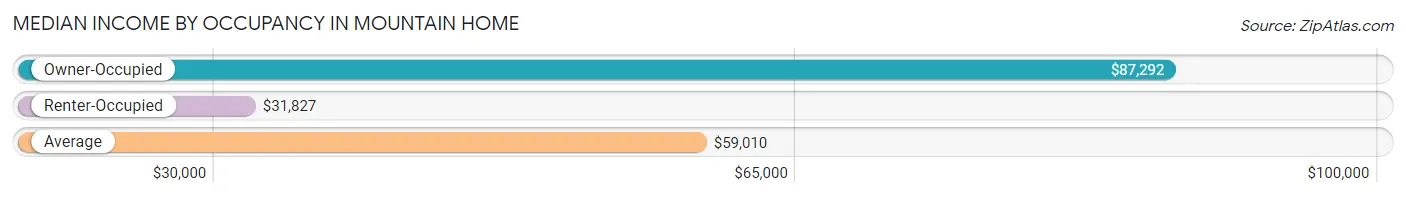
| Occupancy Type | # Households | Median Income |
| Owner-Occupied | 1,066 (66.2%) | $87,292 |
| Renter-Occupied | 543 (33.8%) | $31,827 |
| Average | 1,609 (100.0%) | $59,010 |
Occupancy by Householder Income Bracket in Mountain Home
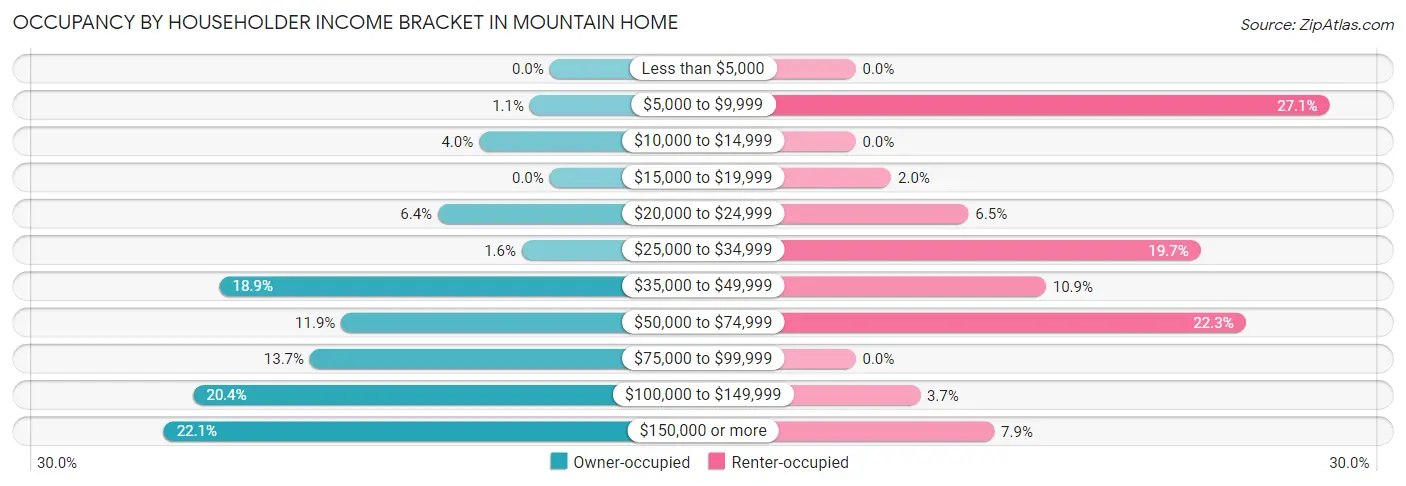
| Income Bracket | Owner-occupied | Renter-occupied |
| Less than $5,000 | 0 (0.0%) | 0 (0.0%) |
| $5,000 to $9,999 | 12 (1.1%) | 147 (27.1%) |
| $10,000 to $14,999 | 43 (4.0%) | 0 (0.0%) |
| $15,000 to $19,999 | 0 (0.0%) | 11 (2.0%) |
| $20,000 to $24,999 | 68 (6.4%) | 35 (6.5%) |
| $25,000 to $34,999 | 17 (1.6%) | 107 (19.7%) |
| $35,000 to $49,999 | 201 (18.9%) | 59 (10.9%) |
| $50,000 to $74,999 | 127 (11.9%) | 121 (22.3%) |
| $75,000 to $99,999 | 146 (13.7%) | 0 (0.0%) |
| $100,000 to $149,999 | 217 (20.4%) | 20 (3.7%) |
| $150,000 or more | 235 (22.1%) | 43 (7.9%) |
| Total | 1,066 (100.0%) | 543 (100.0%) |
Monthly Housing Cost Tiers in Mountain Home
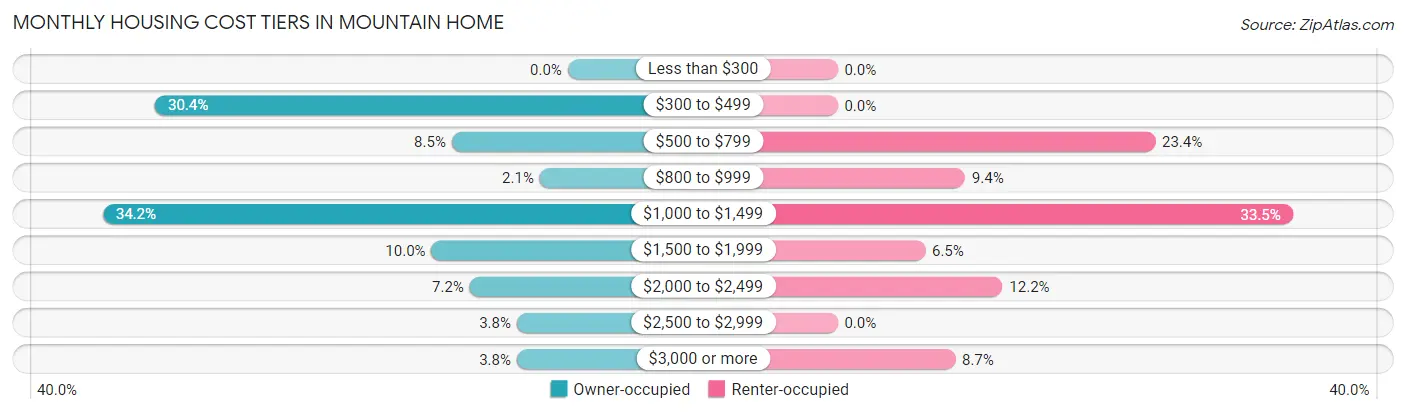
| Monthly Cost | Owner-occupied | Renter-occupied |
| Less than $300 | 0 (0.0%) | 0 (0.0%) |
| $300 to $499 | 324 (30.4%) | 0 (0.0%) |
| $500 to $799 | 91 (8.5%) | 127 (23.4%) |
| $800 to $999 | 22 (2.1%) | 51 (9.4%) |
| $1,000 to $1,499 | 365 (34.2%) | 182 (33.5%) |
| $1,500 to $1,999 | 107 (10.0%) | 35 (6.5%) |
| $2,000 to $2,499 | 77 (7.2%) | 66 (12.1%) |
| $2,500 to $2,999 | 40 (3.7%) | 0 (0.0%) |
| $3,000 or more | 40 (3.7%) | 47 (8.7%) |
| Total | 1,066 (100.0%) | 543 (100.0%) |
Physical Housing Characteristics in Mountain Home
Housing Structures in Mountain Home
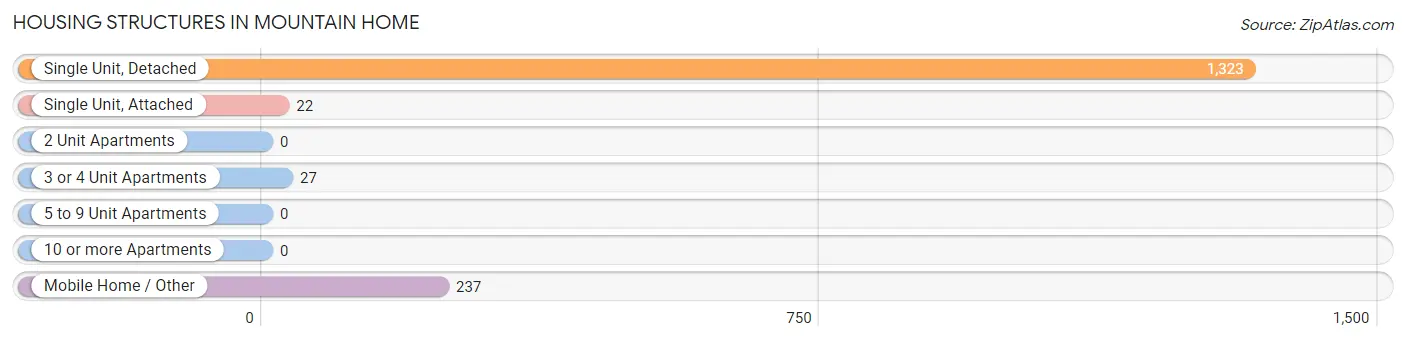
| Structure Type | # Housing Units | % Housing Units |
| Single Unit, Detached | 1,323 | 82.2% |
| Single Unit, Attached | 22 | 1.4% |
| 2 Unit Apartments | 0 | 0.0% |
| 3 or 4 Unit Apartments | 27 | 1.7% |
| 5 to 9 Unit Apartments | 0 | 0.0% |
| 10 or more Apartments | 0 | 0.0% |
| Mobile Home / Other | 237 | 14.7% |
| Total | 1,609 | 100.0% |
Housing Structures by Occupancy in Mountain Home
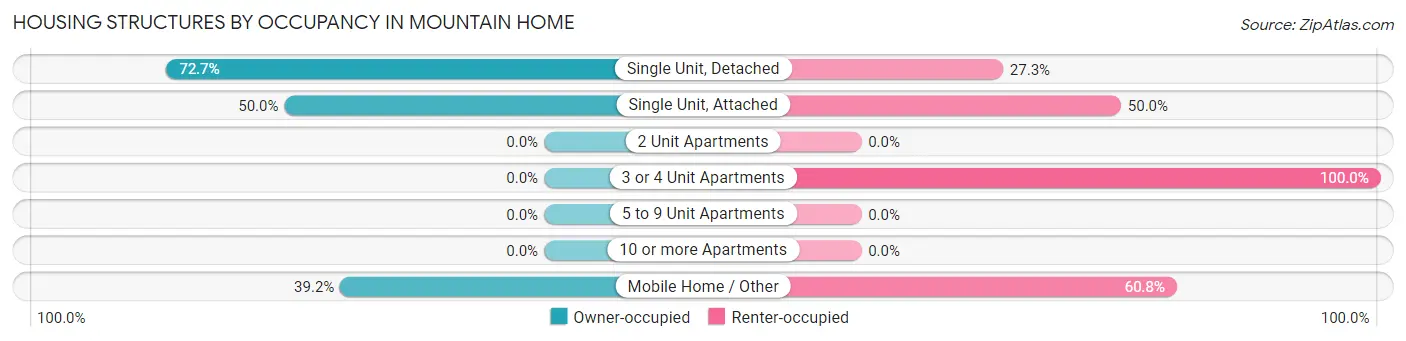
| Structure Type | Owner-occupied | Renter-occupied |
| Single Unit, Detached | 962 (72.7%) | 361 (27.3%) |
| Single Unit, Attached | 11 (50.0%) | 11 (50.0%) |
| 2 Unit Apartments | 0 (0.0%) | 0 (0.0%) |
| 3 or 4 Unit Apartments | 0 (0.0%) | 27 (100.0%) |
| 5 to 9 Unit Apartments | 0 (0.0%) | 0 (0.0%) |
| 10 or more Apartments | 0 (0.0%) | 0 (0.0%) |
| Mobile Home / Other | 93 (39.2%) | 144 (60.8%) |
| Total | 1,066 (66.2%) | 543 (33.8%) |
Housing Structures by Number of Rooms in Mountain Home
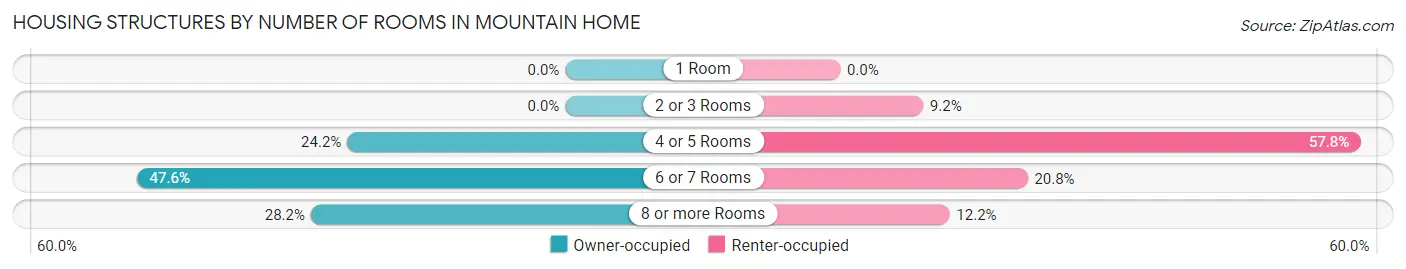
| Number of Rooms | Owner-occupied | Renter-occupied |
| 1 Room | 0 (0.0%) | 0 (0.0%) |
| 2 or 3 Rooms | 0 (0.0%) | 50 (9.2%) |
| 4 or 5 Rooms | 258 (24.2%) | 314 (57.8%) |
| 6 or 7 Rooms | 507 (47.6%) | 113 (20.8%) |
| 8 or more Rooms | 301 (28.2%) | 66 (12.1%) |
| Total | 1,066 (100.0%) | 543 (100.0%) |
Housing Structure by Heating Type in Mountain Home
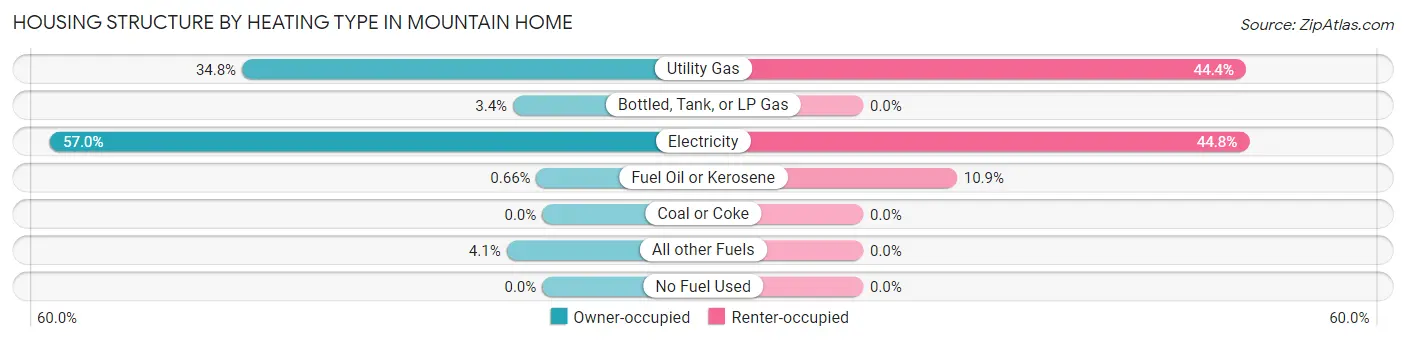
| Heating Type | Owner-occupied | Renter-occupied |
| Utility Gas | 371 (34.8%) | 241 (44.4%) |
| Bottled, Tank, or LP Gas | 36 (3.4%) | 0 (0.0%) |
| Electricity | 608 (57.0%) | 243 (44.8%) |
| Fuel Oil or Kerosene | 7 (0.7%) | 59 (10.9%) |
| Coal or Coke | 0 (0.0%) | 0 (0.0%) |
| All other Fuels | 44 (4.1%) | 0 (0.0%) |
| No Fuel Used | 0 (0.0%) | 0 (0.0%) |
| Total | 1,066 (100.0%) | 543 (100.0%) |
Household Vehicle Usage in Mountain Home
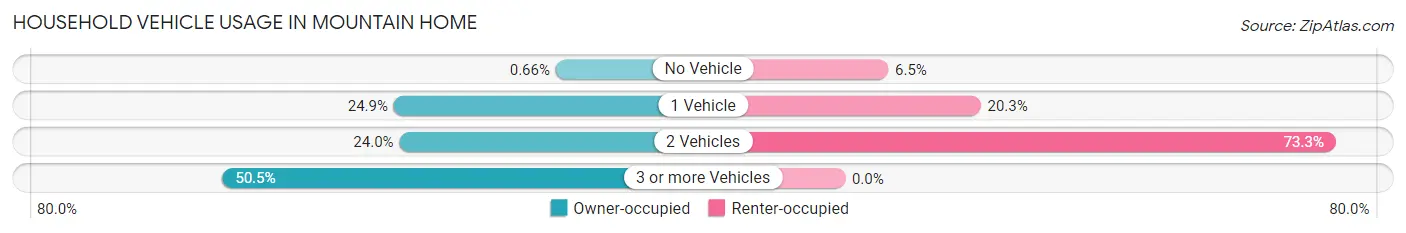
| Vehicles per Household | Owner-occupied | Renter-occupied |
| No Vehicle | 7 (0.7%) | 35 (6.5%) |
| 1 Vehicle | 265 (24.9%) | 110 (20.3%) |
| 2 Vehicles | 256 (24.0%) | 398 (73.3%) |
| 3 or more Vehicles | 538 (50.5%) | 0 (0.0%) |
| Total | 1,066 (100.0%) | 543 (100.0%) |
Real Estate & Mortgages in Mountain Home
Real Estate and Mortgage Overview in Mountain Home
| Characteristic | Without Mortgage | With Mortgage |
| Housing Units | 405 | 661 |
| Median Property Value | $297,100 | $319,100 |
| Median Household Income | $47,961 | $181 |
| Monthly Housing Costs | $398 | $40 |
| Real Estate Taxes | $1,332 | $0 |
Property Value by Mortgage Status in Mountain Home
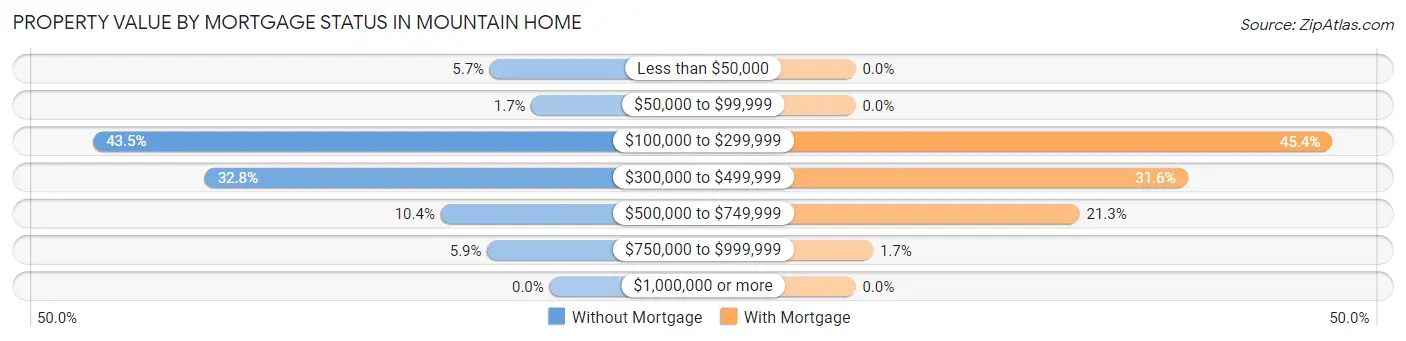
| Property Value | Without Mortgage | With Mortgage |
| Less than $50,000 | 23 (5.7%) | 0 (0.0%) |
| $50,000 to $99,999 | 7 (1.7%) | 0 (0.0%) |
| $100,000 to $299,999 | 176 (43.5%) | 300 (45.4%) |
| $300,000 to $499,999 | 133 (32.8%) | 209 (31.6%) |
| $500,000 to $749,999 | 42 (10.4%) | 141 (21.3%) |
| $750,000 to $999,999 | 24 (5.9%) | 11 (1.7%) |
| $1,000,000 or more | 0 (0.0%) | 0 (0.0%) |
| Total | 405 (100.0%) | 661 (100.0%) |
Household Income by Mortgage Status in Mountain Home
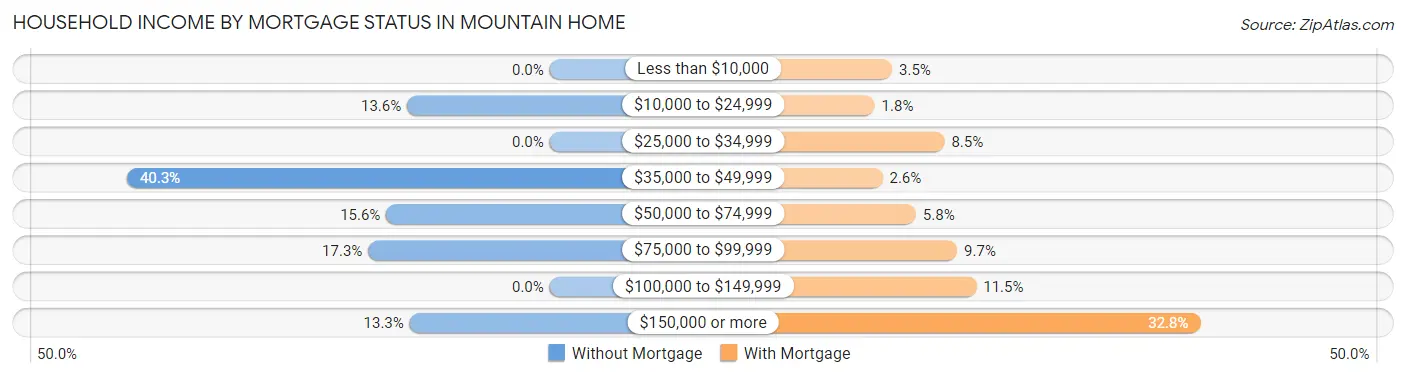
| Household Income | Without Mortgage | With Mortgage |
| Less than $10,000 | 0 (0.0%) | 23 (3.5%) |
| $10,000 to $24,999 | 55 (13.6%) | 12 (1.8%) |
| $25,000 to $34,999 | 0 (0.0%) | 56 (8.5%) |
| $35,000 to $49,999 | 163 (40.3%) | 17 (2.6%) |
| $50,000 to $74,999 | 63 (15.6%) | 38 (5.8%) |
| $75,000 to $99,999 | 70 (17.3%) | 64 (9.7%) |
| $100,000 to $149,999 | 0 (0.0%) | 76 (11.5%) |
| $150,000 or more | 54 (13.3%) | 217 (32.8%) |
| Total | 405 (100.0%) | 661 (100.0%) |
Property Value to Household Income Ratio in Mountain Home
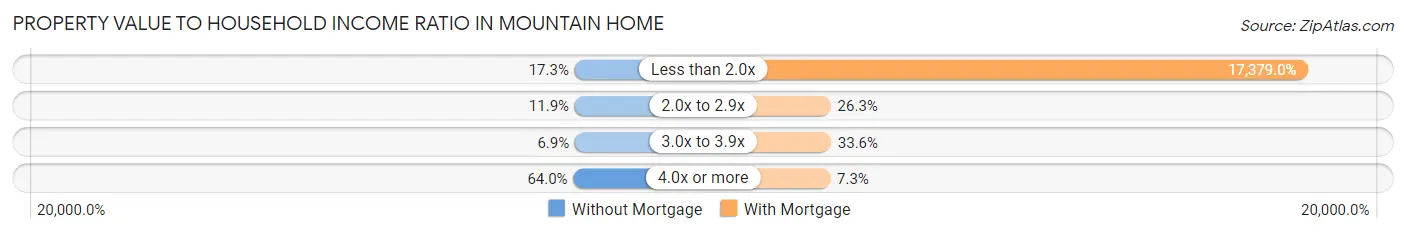
| Value-to-Income Ratio | Without Mortgage | With Mortgage |
| Less than 2.0x | 70 (17.3%) | 114,875 (17,379.0%) |
| 2.0x to 2.9x | 48 (11.8%) | 174 (26.3%) |
| 3.0x to 3.9x | 28 (6.9%) | 222 (33.6%) |
| 4.0x or more | 259 (63.9%) | 48 (7.3%) |
| Total | 405 (100.0%) | 661 (100.0%) |
Real Estate Taxes by Mortgage Status in Mountain Home
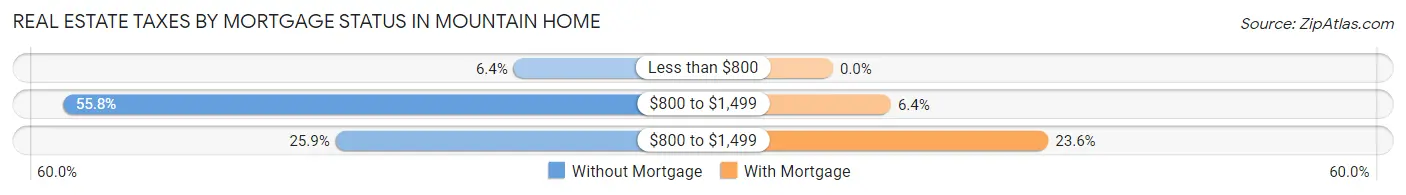
| Property Taxes | Without Mortgage | With Mortgage |
| Less than $800 | 26 (6.4%) | 0 (0.0%) |
| $800 to $1,499 | 226 (55.8%) | 42 (6.4%) |
| $800 to $1,499 | 105 (25.9%) | 156 (23.6%) |
| Total | 405 (100.0%) | 661 (100.0%) |
Health & Disability in Mountain Home
Health Insurance Coverage by Age in Mountain Home
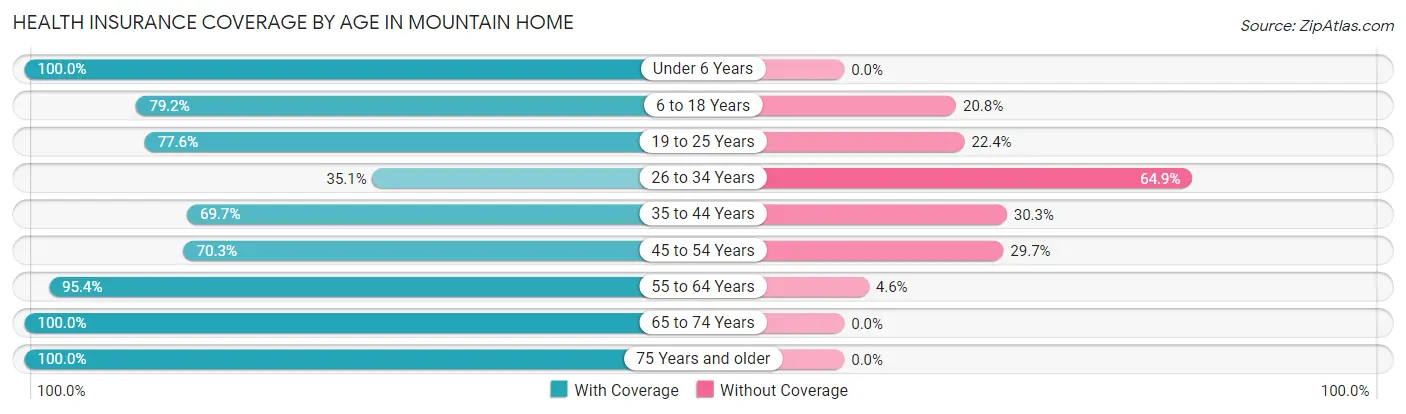
| Age Bracket | With Coverage | Without Coverage |
| Under 6 Years | 127 (100.0%) | 0 (0.0%) |
| 6 to 18 Years | 433 (79.2%) | 114 (20.8%) |
| 19 to 25 Years | 374 (77.6%) | 108 (22.4%) |
| 26 to 34 Years | 165 (35.1%) | 305 (64.9%) |
| 35 to 44 Years | 177 (69.7%) | 77 (30.3%) |
| 45 to 54 Years | 448 (70.3%) | 189 (29.7%) |
| 55 to 64 Years | 563 (95.4%) | 27 (4.6%) |
| 65 to 74 Years | 449 (100.0%) | 0 (0.0%) |
| 75 Years and older | 336 (100.0%) | 0 (0.0%) |
| Total | 3,072 (78.9%) | 820 (21.1%) |
Health Insurance Coverage by Citizenship Status in Mountain Home
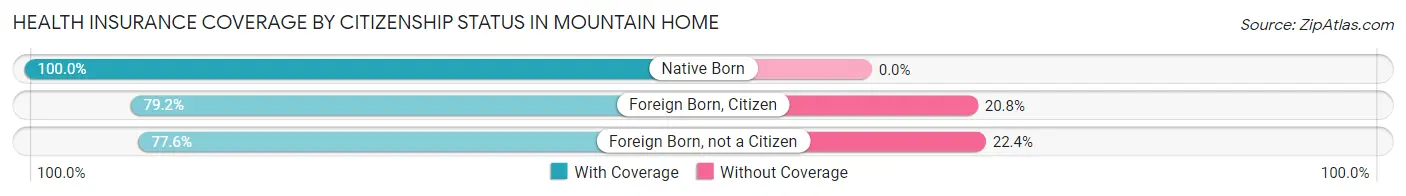
| Citizenship Status | With Coverage | Without Coverage |
| Native Born | 127 (100.0%) | 0 (0.0%) |
| Foreign Born, Citizen | 433 (79.2%) | 114 (20.8%) |
| Foreign Born, not a Citizen | 374 (77.6%) | 108 (22.4%) |
Health Insurance Coverage by Household Income in Mountain Home
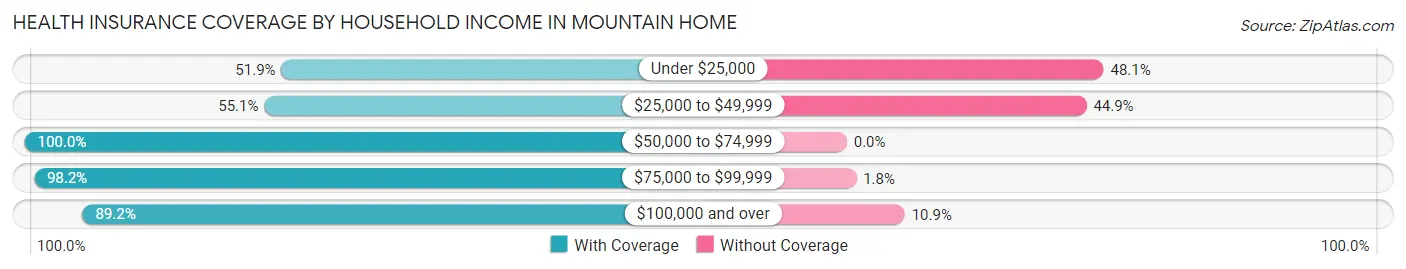
| Household Income | With Coverage | Without Coverage |
| Under $25,000 | 275 (51.9%) | 255 (48.1%) |
| $25,000 to $49,999 | 475 (55.1%) | 387 (44.9%) |
| $50,000 to $74,999 | 432 (100.0%) | 0 (0.0%) |
| $75,000 to $99,999 | 501 (98.2%) | 9 (1.8%) |
| $100,000 and over | 1,389 (89.1%) | 169 (10.8%) |
Public vs Private Health Insurance Coverage by Age in Mountain Home
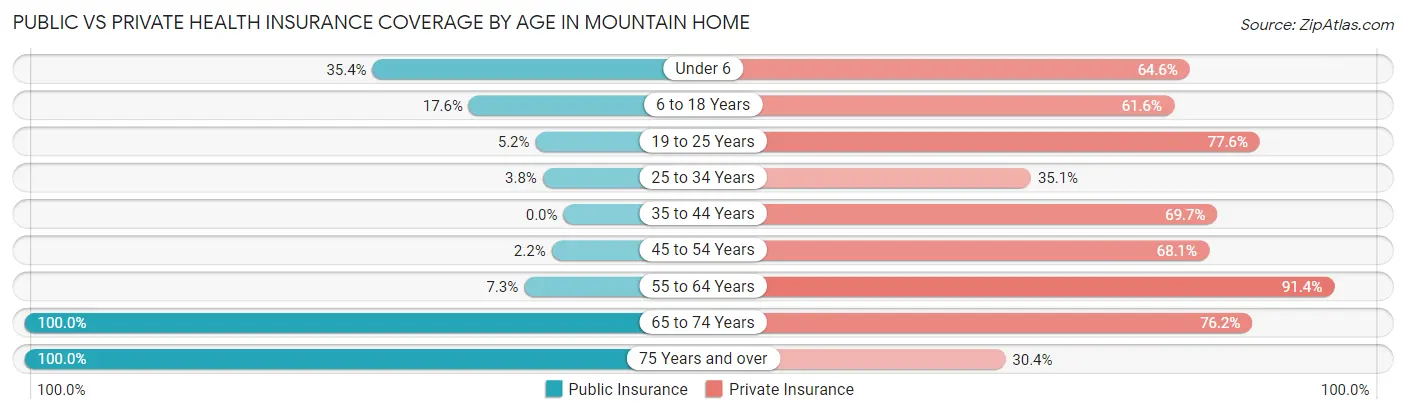
| Age Bracket | Public Insurance | Private Insurance |
| Under 6 | 45 (35.4%) | 82 (64.6%) |
| 6 to 18 Years | 96 (17.5%) | 337 (61.6%) |
| 19 to 25 Years | 25 (5.2%) | 374 (77.6%) |
| 25 to 34 Years | 18 (3.8%) | 165 (35.1%) |
| 35 to 44 Years | 0 (0.0%) | 177 (69.7%) |
| 45 to 54 Years | 14 (2.2%) | 434 (68.1%) |
| 55 to 64 Years | 43 (7.3%) | 539 (91.4%) |
| 65 to 74 Years | 449 (100.0%) | 342 (76.2%) |
| 75 Years and over | 336 (100.0%) | 102 (30.4%) |
| Total | 1,026 (26.4%) | 2,552 (65.6%) |
Disability Status by Sex by Age in Mountain Home
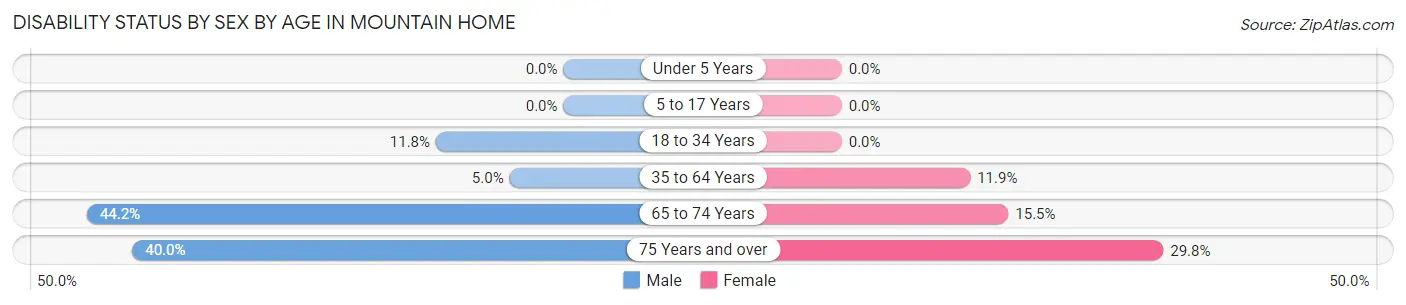
| Age Bracket | Male | Female |
| Under 5 Years | 0 (0.0%) | 0 (0.0%) |
| 5 to 17 Years | 0 (0.0%) | 0 (0.0%) |
| 18 to 34 Years | 68 (11.8%) | 0 (0.0%) |
| 35 to 64 Years | 43 (5.0%) | 74 (11.9%) |
| 65 to 74 Years | 107 (44.2%) | 32 (15.5%) |
| 75 Years and over | 58 (40.0%) | 57 (29.8%) |
Disability Class by Sex by Age in Mountain Home
Disability Class: Hearing Difficulty
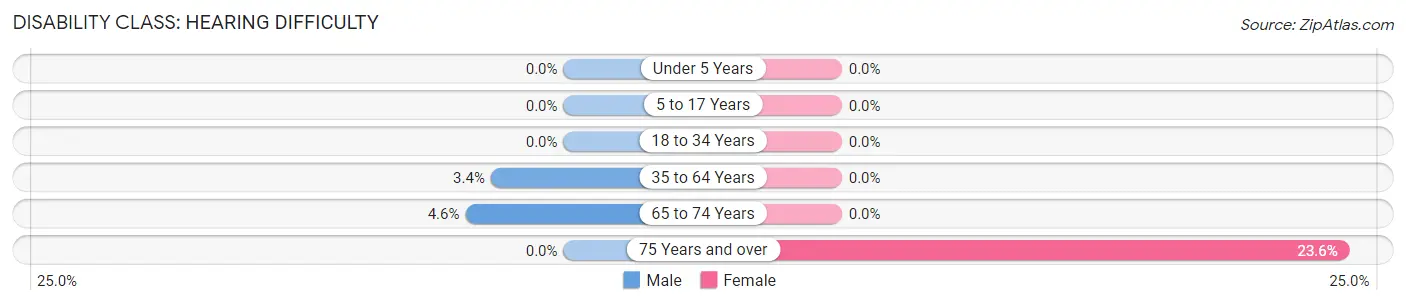
| Age Bracket | Male | Female |
| Under 5 Years | 0 (0.0%) | 0 (0.0%) |
| 5 to 17 Years | 0 (0.0%) | 0 (0.0%) |
| 18 to 34 Years | 0 (0.0%) | 0 (0.0%) |
| 35 to 64 Years | 29 (3.4%) | 0 (0.0%) |
| 65 to 74 Years | 11 (4.5%) | 0 (0.0%) |
| 75 Years and over | 0 (0.0%) | 45 (23.6%) |
Disability Class: Vision Difficulty
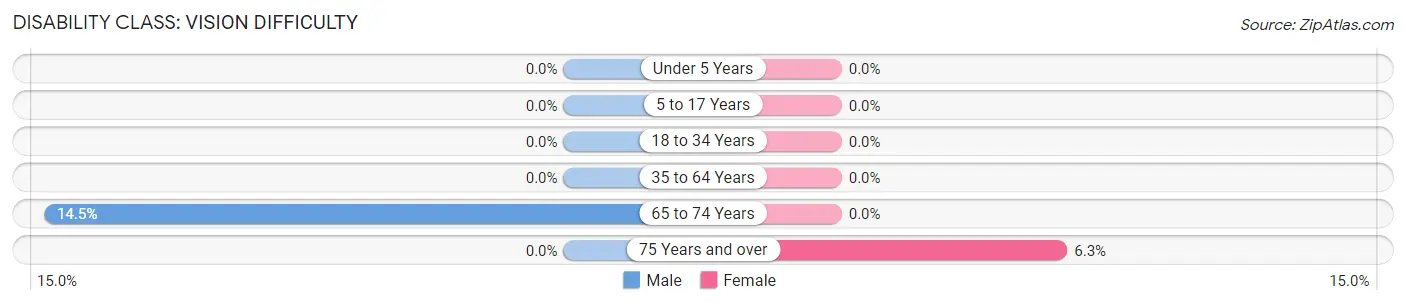
| Age Bracket | Male | Female |
| Under 5 Years | 0 (0.0%) | 0 (0.0%) |
| 5 to 17 Years | 0 (0.0%) | 0 (0.0%) |
| 18 to 34 Years | 0 (0.0%) | 0 (0.0%) |
| 35 to 64 Years | 0 (0.0%) | 0 (0.0%) |
| 65 to 74 Years | 35 (14.5%) | 0 (0.0%) |
| 75 Years and over | 0 (0.0%) | 12 (6.3%) |
Disability Class: Cognitive Difficulty
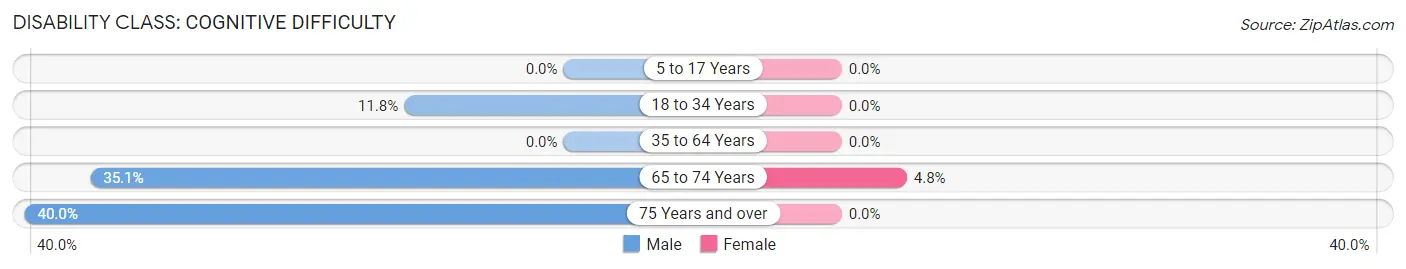
| Age Bracket | Male | Female |
| 5 to 17 Years | 0 (0.0%) | 0 (0.0%) |
| 18 to 34 Years | 68 (11.8%) | 0 (0.0%) |
| 35 to 64 Years | 0 (0.0%) | 0 (0.0%) |
| 65 to 74 Years | 85 (35.1%) | 10 (4.8%) |
| 75 Years and over | 58 (40.0%) | 0 (0.0%) |
Disability Class: Ambulatory Difficulty
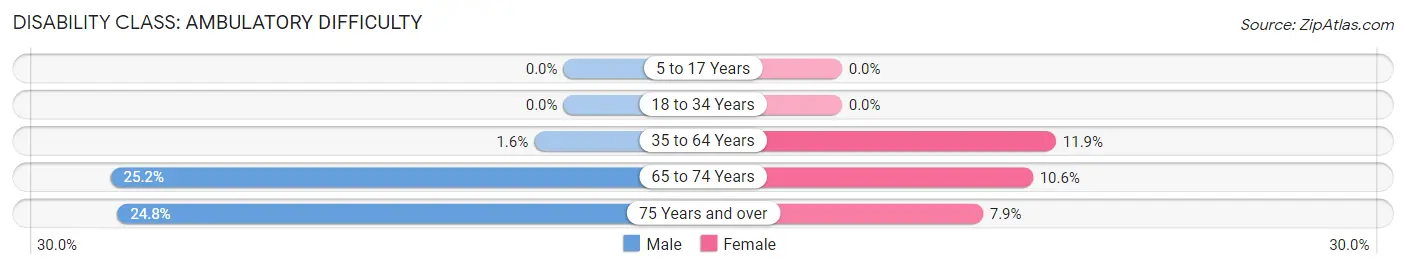
| Age Bracket | Male | Female |
| 5 to 17 Years | 0 (0.0%) | 0 (0.0%) |
| 18 to 34 Years | 0 (0.0%) | 0 (0.0%) |
| 35 to 64 Years | 14 (1.6%) | 74 (11.9%) |
| 65 to 74 Years | 61 (25.2%) | 22 (10.6%) |
| 75 Years and over | 36 (24.8%) | 15 (7.9%) |
Disability Class: Self-Care Difficulty
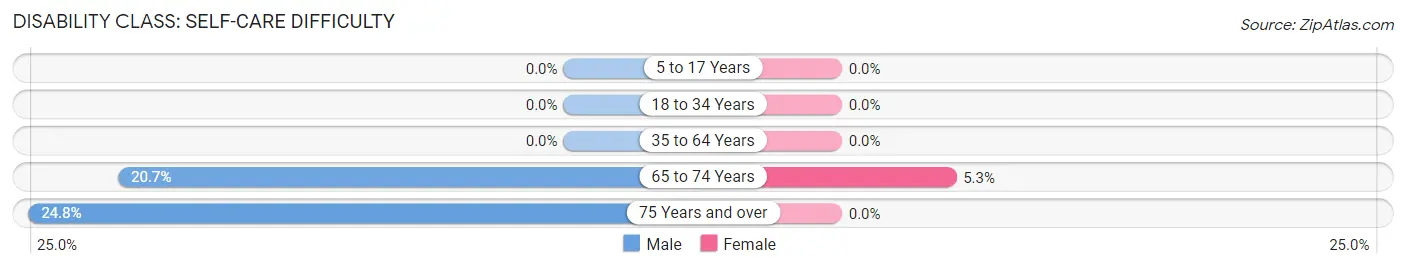
| Age Bracket | Male | Female |
| 5 to 17 Years | 0 (0.0%) | 0 (0.0%) |
| 18 to 34 Years | 0 (0.0%) | 0 (0.0%) |
| 35 to 64 Years | 0 (0.0%) | 0 (0.0%) |
| 65 to 74 Years | 50 (20.7%) | 11 (5.3%) |
| 75 Years and over | 36 (24.8%) | 0 (0.0%) |
Technology Access in Mountain Home
Computing Device Access in Mountain Home
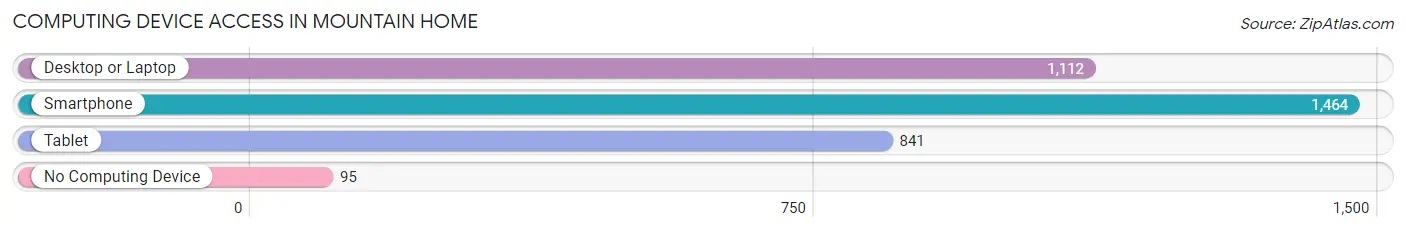
| Device Type | # Households | % Households |
| Desktop or Laptop | 1,112 | 69.1% |
| Smartphone | 1,464 | 91.0% |
| Tablet | 841 | 52.3% |
| No Computing Device | 95 | 5.9% |
| Total | 1,609 | 100.0% |
Internet Access in Mountain Home
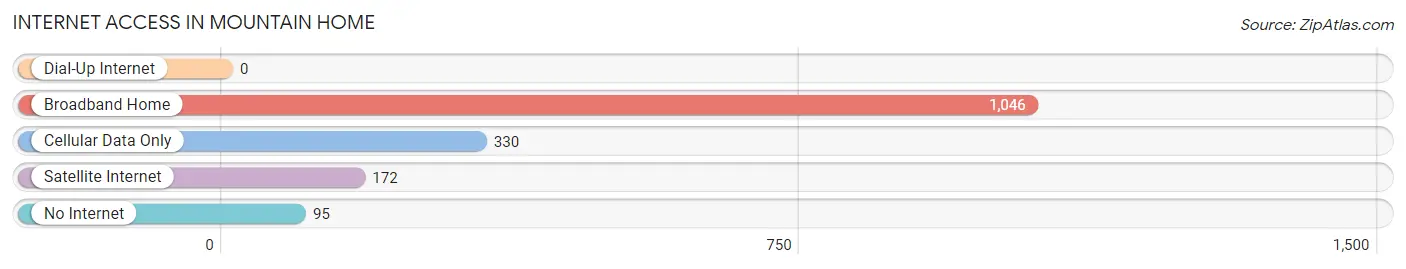
| Internet Type | # Households | % Households |
| Dial-Up Internet | 0 | 0.0% |
| Broadband Home | 1,046 | 65.0% |
| Cellular Data Only | 330 | 20.5% |
| Satellite Internet | 172 | 10.7% |
| No Internet | 95 | 5.9% |
| Total | 1,609 | 100.0% |
Mountain Home Summary
Mountain Home is a small unincorporated community located in the Blue Ridge Mountains of North Carolina. It is situated in the northwestern corner of the state, near the Tennessee border. The town is located in Yancey County, and is part of the Asheville Metropolitan Statistical Area. The population of Mountain Home was estimated to be around 1,000 in 2020.
History
Mountain Home was first settled in the late 1700s by a group of settlers from the nearby town of Burnsville. The town was originally known as “Mountain Home” due to its location in the Blue Ridge Mountains. The town was officially incorporated in 1883.
In the early 1900s, Mountain Home was a popular tourist destination due to its scenic beauty and proximity to the Appalachian Trail. The town was also home to several resorts, including the Mountain Home Inn, which was built in the early 1900s and is still in operation today.
In the late 1950s, the town began to experience a decline in population as many of its residents moved away in search of better economic opportunities. This trend continued until the late 1990s, when the town began to experience a resurgence in population growth.
Geography
Mountain Home is located in the northwestern corner of North Carolina, near the Tennessee border. The town is situated in the Blue Ridge Mountains, and is surrounded by the Pisgah National Forest. The town is located at an elevation of 2,400 feet, and is approximately 30 miles from Asheville.
The town is located in Yancey County, and is part of the Asheville Metropolitan Statistical Area. The nearest major cities are Asheville, Charlotte, and Knoxville.
Economy
Mountain Home’s economy is largely based on tourism and agriculture. The town is home to several resorts, including the Mountain Home Inn, which is a popular destination for tourists. The town is also home to several farms, which produce a variety of crops, including apples, corn, and hay.
The town is also home to several small businesses, including restaurants, shops, and galleries. The town is also home to a small airport, which serves as a hub for private and commercial flights.
Demographics
As of the 2020 census, the population of Mountain Home was estimated to be around 1,000. The town is predominantly white, with a small minority population. The median household income in the town is around $35,000, and the median home value is around $150,000. The town has a low unemployment rate, and the poverty rate is below the national average.
Common Questions
What is Per Capita Income in Mountain Home?
Per Capita income in Mountain Home is $33,422.
What is the Median Family Income in Mountain Home?
Median Family Income in Mountain Home is $75,833.
What is the Median Household income in Mountain Home?
Median Household Income in Mountain Home is $59,010.
What is Income or Wage Gap in Mountain Home?
Income or Wage Gap in Mountain Home is 18.4%.
Women in Mountain Home earn 81.6 cents for every dollar earned by a man.
What is Inequality or Gini Index in Mountain Home?
Inequality or Gini Index in Mountain Home is 0.43.
What is the Total Population of Mountain Home?
Total Population of Mountain Home is 4,028.
What is the Total Male Population of Mountain Home?
Total Male Population of Mountain Home is 2,282.
What is the Total Female Population of Mountain Home?
Total Female Population of Mountain Home is 1,746.
What is the Ratio of Males per 100 Females in Mountain Home?
There are 130.70 Males per 100 Females in Mountain Home.
What is the Ratio of Females per 100 Males in Mountain Home?
There are 76.51 Females per 100 Males in Mountain Home.
What is the Median Population Age in Mountain Home?
Median Population Age in Mountain Home is 49.5 Years.
What is the Average Family Size in Mountain Home
Average Family Size in Mountain Home is 2.8 People.
What is the Average Household Size in Mountain Home
Average Household Size in Mountain Home is 2.4 People.
How Large is the Labor Force in Mountain Home?
There are 2,351 People in the Labor Forcein in Mountain Home.
What is the Percentage of People in the Labor Force in Mountain Home?
66.5% of People are in the Labor Force in Mountain Home.
What is the Unemployment Rate in Mountain Home?
Unemployment Rate in Mountain Home is 0.8%.