Hot Springs, NC Map & Demographics
Hot Springs Map
Hot Springs Overview
$28,042
PER CAPITA INCOME
$62,500
AVG FAMILY INCOME
$45,500
AVG HOUSEHOLD INCOME
46.5%
WAGE / INCOME GAP [ % ]
53.5¢/ $1
WAGE / INCOME GAP [ $ ]
0.44
INEQUALITY / GINI INDEX
519
TOTAL POPULATION
232
MALE POPULATION
287
FEMALE POPULATION
80.84
MALES / 100 FEMALES
123.71
FEMALES / 100 MALES
43.9
MEDIAN AGE
3.5
AVG FAMILY SIZE
2.4
AVG HOUSEHOLD SIZE
265
LABOR FORCE [ PEOPLE ]
58.2%
PERCENT IN LABOR FORCE
3.4%
UNEMPLOYMENT RATE
Hot Springs Zip Codes
Hot Springs Area Codes
Income in Hot Springs
Income Overview in Hot Springs
Per Capita Income in Hot Springs is $28,042, while median incomes of families and households are $62,500 and $45,500 respectively.
| Characteristic | Number | Measure |
| Per Capita Income | 519 | $28,042 |
| Median Family Income | 110 | $62,500 |
| Mean Family Income | 110 | $58,538 |
| Median Household Income | 204 | $45,500 |
| Mean Household Income | 204 | $49,017 |
| Income Deficit | 110 | $0 |
| Wage / Income Gap (%) | 519 | 46.50% |
| Wage / Income Gap ($) | 519 | 53.50¢ per $1 |
| Gini / Inequality Index | 519 | 0.44 |
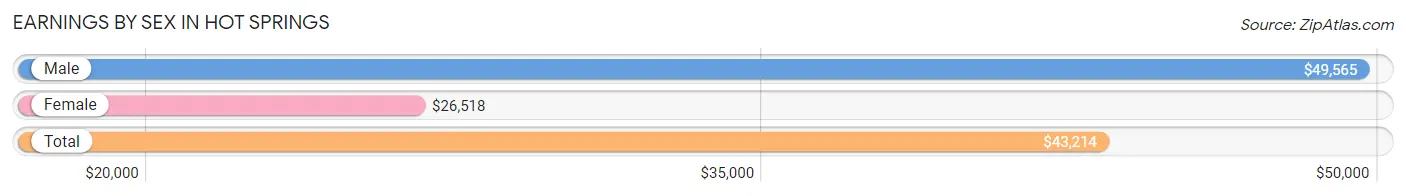
Earnings by Sex in Hot Springs
Average Earnings in Hot Springs are $43,214, $49,565 for men and $26,518 for women, a difference of 46.5%.
| Sex | Number | Average Earnings |
| Male | 150 (56.4%) | $49,565 |
| Female | 116 (43.6%) | $26,518 |
| Total | 266 (100.0%) | $43,214 |
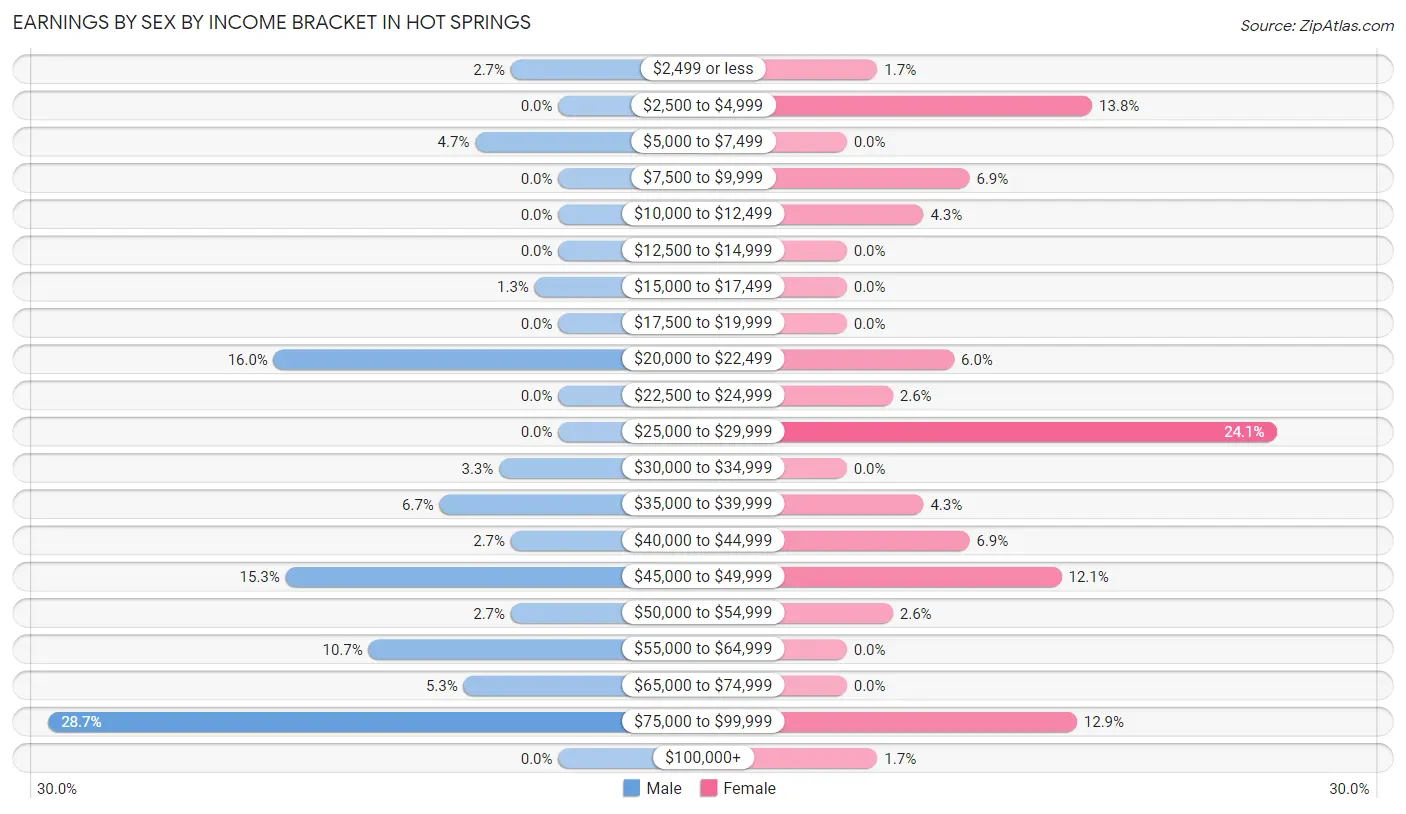
Earnings by Sex by Income Bracket in Hot Springs
The most common earnings brackets in Hot Springs are $75,000 to $99,999 for men (43 | 28.7%) and $25,000 to $29,999 for women (28 | 24.1%).
| Income | Male | Female |
| $2,499 or less | 4 (2.7%) | 2 (1.7%) |
| $2,500 to $4,999 | 0 (0.0%) | 16 (13.8%) |
| $5,000 to $7,499 | 7 (4.7%) | 0 (0.0%) |
| $7,500 to $9,999 | 0 (0.0%) | 8 (6.9%) |
| $10,000 to $12,499 | 0 (0.0%) | 5 (4.3%) |
| $12,500 to $14,999 | 0 (0.0%) | 0 (0.0%) |
| $15,000 to $17,499 | 2 (1.3%) | 0 (0.0%) |
| $17,500 to $19,999 | 0 (0.0%) | 0 (0.0%) |
| $20,000 to $22,499 | 24 (16.0%) | 7 (6.0%) |
| $22,500 to $24,999 | 0 (0.0%) | 3 (2.6%) |
| $25,000 to $29,999 | 0 (0.0%) | 28 (24.1%) |
| $30,000 to $34,999 | 5 (3.3%) | 0 (0.0%) |
| $35,000 to $39,999 | 10 (6.7%) | 5 (4.3%) |
| $40,000 to $44,999 | 4 (2.7%) | 8 (6.9%) |
| $45,000 to $49,999 | 23 (15.3%) | 14 (12.1%) |
| $50,000 to $54,999 | 4 (2.7%) | 3 (2.6%) |
| $55,000 to $64,999 | 16 (10.7%) | 0 (0.0%) |
| $65,000 to $74,999 | 8 (5.3%) | 0 (0.0%) |
| $75,000 to $99,999 | 43 (28.7%) | 15 (12.9%) |
| $100,000+ | 0 (0.0%) | 2 (1.7%) |
| Total | 150 (100.0%) | 116 (100.0%) |
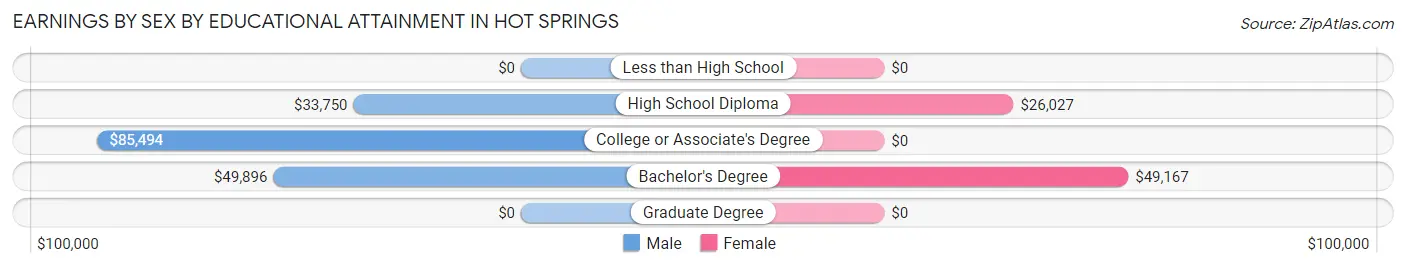
Earnings by Sex by Educational Attainment in Hot Springs
Average earnings in Hot Springs are $60,938 for men and $27,009 for women, a difference of 55.7%. Men with an educational attainment of college or associate's degree enjoy the highest average annual earnings of $85,494, while those with high school diploma education earn the least with $33,750. Women with an educational attainment of bachelor's degree earn the most with the average annual earnings of $49,167, while those with high school diploma education have the smallest earnings of $26,027.
| Educational Attainment | Male Income | Female Income |
| Less than High School | - | - |
| High School Diploma | $33,750 | $26,027 |
| College or Associate's Degree | $85,494 | $0 |
| Bachelor's Degree | $49,896 | $49,167 |
| Graduate Degree | - | - |
| Total | $60,938 | $27,009 |
Family Income in Hot Springs
Family Income Brackets in Hot Springs
According to the Hot Springs family income data, there are 34 families falling into the $75,000 to $99,999 income range, which is the most common income bracket and makes up 30.9% of all families.
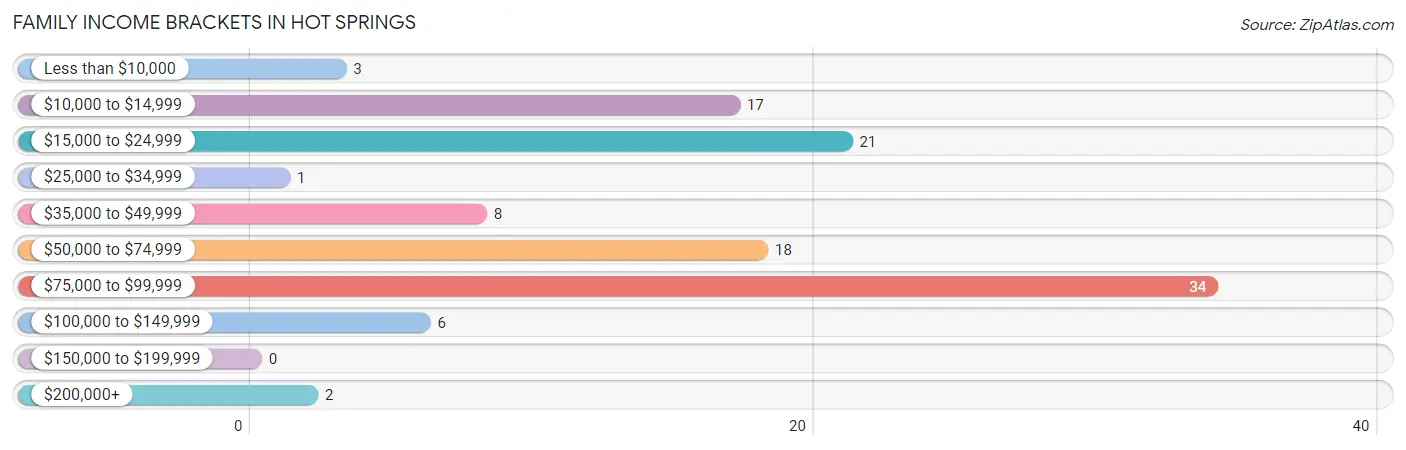
| Income Bracket | # Families | % Families |
| Less than $10,000 | 3 | 2.7% |
| $10,000 to $14,999 | 17 | 15.5% |
| $15,000 to $24,999 | 21 | 19.1% |
| $25,000 to $34,999 | 1 | 0.9% |
| $35,000 to $49,999 | 8 | 7.3% |
| $50,000 to $74,999 | 18 | 16.4% |
| $75,000 to $99,999 | 34 | 30.9% |
| $100,000 to $149,999 | 6 | 5.5% |
| $150,000 to $199,999 | 0 | 0.0% |
| $200,000+ | 2 | 1.8% |
Family Income by Famaliy Size in Hot Springs
4-person families (34 | 30.9%) account for the highest median family income in Hot Springs with $80,694 per family, while 2-person families (60 | 54.5%) have the highest median income of $23,750 per family member.
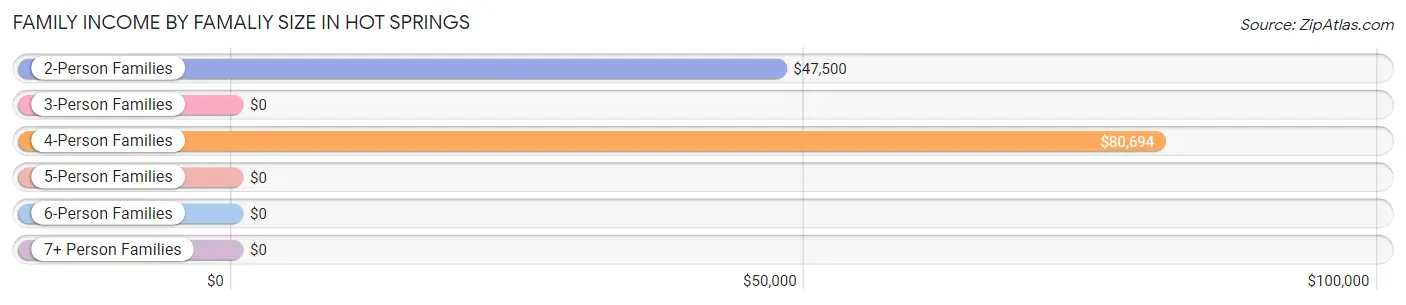
| Income Bracket | # Families | Median Income |
| 2-Person Families | 60 (54.5%) | $47,500 |
| 3-Person Families | 13 (11.8%) | $0 |
| 4-Person Families | 34 (30.9%) | $80,694 |
| 5-Person Families | 3 (2.7%) | $0 |
| 6-Person Families | 0 (0.0%) | $0 |
| 7+ Person Families | 0 (0.0%) | $0 |
| Total | 110 (100.0%) | $62,500 |
Family Income by Number of Earners in Hot Springs
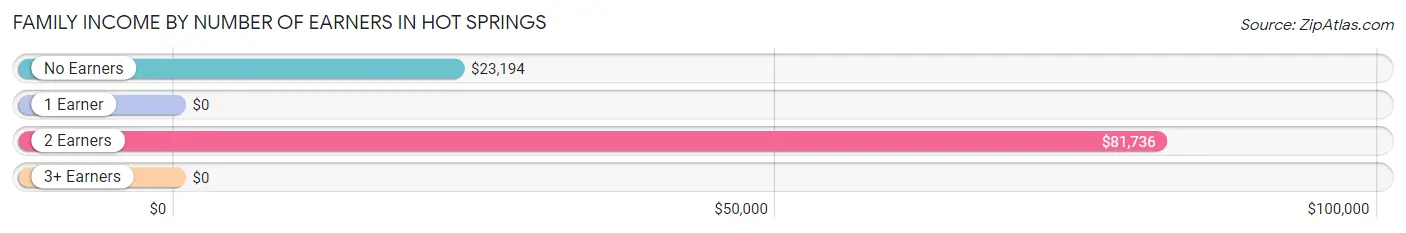
| Number of Earners | # Families | Median Income |
| No Earners | 15 (13.6%) | $23,194 |
| 1 Earner | 46 (41.8%) | $0 |
| 2 Earners | 49 (44.6%) | $81,736 |
| 3+ Earners | 0 (0.0%) | $0 |
| Total | 110 (100.0%) | $62,500 |
Household Income in Hot Springs
Household Income Brackets in Hot Springs
With 34 households falling in the category, the $75,000 to $99,999 income range is the most frequent in Hot Springs, accounting for 16.7% of all households. In contrast, only 2 households (1.0%) fall into the $200,000+ income bracket, making it the least populous group.
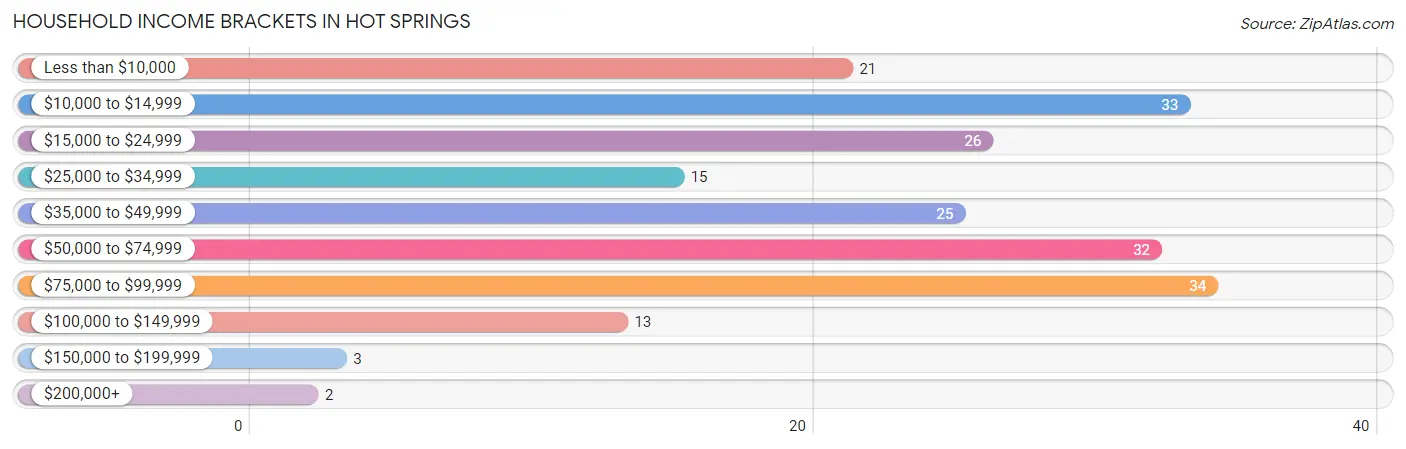
| Income Bracket | # Households | % Households |
| Less than $10,000 | 21 | 10.3% |
| $10,000 to $14,999 | 33 | 16.2% |
| $15,000 to $24,999 | 26 | 12.7% |
| $25,000 to $34,999 | 15 | 7.4% |
| $35,000 to $49,999 | 25 | 12.3% |
| $50,000 to $74,999 | 32 | 15.7% |
| $75,000 to $99,999 | 34 | 16.7% |
| $100,000 to $149,999 | 13 | 6.4% |
| $150,000 to $199,999 | 3 | 1.5% |
| $200,000+ | 2 | 1.0% |
Household Income by Householder Age in Hot Springs
The median household income in Hot Springs is $45,500, with the highest median household income of $51,250 found in the 25 to 44 years age bracket for the primary householder. A total of 75 households (36.8%) fall into this category.
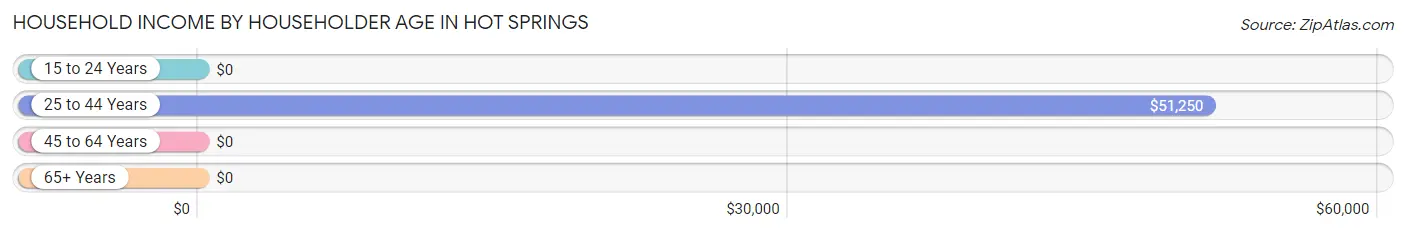
| Income Bracket | # Households | Median Income |
| 15 to 24 Years | 0 (0.0%) | $0 |
| 25 to 44 Years | 75 (36.8%) | $51,250 |
| 45 to 64 Years | 79 (38.7%) | $0 |
| 65+ Years | 50 (24.5%) | $0 |
| Total | 204 (100.0%) | $45,500 |
Poverty in Hot Springs
Income Below Poverty by Sex and Age in Hot Springs
With 9.9% poverty level for males and 28.9% for females among the residents of Hot Springs, 75 year old and over males and under 5 year old females are the most vulnerable to poverty, with 11 males (64.7%) and 10 females (100.0%) in their respective age groups living below the poverty level.
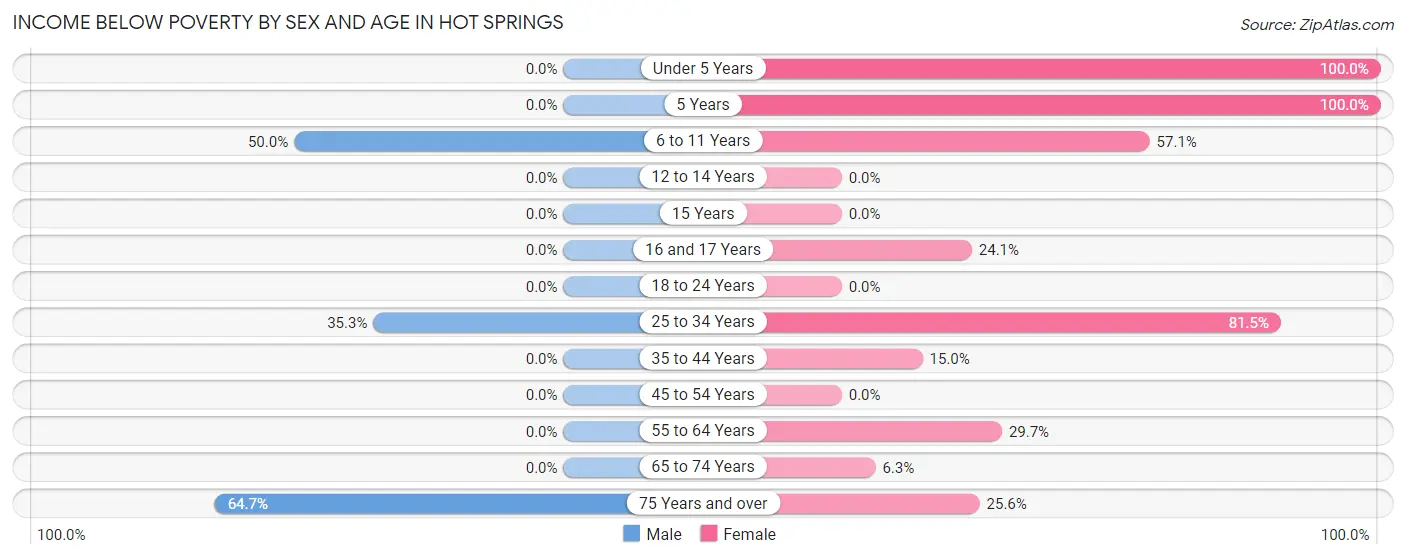
| Age Bracket | Male | Female |
| Under 5 Years | 0 (0.0%) | 10 (100.0%) |
| 5 Years | 0 (0.0%) | 7 (100.0%) |
| 6 to 11 Years | 6 (50.0%) | 8 (57.1%) |
| 12 to 14 Years | 0 (0.0%) | 0 (0.0%) |
| 15 Years | 0 (0.0%) | 0 (0.0%) |
| 16 and 17 Years | 0 (0.0%) | 7 (24.1%) |
| 18 to 24 Years | 0 (0.0%) | 0 (0.0%) |
| 25 to 34 Years | 6 (35.3%) | 22 (81.5%) |
| 35 to 44 Years | 0 (0.0%) | 6 (15.0%) |
| 45 to 54 Years | 0 (0.0%) | 0 (0.0%) |
| 55 to 64 Years | 0 (0.0%) | 11 (29.7%) |
| 65 to 74 Years | 0 (0.0%) | 1 (6.2%) |
| 75 Years and over | 11 (64.7%) | 11 (25.6%) |
| Total | 23 (9.9%) | 83 (28.9%) |
Income Above Poverty by Sex and Age in Hot Springs
According to the poverty statistics in Hot Springs, males aged under 5 years and females aged 12 to 14 years are the age groups that are most secure financially, with 100.0% of males and 100.0% of females in these age groups living above the poverty line.
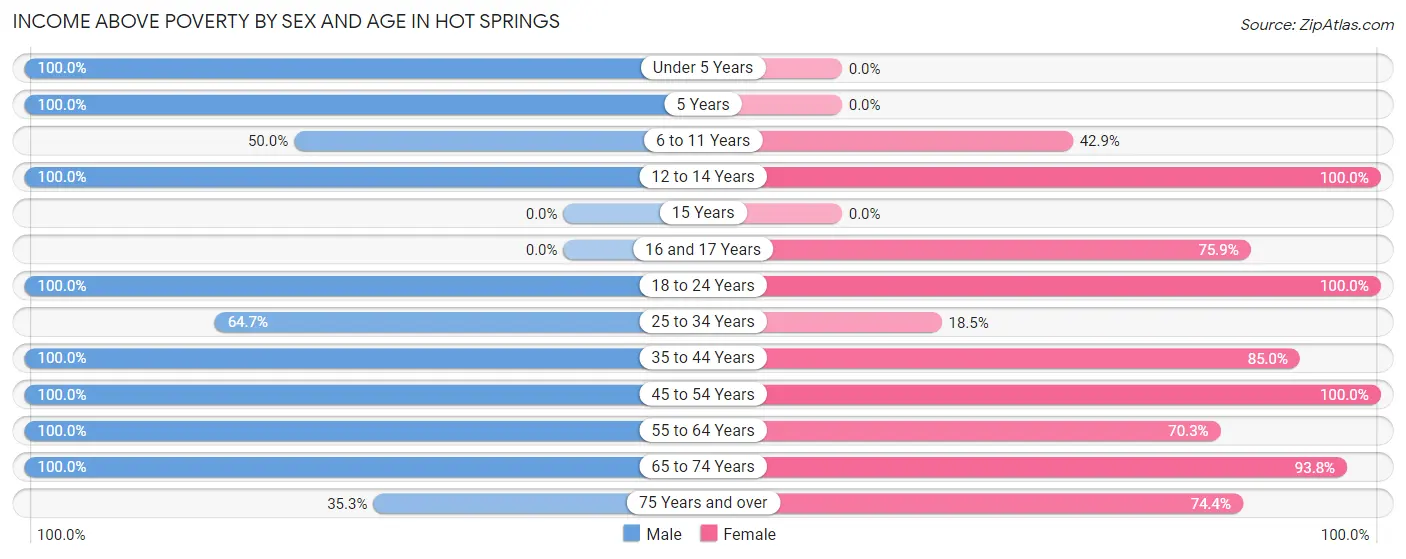
| Age Bracket | Male | Female |
| Under 5 Years | 7 (100.0%) | 0 (0.0%) |
| 5 Years | 4 (100.0%) | 0 (0.0%) |
| 6 to 11 Years | 6 (50.0%) | 6 (42.9%) |
| 12 to 14 Years | 6 (100.0%) | 4 (100.0%) |
| 15 Years | 0 (0.0%) | 0 (0.0%) |
| 16 and 17 Years | 0 (0.0%) | 22 (75.9%) |
| 18 to 24 Years | 33 (100.0%) | 11 (100.0%) |
| 25 to 34 Years | 11 (64.7%) | 5 (18.5%) |
| 35 to 44 Years | 46 (100.0%) | 34 (85.0%) |
| 45 to 54 Years | 66 (100.0%) | 49 (100.0%) |
| 55 to 64 Years | 13 (100.0%) | 26 (70.3%) |
| 65 to 74 Years | 11 (100.0%) | 15 (93.8%) |
| 75 Years and over | 6 (35.3%) | 32 (74.4%) |
| Total | 209 (90.1%) | 204 (71.1%) |
Income Below Poverty Among Married-Couple Families in Hot Springs
The poverty statistics for married-couple families in Hot Springs show that 7.7% or 5 of the total 65 families live below the poverty line. Families with no children have the highest poverty rate of 12.5%, comprising of 5 families. On the other hand, families with 1 or 2 children have the lowest poverty rate of 0.0%, which includes 0 families.
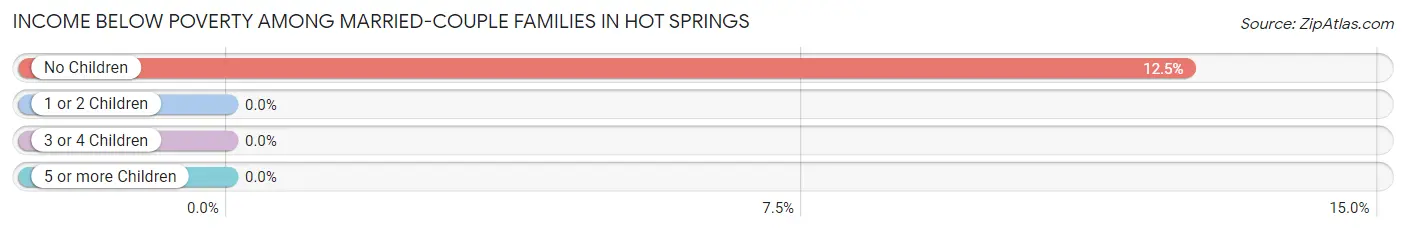
| Children | Above Poverty | Below Poverty |
| No Children | 35 (87.5%) | 5 (12.5%) |
| 1 or 2 Children | 25 (100.0%) | 0 (0.0%) |
| 3 or 4 Children | 0 (0.0%) | 0 (0.0%) |
| 5 or more Children | 0 (0.0%) | 0 (0.0%) |
| Total | 60 (92.3%) | 5 (7.7%) |
Income Below Poverty Among Single-Parent Households in Hot Springs
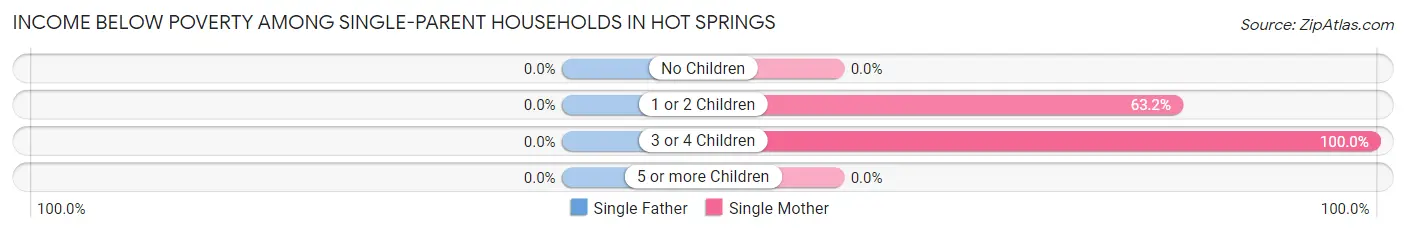
| Children | Single Father | Single Mother |
| No Children | 0 (0.0%) | 0 (0.0%) |
| 1 or 2 Children | 0 (0.0%) | 12 (63.2%) |
| 3 or 4 Children | 0 (0.0%) | 10 (100.0%) |
| 5 or more Children | 0 (0.0%) | 0 (0.0%) |
| Total | 0 (0.0%) | 22 (51.2%) |
Income Below Poverty Among Married-Couple vs Single-Parent Households in Hot Springs
The poverty data for Hot Springs shows that 5 of the married-couple family households (7.7%) and 22 of the single-parent households (48.9%) are living below the poverty level. Within the married-couple family households, those with no children have the highest poverty rate, with 5 households (12.5%) falling below the poverty line. Among the single-parent households, those with 3 or 4 children have the highest poverty rate, with 10 household (100.0%) living below poverty.
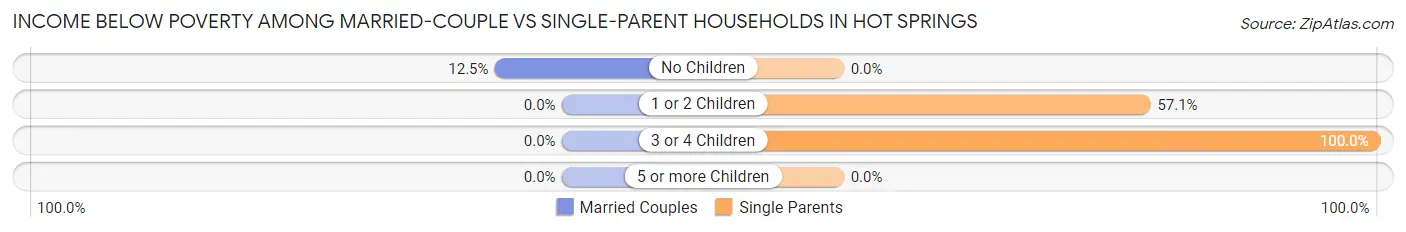
| Children | Married-Couple Families | Single-Parent Households |
| No Children | 5 (12.5%) | 0 (0.0%) |
| 1 or 2 Children | 0 (0.0%) | 12 (57.1%) |
| 3 or 4 Children | 0 (0.0%) | 10 (100.0%) |
| 5 or more Children | 0 (0.0%) | 0 (0.0%) |
| Total | 5 (7.7%) | 22 (48.9%) |
Race in Hot Springs
The most populous races in Hot Springs are White / Caucasian (504 | 97.1%), and Two or more Races (15 | 2.9%).
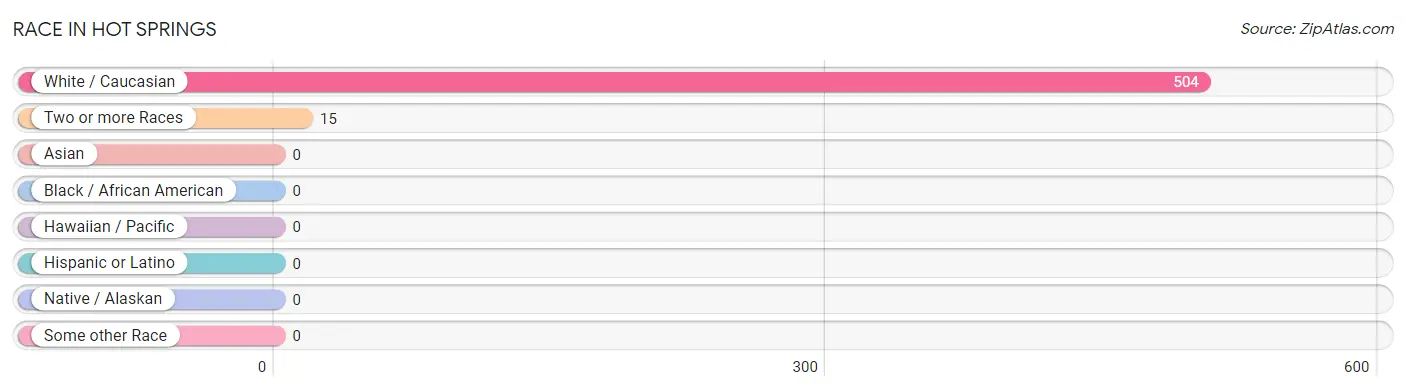
| Race | # Population | % Population |
| Asian | 0 | 0.0% |
| Black / African American | 0 | 0.0% |
| Hawaiian / Pacific | 0 | 0.0% |
| Hispanic or Latino | 0 | 0.0% |
| Native / Alaskan | 0 | 0.0% |
| White / Caucasian | 504 | 97.1% |
| Two or more Races | 15 | 2.9% |
| Some other Race | 0 | 0.0% |
| Total | 519 | 100.0% |
Ancestry in Hot Springs
The most populous ancestries reported in Hot Springs are American (174 | 33.5%), German (83 | 16.0%), Irish (71 | 13.7%), English (65 | 12.5%), and Scotch-Irish (31 | 6.0%), together accounting for 81.7% of all Hot Springs residents.
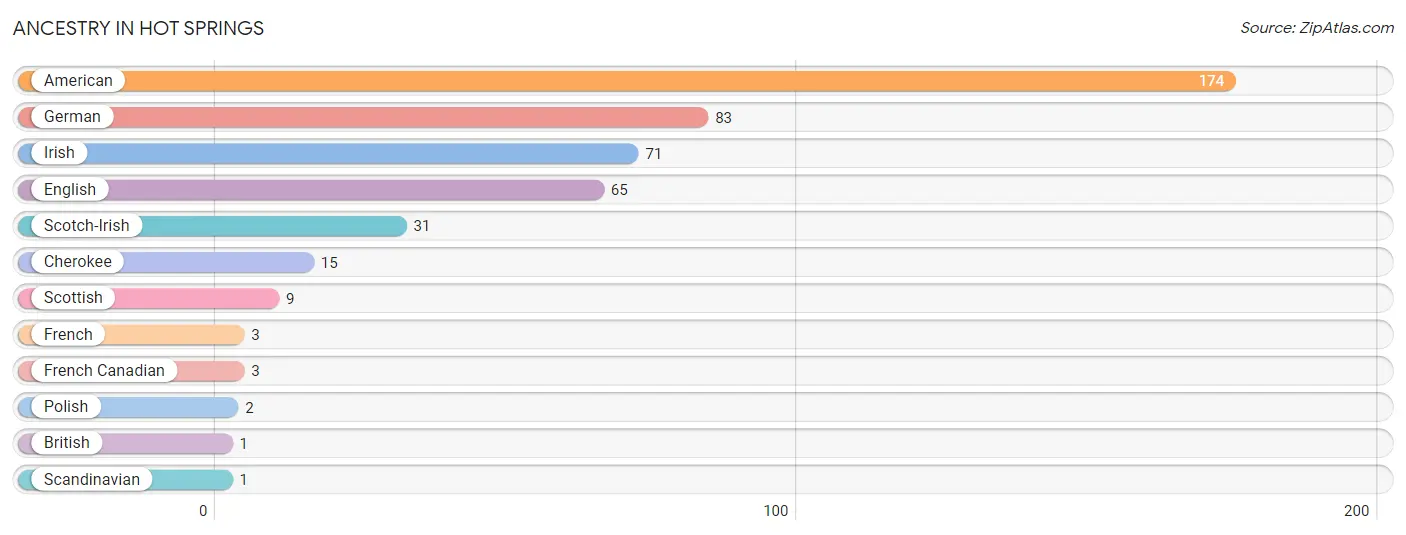
| Ancestry | # Population | % Population |
| American | 174 | 33.5% |
| British | 1 | 0.2% |
| Cherokee | 15 | 2.9% |
| English | 65 | 12.5% |
| French | 3 | 0.6% |
| French Canadian | 3 | 0.6% |
| German | 83 | 16.0% |
| Irish | 71 | 13.7% |
| Polish | 2 | 0.4% |
| Scandinavian | 1 | 0.2% |
| Scotch-Irish | 31 | 6.0% |
| Scottish | 9 | 1.7% | View All 12 Rows |
Immigrants in Hot Springs

| Immigration Origin | # Population | % Population | View All 0 Rows |
Sex and Age in Hot Springs
Sex and Age in Hot Springs
The most populous age groups in Hot Springs are 45 to 49 Years (43 | 18.5%) for men and 45 to 49 Years (47 | 16.4%) for women.
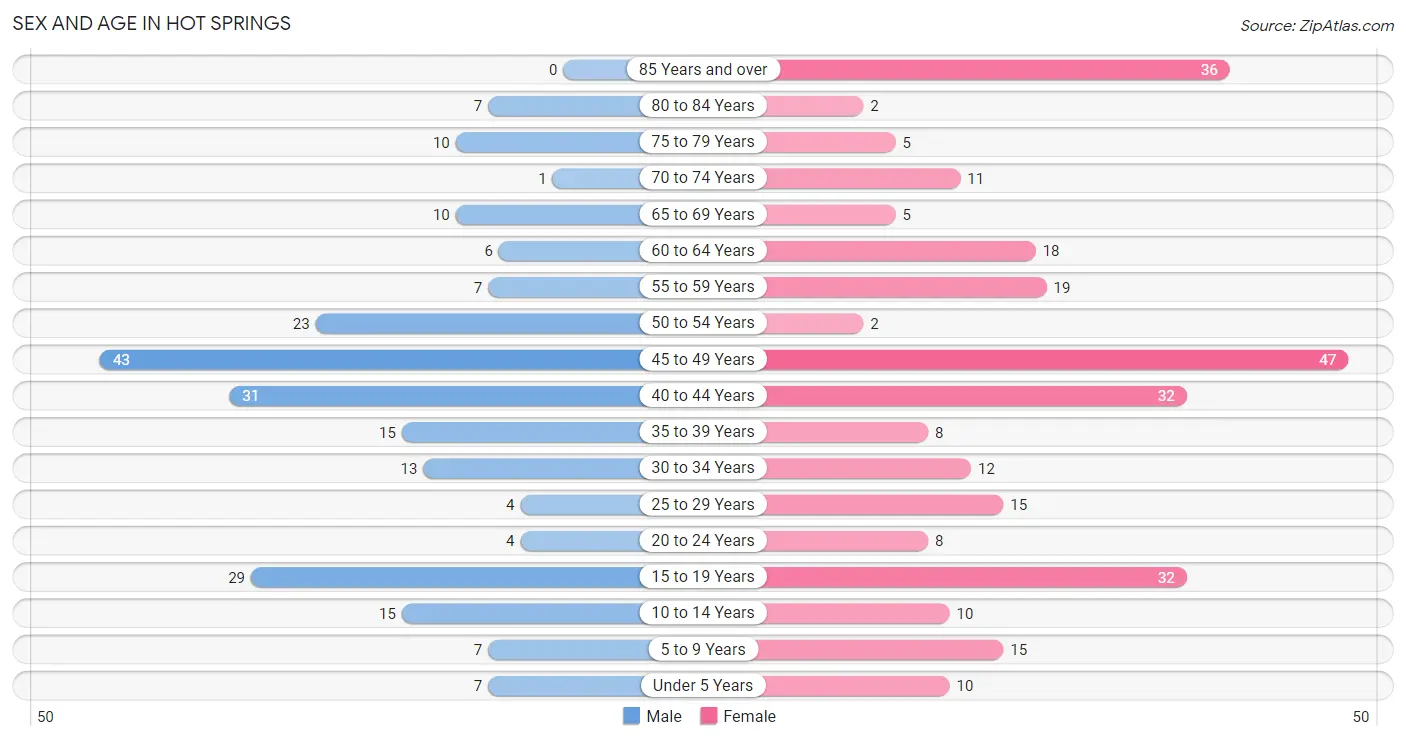
| Age Bracket | Male | Female |
| Under 5 Years | 7 (3.0%) | 10 (3.5%) |
| 5 to 9 Years | 7 (3.0%) | 15 (5.2%) |
| 10 to 14 Years | 15 (6.5%) | 10 (3.5%) |
| 15 to 19 Years | 29 (12.5%) | 32 (11.2%) |
| 20 to 24 Years | 4 (1.7%) | 8 (2.8%) |
| 25 to 29 Years | 4 (1.7%) | 15 (5.2%) |
| 30 to 34 Years | 13 (5.6%) | 12 (4.2%) |
| 35 to 39 Years | 15 (6.5%) | 8 (2.8%) |
| 40 to 44 Years | 31 (13.4%) | 32 (11.2%) |
| 45 to 49 Years | 43 (18.5%) | 47 (16.4%) |
| 50 to 54 Years | 23 (9.9%) | 2 (0.7%) |
| 55 to 59 Years | 7 (3.0%) | 19 (6.6%) |
| 60 to 64 Years | 6 (2.6%) | 18 (6.3%) |
| 65 to 69 Years | 10 (4.3%) | 5 (1.7%) |
| 70 to 74 Years | 1 (0.4%) | 11 (3.8%) |
| 75 to 79 Years | 10 (4.3%) | 5 (1.7%) |
| 80 to 84 Years | 7 (3.0%) | 2 (0.7%) |
| 85 Years and over | 0 (0.0%) | 36 (12.5%) |
| Total | 232 (100.0%) | 287 (100.0%) |
Families and Households in Hot Springs
Median Family Size in Hot Springs
The median family size in Hot Springs is 3.51 persons per family, with single female/mother families (43 | 39.1%) accounting for the largest median family size of 4.23 persons per family. On the other hand, single male/father families (2 | 1.8%) represent the smallest median family size with 2.50 persons per family.
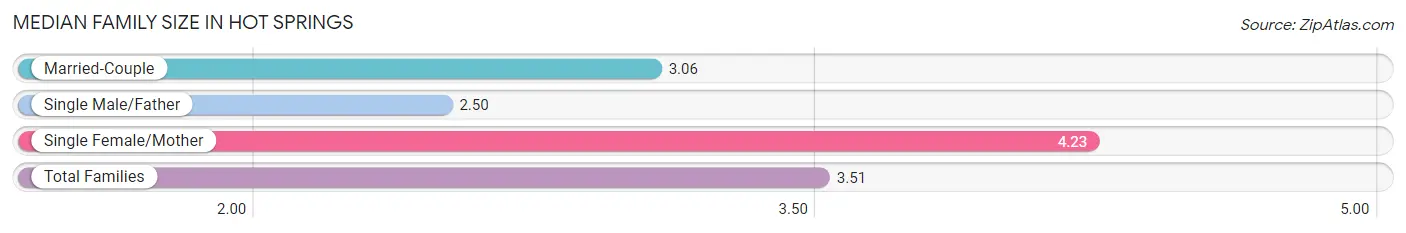
| Family Type | # Families | Family Size |
| Married-Couple | 65 (59.1%) | 3.06 |
| Single Male/Father | 2 (1.8%) | 2.50 |
| Single Female/Mother | 43 (39.1%) | 4.23 |
| Total Families | 110 (100.0%) | 3.51 |
Median Household Size in Hot Springs
The median household size in Hot Springs is 2.41 persons per household, with single female/mother households (43 | 21.1%) accounting for the largest median household size of 4.35 persons per household. non-family households (94 | 46.1%) represent the smallest median household size with 1.03 persons per household.
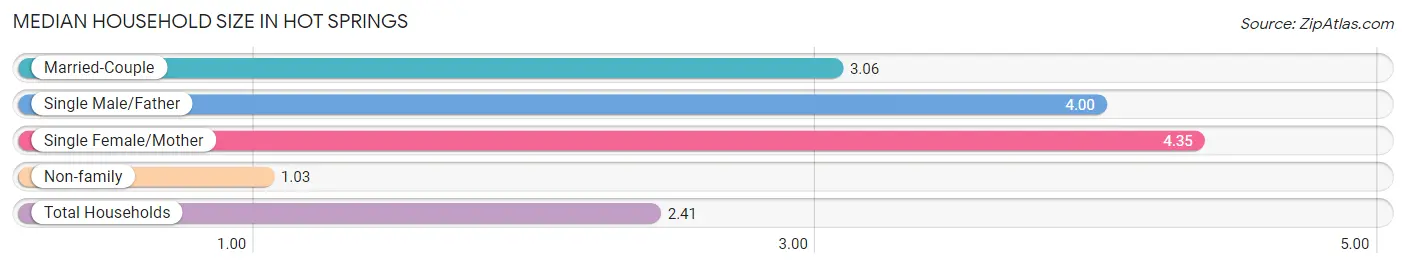
| Household Type | # Households | Household Size |
| Married-Couple | 65 (31.9%) | 3.06 |
| Single Male/Father | 2 (1.0%) | 4.00 |
| Single Female/Mother | 43 (21.1%) | 4.35 |
| Non-family | 94 (46.1%) | 1.03 |
| Total Households | 204 (100.0%) | 2.41 |
Household Size by Marriage Status in Hot Springs
Out of a total of 204 households in Hot Springs, 110 (53.9%) are family households, while 94 (46.1%) are nonfamily households. The most numerous type of family households are 2-person households, comprising 58, and the most common type of nonfamily households are 1-person households, comprising 91.
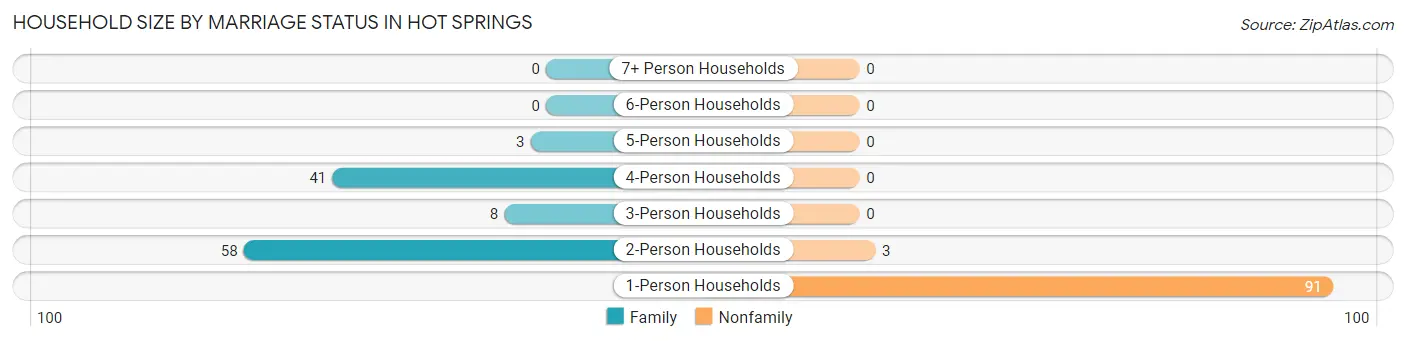
| Household Size | Family Households | Nonfamily Households |
| 1-Person Households | - | 91 (44.6%) |
| 2-Person Households | 58 (28.4%) | 3 (1.5%) |
| 3-Person Households | 8 (3.9%) | 0 (0.0%) |
| 4-Person Households | 41 (20.1%) | 0 (0.0%) |
| 5-Person Households | 3 (1.5%) | 0 (0.0%) |
| 6-Person Households | 0 (0.0%) | 0 (0.0%) |
| 7+ Person Households | 0 (0.0%) | 0 (0.0%) |
| Total | 110 (53.9%) | 94 (46.1%) |
Female Fertility in Hot Springs
Fertility by Age in Hot Springs
Average fertility rate in Hot Springs is 83.0 births per 1,000 women. Women in the age bracket of 20 to 34 years have the highest fertility rate with 286.0 births per 1,000 women. Women in the age bracket of 20 to 34 years acount for 76.9% of all women with births.
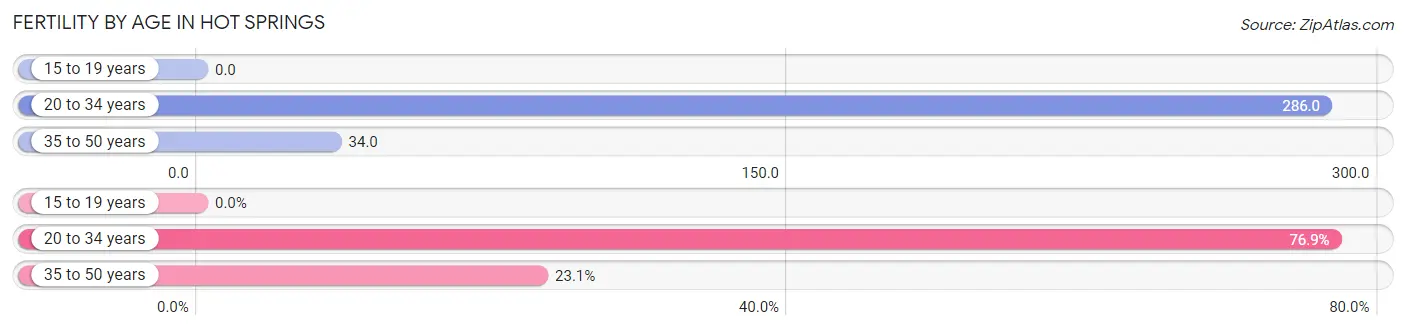
| Age Bracket | Women with Births | Births / 1,000 Women |
| 15 to 19 years | 0 (0.0%) | 0.0 |
| 20 to 34 years | 10 (76.9%) | 286.0 |
| 35 to 50 years | 3 (23.1%) | 34.0 |
| Total | 13 (100.0%) | 83.0 |
Fertility by Age by Marriage Status in Hot Springs
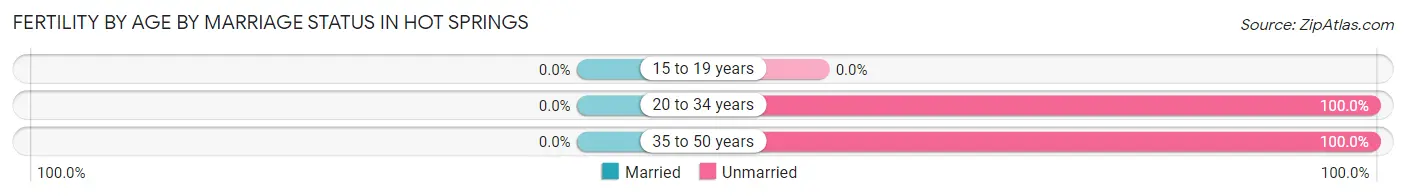
| Age Bracket | Married | Unmarried |
| 15 to 19 years | 0 (0.0%) | 0 (0.0%) |
| 20 to 34 years | 0 (0.0%) | 10 (100.0%) |
| 35 to 50 years | 0 (0.0%) | 3 (100.0%) |
| Total | 0 (0.0%) | 13 (100.0%) |
Fertility by Education in Hot Springs
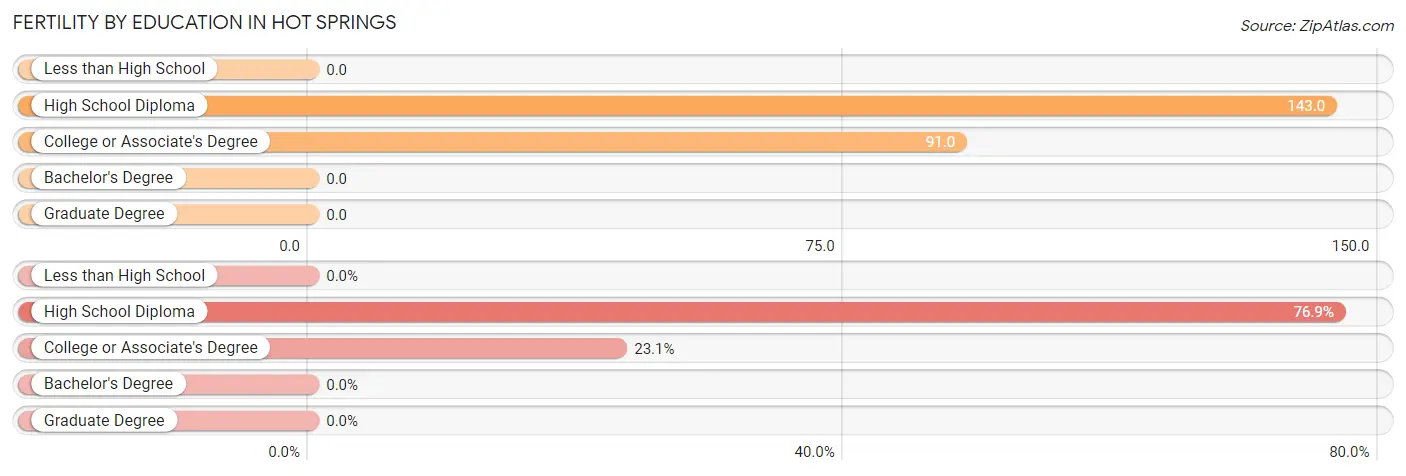
| Educational Attainment | Women with Births | Births / 1,000 Women |
| Less than High School | 0 (0.0%) | 0.0 |
| High School Diploma | 10 (76.9%) | 143.0 |
| College or Associate's Degree | 3 (23.1%) | 91.0 |
| Bachelor's Degree | 0 (0.0%) | 0.0 |
| Graduate Degree | 0 (0.0%) | 0.0 |
| Total | 13 (100.0%) | 83.0 |
Fertility by Education by Marriage Status in Hot Springs
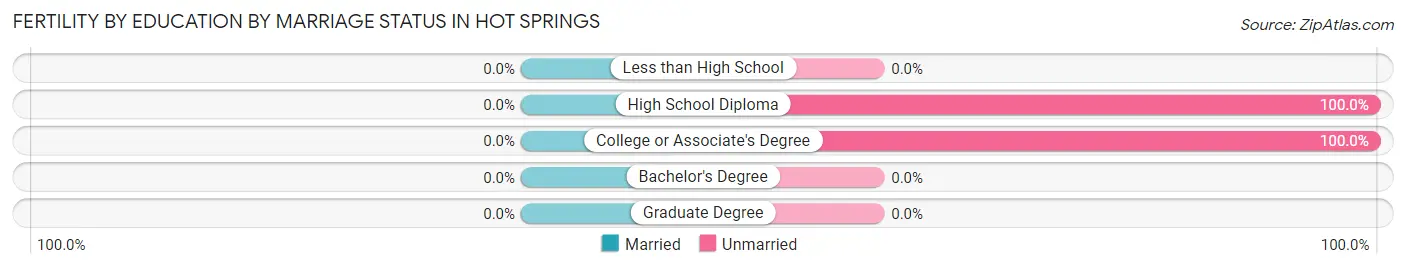
| Educational Attainment | Married | Unmarried |
| Less than High School | 0 (0.0%) | 0 (0.0%) |
| High School Diploma | 0 (0.0%) | 10 (100.0%) |
| College or Associate's Degree | 0 (0.0%) | 3 (100.0%) |
| Bachelor's Degree | 0 (0.0%) | 0 (0.0%) |
| Graduate Degree | 0 (0.0%) | 0 (0.0%) |
| Total | 0 (0.0%) | 13 (100.0%) |
Employment Characteristics in Hot Springs
Employment by Class of Employer in Hot Springs
Among the 243 employed individuals in Hot Springs, private company employees (154 | 63.4%), local government employees (58 | 23.9%), and not-for-profit organizations (10 | 4.1%) make up the most common classes of employment.
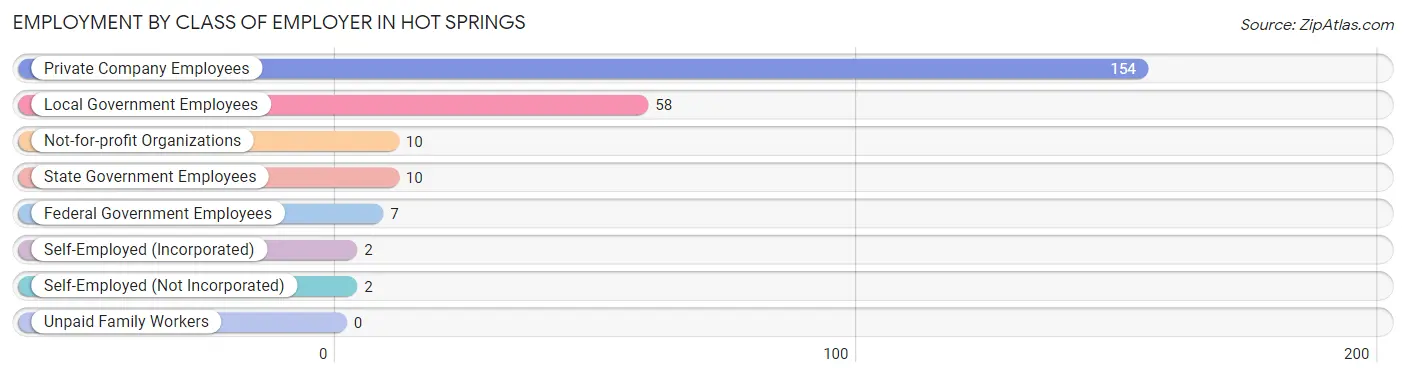
| Employer Class | # Employees | % Employees |
| Private Company Employees | 154 | 63.4% |
| Self-Employed (Incorporated) | 2 | 0.8% |
| Self-Employed (Not Incorporated) | 2 | 0.8% |
| Not-for-profit Organizations | 10 | 4.1% |
| Local Government Employees | 58 | 23.9% |
| State Government Employees | 10 | 4.1% |
| Federal Government Employees | 7 | 2.9% |
| Unpaid Family Workers | 0 | 0.0% |
| Total | 243 | 100.0% |
Employment Status by Age in Hot Springs
According to the labor force statistics for Hot Springs, out of the total population over 16 years of age (455), 58.2% or 265 individuals are in the labor force, with 3.4% or 9 of them unemployed. The age group with the highest labor force participation rate is 25 to 29 years, with 100.0% or 19 individuals in the labor force. Within the labor force, the 55 to 59 years age range has the highest percentage of unemployed individuals, with 60.0% or 9 of them being unemployed.
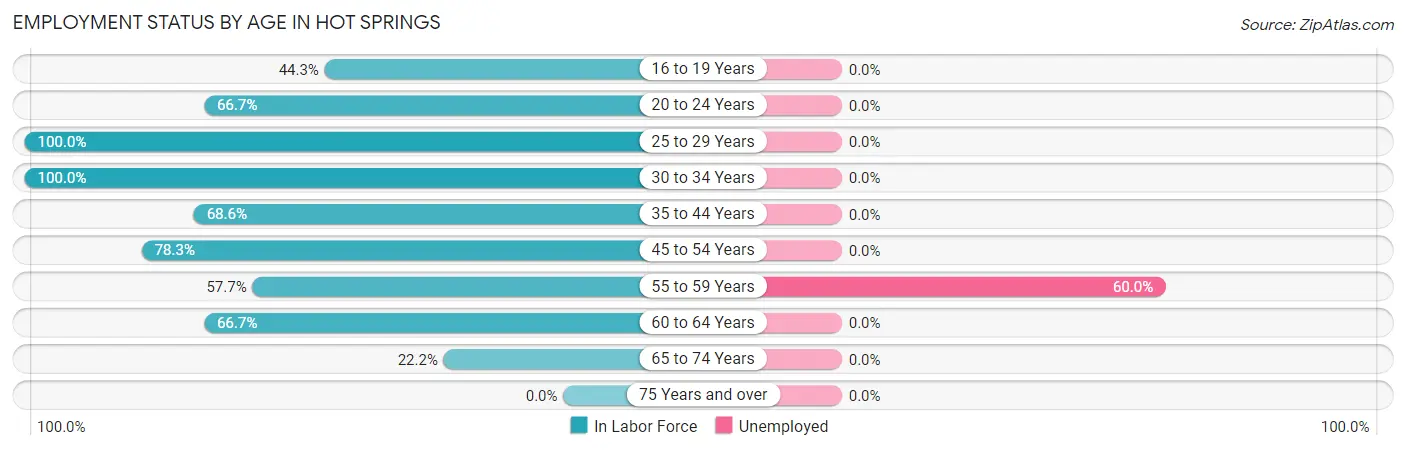
| Age Bracket | In Labor Force | Unemployed |
| 16 to 19 Years | 27 (44.3%) | 0 (0.0%) |
| 20 to 24 Years | 8 (66.7%) | 0 (0.0%) |
| 25 to 29 Years | 19 (100.0%) | 0 (0.0%) |
| 30 to 34 Years | 25 (100.0%) | 0 (0.0%) |
| 35 to 44 Years | 59 (68.6%) | 0 (0.0%) |
| 45 to 54 Years | 90 (78.3%) | 0 (0.0%) |
| 55 to 59 Years | 15 (57.7%) | 9 (60.0%) |
| 60 to 64 Years | 16 (66.7%) | 0 (0.0%) |
| 65 to 74 Years | 6 (22.2%) | 0 (0.0%) |
| 75 Years and over | 0 (0.0%) | 0 (0.0%) |
| Total | 265 (58.2%) | 9 (3.4%) |
Employment Status by Educational Attainment in Hot Springs
According to labor force statistics for Hot Springs, 75.9% of individuals (224) out of the total population between 25 and 64 years of age (295) are in the labor force, with 4.0% or 9 of them being unemployed. The group with the highest labor force participation rate are those with the educational attainment of college / associate degree, with 93.8% or 91 individuals in the labor force. Within the labor force, individuals with bachelor's degree or higher education have the highest percentage of unemployment, with 7.5% or 5 of them being unemployed.
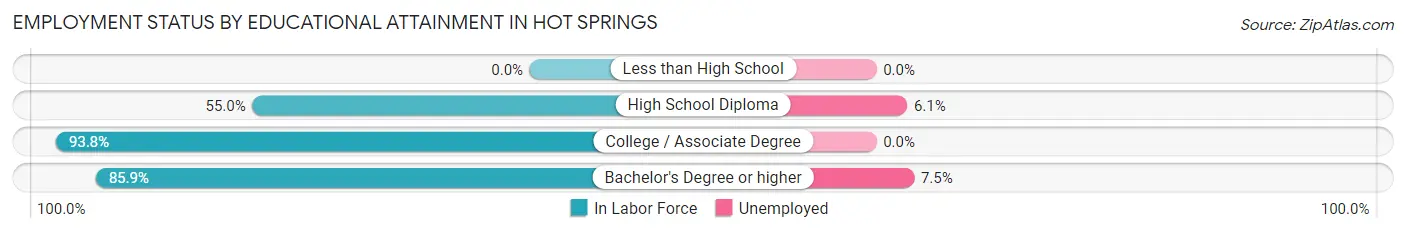
| Educational Attainment | In Labor Force | Unemployed |
| Less than High School | 0 (0.0%) | 0 (0.0%) |
| High School Diploma | 66 (55.0%) | 7 (6.1%) |
| College / Associate Degree | 91 (93.8%) | 0 (0.0%) |
| Bachelor's Degree or higher | 67 (85.9%) | 6 (7.5%) |
| Total | 224 (75.9%) | 12 (4.0%) |
Employment Occupations by Sex in Hot Springs
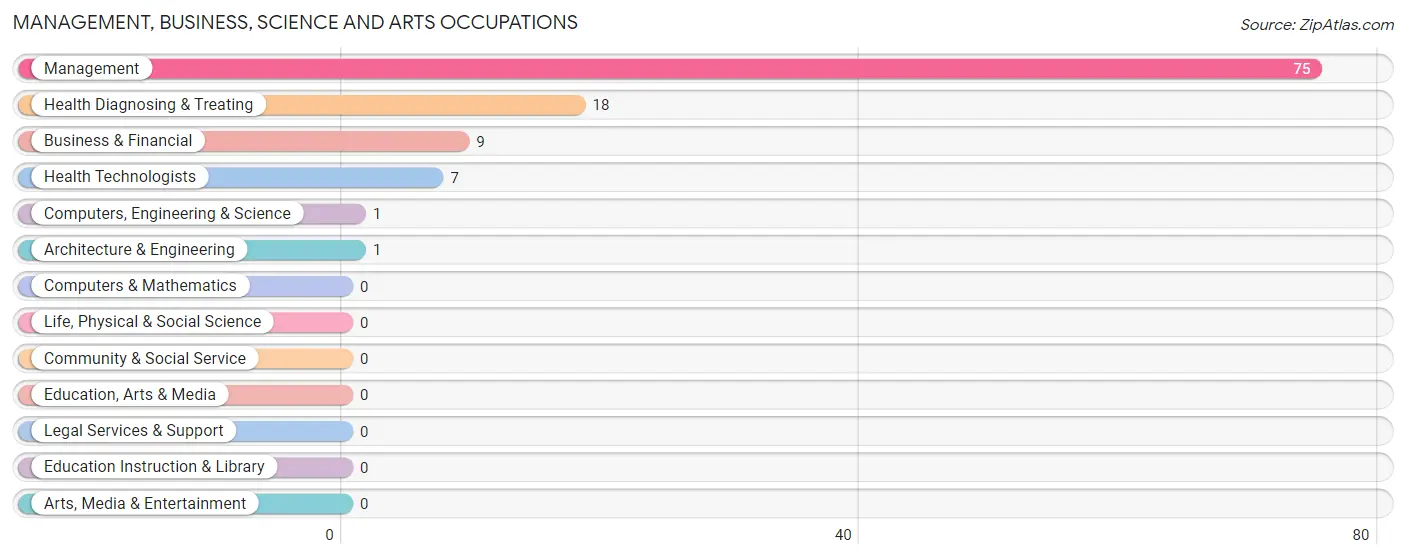
Management, Business, Science and Arts Occupations
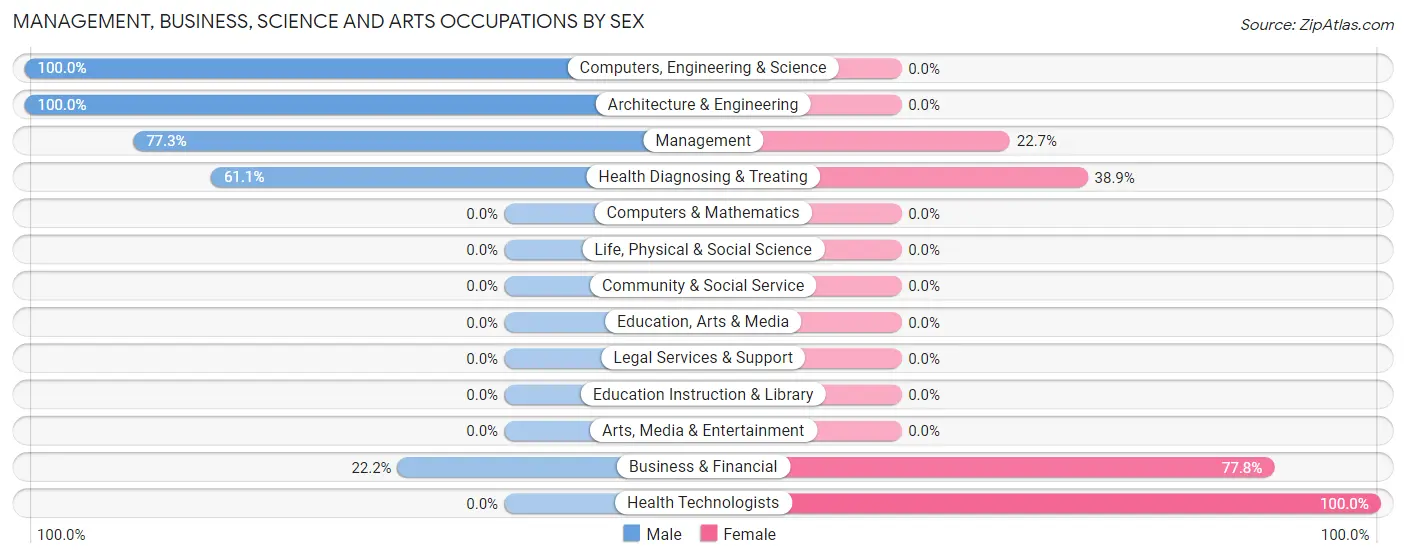
The most common Management, Business, Science and Arts occupations in Hot Springs are Management (75 | 29.3%), Health Diagnosing & Treating (18 | 7.0%), Business & Financial (9 | 3.5%), Health Technologists (7 | 2.7%), and Computers, Engineering & Science (1 | 0.4%).
Management, Business, Science and Arts Occupations by Sex
Within the Management, Business, Science and Arts occupations in Hot Springs, the most male-oriented occupations are Computers, Engineering & Science (100.0%), Architecture & Engineering (100.0%), and Management (77.3%), while the most female-oriented occupations are Health Technologists (100.0%), Business & Financial (77.8%), and Health Diagnosing & Treating (38.9%).
| Occupation | Male | Female |
| Management | 58 (77.3%) | 17 (22.7%) |
| Business & Financial | 2 (22.2%) | 7 (77.8%) |
| Computers, Engineering & Science | 1 (100.0%) | 0 (0.0%) |
| Computers & Mathematics | 0 (0.0%) | 0 (0.0%) |
| Architecture & Engineering | 1 (100.0%) | 0 (0.0%) |
| Life, Physical & Social Science | 0 (0.0%) | 0 (0.0%) |
| Community & Social Service | 0 (0.0%) | 0 (0.0%) |
| Education, Arts & Media | 0 (0.0%) | 0 (0.0%) |
| Legal Services & Support | 0 (0.0%) | 0 (0.0%) |
| Education Instruction & Library | 0 (0.0%) | 0 (0.0%) |
| Arts, Media & Entertainment | 0 (0.0%) | 0 (0.0%) |
| Health Diagnosing & Treating | 11 (61.1%) | 7 (38.9%) |
| Health Technologists | 0 (0.0%) | 7 (100.0%) |
| Total (Category) | 72 (69.9%) | 31 (30.1%) |
| Total (Overall) | 142 (55.5%) | 114 (44.5%) |
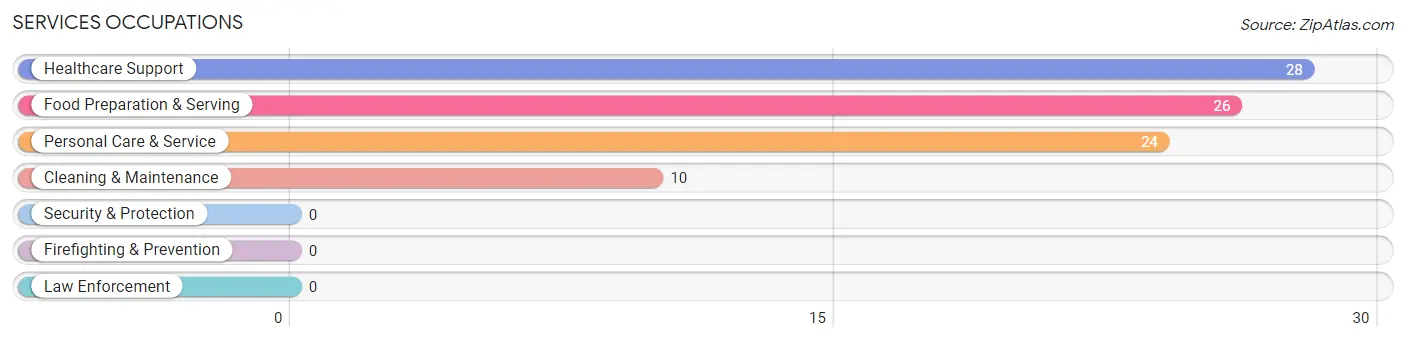
Services Occupations
The most common Services occupations in Hot Springs are Healthcare Support (28 | 10.9%), Food Preparation & Serving (26 | 10.2%), Personal Care & Service (24 | 9.4%), and Cleaning & Maintenance (10 | 3.9%).
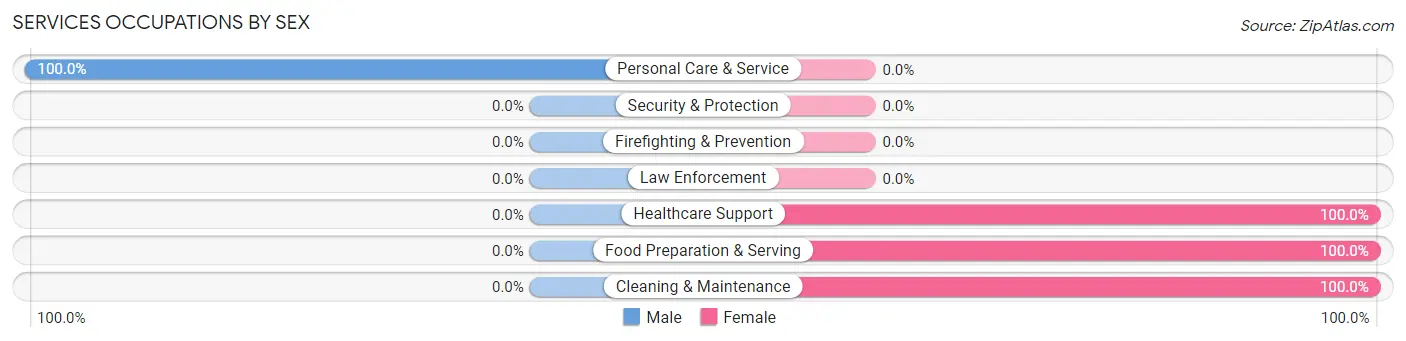
Services Occupations by Sex
| Occupation | Male | Female |
| Healthcare Support | 0 (0.0%) | 28 (100.0%) |
| Security & Protection | 0 (0.0%) | 0 (0.0%) |
| Firefighting & Prevention | 0 (0.0%) | 0 (0.0%) |
| Law Enforcement | 0 (0.0%) | 0 (0.0%) |
| Food Preparation & Serving | 0 (0.0%) | 26 (100.0%) |
| Cleaning & Maintenance | 0 (0.0%) | 10 (100.0%) |
| Personal Care & Service | 24 (100.0%) | 0 (0.0%) |
| Total (Category) | 24 (27.3%) | 64 (72.7%) |
| Total (Overall) | 142 (55.5%) | 114 (44.5%) |
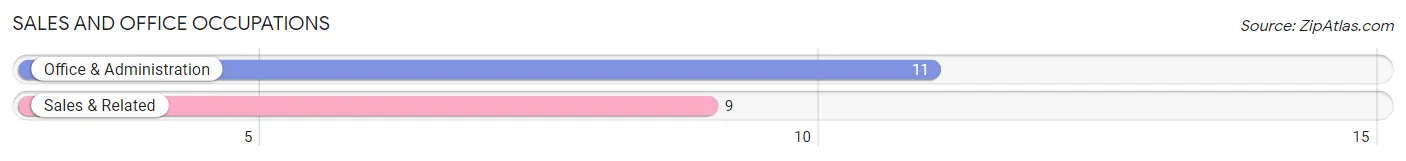
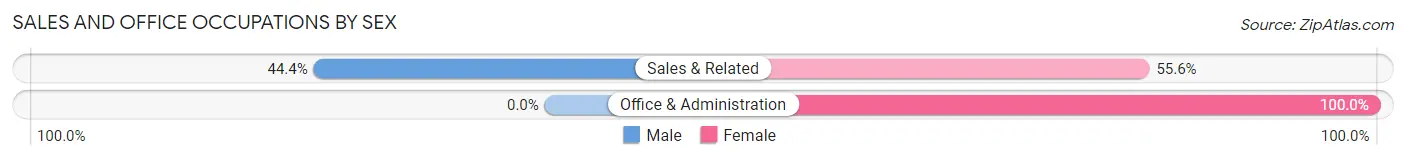
Sales and Office Occupations
The most common Sales and Office occupations in Hot Springs are Office & Administration (11 | 4.3%), and Sales & Related (9 | 3.5%).
Sales and Office Occupations by Sex
| Occupation | Male | Female |
| Sales & Related | 4 (44.4%) | 5 (55.6%) |
| Office & Administration | 0 (0.0%) | 11 (100.0%) |
| Total (Category) | 4 (20.0%) | 16 (80.0%) |
| Total (Overall) | 142 (55.5%) | 114 (44.5%) |
Natural Resources, Construction and Maintenance Occupations
The most common Natural Resources, Construction and Maintenance occupations in Hot Springs are , and Construction & Extraction (22 | 8.6%).
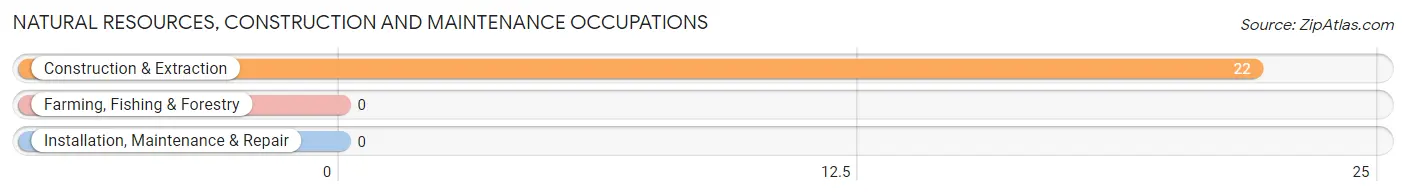
Natural Resources, Construction and Maintenance Occupations by Sex
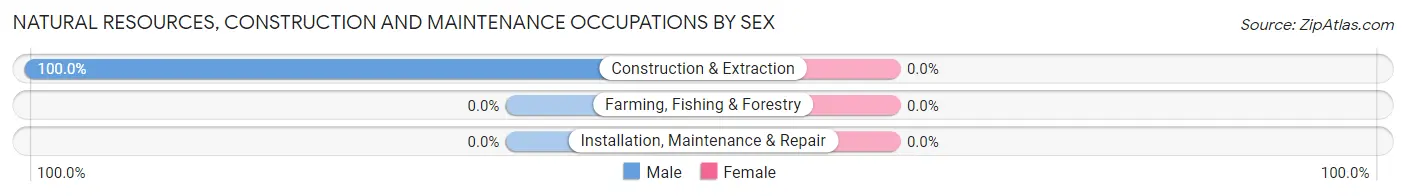
| Occupation | Male | Female |
| Farming, Fishing & Forestry | 0 (0.0%) | 0 (0.0%) |
| Construction & Extraction | 22 (100.0%) | 0 (0.0%) |
| Installation, Maintenance & Repair | 0 (0.0%) | 0 (0.0%) |
| Total (Category) | 22 (100.0%) | 0 (0.0%) |
| Total (Overall) | 142 (55.5%) | 114 (44.5%) |
Production, Transportation and Moving Occupations
The most common Production, Transportation and Moving occupations in Hot Springs are Production (9 | 3.5%), Material Moving (9 | 3.5%), and Transportation (5 | 1.9%).
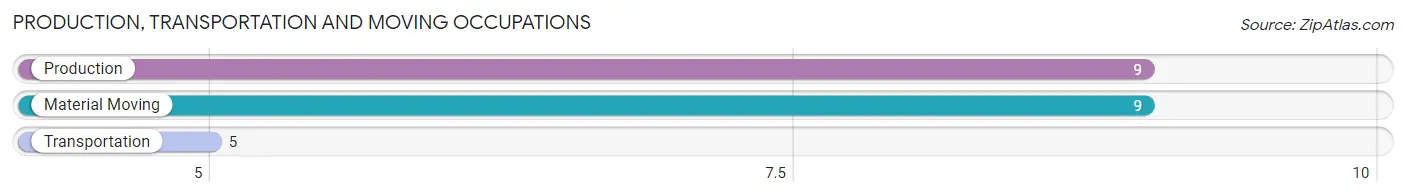
Production, Transportation and Moving Occupations by Sex
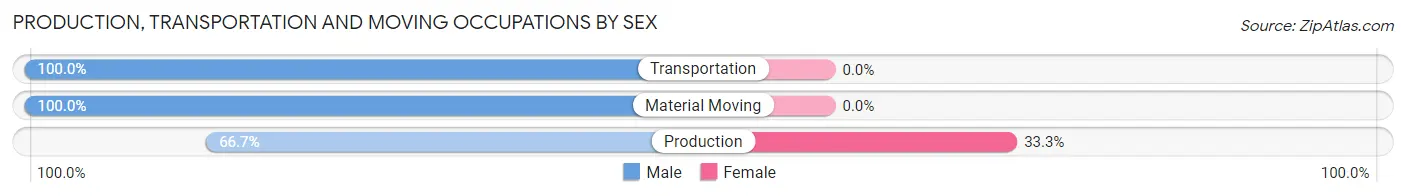
| Occupation | Male | Female |
| Production | 6 (66.7%) | 3 (33.3%) |
| Transportation | 5 (100.0%) | 0 (0.0%) |
| Material Moving | 9 (100.0%) | 0 (0.0%) |
| Total (Category) | 20 (87.0%) | 3 (13.0%) |
| Total (Overall) | 142 (55.5%) | 114 (44.5%) |
Employment Industries by Sex in Hot Springs
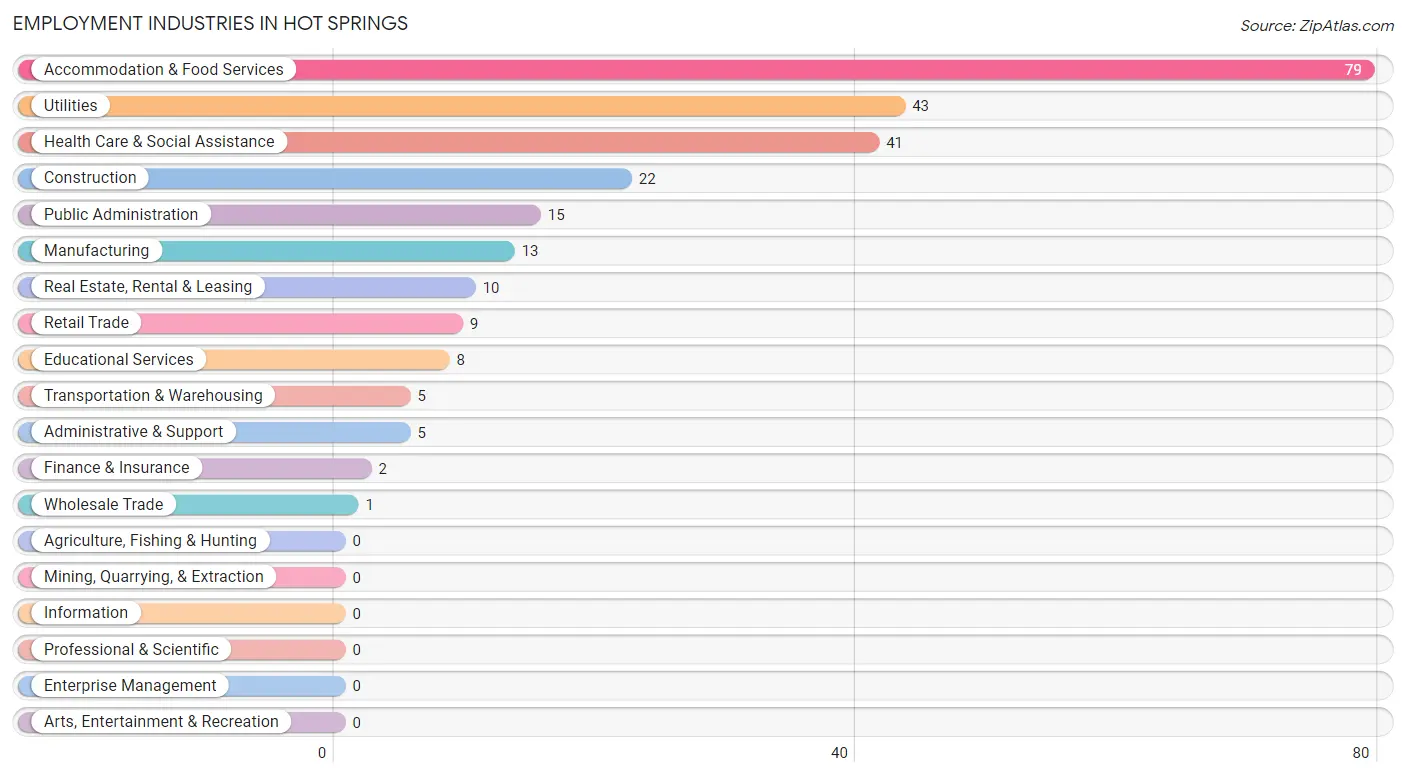
Employment Industries in Hot Springs
The major employment industries in Hot Springs include Accommodation & Food Services (79 | 30.9%), Utilities (43 | 16.8%), Health Care & Social Assistance (41 | 16.0%), Construction (22 | 8.6%), and Public Administration (15 | 5.9%).
Employment Industries by Sex in Hot Springs
The Hot Springs industries that see more men than women are Construction (100.0%), Wholesale Trade (100.0%), and Transportation & Warehousing (100.0%), whereas the industries that tend to have a higher number of women are Real Estate, Rental & Leasing (100.0%), Educational Services (100.0%), and Public Administration (100.0%).
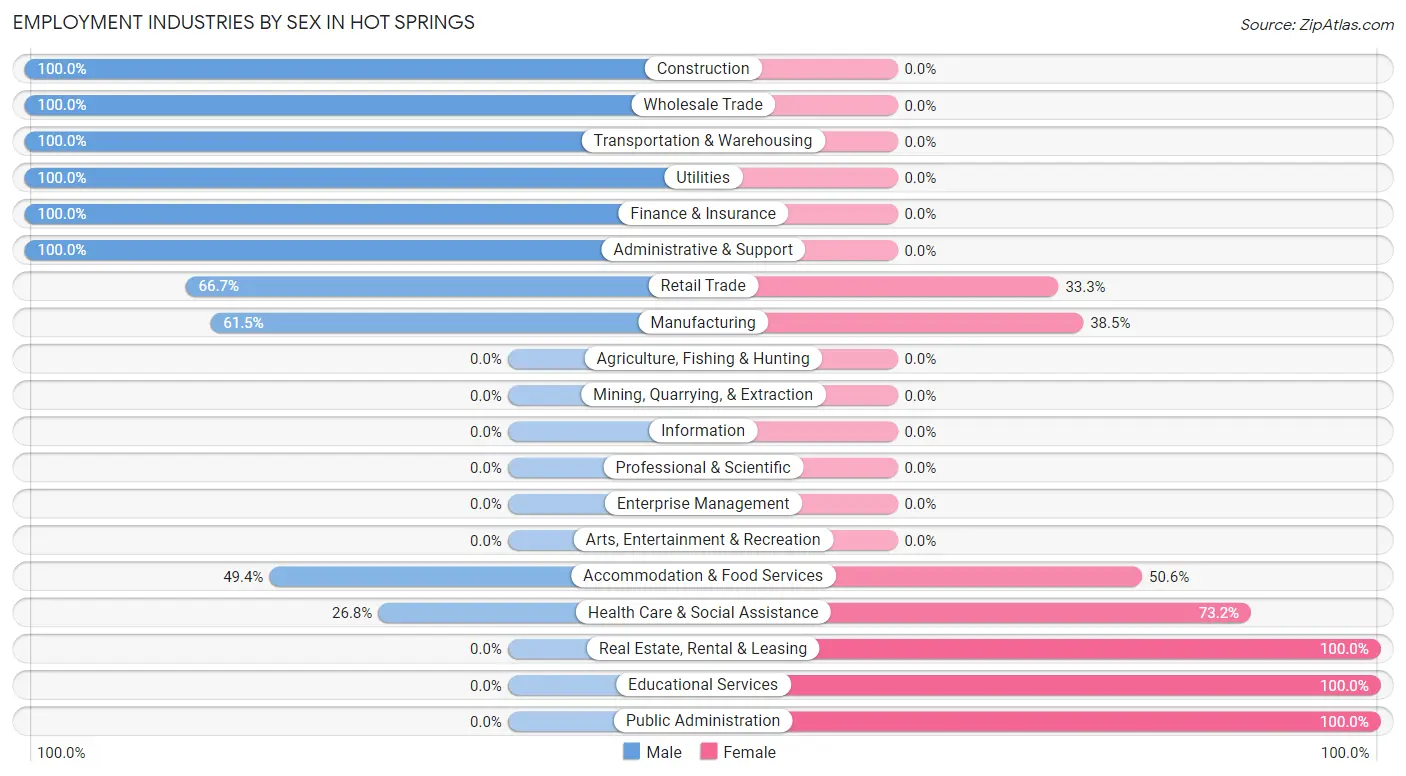
| Industry | Male | Female |
| Agriculture, Fishing & Hunting | 0 (0.0%) | 0 (0.0%) |
| Mining, Quarrying, & Extraction | 0 (0.0%) | 0 (0.0%) |
| Construction | 22 (100.0%) | 0 (0.0%) |
| Manufacturing | 8 (61.5%) | 5 (38.5%) |
| Wholesale Trade | 1 (100.0%) | 0 (0.0%) |
| Retail Trade | 6 (66.7%) | 3 (33.3%) |
| Transportation & Warehousing | 5 (100.0%) | 0 (0.0%) |
| Utilities | 43 (100.0%) | 0 (0.0%) |
| Information | 0 (0.0%) | 0 (0.0%) |
| Finance & Insurance | 2 (100.0%) | 0 (0.0%) |
| Real Estate, Rental & Leasing | 0 (0.0%) | 10 (100.0%) |
| Professional & Scientific | 0 (0.0%) | 0 (0.0%) |
| Enterprise Management | 0 (0.0%) | 0 (0.0%) |
| Administrative & Support | 5 (100.0%) | 0 (0.0%) |
| Educational Services | 0 (0.0%) | 8 (100.0%) |
| Health Care & Social Assistance | 11 (26.8%) | 30 (73.2%) |
| Arts, Entertainment & Recreation | 0 (0.0%) | 0 (0.0%) |
| Accommodation & Food Services | 39 (49.4%) | 40 (50.6%) |
| Public Administration | 0 (0.0%) | 15 (100.0%) |
| Total | 142 (55.5%) | 114 (44.5%) |
Education in Hot Springs
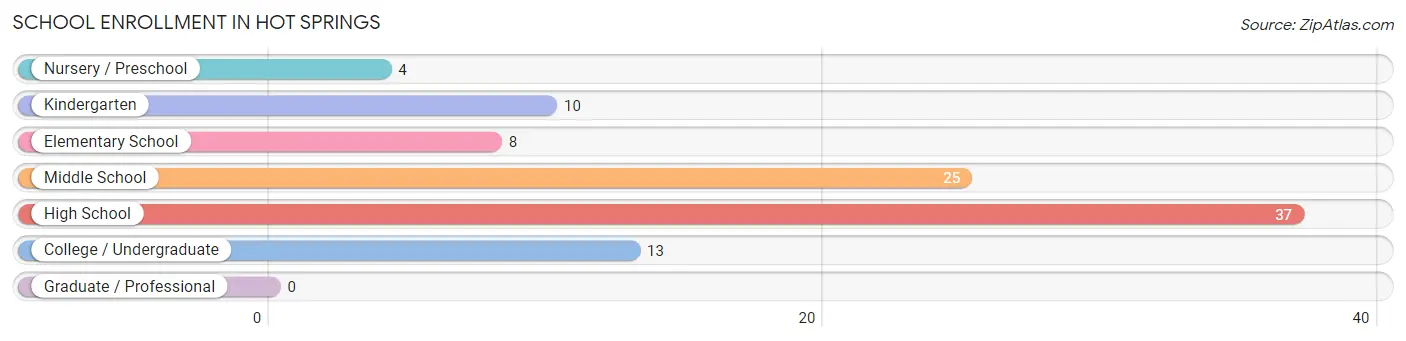
School Enrollment in Hot Springs
The most common levels of schooling among the 97 students in Hot Springs are high school (37 | 38.1%), middle school (25 | 25.8%), and college / undergraduate (13 | 13.4%).
| School Level | # Students | % Students |
| Nursery / Preschool | 4 | 4.1% |
| Kindergarten | 10 | 10.3% |
| Elementary School | 8 | 8.3% |
| Middle School | 25 | 25.8% |
| High School | 37 | 38.1% |
| College / Undergraduate | 13 | 13.4% |
| Graduate / Professional | 0 | 0.0% |
| Total | 97 | 100.0% |
School Enrollment by Age by Funding Source in Hot Springs
Out of a total of 97 students who are enrolled in schools in Hot Springs, 9 (9.3%) attend a private institution, while the remaining 88 (90.7%) are enrolled in public schools. The age group of 5 to 9 year old has the highest likelihood of being enrolled in private schools, with 3 (13.6% in the age bracket) enrolled. Conversely, the age group of 18 to 19 year olds has the lowest likelihood of being enrolled in a private school, with 8 (100.0% in the age bracket) attending a public institution.
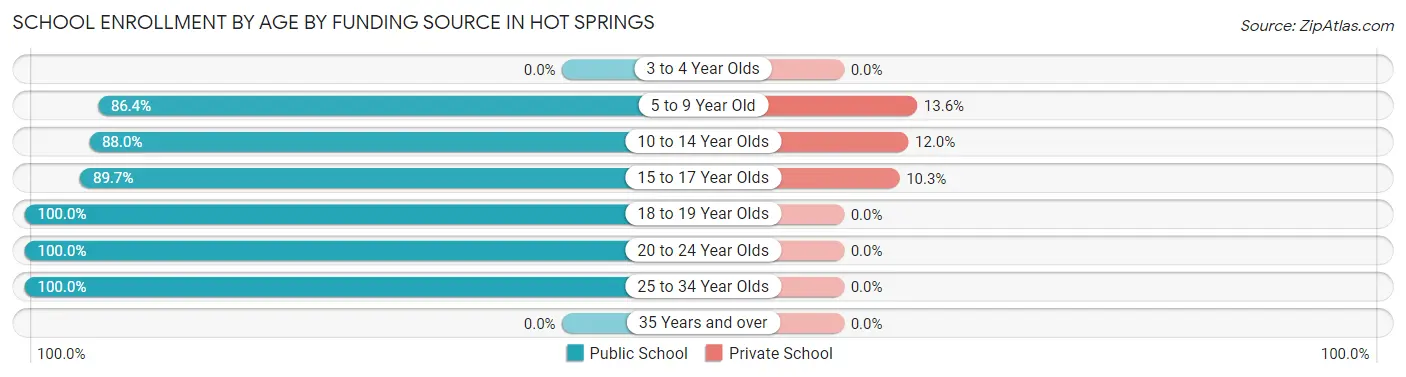
| Age Bracket | Public School | Private School |
| 3 to 4 Year Olds | 0 (0.0%) | 0 (0.0%) |
| 5 to 9 Year Old | 19 (86.4%) | 3 (13.6%) |
| 10 to 14 Year Olds | 22 (88.0%) | 3 (12.0%) |
| 15 to 17 Year Olds | 26 (89.7%) | 3 (10.3%) |
| 18 to 19 Year Olds | 8 (100.0%) | 0 (0.0%) |
| 20 to 24 Year Olds | 8 (100.0%) | 0 (0.0%) |
| 25 to 34 Year Olds | 5 (100.0%) | 0 (0.0%) |
| 35 Years and over | 0 (0.0%) | 0 (0.0%) |
| Total | 88 (90.7%) | 9 (9.3%) |
Educational Attainment by Field of Study in Hot Springs
Physical & health sciences (28 | 25.5%), arts & humanities (16 | 14.5%), communications (14 | 12.7%), liberal arts & history (12 | 10.9%), and bio, nature & agricultural (11 | 10.0%) are the most common fields of study among 110 individuals in Hot Springs who have obtained a bachelor's degree or higher.
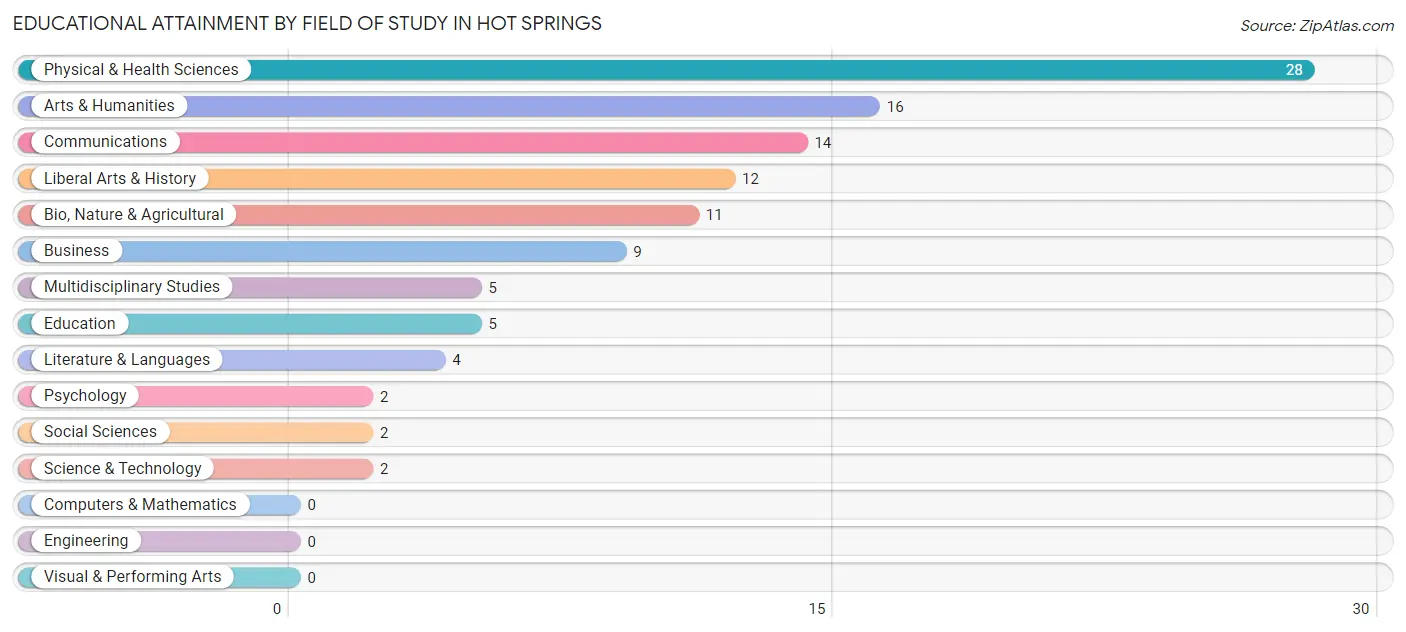
| Field of Study | # Graduates | % Graduates |
| Computers & Mathematics | 0 | 0.0% |
| Bio, Nature & Agricultural | 11 | 10.0% |
| Physical & Health Sciences | 28 | 25.5% |
| Psychology | 2 | 1.8% |
| Social Sciences | 2 | 1.8% |
| Engineering | 0 | 0.0% |
| Multidisciplinary Studies | 5 | 4.5% |
| Science & Technology | 2 | 1.8% |
| Business | 9 | 8.2% |
| Education | 5 | 4.5% |
| Literature & Languages | 4 | 3.6% |
| Liberal Arts & History | 12 | 10.9% |
| Visual & Performing Arts | 0 | 0.0% |
| Communications | 14 | 12.7% |
| Arts & Humanities | 16 | 14.5% |
| Total | 110 | 100.0% |
Transportation & Commute in Hot Springs
Vehicle Availability by Sex in Hot Springs
The most prevalent vehicle ownership categories in Hot Springs are males with 3 vehicles (44, accounting for 31.0%) and females with 3 vehicles (13, making up 43.6%).
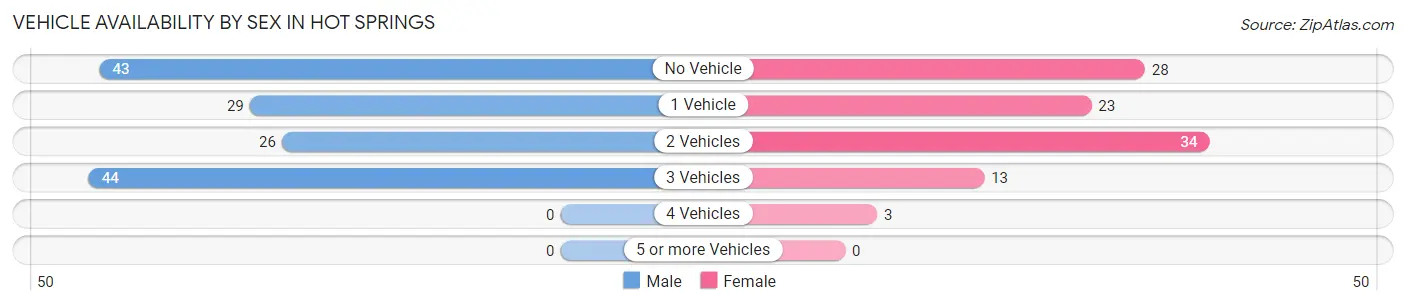
| Vehicles Available | Male | Female |
| No Vehicle | 43 (30.3%) | 28 (27.7%) |
| 1 Vehicle | 29 (20.4%) | 23 (22.8%) |
| 2 Vehicles | 26 (18.3%) | 34 (33.7%) |
| 3 Vehicles | 44 (31.0%) | 13 (12.9%) |
| 4 Vehicles | 0 (0.0%) | 3 (3.0%) |
| 5 or more Vehicles | 0 (0.0%) | 0 (0.0%) |
| Total | 142 (100.0%) | 101 (100.0%) |
Commute Time in Hot Springs
The most frequently occuring commute durations in Hot Springs are less than 5 minutes (55 commuters, 25.2%), 5 to 9 minutes (55 commuters, 25.2%), and 45 to 59 minutes (41 commuters, 18.8%).
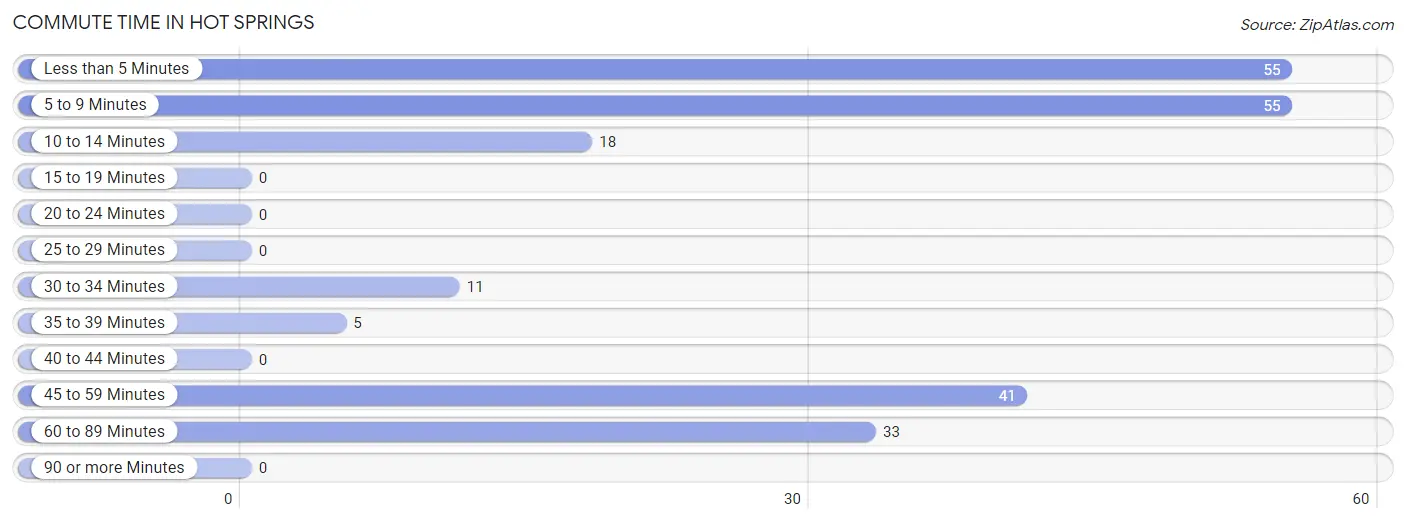
| Commute Time | # Commuters | % Commuters |
| Less than 5 Minutes | 55 | 25.2% |
| 5 to 9 Minutes | 55 | 25.2% |
| 10 to 14 Minutes | 18 | 8.3% |
| 15 to 19 Minutes | 0 | 0.0% |
| 20 to 24 Minutes | 0 | 0.0% |
| 25 to 29 Minutes | 0 | 0.0% |
| 30 to 34 Minutes | 11 | 5.1% |
| 35 to 39 Minutes | 5 | 2.3% |
| 40 to 44 Minutes | 0 | 0.0% |
| 45 to 59 Minutes | 41 | 18.8% |
| 60 to 89 Minutes | 33 | 15.1% |
| 90 or more Minutes | 0 | 0.0% |
Commute Time by Sex in Hot Springs
The most common commute times in Hot Springs are less than 5 minutes (47 commuters, 33.8%) for males and 60 to 89 minutes (33 commuters, 41.8%) for females.
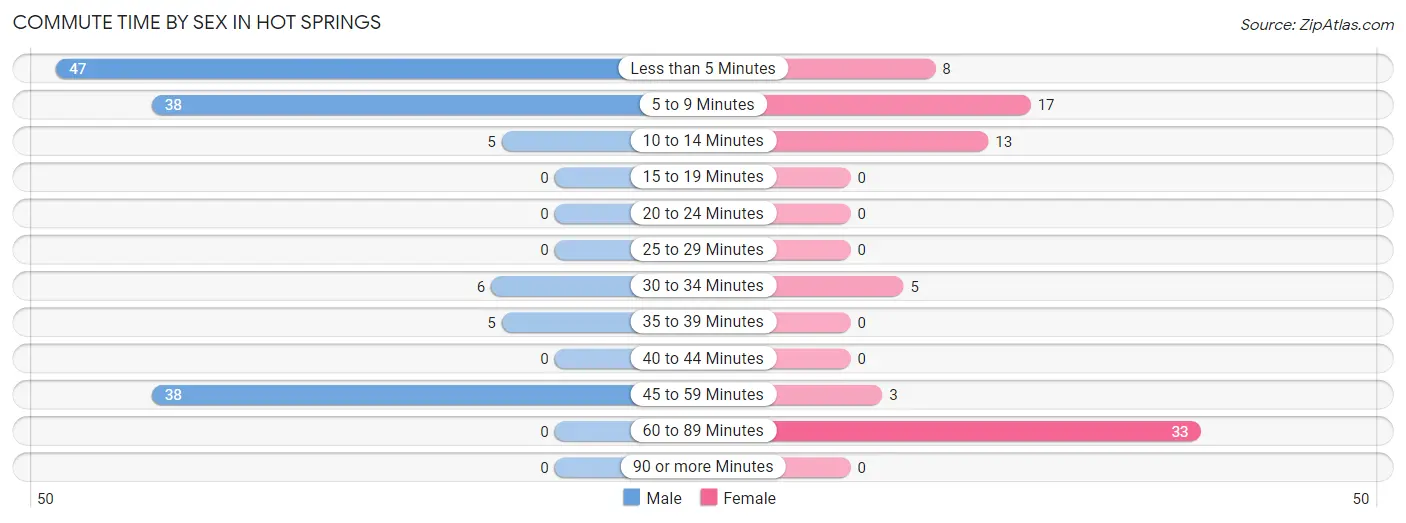
| Commute Time | Male | Female |
| Less than 5 Minutes | 47 (33.8%) | 8 (10.1%) |
| 5 to 9 Minutes | 38 (27.3%) | 17 (21.5%) |
| 10 to 14 Minutes | 5 (3.6%) | 13 (16.5%) |
| 15 to 19 Minutes | 0 (0.0%) | 0 (0.0%) |
| 20 to 24 Minutes | 0 (0.0%) | 0 (0.0%) |
| 25 to 29 Minutes | 0 (0.0%) | 0 (0.0%) |
| 30 to 34 Minutes | 6 (4.3%) | 5 (6.3%) |
| 35 to 39 Minutes | 5 (3.6%) | 0 (0.0%) |
| 40 to 44 Minutes | 0 (0.0%) | 0 (0.0%) |
| 45 to 59 Minutes | 38 (27.3%) | 3 (3.8%) |
| 60 to 89 Minutes | 0 (0.0%) | 33 (41.8%) |
| 90 or more Minutes | 0 (0.0%) | 0 (0.0%) |
Time of Departure to Work by Sex in Hot Springs
The most frequent times of departure to work in Hot Springs are 6:00 AM to 6:29 AM (44, 31.7%) for males and 6:30 AM to 6:59 AM (31, 39.2%) for females.
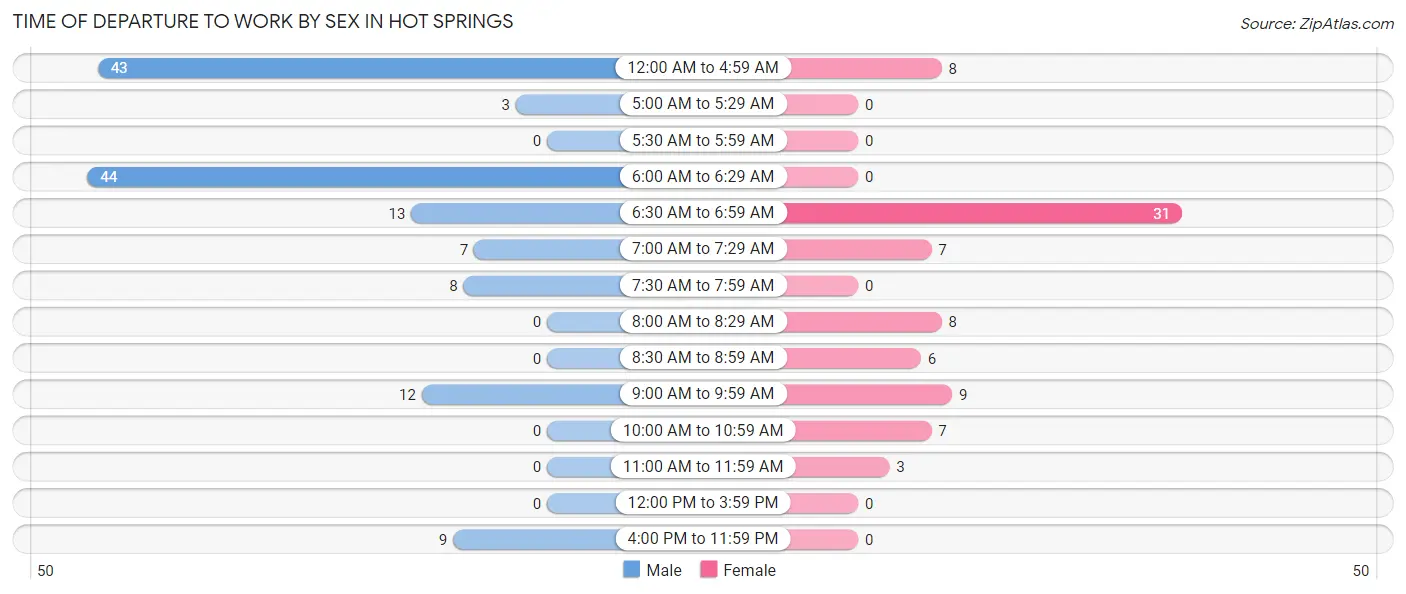
| Time of Departure | Male | Female |
| 12:00 AM to 4:59 AM | 43 (30.9%) | 8 (10.1%) |
| 5:00 AM to 5:29 AM | 3 (2.2%) | 0 (0.0%) |
| 5:30 AM to 5:59 AM | 0 (0.0%) | 0 (0.0%) |
| 6:00 AM to 6:29 AM | 44 (31.7%) | 0 (0.0%) |
| 6:30 AM to 6:59 AM | 13 (9.3%) | 31 (39.2%) |
| 7:00 AM to 7:29 AM | 7 (5.0%) | 7 (8.9%) |
| 7:30 AM to 7:59 AM | 8 (5.8%) | 0 (0.0%) |
| 8:00 AM to 8:29 AM | 0 (0.0%) | 8 (10.1%) |
| 8:30 AM to 8:59 AM | 0 (0.0%) | 6 (7.6%) |
| 9:00 AM to 9:59 AM | 12 (8.6%) | 9 (11.4%) |
| 10:00 AM to 10:59 AM | 0 (0.0%) | 7 (8.9%) |
| 11:00 AM to 11:59 AM | 0 (0.0%) | 3 (3.8%) |
| 12:00 PM to 3:59 PM | 0 (0.0%) | 0 (0.0%) |
| 4:00 PM to 11:59 PM | 9 (6.5%) | 0 (0.0%) |
| Total | 139 (100.0%) | 79 (100.0%) |
Housing Occupancy in Hot Springs
Occupancy by Ownership in Hot Springs
Of the total 204 dwellings in Hot Springs, owner-occupied units account for 101 (49.5%), while renter-occupied units make up 103 (50.5%).
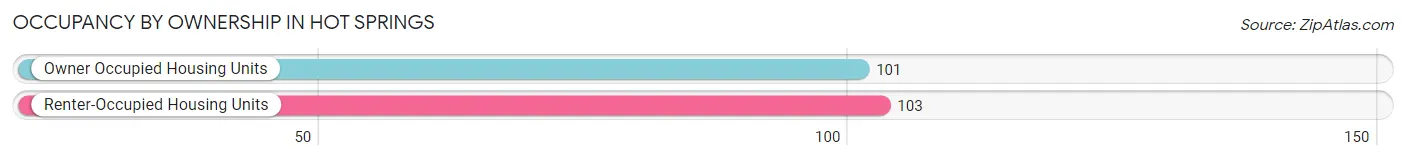
| Occupancy | # Housing Units | % Housing Units |
| Owner Occupied Housing Units | 101 | 49.5% |
| Renter-Occupied Housing Units | 103 | 50.5% |
| Total Occupied Housing Units | 204 | 100.0% |
Occupancy by Household Size in Hot Springs
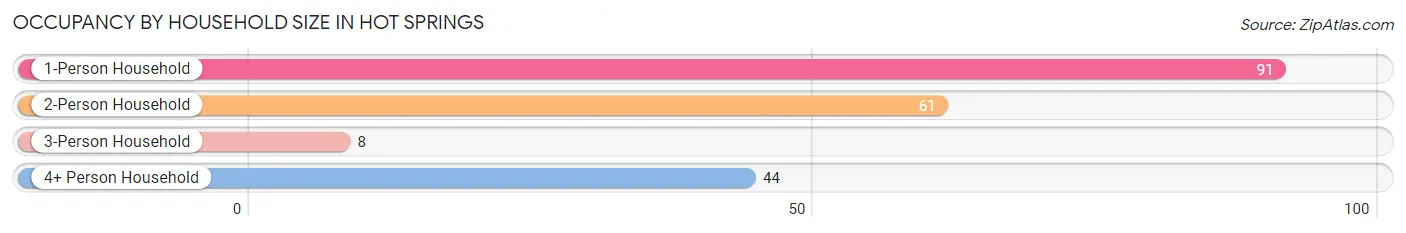
| Household Size | # Housing Units | % Housing Units |
| 1-Person Household | 91 | 44.6% |
| 2-Person Household | 61 | 29.9% |
| 3-Person Household | 8 | 3.9% |
| 4+ Person Household | 44 | 21.6% |
| Total Housing Units | 204 | 100.0% |
Occupancy by Ownership by Household Size in Hot Springs
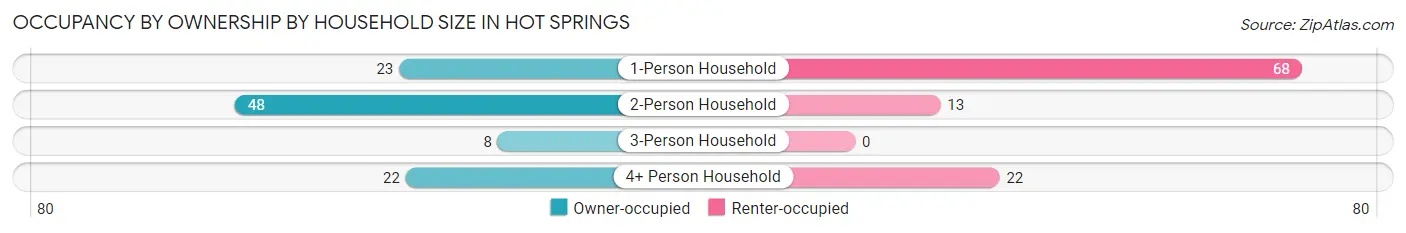
| Household Size | Owner-occupied | Renter-occupied |
| 1-Person Household | 23 (25.3%) | 68 (74.7%) |
| 2-Person Household | 48 (78.7%) | 13 (21.3%) |
| 3-Person Household | 8 (100.0%) | 0 (0.0%) |
| 4+ Person Household | 22 (50.0%) | 22 (50.0%) |
| Total Housing Units | 101 (49.5%) | 103 (50.5%) |
Occupancy by Educational Attainment in Hot Springs
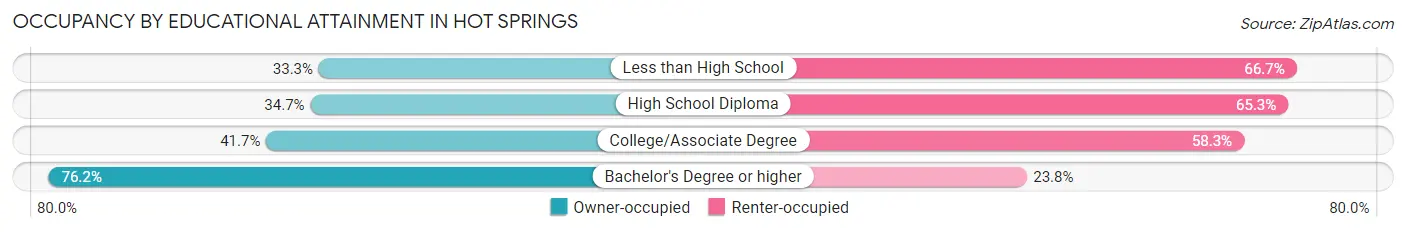
| Household Size | Owner-occupied | Renter-occupied |
| Less than High School | 2 (33.3%) | 4 (66.7%) |
| High School Diploma | 26 (34.7%) | 49 (65.3%) |
| College/Associate Degree | 25 (41.7%) | 35 (58.3%) |
| Bachelor's Degree or higher | 48 (76.2%) | 15 (23.8%) |
Occupancy by Age of Householder in Hot Springs
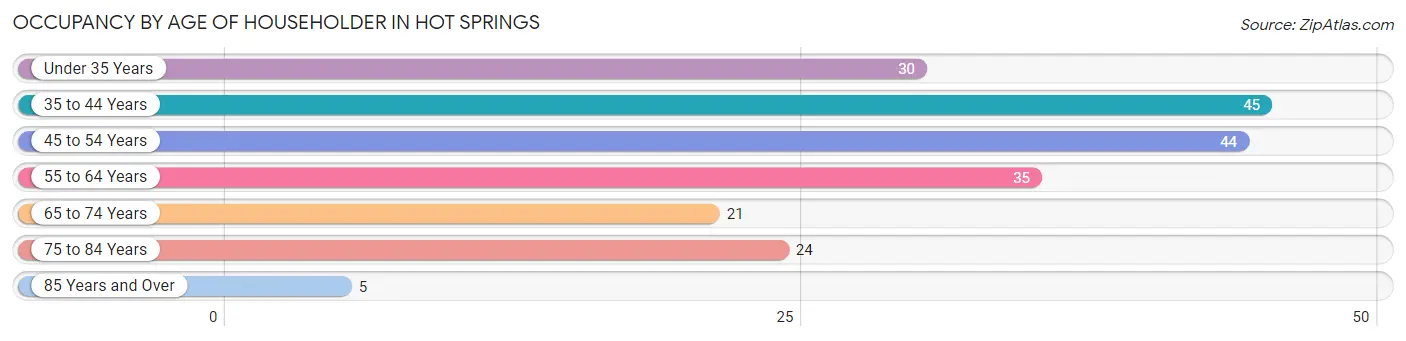
| Age Bracket | # Households | % Households |
| Under 35 Years | 30 | 14.7% |
| 35 to 44 Years | 45 | 22.1% |
| 45 to 54 Years | 44 | 21.6% |
| 55 to 64 Years | 35 | 17.2% |
| 65 to 74 Years | 21 | 10.3% |
| 75 to 84 Years | 24 | 11.8% |
| 85 Years and Over | 5 | 2.5% |
| Total | 204 | 100.0% |
Housing Finances in Hot Springs
Median Income by Occupancy in Hot Springs
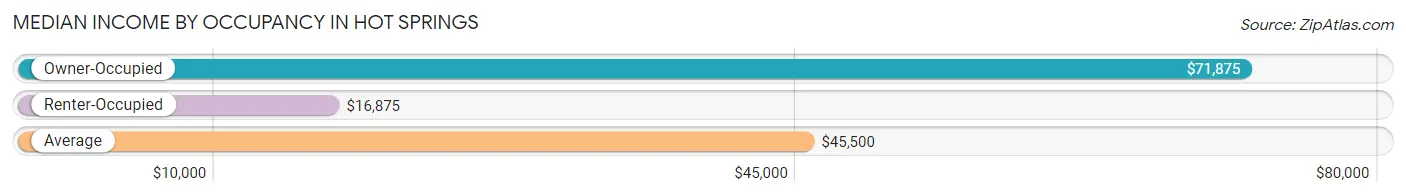
| Occupancy Type | # Households | Median Income |
| Owner-Occupied | 101 (49.5%) | $71,875 |
| Renter-Occupied | 103 (50.5%) | $16,875 |
| Average | 204 (100.0%) | $45,500 |
Occupancy by Householder Income Bracket in Hot Springs
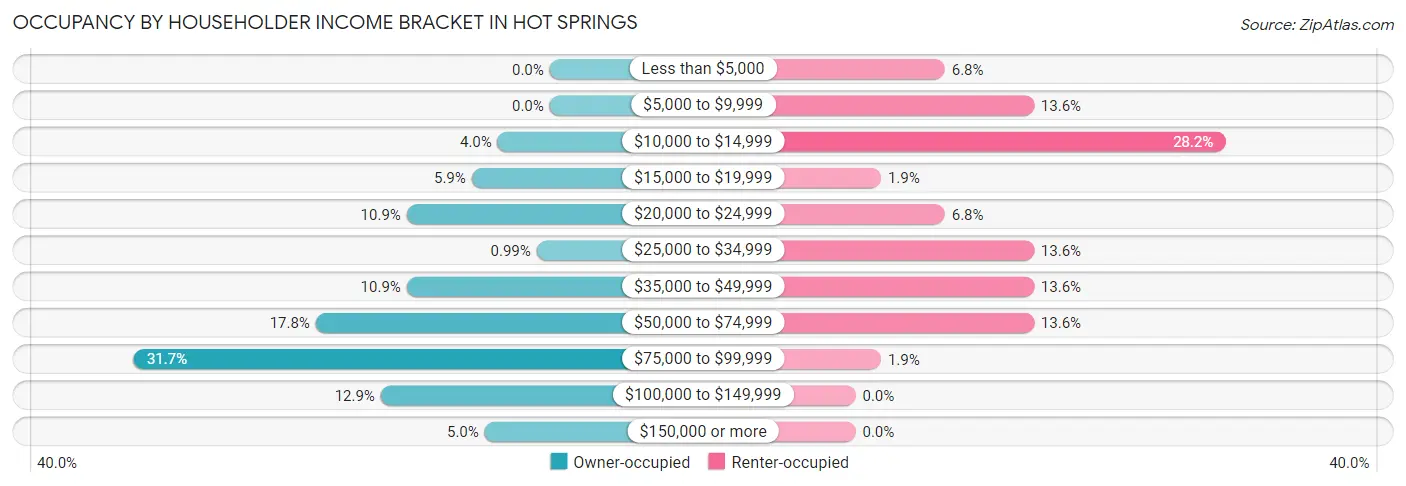
| Income Bracket | Owner-occupied | Renter-occupied |
| Less than $5,000 | 0 (0.0%) | 7 (6.8%) |
| $5,000 to $9,999 | 0 (0.0%) | 14 (13.6%) |
| $10,000 to $14,999 | 4 (4.0%) | 29 (28.2%) |
| $15,000 to $19,999 | 6 (5.9%) | 2 (1.9%) |
| $20,000 to $24,999 | 11 (10.9%) | 7 (6.8%) |
| $25,000 to $34,999 | 1 (1.0%) | 14 (13.6%) |
| $35,000 to $49,999 | 11 (10.9%) | 14 (13.6%) |
| $50,000 to $74,999 | 18 (17.8%) | 14 (13.6%) |
| $75,000 to $99,999 | 32 (31.7%) | 2 (1.9%) |
| $100,000 to $149,999 | 13 (12.9%) | 0 (0.0%) |
| $150,000 or more | 5 (5.0%) | 0 (0.0%) |
| Total | 101 (100.0%) | 103 (100.0%) |
Monthly Housing Cost Tiers in Hot Springs
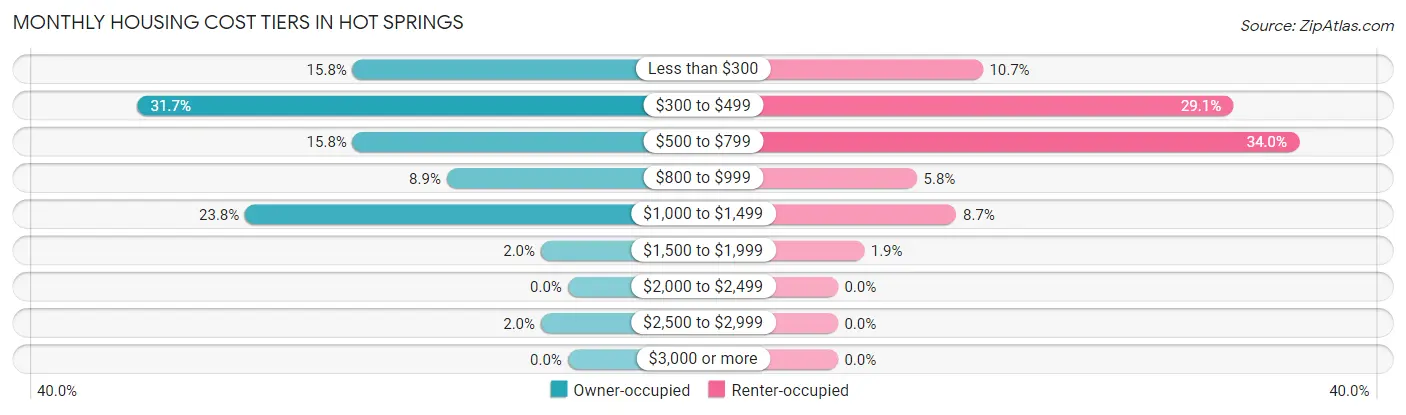
| Monthly Cost | Owner-occupied | Renter-occupied |
| Less than $300 | 16 (15.8%) | 11 (10.7%) |
| $300 to $499 | 32 (31.7%) | 30 (29.1%) |
| $500 to $799 | 16 (15.8%) | 35 (34.0%) |
| $800 to $999 | 9 (8.9%) | 6 (5.8%) |
| $1,000 to $1,499 | 24 (23.8%) | 9 (8.7%) |
| $1,500 to $1,999 | 2 (2.0%) | 2 (1.9%) |
| $2,000 to $2,499 | 0 (0.0%) | 0 (0.0%) |
| $2,500 to $2,999 | 2 (2.0%) | 0 (0.0%) |
| $3,000 or more | 0 (0.0%) | 0 (0.0%) |
| Total | 101 (100.0%) | 103 (100.0%) |
Physical Housing Characteristics in Hot Springs
Housing Structures in Hot Springs
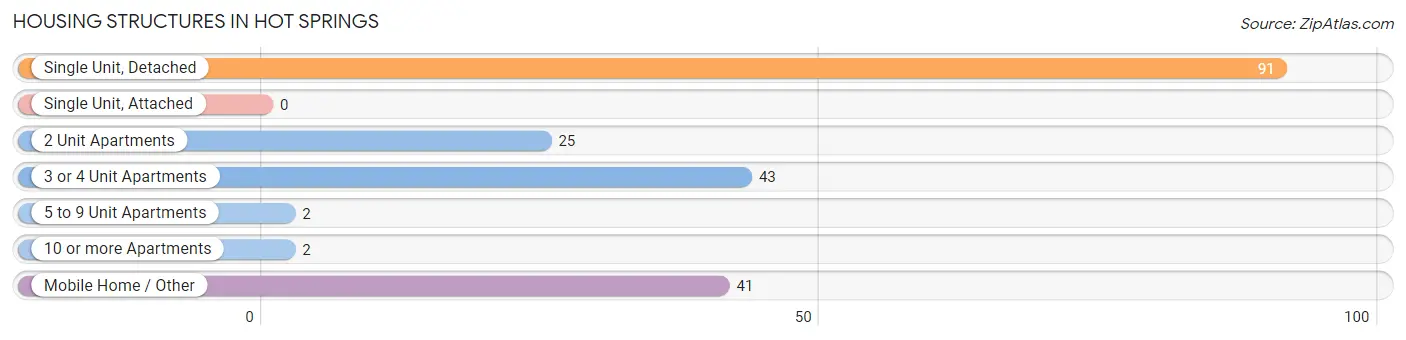
| Structure Type | # Housing Units | % Housing Units |
| Single Unit, Detached | 91 | 44.6% |
| Single Unit, Attached | 0 | 0.0% |
| 2 Unit Apartments | 25 | 12.2% |
| 3 or 4 Unit Apartments | 43 | 21.1% |
| 5 to 9 Unit Apartments | 2 | 1.0% |
| 10 or more Apartments | 2 | 1.0% |
| Mobile Home / Other | 41 | 20.1% |
| Total | 204 | 100.0% |
Housing Structures by Occupancy in Hot Springs
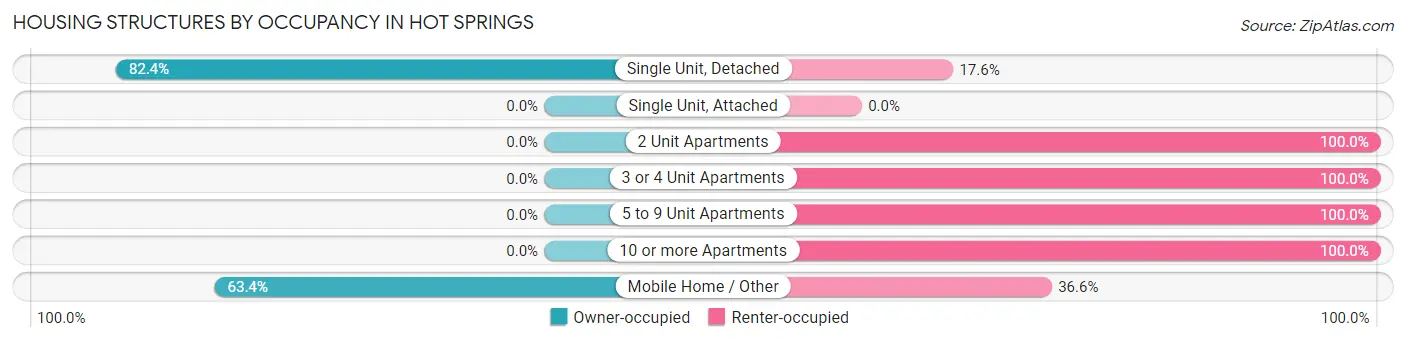
| Structure Type | Owner-occupied | Renter-occupied |
| Single Unit, Detached | 75 (82.4%) | 16 (17.6%) |
| Single Unit, Attached | 0 (0.0%) | 0 (0.0%) |
| 2 Unit Apartments | 0 (0.0%) | 25 (100.0%) |
| 3 or 4 Unit Apartments | 0 (0.0%) | 43 (100.0%) |
| 5 to 9 Unit Apartments | 0 (0.0%) | 2 (100.0%) |
| 10 or more Apartments | 0 (0.0%) | 2 (100.0%) |
| Mobile Home / Other | 26 (63.4%) | 15 (36.6%) |
| Total | 101 (49.5%) | 103 (50.5%) |
Housing Structures by Number of Rooms in Hot Springs
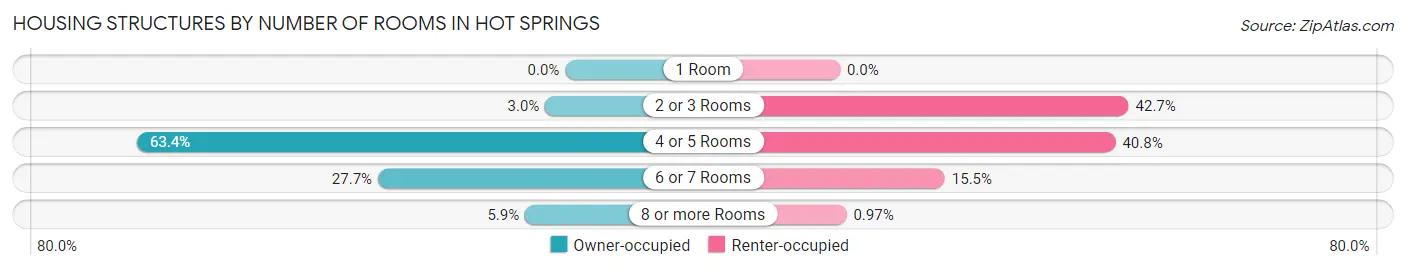
| Number of Rooms | Owner-occupied | Renter-occupied |
| 1 Room | 0 (0.0%) | 0 (0.0%) |
| 2 or 3 Rooms | 3 (3.0%) | 44 (42.7%) |
| 4 or 5 Rooms | 64 (63.4%) | 42 (40.8%) |
| 6 or 7 Rooms | 28 (27.7%) | 16 (15.5%) |
| 8 or more Rooms | 6 (5.9%) | 1 (1.0%) |
| Total | 101 (100.0%) | 103 (100.0%) |
Housing Structure by Heating Type in Hot Springs
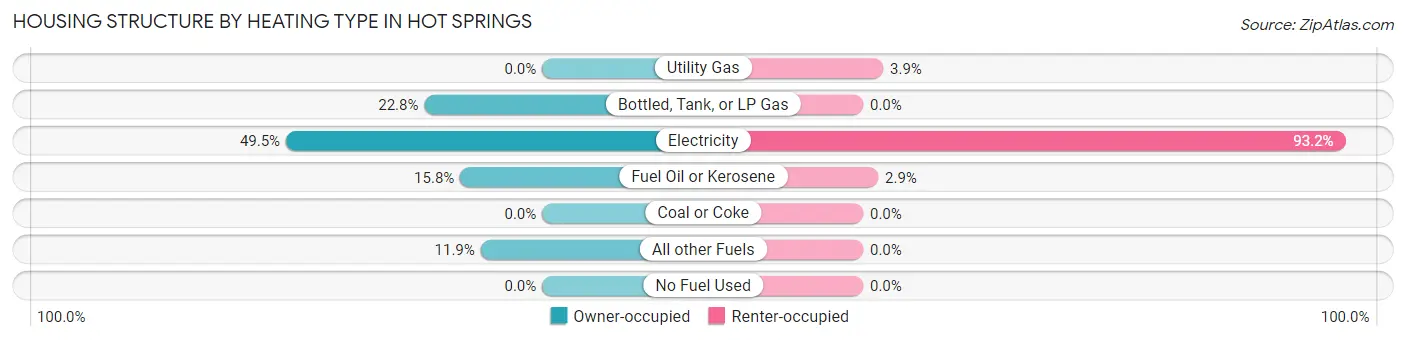
| Heating Type | Owner-occupied | Renter-occupied |
| Utility Gas | 0 (0.0%) | 4 (3.9%) |
| Bottled, Tank, or LP Gas | 23 (22.8%) | 0 (0.0%) |
| Electricity | 50 (49.5%) | 96 (93.2%) |
| Fuel Oil or Kerosene | 16 (15.8%) | 3 (2.9%) |
| Coal or Coke | 0 (0.0%) | 0 (0.0%) |
| All other Fuels | 12 (11.9%) | 0 (0.0%) |
| No Fuel Used | 0 (0.0%) | 0 (0.0%) |
| Total | 101 (100.0%) | 103 (100.0%) |
Household Vehicle Usage in Hot Springs
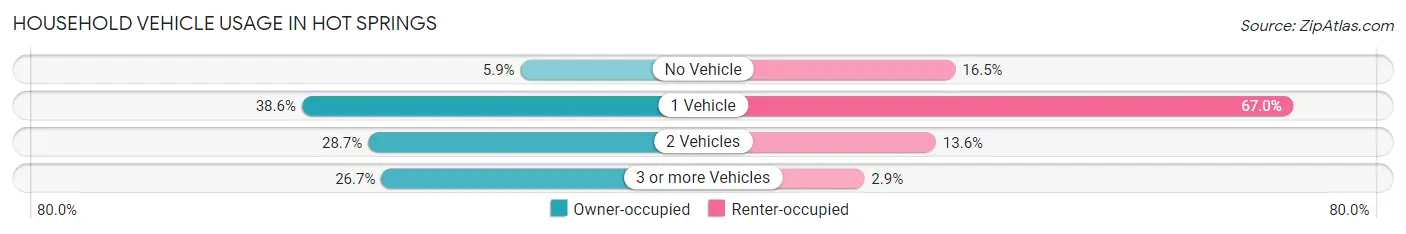
| Vehicles per Household | Owner-occupied | Renter-occupied |
| No Vehicle | 6 (5.9%) | 17 (16.5%) |
| 1 Vehicle | 39 (38.6%) | 69 (67.0%) |
| 2 Vehicles | 29 (28.7%) | 14 (13.6%) |
| 3 or more Vehicles | 27 (26.7%) | 3 (2.9%) |
| Total | 101 (100.0%) | 103 (100.0%) |
Real Estate & Mortgages in Hot Springs
Real Estate and Mortgage Overview in Hot Springs
| Characteristic | Without Mortgage | With Mortgage |
| Housing Units | 59 | 42 |
| Median Property Value | - | - |
| Median Household Income | $68,125 | $5 |
| Monthly Housing Costs | $420 | $0 |
| Real Estate Taxes | $731 | $0 |
Property Value by Mortgage Status in Hot Springs
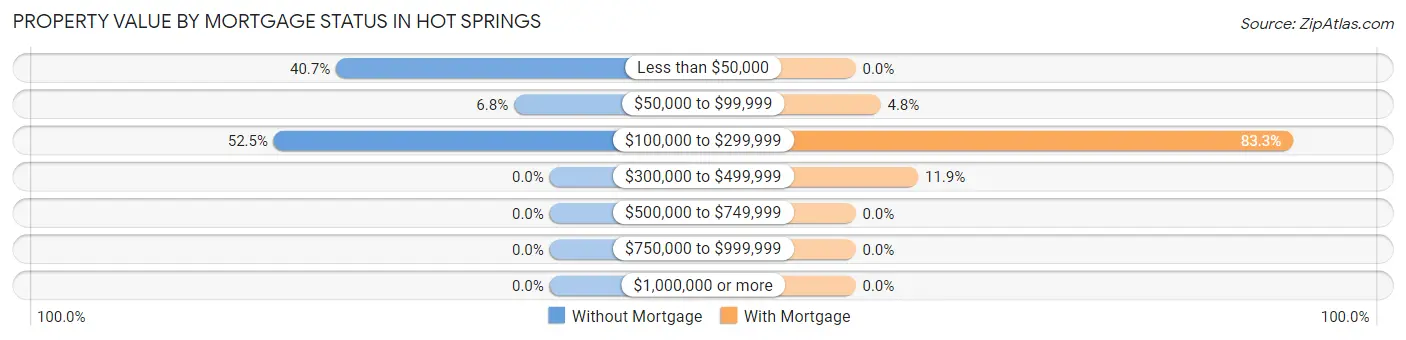
| Property Value | Without Mortgage | With Mortgage |
| Less than $50,000 | 24 (40.7%) | 0 (0.0%) |
| $50,000 to $99,999 | 4 (6.8%) | 2 (4.8%) |
| $100,000 to $299,999 | 31 (52.5%) | 35 (83.3%) |
| $300,000 to $499,999 | 0 (0.0%) | 5 (11.9%) |
| $500,000 to $749,999 | 0 (0.0%) | 0 (0.0%) |
| $750,000 to $999,999 | 0 (0.0%) | 0 (0.0%) |
| $1,000,000 or more | 0 (0.0%) | 0 (0.0%) |
| Total | 59 (100.0%) | 42 (100.0%) |
Household Income by Mortgage Status in Hot Springs
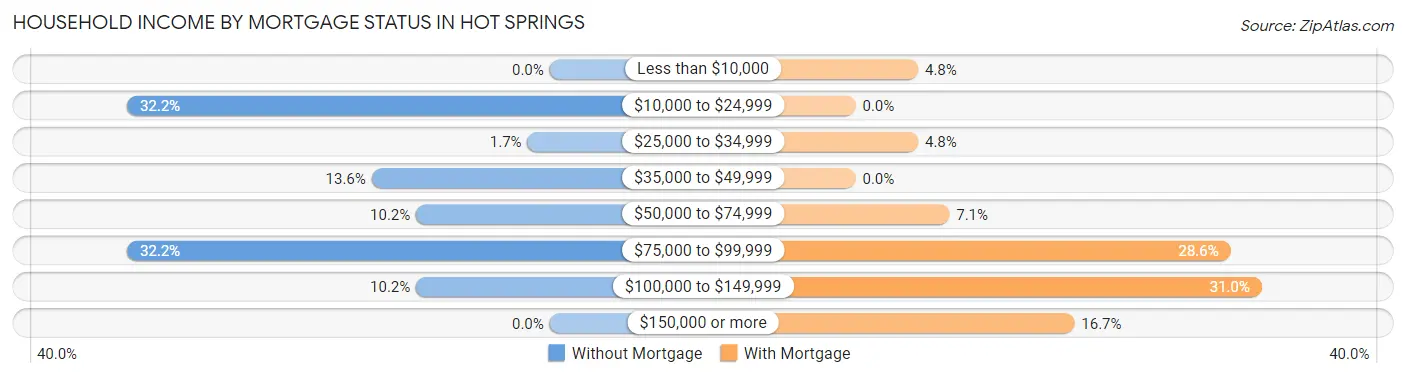
| Household Income | Without Mortgage | With Mortgage |
| Less than $10,000 | 0 (0.0%) | 2 (4.8%) |
| $10,000 to $24,999 | 19 (32.2%) | 0 (0.0%) |
| $25,000 to $34,999 | 1 (1.7%) | 2 (4.8%) |
| $35,000 to $49,999 | 8 (13.6%) | 0 (0.0%) |
| $50,000 to $74,999 | 6 (10.2%) | 3 (7.1%) |
| $75,000 to $99,999 | 19 (32.2%) | 12 (28.6%) |
| $100,000 to $149,999 | 6 (10.2%) | 13 (30.9%) |
| $150,000 or more | 0 (0.0%) | 7 (16.7%) |
| Total | 59 (100.0%) | 42 (100.0%) |
Property Value to Household Income Ratio in Hot Springs
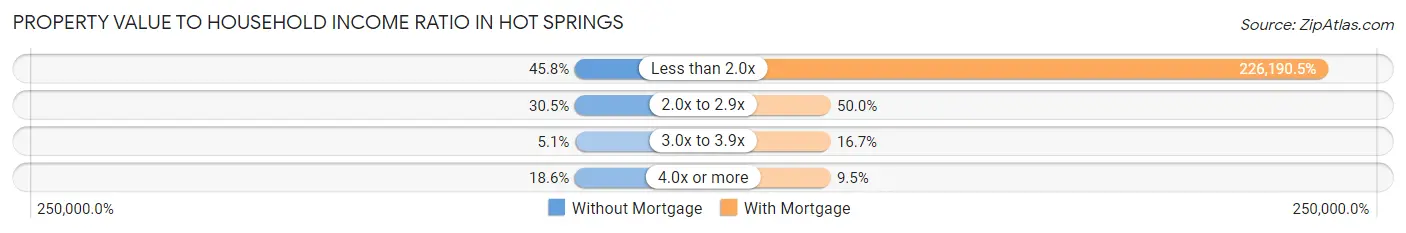
| Value-to-Income Ratio | Without Mortgage | With Mortgage |
| Less than 2.0x | 27 (45.8%) | 95,000 (226,190.5%) |
| 2.0x to 2.9x | 18 (30.5%) | 21 (50.0%) |
| 3.0x to 3.9x | 3 (5.1%) | 7 (16.7%) |
| 4.0x or more | 11 (18.6%) | 4 (9.5%) |
| Total | 59 (100.0%) | 42 (100.0%) |
Real Estate Taxes by Mortgage Status in Hot Springs
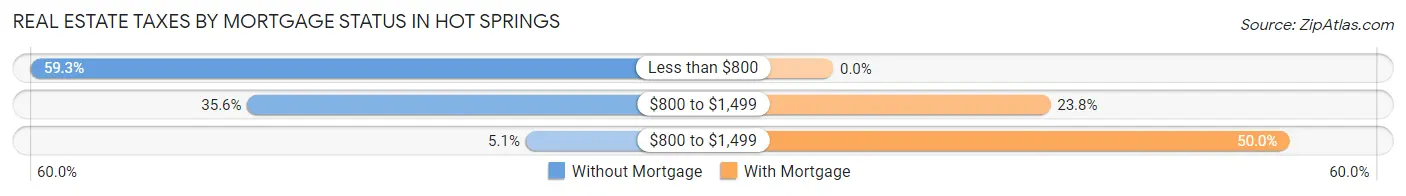
| Property Taxes | Without Mortgage | With Mortgage |
| Less than $800 | 35 (59.3%) | 0 (0.0%) |
| $800 to $1,499 | 21 (35.6%) | 10 (23.8%) |
| $800 to $1,499 | 3 (5.1%) | 21 (50.0%) |
| Total | 59 (100.0%) | 42 (100.0%) |
Health & Disability in Hot Springs
Health Insurance Coverage by Age in Hot Springs
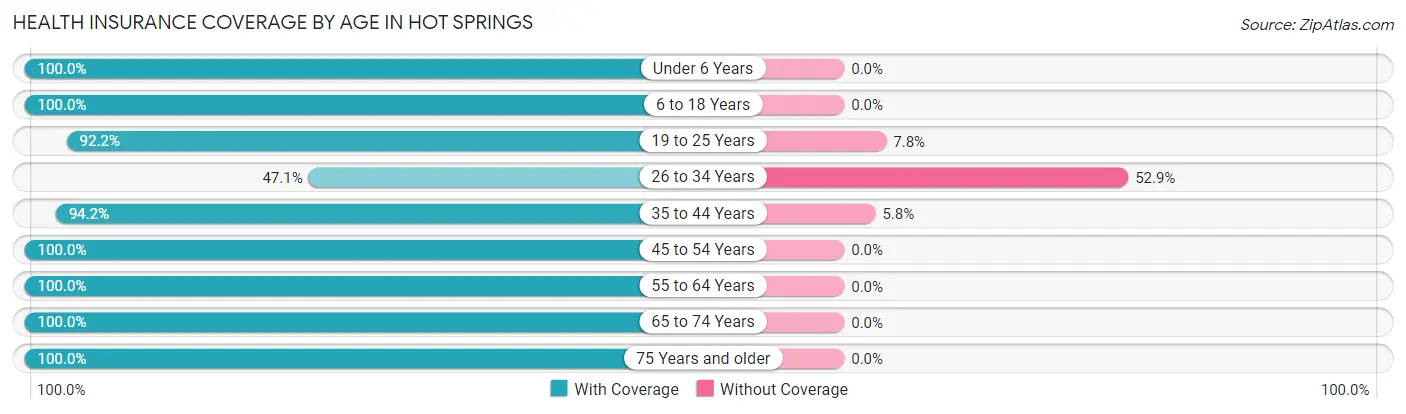
| Age Bracket | With Coverage | Without Coverage |
| Under 6 Years | 28 (100.0%) | 0 (0.0%) |
| 6 to 18 Years | 68 (100.0%) | 0 (0.0%) |
| 19 to 25 Years | 47 (92.2%) | 4 (7.8%) |
| 26 to 34 Years | 16 (47.1%) | 18 (52.9%) |
| 35 to 44 Years | 81 (94.2%) | 5 (5.8%) |
| 45 to 54 Years | 115 (100.0%) | 0 (0.0%) |
| 55 to 64 Years | 50 (100.0%) | 0 (0.0%) |
| 65 to 74 Years | 27 (100.0%) | 0 (0.0%) |
| 75 Years and older | 60 (100.0%) | 0 (0.0%) |
| Total | 492 (94.8%) | 27 (5.2%) |
Health Insurance Coverage by Citizenship Status in Hot Springs
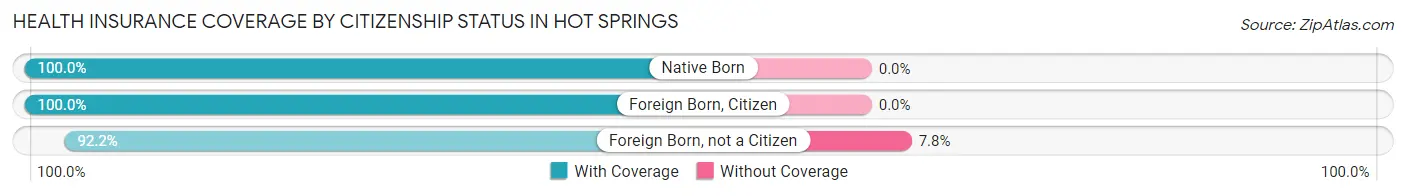
| Citizenship Status | With Coverage | Without Coverage |
| Native Born | 28 (100.0%) | 0 (0.0%) |
| Foreign Born, Citizen | 68 (100.0%) | 0 (0.0%) |
| Foreign Born, not a Citizen | 47 (92.2%) | 4 (7.8%) |
Health Insurance Coverage by Household Income in Hot Springs
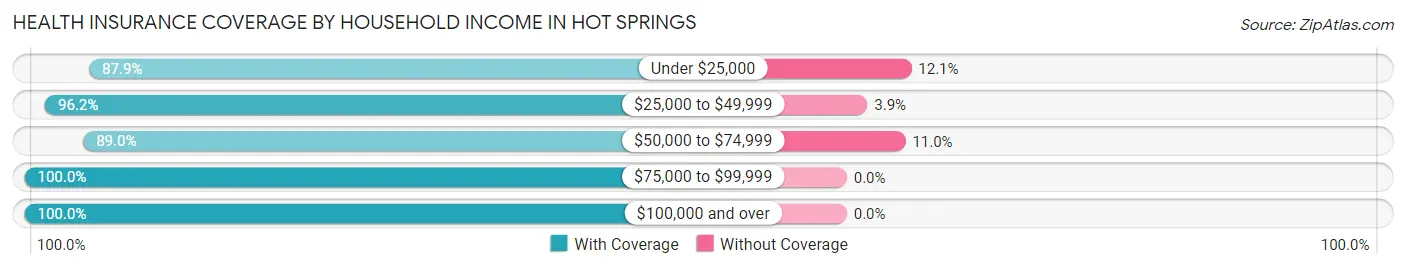
| Household Income | With Coverage | Without Coverage |
| Under $25,000 | 109 (87.9%) | 15 (12.1%) |
| $25,000 to $49,999 | 50 (96.2%) | 2 (3.8%) |
| $50,000 to $74,999 | 81 (89.0%) | 10 (11.0%) |
| $75,000 to $99,999 | 129 (100.0%) | 0 (0.0%) |
| $100,000 and over | 95 (100.0%) | 0 (0.0%) |
Public vs Private Health Insurance Coverage by Age in Hot Springs
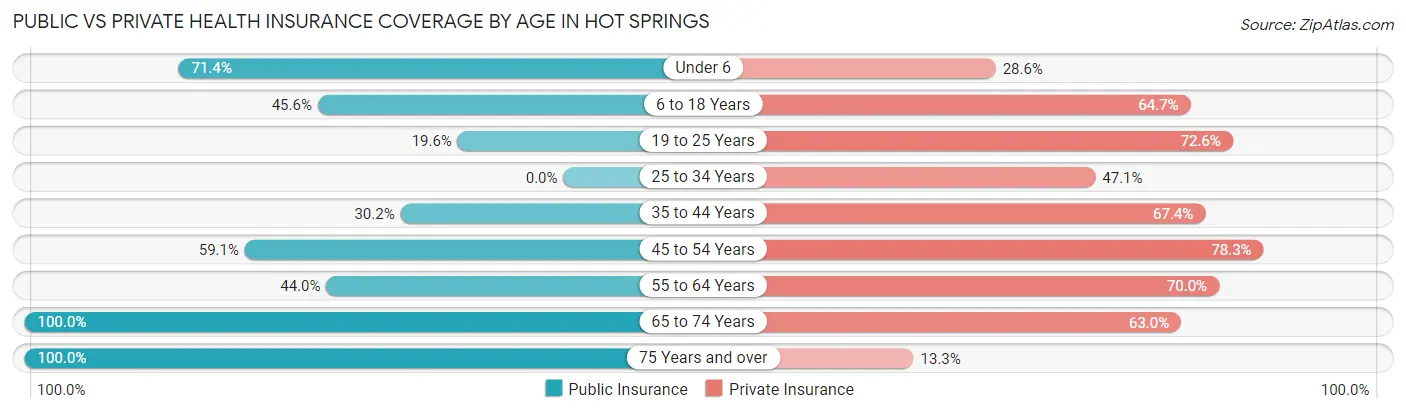
| Age Bracket | Public Insurance | Private Insurance |
| Under 6 | 20 (71.4%) | 8 (28.6%) |
| 6 to 18 Years | 31 (45.6%) | 44 (64.7%) |
| 19 to 25 Years | 10 (19.6%) | 37 (72.6%) |
| 25 to 34 Years | 0 (0.0%) | 16 (47.1%) |
| 35 to 44 Years | 26 (30.2%) | 58 (67.4%) |
| 45 to 54 Years | 68 (59.1%) | 90 (78.3%) |
| 55 to 64 Years | 22 (44.0%) | 35 (70.0%) |
| 65 to 74 Years | 27 (100.0%) | 17 (63.0%) |
| 75 Years and over | 60 (100.0%) | 8 (13.3%) |
| Total | 264 (50.9%) | 313 (60.3%) |
Disability Status by Sex by Age in Hot Springs
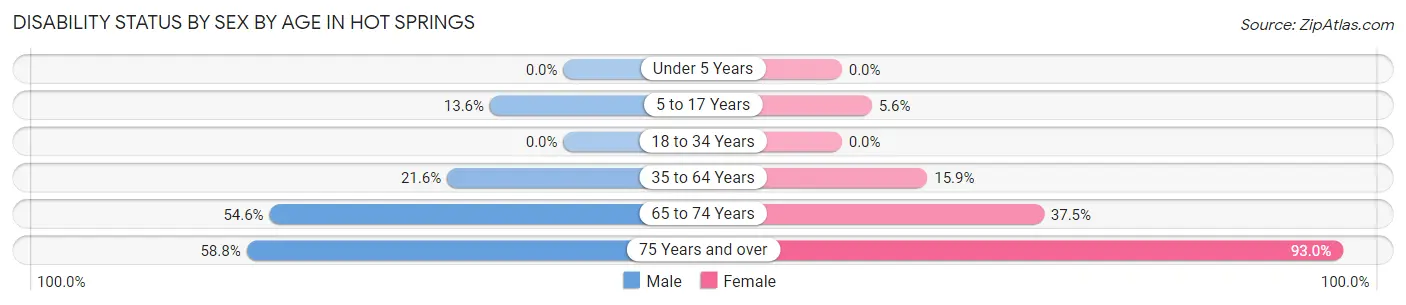
| Age Bracket | Male | Female |
| Under 5 Years | 0 (0.0%) | 0 (0.0%) |
| 5 to 17 Years | 3 (13.6%) | 3 (5.6%) |
| 18 to 34 Years | 0 (0.0%) | 0 (0.0%) |
| 35 to 64 Years | 27 (21.6%) | 20 (15.9%) |
| 65 to 74 Years | 6 (54.5%) | 6 (37.5%) |
| 75 Years and over | 10 (58.8%) | 40 (93.0%) |
Disability Class by Sex by Age in Hot Springs
Disability Class: Hearing Difficulty
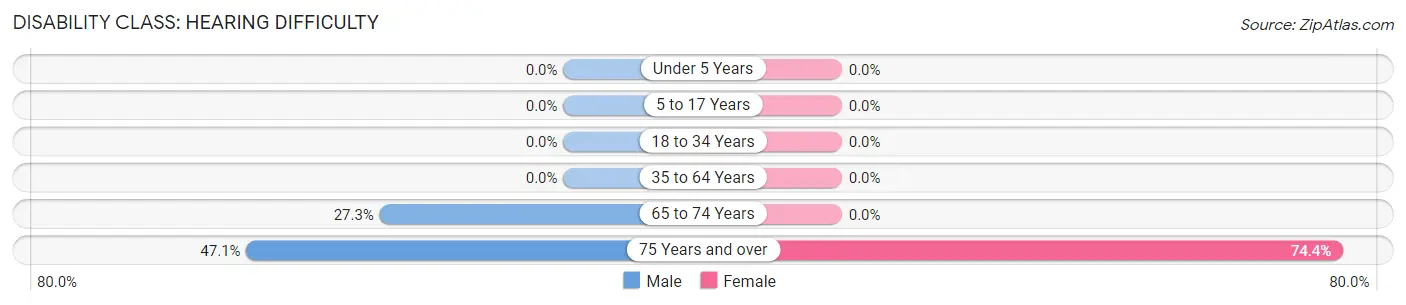
| Age Bracket | Male | Female |
| Under 5 Years | 0 (0.0%) | 0 (0.0%) |
| 5 to 17 Years | 0 (0.0%) | 0 (0.0%) |
| 18 to 34 Years | 0 (0.0%) | 0 (0.0%) |
| 35 to 64 Years | 0 (0.0%) | 0 (0.0%) |
| 65 to 74 Years | 3 (27.3%) | 0 (0.0%) |
| 75 Years and over | 8 (47.1%) | 32 (74.4%) |
Disability Class: Vision Difficulty
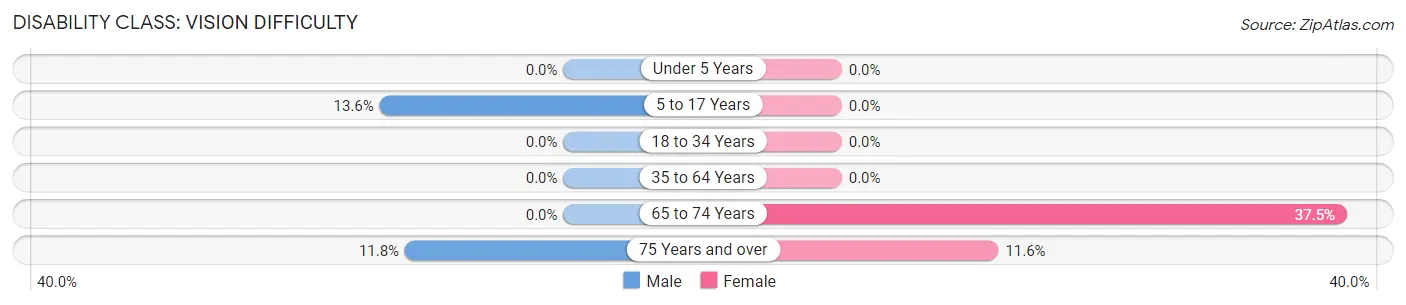
| Age Bracket | Male | Female |
| Under 5 Years | 0 (0.0%) | 0 (0.0%) |
| 5 to 17 Years | 3 (13.6%) | 0 (0.0%) |
| 18 to 34 Years | 0 (0.0%) | 0 (0.0%) |
| 35 to 64 Years | 0 (0.0%) | 0 (0.0%) |
| 65 to 74 Years | 0 (0.0%) | 6 (37.5%) |
| 75 Years and over | 2 (11.8%) | 5 (11.6%) |
Disability Class: Cognitive Difficulty
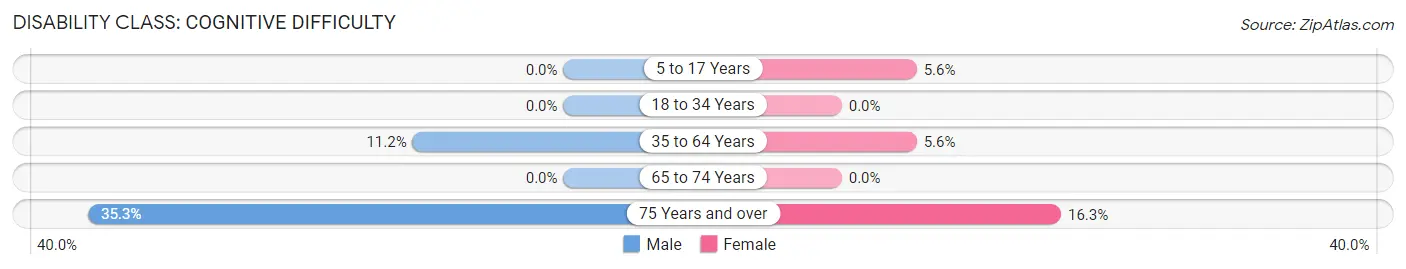
| Age Bracket | Male | Female |
| 5 to 17 Years | 0 (0.0%) | 3 (5.6%) |
| 18 to 34 Years | 0 (0.0%) | 0 (0.0%) |
| 35 to 64 Years | 14 (11.2%) | 7 (5.6%) |
| 65 to 74 Years | 0 (0.0%) | 0 (0.0%) |
| 75 Years and over | 6 (35.3%) | 7 (16.3%) |
Disability Class: Ambulatory Difficulty
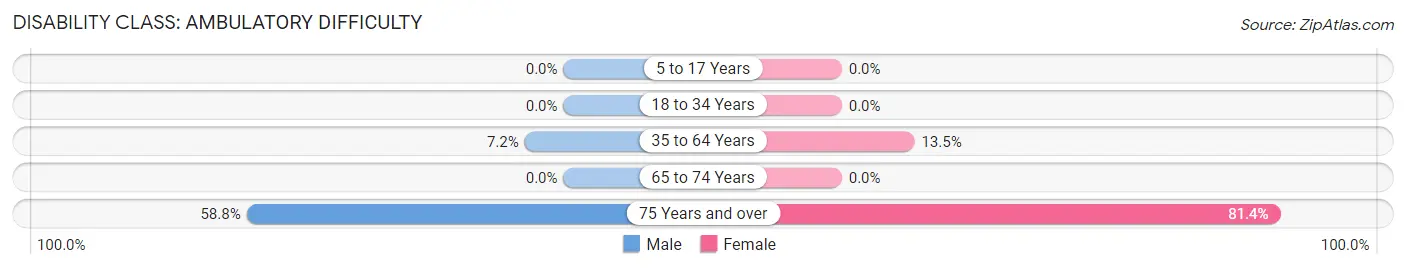
| Age Bracket | Male | Female |
| 5 to 17 Years | 0 (0.0%) | 0 (0.0%) |
| 18 to 34 Years | 0 (0.0%) | 0 (0.0%) |
| 35 to 64 Years | 9 (7.2%) | 17 (13.5%) |
| 65 to 74 Years | 0 (0.0%) | 0 (0.0%) |
| 75 Years and over | 10 (58.8%) | 35 (81.4%) |
Disability Class: Self-Care Difficulty
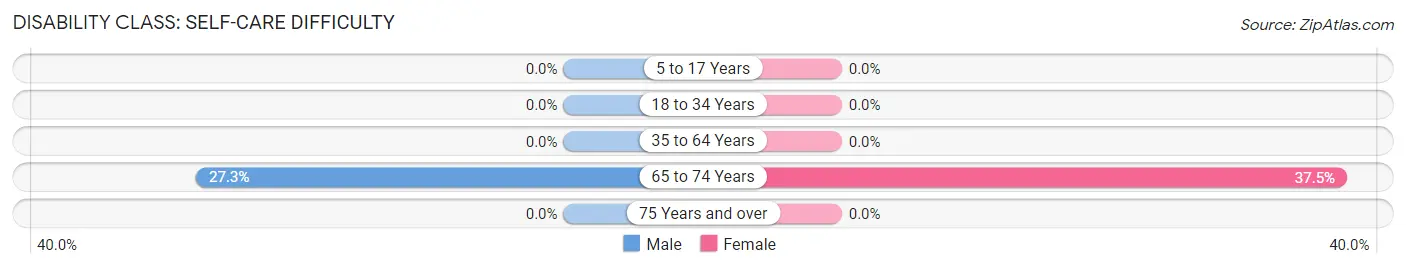
| Age Bracket | Male | Female |
| 5 to 17 Years | 0 (0.0%) | 0 (0.0%) |
| 18 to 34 Years | 0 (0.0%) | 0 (0.0%) |
| 35 to 64 Years | 0 (0.0%) | 0 (0.0%) |
| 65 to 74 Years | 3 (27.3%) | 6 (37.5%) |
| 75 Years and over | 0 (0.0%) | 0 (0.0%) |
Technology Access in Hot Springs
Computing Device Access in Hot Springs
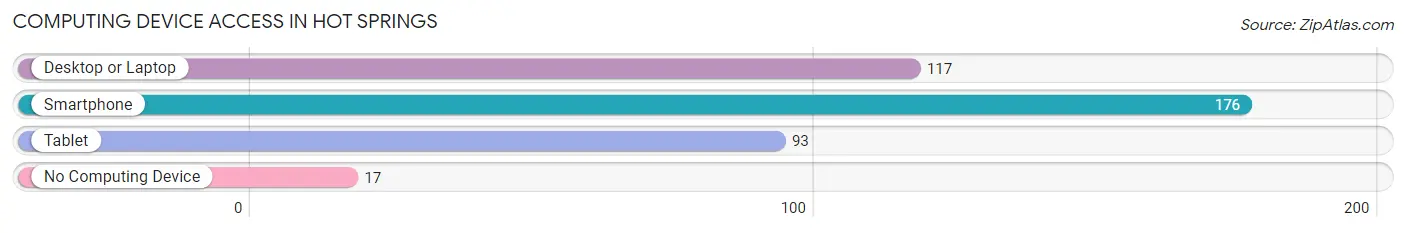
| Device Type | # Households | % Households |
| Desktop or Laptop | 117 | 57.4% |
| Smartphone | 176 | 86.3% |
| Tablet | 93 | 45.6% |
| No Computing Device | 17 | 8.3% |
| Total | 204 | 100.0% |
Internet Access in Hot Springs
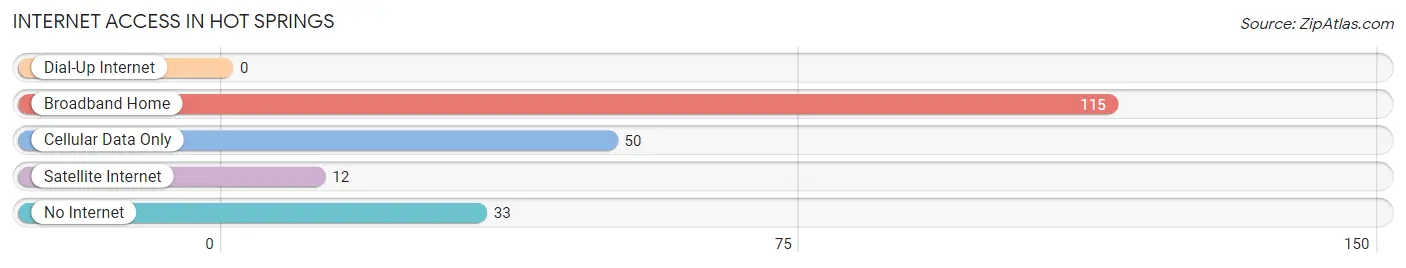
| Internet Type | # Households | % Households |
| Dial-Up Internet | 0 | 0.0% |
| Broadband Home | 115 | 56.4% |
| Cellular Data Only | 50 | 24.5% |
| Satellite Internet | 12 | 5.9% |
| No Internet | 33 | 16.2% |
| Total | 204 | 100.0% |
Hot Springs Summary
History
Hot Springs, North Carolina is a small town located in Madison County, North Carolina. It is situated in the Appalachian Mountains and is known for its natural hot springs. The town was first settled in the late 1700s by settlers from Virginia and North Carolina. The town was originally called Warm Springs, but the name was changed to Hot Springs in 1875.
The town was a popular destination for travelers in the late 1800s and early 1900s. It was known for its healing waters and was a popular destination for those seeking relief from ailments such as rheumatism and arthritis. The town was also known for its mineral baths, which were believed to have healing properties.
The town was also a popular destination for tourists who wanted to experience the natural beauty of the Appalachian Mountains. The town was home to several resorts, including the Hot Springs Hotel and the Mountain View Hotel.
The town was also home to several businesses, including a tannery, a grist mill, a sawmill, and a general store. The town was also home to several churches, including the Hot Springs Baptist Church, the Hot Springs Methodist Church, and the Hot Springs Presbyterian Church.
The town was also home to several schools, including the Hot Springs Academy, which was founded in 1883. The school was a private school for boys and girls and was known for its high academic standards.
The town was also home to several industries, including a furniture factory, a brickyard, and a canning factory. The town was also home to several mines, including the Hot Springs Mine, which was one of the largest gold mines in the United States.
The town was also home to several cultural attractions, including the Hot Springs Music Hall, which was built in 1891 and was the first music hall in the United States. The town was also home to several theaters, including the Hot Springs Opera House, which was built in 1892 and was the first opera house in the United States.
The town was also home to several parks, including the Hot Springs National Park, which was established in 1891 and is the oldest national park in the United States. The park is home to several natural hot springs, which are believed to have healing properties.
Geography
Hot Springs is located in the Appalachian Mountains of western North Carolina. The town is situated in the French Broad River Valley, which is surrounded by the Great Smoky Mountains to the east and the Blue Ridge Mountains to the west. The town is located at an elevation of 2,000 feet and is approximately 30 miles from Asheville, North Carolina.
The town is located in a temperate climate, with mild winters and warm summers. The average annual temperature is around 60 degrees Fahrenheit. The town receives an average of 45 inches of precipitation per year, with most of the precipitation occurring in the form of rain.
The town is located in a rural area and is surrounded by forests and mountains. The town is home to several parks, including the Hot Springs National Park, which is home to several natural hot springs. The town is also home to several lakes, including Lake Junaluska, which is a popular destination for fishing and boating.
Economy
The economy of Hot Springs is largely based on tourism. The town is home to several resorts, including the Hot Springs Hotel and the Mountain View Hotel. The town is also home to several restaurants, shops, and other businesses that cater to tourists.
The town is also home to several industries, including a furniture factory, a brickyard, and a canning factory. The town is also home to several mines, including the Hot Springs Mine, which is one of the largest gold mines in the United States.
The town is also home to several cultural attractions, including the Hot Springs Music Hall, which was built in 1891 and is the first music hall in the United States. The town is also home to several theaters, including the Hot Springs Opera House, which was built in 1892 and is the first opera house in the United States.
Demographics
As of the 2010 census, the population of Hot Springs was 1,845. The town has a population density of 5.3 people per square mile. The median age of the population is 44.7 years, and the median household income is $35,938.
The town is predominantly white, with 92.3% of the population identifying as white. The town is also home to a small African American population, with 4.2% of the population identifying as African American. The town is also home to a small Hispanic population, with 1.7% of the population identifying as Hispanic or Latino.
The town is home to several churches, including the Hot Springs Baptist Church, the Hot Springs Methodist Church, and the Hot Springs Presbyterian Church. The town is also home to several schools, including the Hot Springs Academy, which was founded in 1883.
Common Questions
What is Per Capita Income in Hot Springs?
Per Capita income in Hot Springs is $28,042.
What is the Median Family Income in Hot Springs?
Median Family Income in Hot Springs is $62,500.
What is the Median Household income in Hot Springs?
Median Household Income in Hot Springs is $45,500.
What is Income or Wage Gap in Hot Springs?
Income or Wage Gap in Hot Springs is 46.5%.
Women in Hot Springs earn 53.5 cents for every dollar earned by a man.
What is Inequality or Gini Index in Hot Springs?
Inequality or Gini Index in Hot Springs is 0.44.
What is the Total Population of Hot Springs?
Total Population of Hot Springs is 519.
What is the Total Male Population of Hot Springs?
Total Male Population of Hot Springs is 232.
What is the Total Female Population of Hot Springs?
Total Female Population of Hot Springs is 287.
What is the Ratio of Males per 100 Females in Hot Springs?
There are 80.84 Males per 100 Females in Hot Springs.
What is the Ratio of Females per 100 Males in Hot Springs?
There are 123.71 Females per 100 Males in Hot Springs.
What is the Median Population Age in Hot Springs?
Median Population Age in Hot Springs is 43.9 Years.
What is the Average Family Size in Hot Springs
Average Family Size in Hot Springs is 3.5 People.
What is the Average Household Size in Hot Springs
Average Household Size in Hot Springs is 2.4 People.
How Large is the Labor Force in Hot Springs?
There are 265 People in the Labor Forcein in Hot Springs.
What is the Percentage of People in the Labor Force in Hot Springs?
58.2% of People are in the Labor Force in Hot Springs.
What is the Unemployment Rate in Hot Springs?
Unemployment Rate in Hot Springs is 3.4%.