Bridgeton, NC Map & Demographics
Bridgeton Map
Bridgeton Overview
$24,259
PER CAPITA INCOME
$48,958
AVG FAMILY INCOME
$48,542
AVG HOUSEHOLD INCOME
51.7%
WAGE / INCOME GAP [ % ]
48.3¢/ $1
WAGE / INCOME GAP [ $ ]
0.46
INEQUALITY / GINI INDEX
532
TOTAL POPULATION
269
MALE POPULATION
263
FEMALE POPULATION
102.28
MALES / 100 FEMALES
97.77
FEMALES / 100 MALES
37.2
MEDIAN AGE
4.5
AVG FAMILY SIZE
2.6
AVG HOUSEHOLD SIZE
191
LABOR FORCE [ PEOPLE ]
54.4%
PERCENT IN LABOR FORCE
5.0%
UNEMPLOYMENT RATE
Bridgeton Zip Codes
Bridgeton Area Codes
Income in Bridgeton
Income Overview in Bridgeton
Per Capita Income in Bridgeton is $24,259, while median incomes of families and households are $48,958 and $48,542 respectively.
| Characteristic | Number | Measure |
| Per Capita Income | 532 | $24,259 |
| Median Family Income | 89 | $48,958 |
| Mean Family Income | 89 | $80,709 |
| Median Household Income | 201 | $48,542 |
| Mean Household Income | 201 | $64,318 |
| Income Deficit | 89 | $0 |
| Wage / Income Gap (%) | 532 | 51.69% |
| Wage / Income Gap ($) | 532 | 48.31¢ per $1 |
| Gini / Inequality Index | 532 | 0.46 |
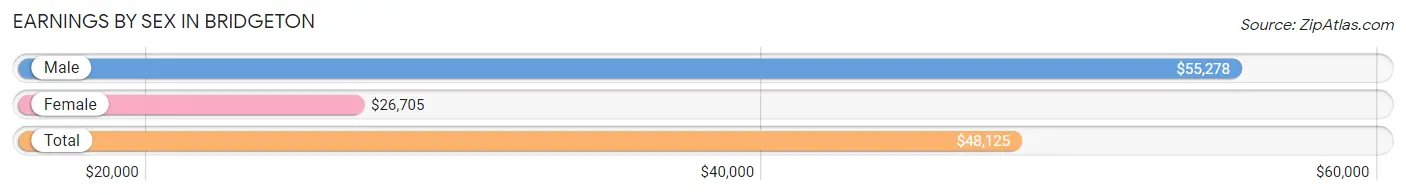
Earnings by Sex in Bridgeton
Average Earnings in Bridgeton are $48,125, $55,278 for men and $26,705 for women, a difference of 51.7%.
| Sex | Number | Average Earnings |
| Male | 102 (53.4%) | $55,278 |
| Female | 89 (46.6%) | $26,705 |
| Total | 191 (100.0%) | $48,125 |
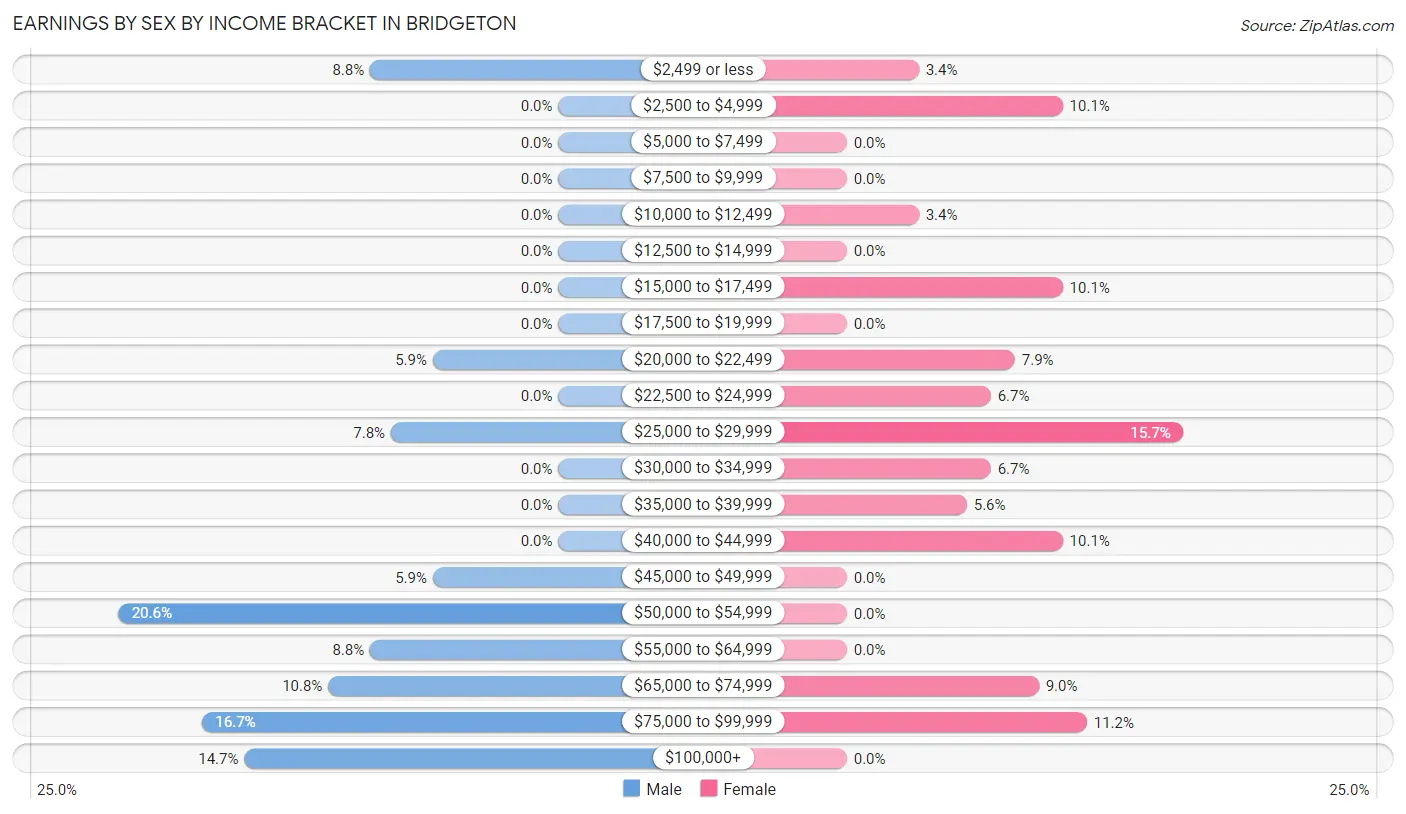
Earnings by Sex by Income Bracket in Bridgeton
The most common earnings brackets in Bridgeton are $50,000 to $54,999 for men (21 | 20.6%) and $25,000 to $29,999 for women (14 | 15.7%).
| Income | Male | Female |
| $2,499 or less | 9 (8.8%) | 3 (3.4%) |
| $2,500 to $4,999 | 0 (0.0%) | 9 (10.1%) |
| $5,000 to $7,499 | 0 (0.0%) | 0 (0.0%) |
| $7,500 to $9,999 | 0 (0.0%) | 0 (0.0%) |
| $10,000 to $12,499 | 0 (0.0%) | 3 (3.4%) |
| $12,500 to $14,999 | 0 (0.0%) | 0 (0.0%) |
| $15,000 to $17,499 | 0 (0.0%) | 9 (10.1%) |
| $17,500 to $19,999 | 0 (0.0%) | 0 (0.0%) |
| $20,000 to $22,499 | 6 (5.9%) | 7 (7.9%) |
| $22,500 to $24,999 | 0 (0.0%) | 6 (6.7%) |
| $25,000 to $29,999 | 8 (7.8%) | 14 (15.7%) |
| $30,000 to $34,999 | 0 (0.0%) | 6 (6.7%) |
| $35,000 to $39,999 | 0 (0.0%) | 5 (5.6%) |
| $40,000 to $44,999 | 0 (0.0%) | 9 (10.1%) |
| $45,000 to $49,999 | 6 (5.9%) | 0 (0.0%) |
| $50,000 to $54,999 | 21 (20.6%) | 0 (0.0%) |
| $55,000 to $64,999 | 9 (8.8%) | 0 (0.0%) |
| $65,000 to $74,999 | 11 (10.8%) | 8 (9.0%) |
| $75,000 to $99,999 | 17 (16.7%) | 10 (11.2%) |
| $100,000+ | 15 (14.7%) | 0 (0.0%) |
| Total | 102 (100.0%) | 89 (100.0%) |
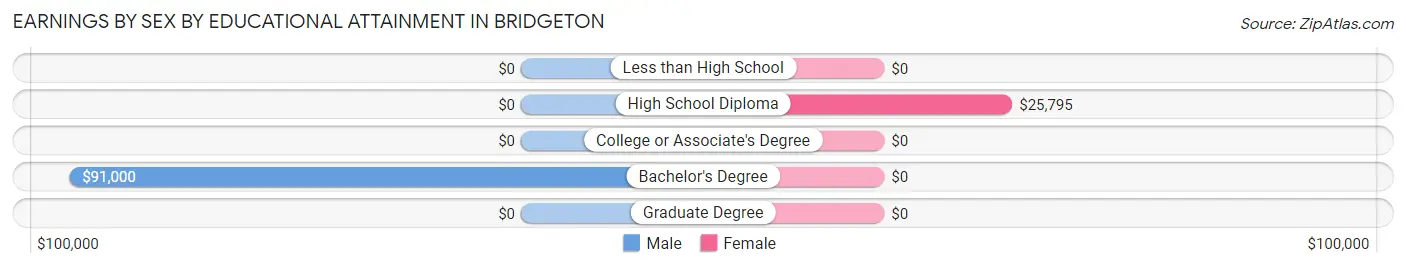
Earnings by Sex by Educational Attainment in Bridgeton
Average earnings in Bridgeton are $56,528 for men and $29,583 for women, a difference of 47.7%. Men with an educational attainment of bachelor's degree enjoy the highest average annual earnings of $91,000, while those with bachelor's degree education earn the least with $91,000. Women with an educational attainment of high school diploma earn the most with the average annual earnings of $25,795, while those with high school diploma education have the smallest earnings of $25,795.
| Educational Attainment | Male Income | Female Income |
| Less than High School | - | - |
| High School Diploma | - | - |
| College or Associate's Degree | - | - |
| Bachelor's Degree | $91,000 | $0 |
| Graduate Degree | - | - |
| Total | $56,528 | $29,583 |
Family Income in Bridgeton
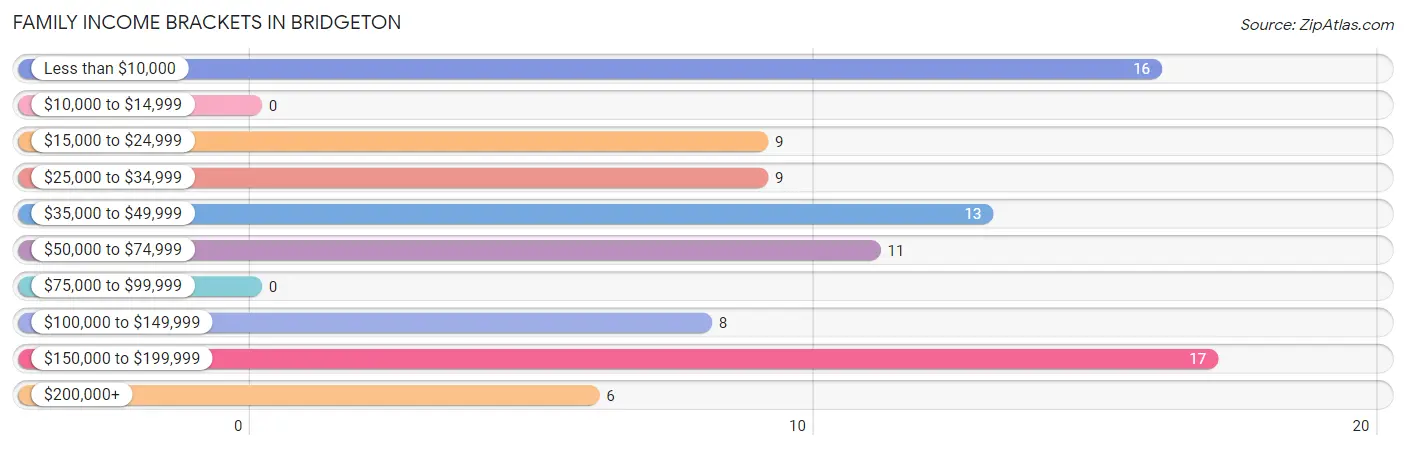
Family Income Brackets in Bridgeton
According to the Bridgeton family income data, there are 17 families falling into the $150,000 to $199,999 income range, which is the most common income bracket and makes up 19.1% of all families.
| Income Bracket | # Families | % Families |
| Less than $10,000 | 16 | 18.0% |
| $10,000 to $14,999 | 0 | 0.0% |
| $15,000 to $24,999 | 9 | 10.1% |
| $25,000 to $34,999 | 9 | 10.1% |
| $35,000 to $49,999 | 13 | 14.6% |
| $50,000 to $74,999 | 11 | 12.4% |
| $75,000 to $99,999 | 0 | 0.0% |
| $100,000 to $149,999 | 8 | 9.0% |
| $150,000 to $199,999 | 17 | 19.1% |
| $200,000+ | 6 | 6.7% |
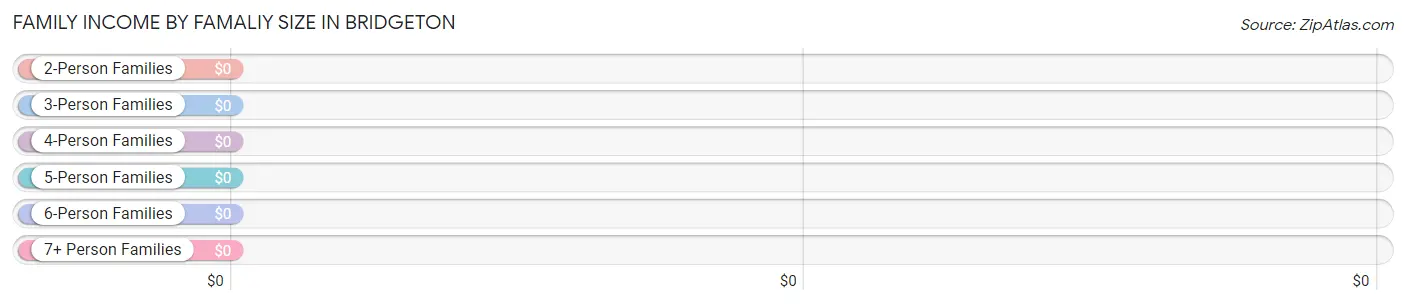
Family Income by Famaliy Size in Bridgeton
| Income Bracket | # Families | Median Income |
| 2-Person Families | 36 (40.5%) | $0 |
| 3-Person Families | 15 (16.9%) | $0 |
| 4-Person Families | 19 (21.3%) | $0 |
| 5-Person Families | 0 (0.0%) | $0 |
| 6-Person Families | 19 (21.3%) | $0 |
| 7+ Person Families | 0 (0.0%) | $0 |
| Total | 89 (100.0%) | $48,958 |
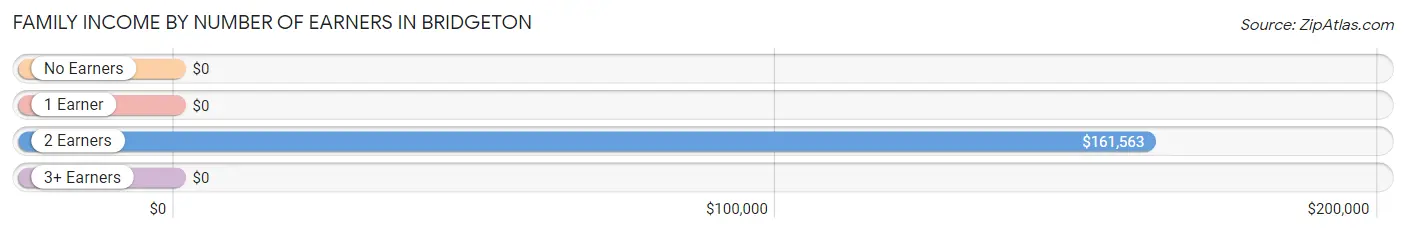
Family Income by Number of Earners in Bridgeton
| Number of Earners | # Families | Median Income |
| No Earners | 21 (23.6%) | $0 |
| 1 Earner | 21 (23.6%) | $0 |
| 2 Earners | 36 (40.5%) | $161,563 |
| 3+ Earners | 11 (12.4%) | $0 |
| Total | 89 (100.0%) | $48,958 |
Household Income in Bridgeton
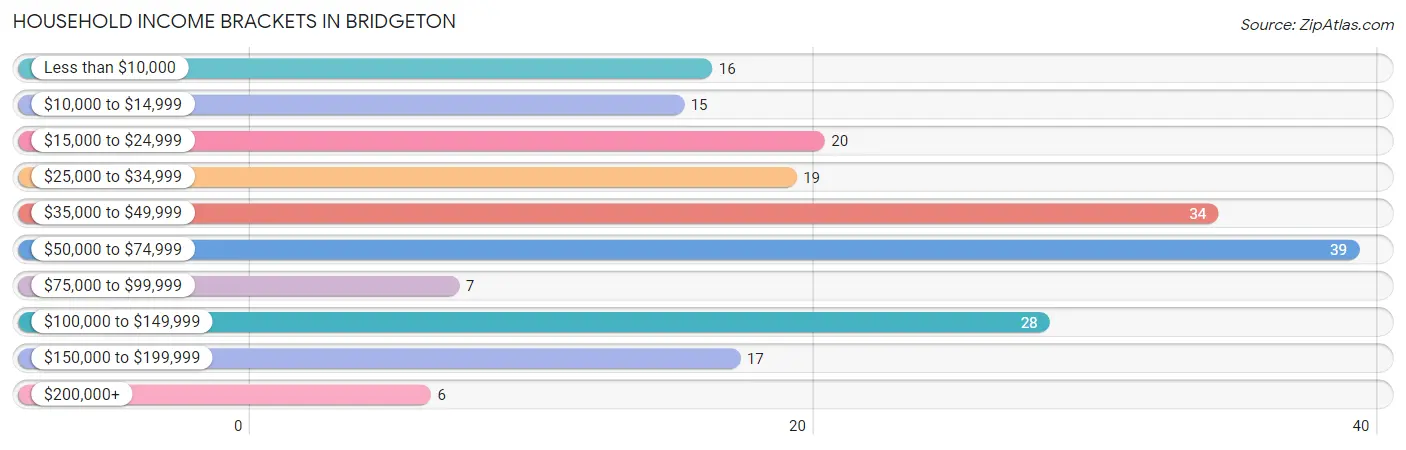
Household Income Brackets in Bridgeton
With 39 households falling in the category, the $50,000 to $74,999 income range is the most frequent in Bridgeton, accounting for 19.4% of all households. In contrast, only 6 households (3.0%) fall into the $200,000+ income bracket, making it the least populous group.
| Income Bracket | # Households | % Households |
| Less than $10,000 | 16 | 8.0% |
| $10,000 to $14,999 | 15 | 7.5% |
| $15,000 to $24,999 | 20 | 10.0% |
| $25,000 to $34,999 | 19 | 9.5% |
| $35,000 to $49,999 | 34 | 16.9% |
| $50,000 to $74,999 | 39 | 19.4% |
| $75,000 to $99,999 | 7 | 3.5% |
| $100,000 to $149,999 | 28 | 13.9% |
| $150,000 to $199,999 | 17 | 8.5% |
| $200,000+ | 6 | 3.0% |
Household Income by Householder Age in Bridgeton
The median household income in Bridgeton is $48,542, with the highest median household income of $58,409 found in the 45 to 64 years age bracket for the primary householder. A total of 28 households (13.9%) fall into this category.
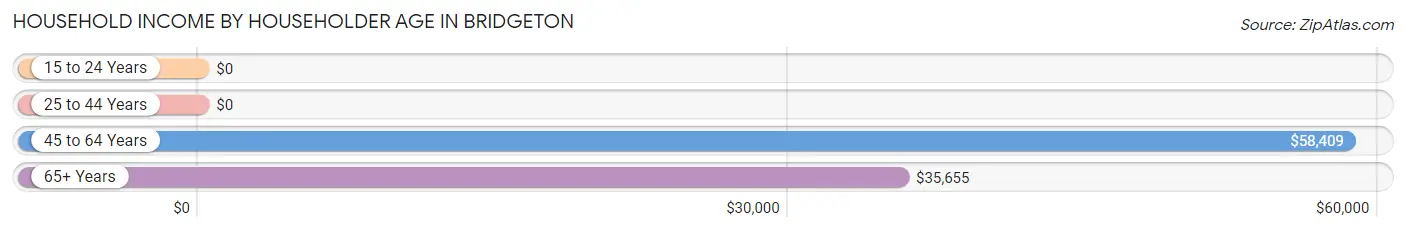
| Income Bracket | # Households | Median Income |
| 15 to 24 Years | 0 (0.0%) | $0 |
| 25 to 44 Years | 98 (48.8%) | $0 |
| 45 to 64 Years | 28 (13.9%) | $58,409 |
| 65+ Years | 75 (37.3%) | $35,655 |
| Total | 201 (100.0%) | $48,542 |
Poverty in Bridgeton
Income Below Poverty by Sex and Age in Bridgeton
With 44.2% poverty level for males and 39.2% for females among the residents of Bridgeton, under 5 year old males and 6 to 11 year old females are the most vulnerable to poverty, with 34 males (100.0%) and 53 females (74.7%) in their respective age groups living below the poverty level.
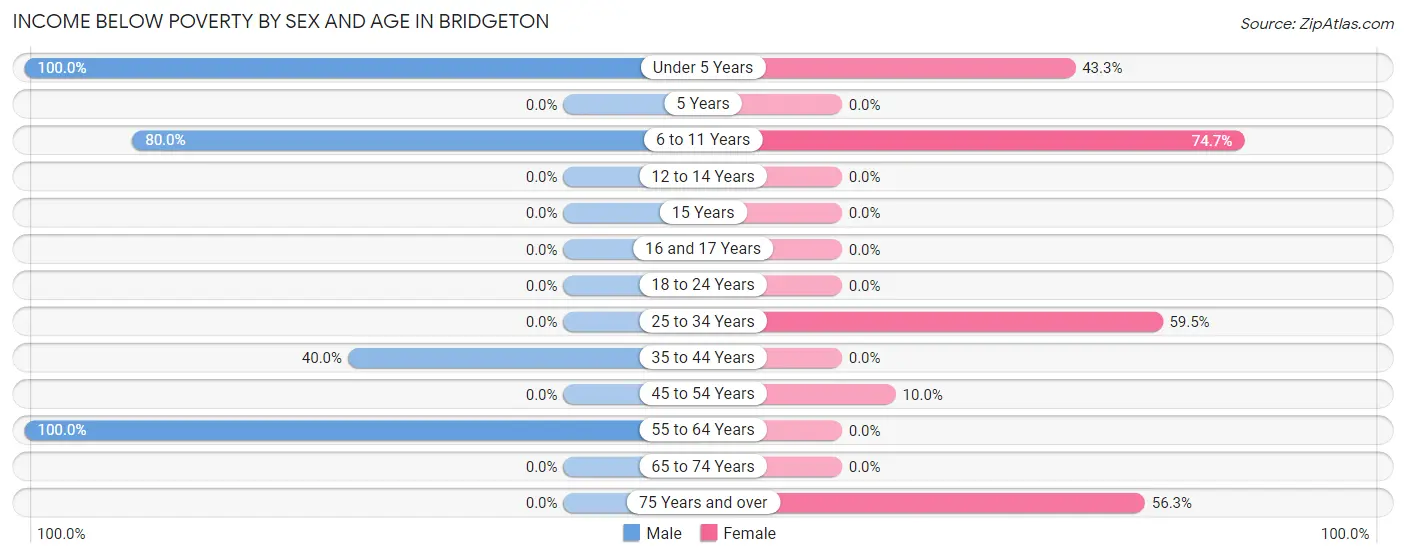
| Age Bracket | Male | Female |
| Under 5 Years | 34 (100.0%) | 13 (43.3%) |
| 5 Years | 0 (0.0%) | 0 (0.0%) |
| 6 to 11 Years | 28 (80.0%) | 53 (74.7%) |
| 12 to 14 Years | 0 (0.0%) | 0 (0.0%) |
| 15 Years | 0 (0.0%) | 0 (0.0%) |
| 16 and 17 Years | 0 (0.0%) | 0 (0.0%) |
| 18 to 24 Years | 0 (0.0%) | 0 (0.0%) |
| 25 to 34 Years | 0 (0.0%) | 25 (59.5%) |
| 35 to 44 Years | 48 (40.0%) | 0 (0.0%) |
| 45 to 54 Years | 0 (0.0%) | 3 (10.0%) |
| 55 to 64 Years | 9 (100.0%) | 0 (0.0%) |
| 65 to 74 Years | 0 (0.0%) | 0 (0.0%) |
| 75 Years and over | 0 (0.0%) | 9 (56.2%) |
| Total | 119 (44.2%) | 103 (39.2%) |
Income Above Poverty by Sex and Age in Bridgeton
According to the poverty statistics in Bridgeton, males aged 12 to 14 years and females aged 12 to 14 years are the age groups that are most secure financially, with 100.0% of males and 100.0% of females in these age groups living above the poverty line.
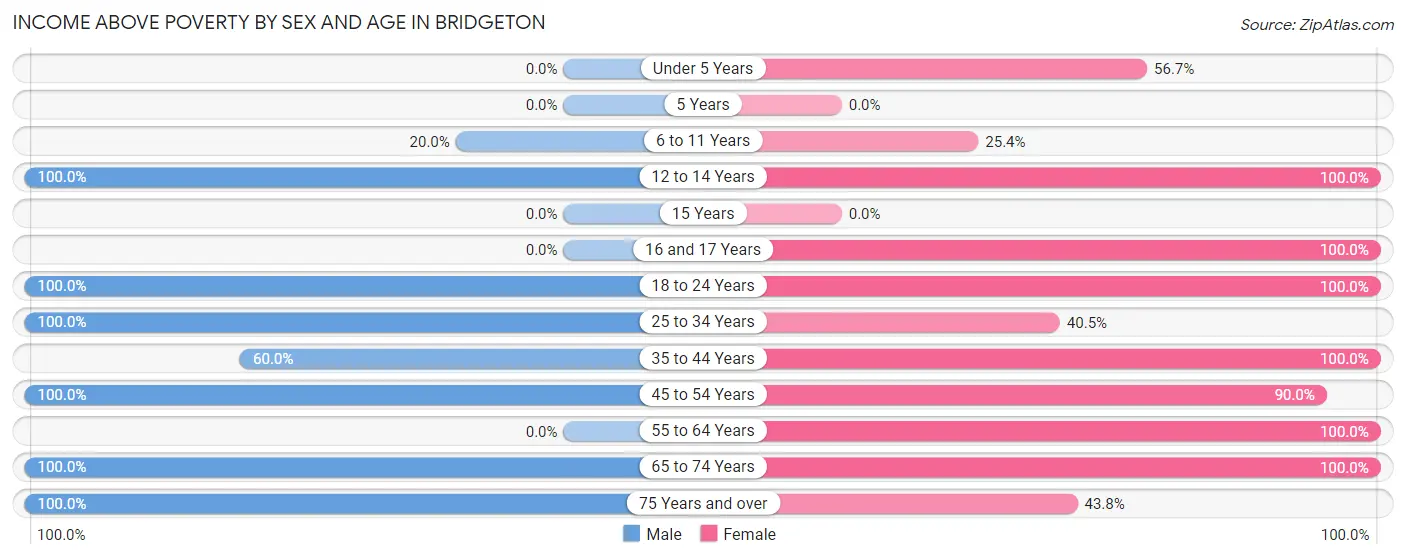
| Age Bracket | Male | Female |
| Under 5 Years | 0 (0.0%) | 17 (56.7%) |
| 5 Years | 0 (0.0%) | 0 (0.0%) |
| 6 to 11 Years | 7 (20.0%) | 18 (25.4%) |
| 12 to 14 Years | 3 (100.0%) | 8 (100.0%) |
| 15 Years | 0 (0.0%) | 0 (0.0%) |
| 16 and 17 Years | 0 (0.0%) | 3 (100.0%) |
| 18 to 24 Years | 14 (100.0%) | 9 (100.0%) |
| 25 to 34 Years | 6 (100.0%) | 17 (40.5%) |
| 35 to 44 Years | 72 (60.0%) | 18 (100.0%) |
| 45 to 54 Years | 15 (100.0%) | 27 (90.0%) |
| 55 to 64 Years | 0 (0.0%) | 6 (100.0%) |
| 65 to 74 Years | 5 (100.0%) | 30 (100.0%) |
| 75 Years and over | 28 (100.0%) | 7 (43.8%) |
| Total | 150 (55.8%) | 160 (60.8%) |
Income Below Poverty Among Married-Couple Families in Bridgeton
The poverty statistics for married-couple families in Bridgeton show that 26.2% or 16 of the total 61 families live below the poverty line. Families with 3 or 4 children have the highest poverty rate of 100.0%, comprising of 16 families. On the other hand, families with no children have the lowest poverty rate of 0.0%, which includes 0 families.
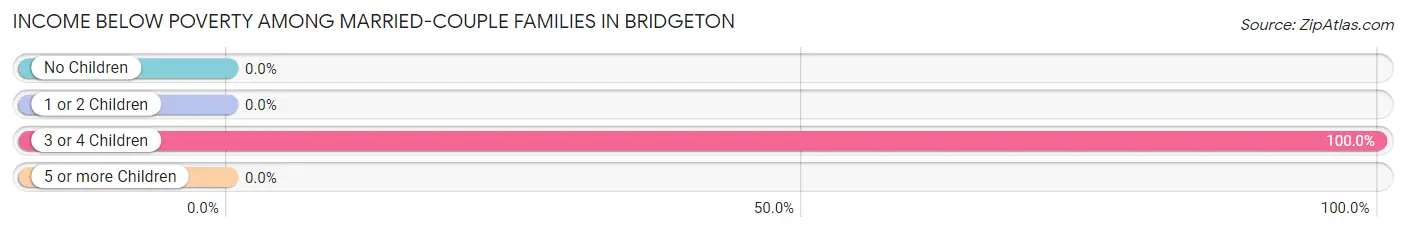
| Children | Above Poverty | Below Poverty |
| No Children | 20 (100.0%) | 0 (0.0%) |
| 1 or 2 Children | 25 (100.0%) | 0 (0.0%) |
| 3 or 4 Children | 0 (0.0%) | 16 (100.0%) |
| 5 or more Children | 0 (0.0%) | 0 (0.0%) |
| Total | 45 (73.8%) | 16 (26.2%) |
Income Below Poverty Among Single-Parent Households in Bridgeton
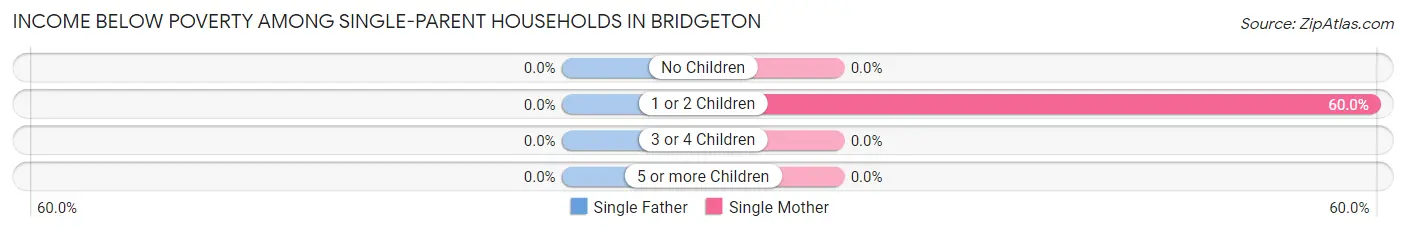
| Children | Single Father | Single Mother |
| No Children | 0 (0.0%) | 0 (0.0%) |
| 1 or 2 Children | 0 (0.0%) | 9 (60.0%) |
| 3 or 4 Children | 0 (0.0%) | 0 (0.0%) |
| 5 or more Children | 0 (0.0%) | 0 (0.0%) |
| Total | 0 (0.0%) | 9 (32.1%) |
Income Below Poverty Among Married-Couple vs Single-Parent Households in Bridgeton
The poverty data for Bridgeton shows that 16 of the married-couple family households (26.2%) and 9 of the single-parent households (32.1%) are living below the poverty level. Within the married-couple family households, those with 3 or 4 children have the highest poverty rate, with 16 households (100.0%) falling below the poverty line. Among the single-parent households, those with 1 or 2 children have the highest poverty rate, with 9 household (60.0%) living below poverty.
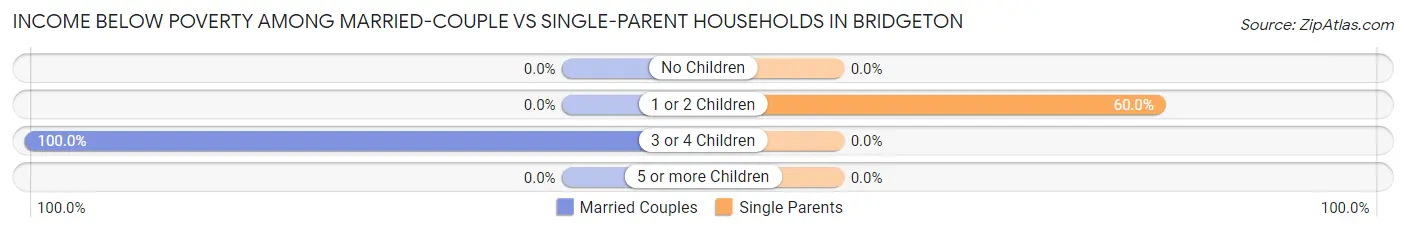
| Children | Married-Couple Families | Single-Parent Households |
| No Children | 0 (0.0%) | 0 (0.0%) |
| 1 or 2 Children | 0 (0.0%) | 9 (60.0%) |
| 3 or 4 Children | 16 (100.0%) | 0 (0.0%) |
| 5 or more Children | 0 (0.0%) | 0 (0.0%) |
| Total | 16 (26.2%) | 9 (32.1%) |
Race in Bridgeton
The most populous races in Bridgeton are White / Caucasian (502 | 94.4%), Hispanic or Latino (192 | 36.1%), and Black / African American (30 | 5.6%).
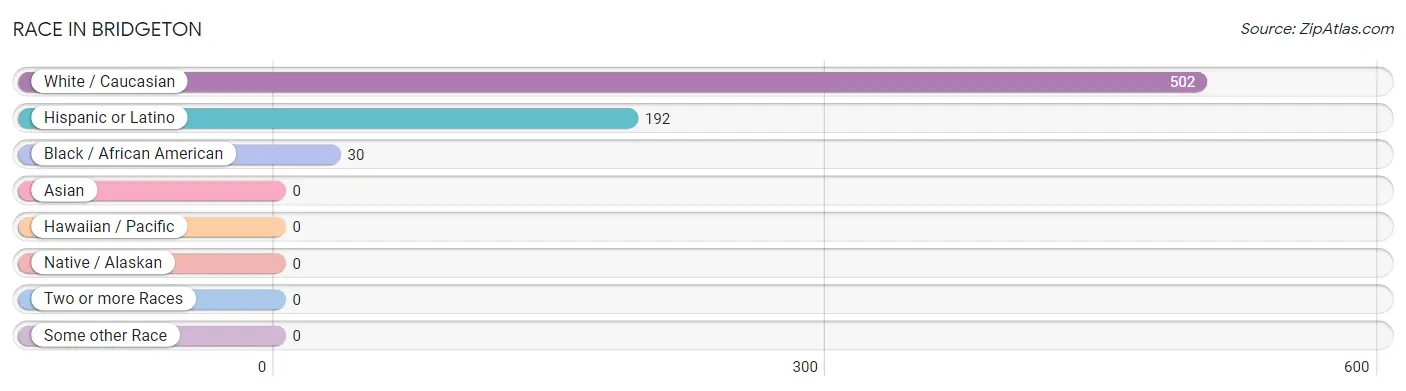
| Race | # Population | % Population |
| Asian | 0 | 0.0% |
| Black / African American | 30 | 5.6% |
| Hawaiian / Pacific | 0 | 0.0% |
| Hispanic or Latino | 192 | 36.1% |
| Native / Alaskan | 0 | 0.0% |
| White / Caucasian | 502 | 94.4% |
| Two or more Races | 0 | 0.0% |
| Some other Race | 0 | 0.0% |
| Total | 532 | 100.0% |
Ancestry in Bridgeton
The most populous ancestries reported in Bridgeton are Mexican (171 | 32.1%), American (79 | 14.8%), English (58 | 10.9%), Irish (58 | 10.9%), and Scottish (47 | 8.8%), together accounting for 77.6% of all Bridgeton residents.
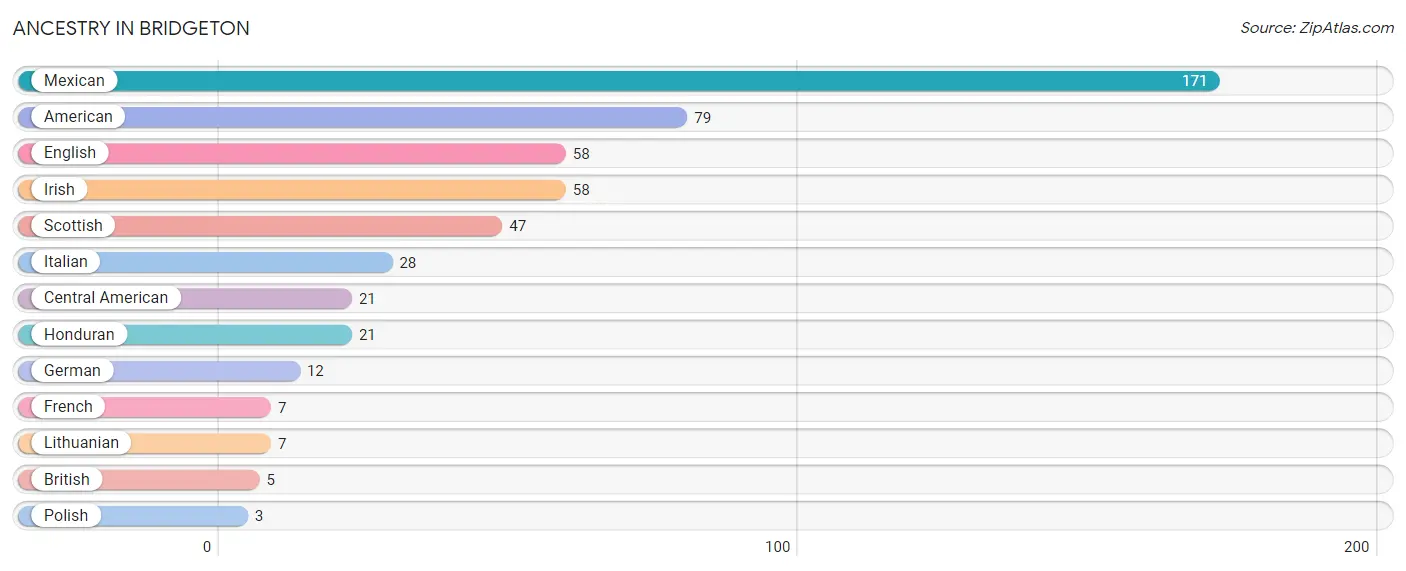
| Ancestry | # Population | % Population |
| American | 79 | 14.8% |
| British | 5 | 0.9% |
| Central American | 21 | 4.0% |
| English | 58 | 10.9% |
| French | 7 | 1.3% |
| German | 12 | 2.3% |
| Honduran | 21 | 4.0% |
| Irish | 58 | 10.9% |
| Italian | 28 | 5.3% |
| Lithuanian | 7 | 1.3% |
| Mexican | 171 | 32.1% |
| Polish | 3 | 0.6% |
| Scottish | 47 | 8.8% | View All 13 Rows |
Immigrants in Bridgeton
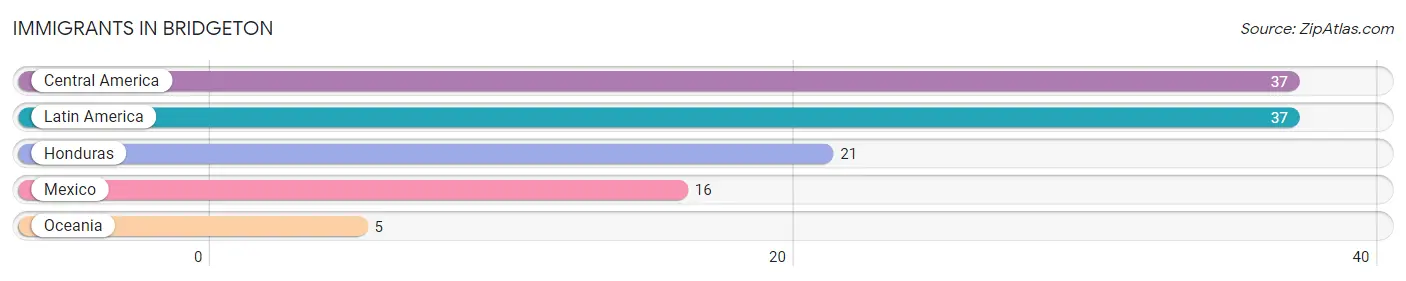
The most numerous immigrant groups reported in Bridgeton came from Central America (37 | 7.0%), Latin America (37 | 7.0%), Honduras (21 | 4.0%), Mexico (16 | 3.0%), and Oceania (5 | 0.9%), together accounting for 21.8% of all Bridgeton residents.
| Immigration Origin | # Population | % Population |
| Central America | 37 | 7.0% |
| Honduras | 21 | 4.0% |
| Latin America | 37 | 7.0% |
| Mexico | 16 | 3.0% |
| Oceania | 5 | 0.9% | View All 5 Rows |
Sex and Age in Bridgeton
Sex and Age in Bridgeton
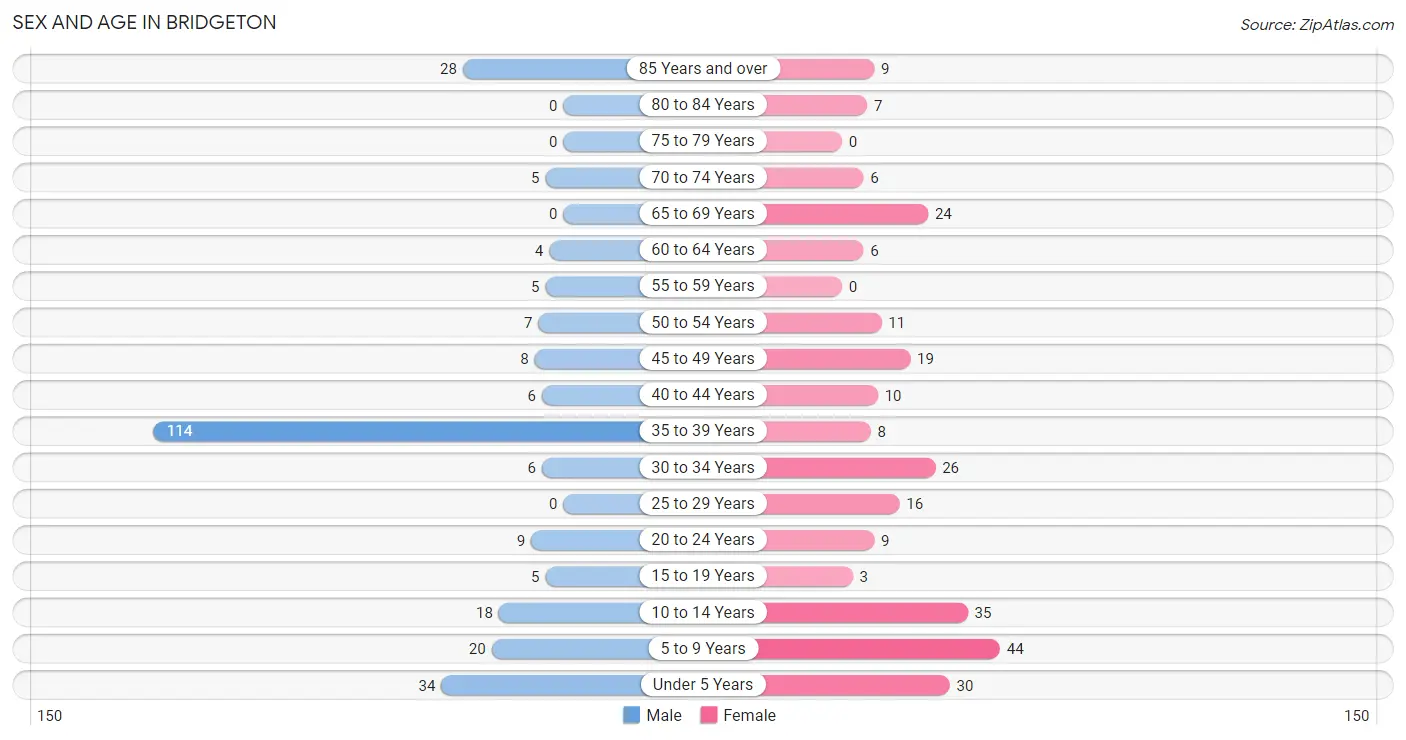
The most populous age groups in Bridgeton are 35 to 39 Years (114 | 42.4%) for men and 5 to 9 Years (44 | 16.7%) for women.
| Age Bracket | Male | Female |
| Under 5 Years | 34 (12.6%) | 30 (11.4%) |
| 5 to 9 Years | 20 (7.4%) | 44 (16.7%) |
| 10 to 14 Years | 18 (6.7%) | 35 (13.3%) |
| 15 to 19 Years | 5 (1.9%) | 3 (1.1%) |
| 20 to 24 Years | 9 (3.4%) | 9 (3.4%) |
| 25 to 29 Years | 0 (0.0%) | 16 (6.1%) |
| 30 to 34 Years | 6 (2.2%) | 26 (9.9%) |
| 35 to 39 Years | 114 (42.4%) | 8 (3.0%) |
| 40 to 44 Years | 6 (2.2%) | 10 (3.8%) |
| 45 to 49 Years | 8 (3.0%) | 19 (7.2%) |
| 50 to 54 Years | 7 (2.6%) | 11 (4.2%) |
| 55 to 59 Years | 5 (1.9%) | 0 (0.0%) |
| 60 to 64 Years | 4 (1.5%) | 6 (2.3%) |
| 65 to 69 Years | 0 (0.0%) | 24 (9.1%) |
| 70 to 74 Years | 5 (1.9%) | 6 (2.3%) |
| 75 to 79 Years | 0 (0.0%) | 0 (0.0%) |
| 80 to 84 Years | 0 (0.0%) | 7 (2.7%) |
| 85 Years and over | 28 (10.4%) | 9 (3.4%) |
| Total | 269 (100.0%) | 263 (100.0%) |
Families and Households in Bridgeton
Median Family Size in Bridgeton
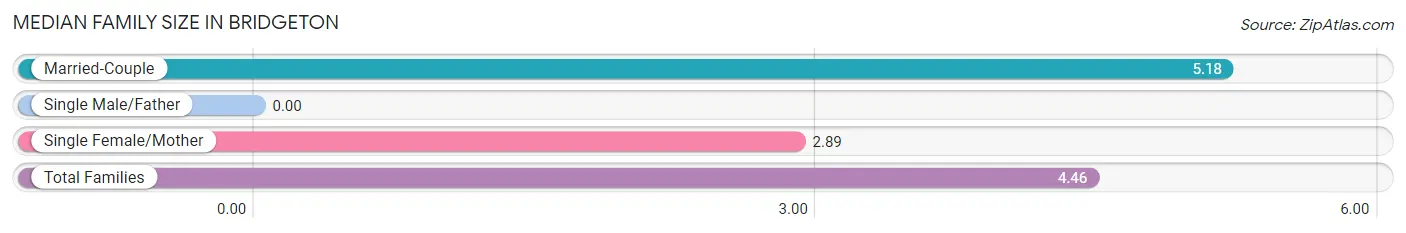
| Family Type | # Families | Family Size |
| Married-Couple | 61 (68.5%) | 5.18 |
| Single Male/Father | 0 (0.0%) | - |
| Single Female/Mother | 28 (31.5%) | 2.89 |
| Total Families | 89 (100.0%) | 4.46 |
Median Household Size in Bridgeton
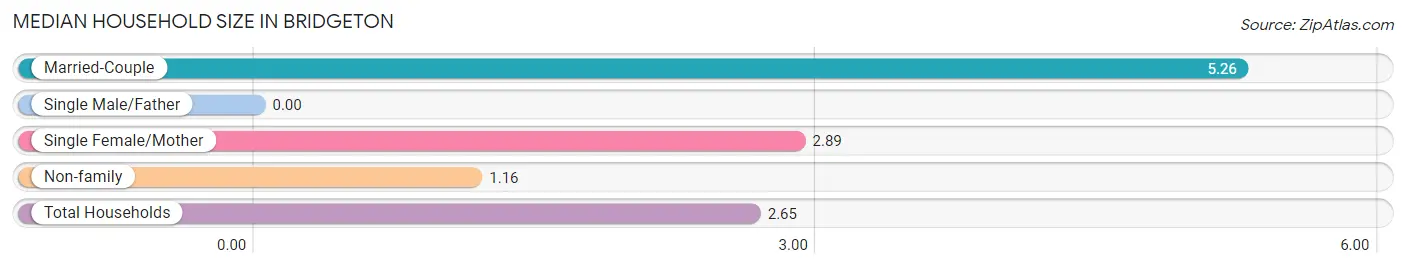
| Household Type | # Households | Household Size |
| Married-Couple | 61 (30.3%) | 5.26 |
| Single Male/Father | 0 (0.0%) | - |
| Single Female/Mother | 28 (13.9%) | 2.89 |
| Non-family | 112 (55.7%) | 1.16 |
| Total Households | 201 (100.0%) | 2.65 |
Household Size by Marriage Status in Bridgeton
Out of a total of 201 households in Bridgeton, 89 (44.3%) are family households, while 112 (55.7%) are nonfamily households. The most numerous type of family households are 2-person households, comprising 36, and the most common type of nonfamily households are 1-person households, comprising 90.
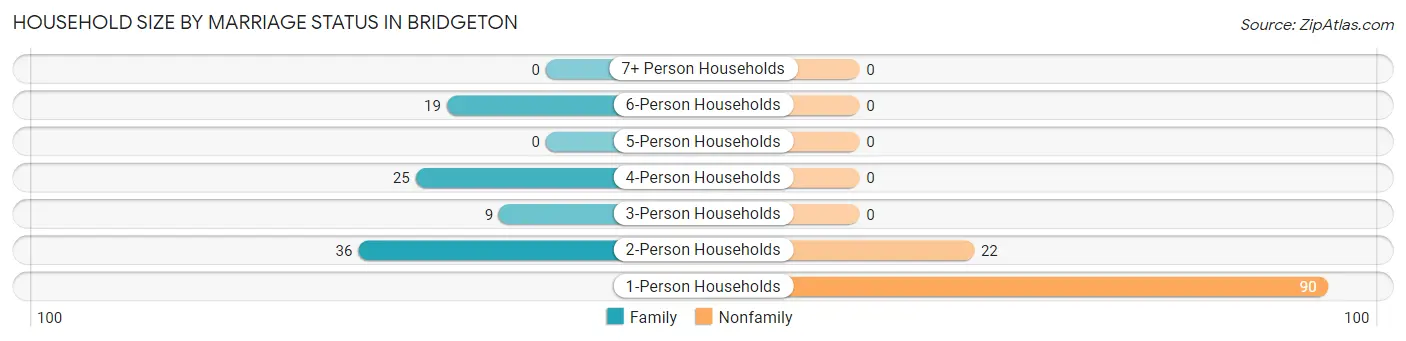
| Household Size | Family Households | Nonfamily Households |
| 1-Person Households | - | 90 (44.8%) |
| 2-Person Households | 36 (17.9%) | 22 (11.0%) |
| 3-Person Households | 9 (4.5%) | 0 (0.0%) |
| 4-Person Households | 25 (12.4%) | 0 (0.0%) |
| 5-Person Households | 0 (0.0%) | 0 (0.0%) |
| 6-Person Households | 19 (9.5%) | 0 (0.0%) |
| 7+ Person Households | 0 (0.0%) | 0 (0.0%) |
| Total | 89 (44.3%) | 112 (55.7%) |
Female Fertility in Bridgeton
Fertility by Age in Bridgeton
| Age Bracket | Women with Births | Births / 1,000 Women |
| 15 to 19 years | 0 (0.0%) | 0.0 |
| 20 to 34 years | 0 (0.0%) | 0.0 |
| 35 to 50 years | 0 (0.0%) | 0.0 |
| Total | 0 (0.0%) | 0.0 |
Fertility by Age by Marriage Status in Bridgeton
| Age Bracket | Married | Unmarried |
| 15 to 19 years | 0 (0.0%) | 0 (0.0%) |
| 20 to 34 years | 0 (0.0%) | 0 (0.0%) |
| 35 to 50 years | 0 (0.0%) | 0 (0.0%) |
| Total | 0 (0.0%) | 0 (0.0%) |
Fertility by Education in Bridgeton
| Educational Attainment | Women with Births | Births / 1,000 Women |
| Less than High School | 0 (0.0%) | 0.0 |
| High School Diploma | 0 (0.0%) | 0.0 |
| College or Associate's Degree | 0 (0.0%) | 0.0 |
| Bachelor's Degree | 0 (0.0%) | 0.0 |
| Graduate Degree | 0 (0.0%) | 0.0 |
| Total | 0 (0.0%) | 0.0 |
Fertility by Education by Marriage Status in Bridgeton
| Educational Attainment | Married | Unmarried |
| Less than High School | 0 (0.0%) | 0 (0.0%) |
| High School Diploma | 0 (0.0%) | 0 (0.0%) |
| College or Associate's Degree | 0 (0.0%) | 0 (0.0%) |
| Bachelor's Degree | 0 (0.0%) | 0 (0.0%) |
| Graduate Degree | 0 (0.0%) | 0 (0.0%) |
| Total | 0 (0.0%) | 0 (0.0%) |
Employment Characteristics in Bridgeton
Employment by Class of Employer in Bridgeton
Among the 182 employed individuals in Bridgeton, private company employees (67 | 36.8%), self-employed (not incorporated) (36 | 19.8%), and not-for-profit organizations (33 | 18.1%) make up the most common classes of employment.
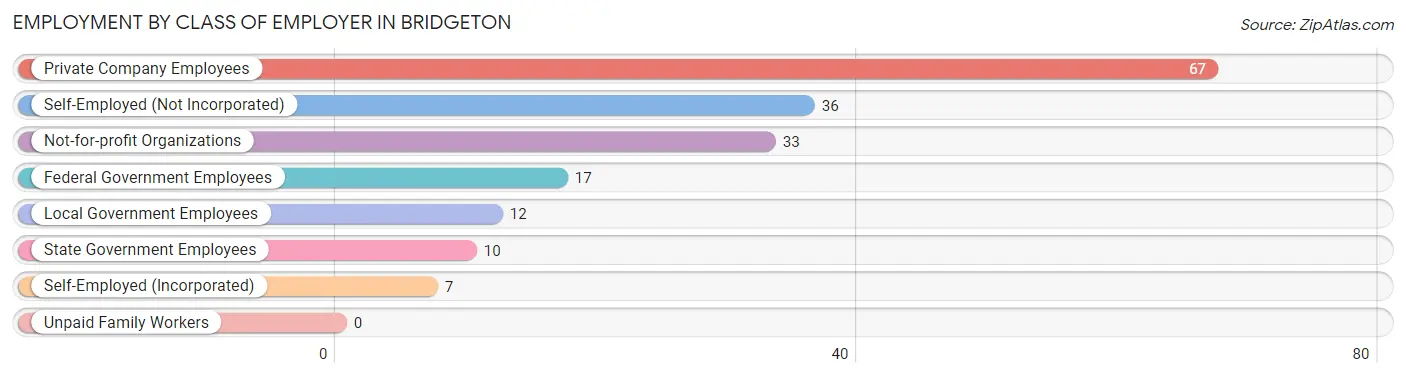
| Employer Class | # Employees | % Employees |
| Private Company Employees | 67 | 36.8% |
| Self-Employed (Incorporated) | 7 | 3.8% |
| Self-Employed (Not Incorporated) | 36 | 19.8% |
| Not-for-profit Organizations | 33 | 18.1% |
| Local Government Employees | 12 | 6.6% |
| State Government Employees | 10 | 5.5% |
| Federal Government Employees | 17 | 9.3% |
| Unpaid Family Workers | 0 | 0.0% |
| Total | 182 | 100.0% |
Employment Status by Age in Bridgeton
According to the labor force statistics for Bridgeton, out of the total population over 16 years of age (351), 54.4% or 191 individuals are in the labor force, with 5.0% or 10 of them unemployed. The age group with the highest labor force participation rate is 20 to 24 years, with 100.0% or 18 individuals in the labor force. Within the labor force, the 20 to 24 years age range has the highest percentage of unemployed individuals, with 50.0% or 9 of them being unemployed.
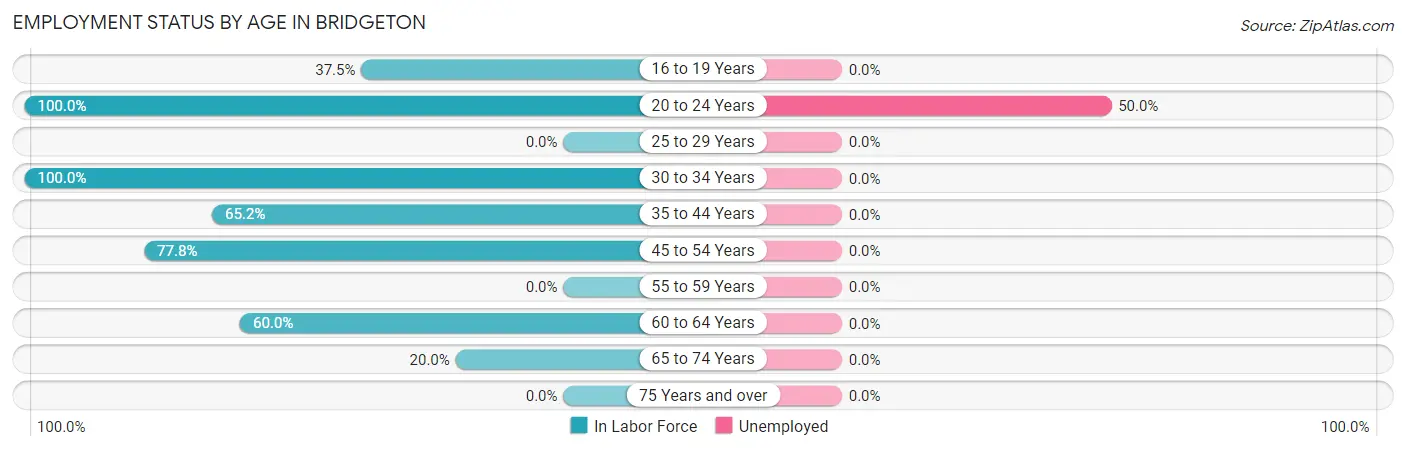
| Age Bracket | In Labor Force | Unemployed |
| 16 to 19 Years | 3 (37.5%) | 0 (0.0%) |
| 20 to 24 Years | 18 (100.0%) | 9 (50.0%) |
| 25 to 29 Years | 0 (0.0%) | 0 (0.0%) |
| 30 to 34 Years | 32 (100.0%) | 0 (0.0%) |
| 35 to 44 Years | 90 (65.2%) | 0 (0.0%) |
| 45 to 54 Years | 35 (77.8%) | 0 (0.0%) |
| 55 to 59 Years | 0 (0.0%) | 0 (0.0%) |
| 60 to 64 Years | 6 (60.0%) | 0 (0.0%) |
| 65 to 74 Years | 7 (20.0%) | 0 (0.0%) |
| 75 Years and over | 0 (0.0%) | 0 (0.0%) |
| Total | 191 (54.4%) | 10 (5.0%) |
Employment Status by Educational Attainment in Bridgeton
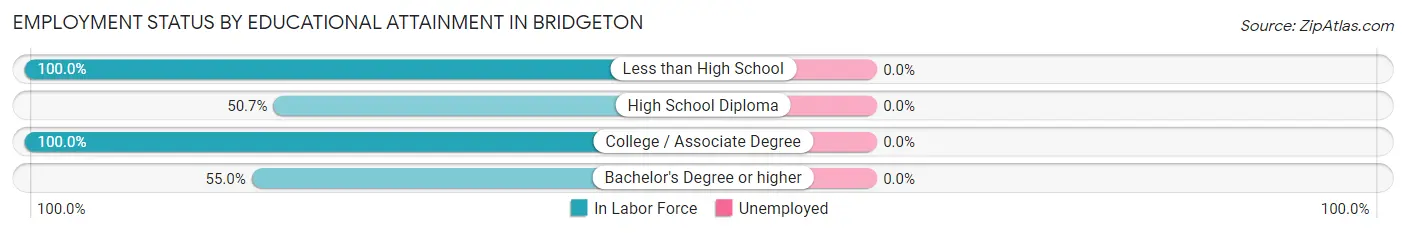
| Educational Attainment | In Labor Force | Unemployed |
| Less than High School | 27 (100.0%) | 0 (0.0%) |
| High School Diploma | 34 (50.7%) | 0 (0.0%) |
| College / Associate Degree | 41 (100.0%) | 0 (0.0%) |
| Bachelor's Degree or higher | 61 (55.0%) | 0 (0.0%) |
| Total | 163 (66.3%) | 0 (0.0%) |
Employment Occupations by Sex in Bridgeton
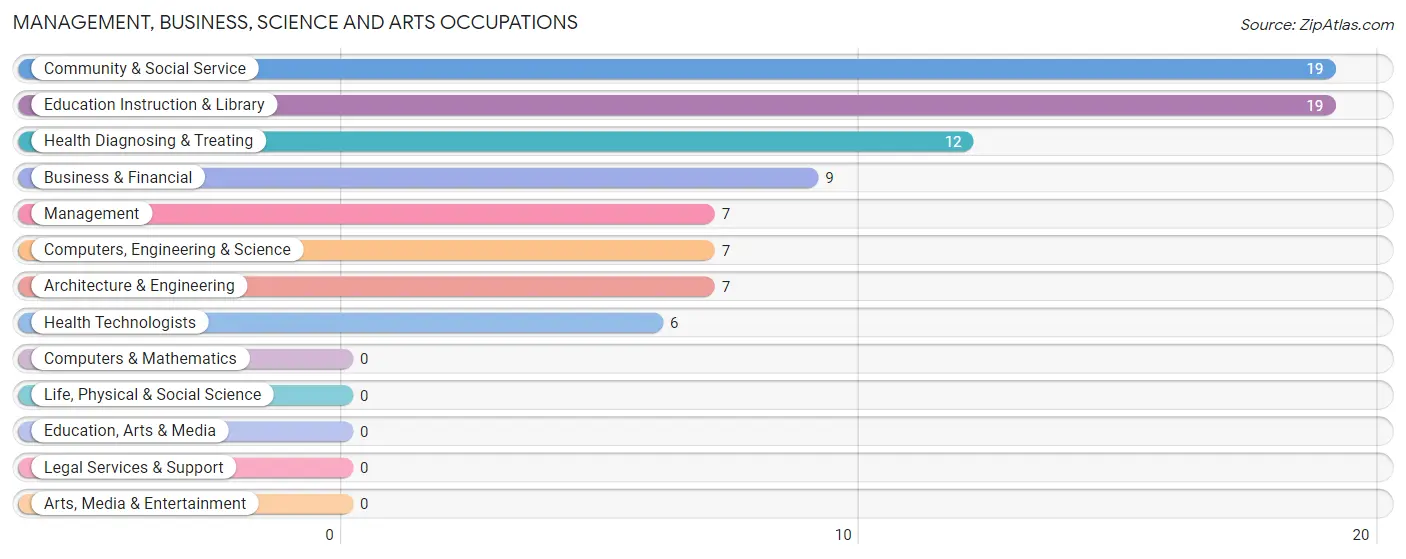
Management, Business, Science and Arts Occupations
The most common Management, Business, Science and Arts occupations in Bridgeton are Community & Social Service (19 | 11.1%), Education Instruction & Library (19 | 11.1%), Health Diagnosing & Treating (12 | 7.0%), Business & Financial (9 | 5.2%), and Management (7 | 4.1%).
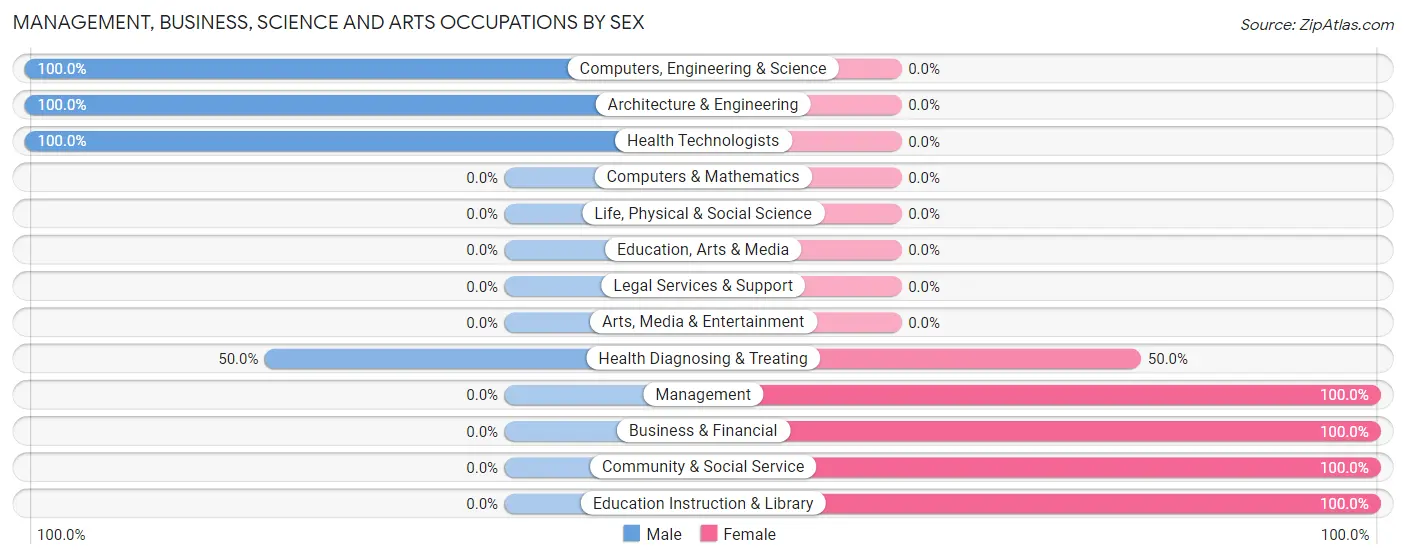
Management, Business, Science and Arts Occupations by Sex
Within the Management, Business, Science and Arts occupations in Bridgeton, the most male-oriented occupations are Computers, Engineering & Science (100.0%), Architecture & Engineering (100.0%), and Health Technologists (100.0%), while the most female-oriented occupations are Management (100.0%), Business & Financial (100.0%), and Community & Social Service (100.0%).
| Occupation | Male | Female |
| Management | 0 (0.0%) | 7 (100.0%) |
| Business & Financial | 0 (0.0%) | 9 (100.0%) |
| Computers, Engineering & Science | 7 (100.0%) | 0 (0.0%) |
| Computers & Mathematics | 0 (0.0%) | 0 (0.0%) |
| Architecture & Engineering | 7 (100.0%) | 0 (0.0%) |
| Life, Physical & Social Science | 0 (0.0%) | 0 (0.0%) |
| Community & Social Service | 0 (0.0%) | 19 (100.0%) |
| Education, Arts & Media | 0 (0.0%) | 0 (0.0%) |
| Legal Services & Support | 0 (0.0%) | 0 (0.0%) |
| Education Instruction & Library | 0 (0.0%) | 19 (100.0%) |
| Arts, Media & Entertainment | 0 (0.0%) | 0 (0.0%) |
| Health Diagnosing & Treating | 6 (50.0%) | 6 (50.0%) |
| Health Technologists | 6 (100.0%) | 0 (0.0%) |
| Total (Category) | 13 (24.1%) | 41 (75.9%) |
| Total (Overall) | 83 (48.3%) | 89 (51.7%) |
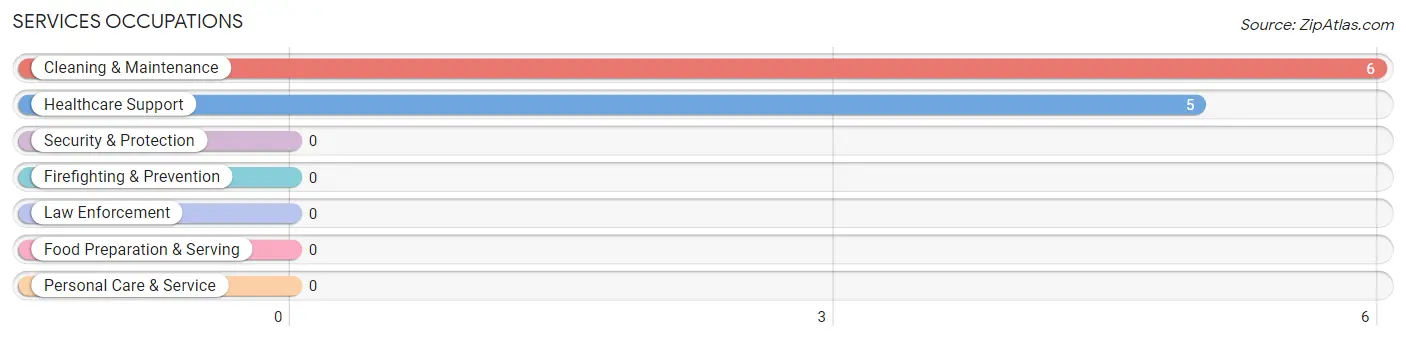
Services Occupations
The most common Services occupations in Bridgeton are Cleaning & Maintenance (6 | 3.5%), and Healthcare Support (5 | 2.9%).
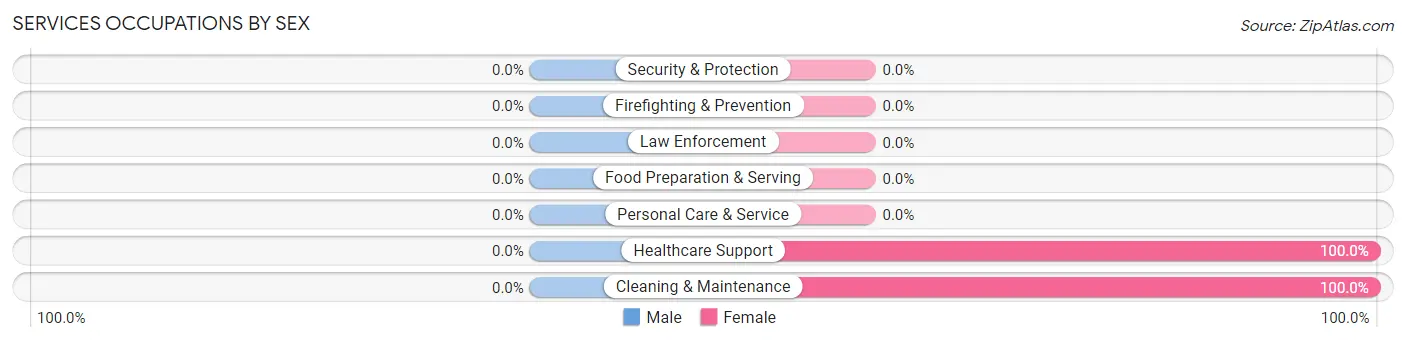
Services Occupations by Sex
| Occupation | Male | Female |
| Healthcare Support | 0 (0.0%) | 5 (100.0%) |
| Security & Protection | 0 (0.0%) | 0 (0.0%) |
| Firefighting & Prevention | 0 (0.0%) | 0 (0.0%) |
| Law Enforcement | 0 (0.0%) | 0 (0.0%) |
| Food Preparation & Serving | 0 (0.0%) | 0 (0.0%) |
| Cleaning & Maintenance | 0 (0.0%) | 6 (100.0%) |
| Personal Care & Service | 0 (0.0%) | 0 (0.0%) |
| Total (Category) | 0 (0.0%) | 11 (100.0%) |
| Total (Overall) | 83 (48.3%) | 89 (51.7%) |
Sales and Office Occupations
The most common Sales and Office occupations in Bridgeton are Office & Administration (37 | 21.5%), and Sales & Related (32 | 18.6%).
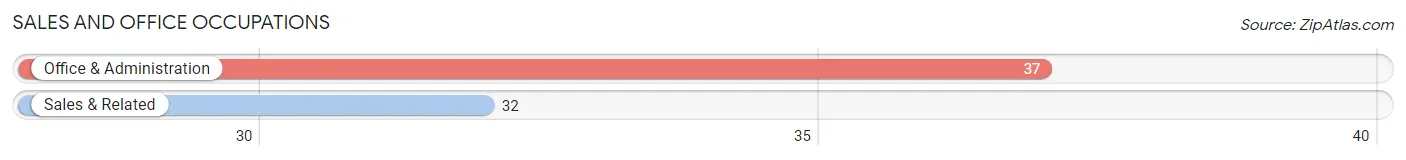
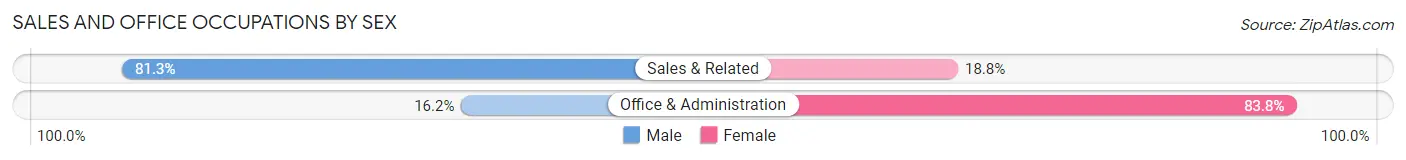
Sales and Office Occupations by Sex
| Occupation | Male | Female |
| Sales & Related | 26 (81.2%) | 6 (18.8%) |
| Office & Administration | 6 (16.2%) | 31 (83.8%) |
| Total (Category) | 32 (46.4%) | 37 (53.6%) |
| Total (Overall) | 83 (48.3%) | 89 (51.7%) |
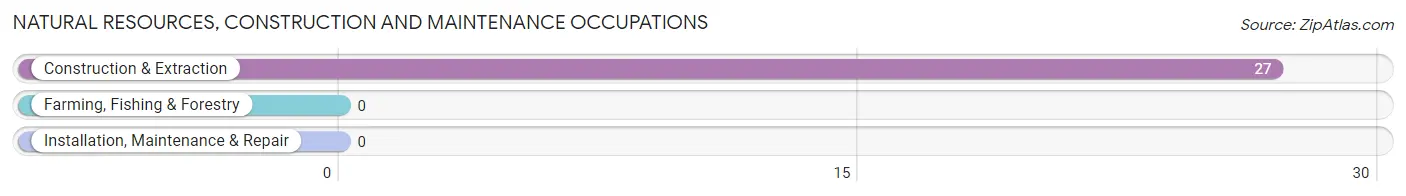
Natural Resources, Construction and Maintenance Occupations
The most common Natural Resources, Construction and Maintenance occupations in Bridgeton are , and Construction & Extraction (27 | 15.7%).
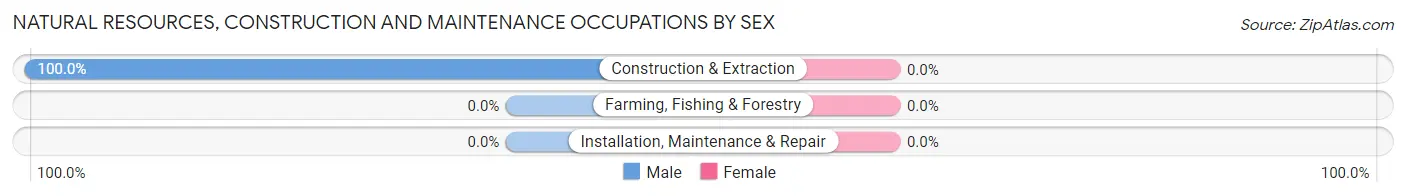
Natural Resources, Construction and Maintenance Occupations by Sex
| Occupation | Male | Female |
| Farming, Fishing & Forestry | 0 (0.0%) | 0 (0.0%) |
| Construction & Extraction | 27 (100.0%) | 0 (0.0%) |
| Installation, Maintenance & Repair | 0 (0.0%) | 0 (0.0%) |
| Total (Category) | 27 (100.0%) | 0 (0.0%) |
| Total (Overall) | 83 (48.3%) | 89 (51.7%) |
Production, Transportation and Moving Occupations
The most common Production, Transportation and Moving occupations in Bridgeton are , and Production (11 | 6.4%).
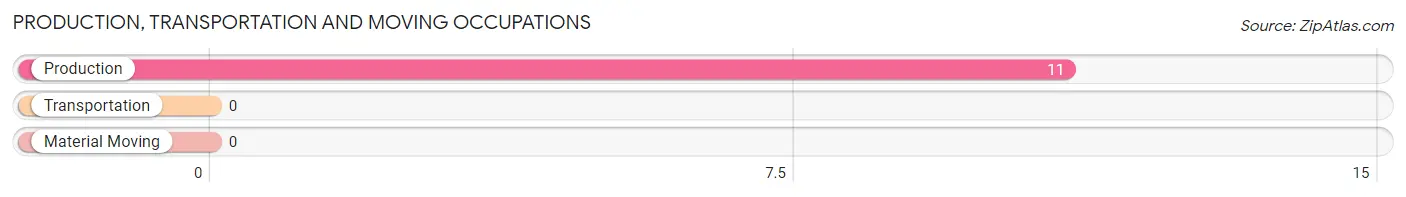
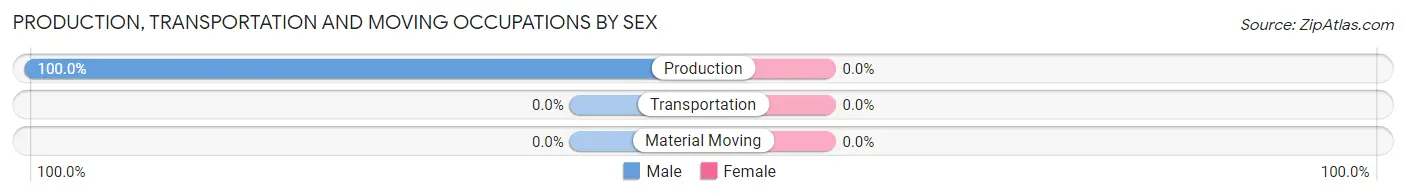
Production, Transportation and Moving Occupations by Sex
| Occupation | Male | Female |
| Production | 11 (100.0%) | 0 (0.0%) |
| Transportation | 0 (0.0%) | 0 (0.0%) |
| Material Moving | 0 (0.0%) | 0 (0.0%) |
| Total (Category) | 11 (100.0%) | 0 (0.0%) |
| Total (Overall) | 83 (48.3%) | 89 (51.7%) |
Employment Industries by Sex in Bridgeton
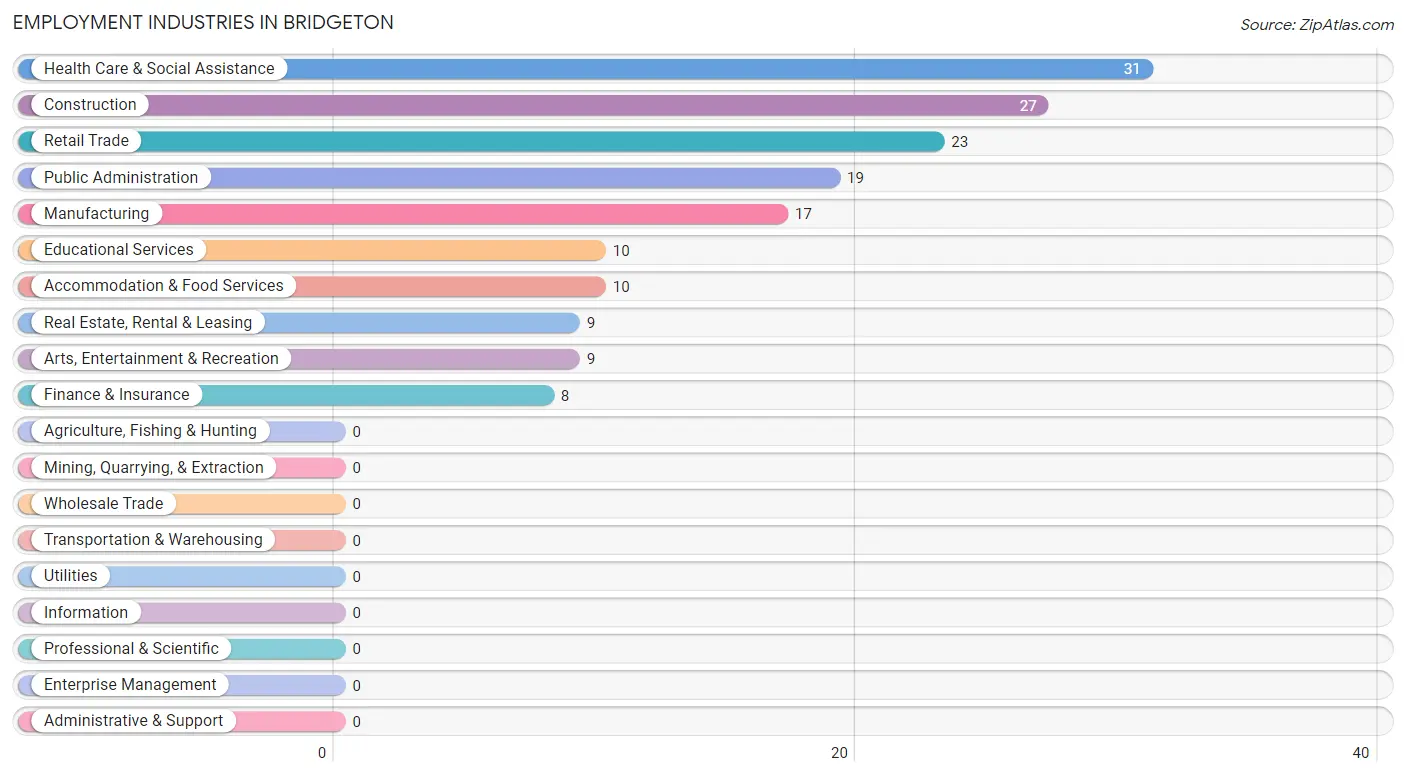
Employment Industries in Bridgeton
The major employment industries in Bridgeton include Health Care & Social Assistance (31 | 18.0%), Construction (27 | 15.7%), Retail Trade (23 | 13.4%), Public Administration (19 | 11.1%), and Manufacturing (17 | 9.9%).
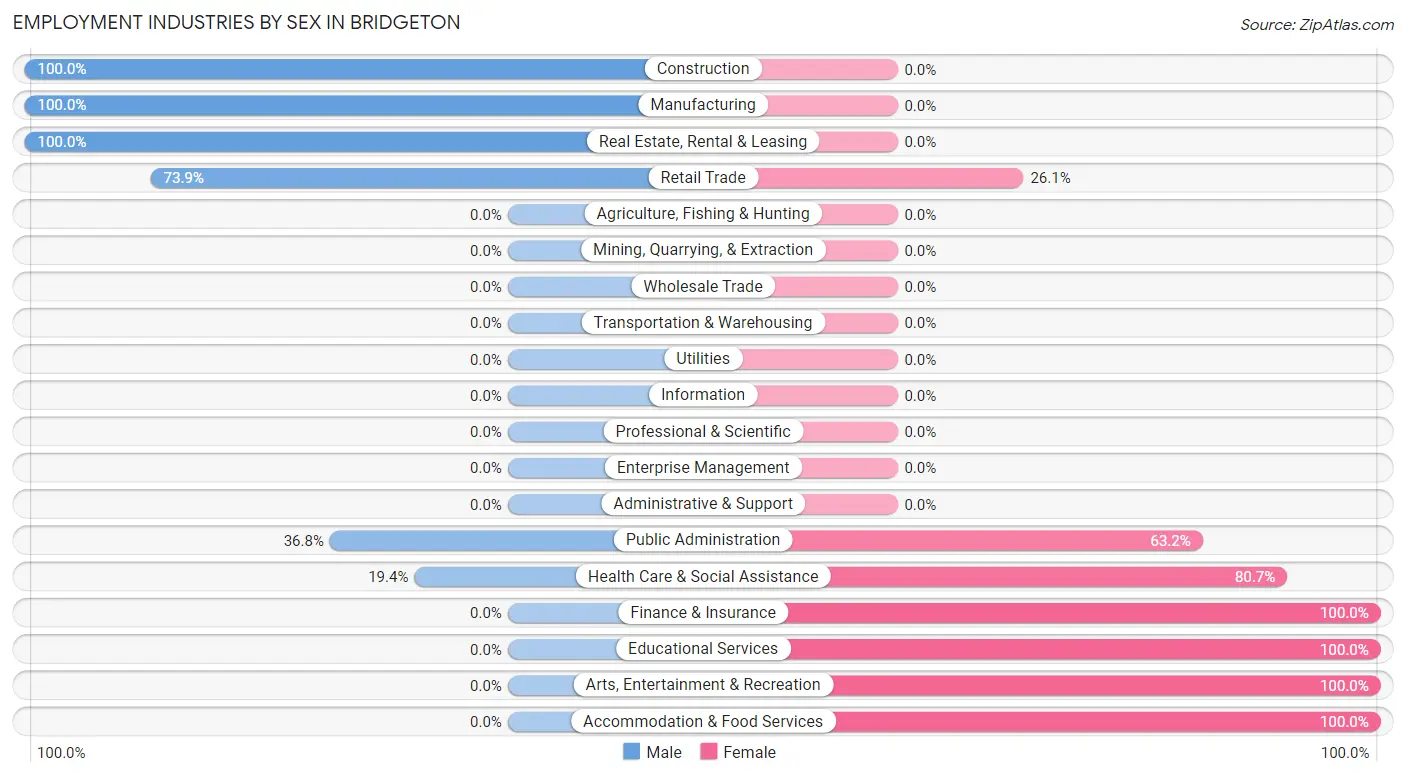
Employment Industries by Sex in Bridgeton
The Bridgeton industries that see more men than women are Construction (100.0%), Manufacturing (100.0%), and Real Estate, Rental & Leasing (100.0%), whereas the industries that tend to have a higher number of women are Finance & Insurance (100.0%), Educational Services (100.0%), and Arts, Entertainment & Recreation (100.0%).
| Industry | Male | Female |
| Agriculture, Fishing & Hunting | 0 (0.0%) | 0 (0.0%) |
| Mining, Quarrying, & Extraction | 0 (0.0%) | 0 (0.0%) |
| Construction | 27 (100.0%) | 0 (0.0%) |
| Manufacturing | 17 (100.0%) | 0 (0.0%) |
| Wholesale Trade | 0 (0.0%) | 0 (0.0%) |
| Retail Trade | 17 (73.9%) | 6 (26.1%) |
| Transportation & Warehousing | 0 (0.0%) | 0 (0.0%) |
| Utilities | 0 (0.0%) | 0 (0.0%) |
| Information | 0 (0.0%) | 0 (0.0%) |
| Finance & Insurance | 0 (0.0%) | 8 (100.0%) |
| Real Estate, Rental & Leasing | 9 (100.0%) | 0 (0.0%) |
| Professional & Scientific | 0 (0.0%) | 0 (0.0%) |
| Enterprise Management | 0 (0.0%) | 0 (0.0%) |
| Administrative & Support | 0 (0.0%) | 0 (0.0%) |
| Educational Services | 0 (0.0%) | 10 (100.0%) |
| Health Care & Social Assistance | 6 (19.4%) | 25 (80.6%) |
| Arts, Entertainment & Recreation | 0 (0.0%) | 9 (100.0%) |
| Accommodation & Food Services | 0 (0.0%) | 10 (100.0%) |
| Public Administration | 7 (36.8%) | 12 (63.2%) |
| Total | 83 (48.3%) | 89 (51.7%) |
Education in Bridgeton
School Enrollment in Bridgeton
The most common levels of schooling among the 158 students in Bridgeton are elementary school (71 | 44.9%), middle school (46 | 29.1%), and college / undergraduate (18 | 11.4%).
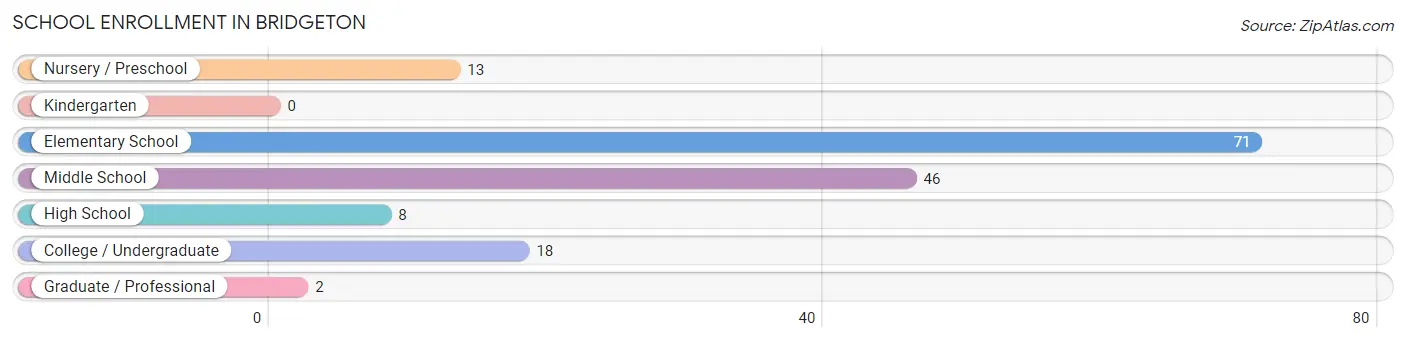
| School Level | # Students | % Students |
| Nursery / Preschool | 13 | 8.2% |
| Kindergarten | 0 | 0.0% |
| Elementary School | 71 | 44.9% |
| Middle School | 46 | 29.1% |
| High School | 8 | 5.1% |
| College / Undergraduate | 18 | 11.4% |
| Graduate / Professional | 2 | 1.3% |
| Total | 158 | 100.0% |
School Enrollment by Age by Funding Source in Bridgeton
Out of a total of 158 students who are enrolled in schools in Bridgeton, 22 (13.9%) attend a private institution, while the remaining 136 (86.1%) are enrolled in public schools. The age group of 3 to 4 year olds has the highest likelihood of being enrolled in private schools, with 13 (100.0% in the age bracket) enrolled. Conversely, the age group of 5 to 9 year old has the lowest likelihood of being enrolled in a private school, with 64 (100.0% in the age bracket) attending a public institution.
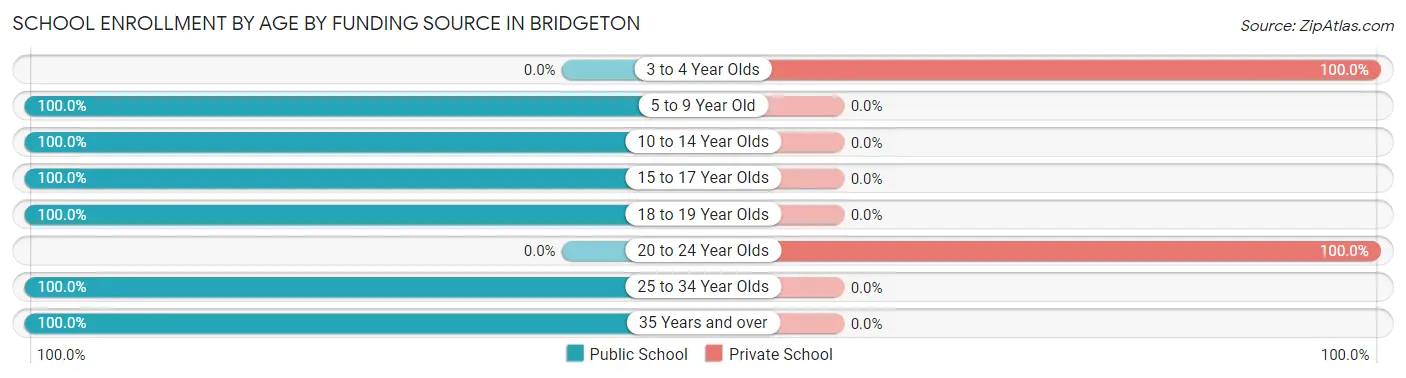
| Age Bracket | Public School | Private School |
| 3 to 4 Year Olds | 0 (0.0%) | 13 (100.0%) |
| 5 to 9 Year Old | 64 (100.0%) | 0 (0.0%) |
| 10 to 14 Year Olds | 53 (100.0%) | 0 (0.0%) |
| 15 to 17 Year Olds | 3 (100.0%) | 0 (0.0%) |
| 18 to 19 Year Olds | 5 (100.0%) | 0 (0.0%) |
| 20 to 24 Year Olds | 0 (0.0%) | 9 (100.0%) |
| 25 to 34 Year Olds | 9 (100.0%) | 0 (0.0%) |
| 35 Years and over | 2 (100.0%) | 0 (0.0%) |
| Total | 136 (86.1%) | 22 (13.9%) |
Educational Attainment by Field of Study in Bridgeton
Education (58 | 45.7%), engineering (31 | 24.4%), business (8 | 6.3%), communications (8 | 6.3%), and liberal arts & history (7 | 5.5%) are the most common fields of study among 127 individuals in Bridgeton who have obtained a bachelor's degree or higher.
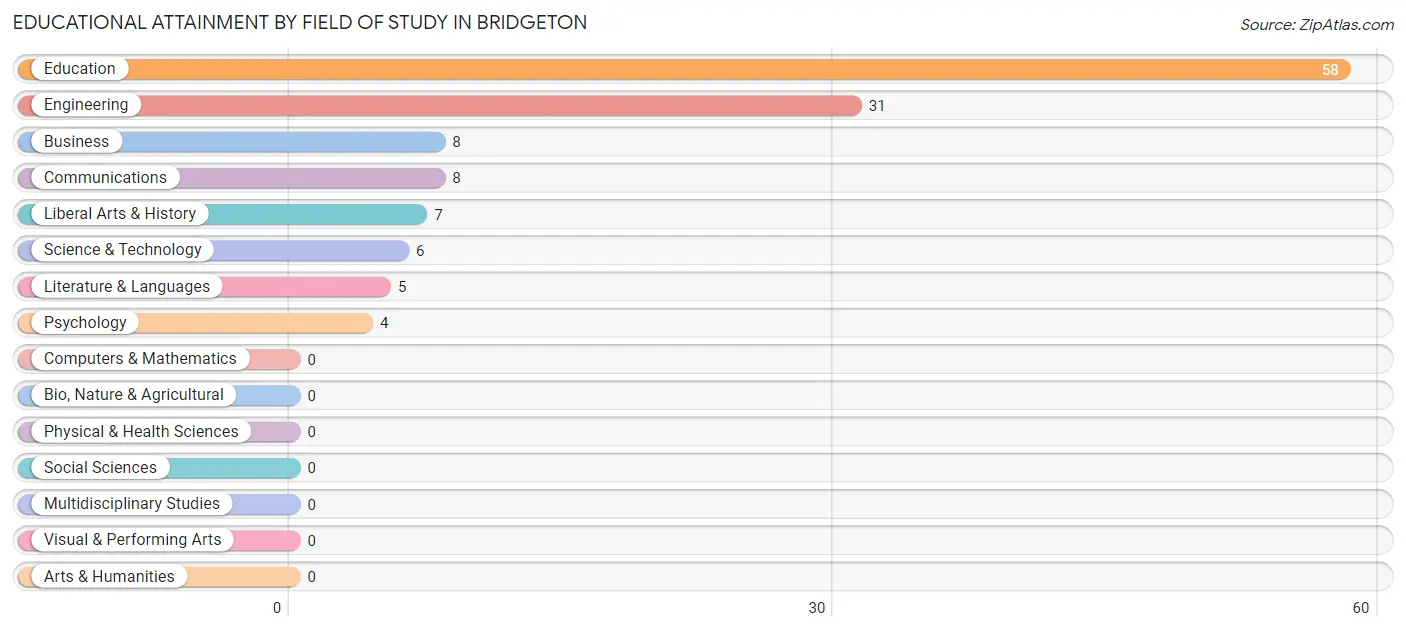
| Field of Study | # Graduates | % Graduates |
| Computers & Mathematics | 0 | 0.0% |
| Bio, Nature & Agricultural | 0 | 0.0% |
| Physical & Health Sciences | 0 | 0.0% |
| Psychology | 4 | 3.2% |
| Social Sciences | 0 | 0.0% |
| Engineering | 31 | 24.4% |
| Multidisciplinary Studies | 0 | 0.0% |
| Science & Technology | 6 | 4.7% |
| Business | 8 | 6.3% |
| Education | 58 | 45.7% |
| Literature & Languages | 5 | 3.9% |
| Liberal Arts & History | 7 | 5.5% |
| Visual & Performing Arts | 0 | 0.0% |
| Communications | 8 | 6.3% |
| Arts & Humanities | 0 | 0.0% |
| Total | 127 | 100.0% |
Transportation & Commute in Bridgeton
Vehicle Availability by Sex in Bridgeton
The most prevalent vehicle ownership categories in Bridgeton are males with 2 vehicles (58, accounting for 62.4%) and females with 2 vehicles (38, making up 65.2%).
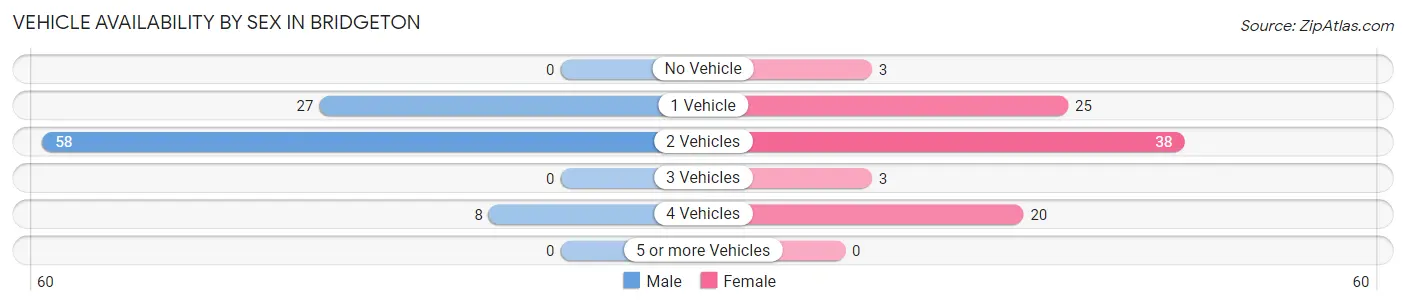
| Vehicles Available | Male | Female |
| No Vehicle | 0 (0.0%) | 3 (3.4%) |
| 1 Vehicle | 27 (29.0%) | 25 (28.1%) |
| 2 Vehicles | 58 (62.4%) | 38 (42.7%) |
| 3 Vehicles | 0 (0.0%) | 3 (3.4%) |
| 4 Vehicles | 8 (8.6%) | 20 (22.5%) |
| 5 or more Vehicles | 0 (0.0%) | 0 (0.0%) |
| Total | 93 (100.0%) | 89 (100.0%) |
Commute Time in Bridgeton
The most frequently occuring commute durations in Bridgeton are 30 to 34 minutes (59 commuters, 34.7%), 10 to 14 minutes (48 commuters, 28.2%), and 15 to 19 minutes (34 commuters, 20.0%).
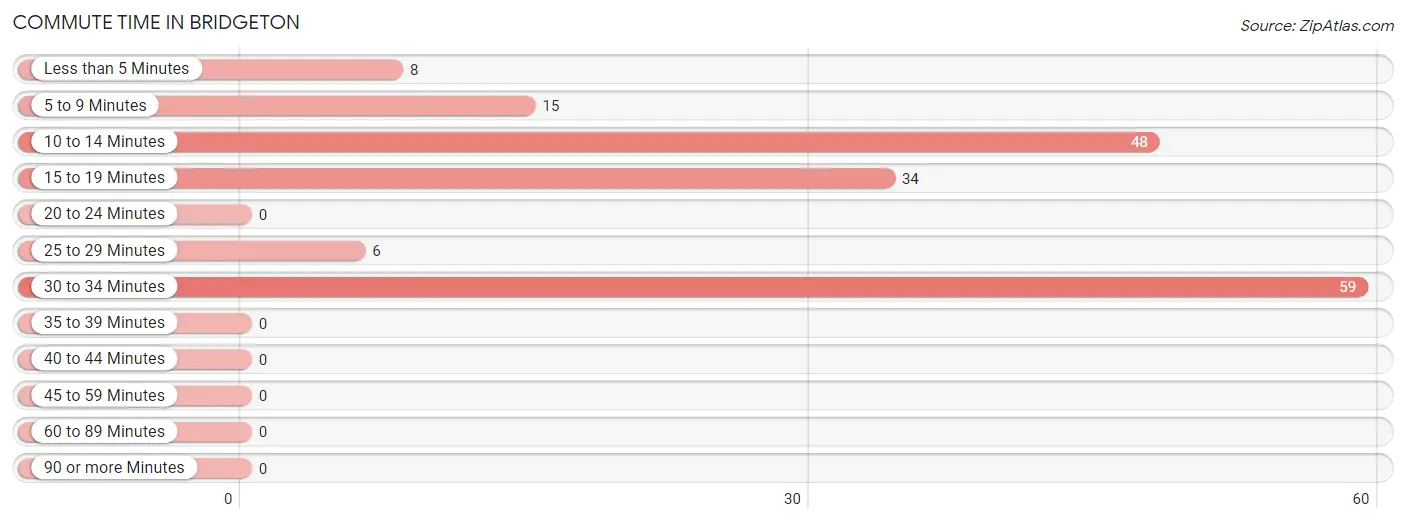
| Commute Time | # Commuters | % Commuters |
| Less than 5 Minutes | 8 | 4.7% |
| 5 to 9 Minutes | 15 | 8.8% |
| 10 to 14 Minutes | 48 | 28.2% |
| 15 to 19 Minutes | 34 | 20.0% |
| 20 to 24 Minutes | 0 | 0.0% |
| 25 to 29 Minutes | 6 | 3.5% |
| 30 to 34 Minutes | 59 | 34.7% |
| 35 to 39 Minutes | 0 | 0.0% |
| 40 to 44 Minutes | 0 | 0.0% |
| 45 to 59 Minutes | 0 | 0.0% |
| 60 to 89 Minutes | 0 | 0.0% |
| 90 or more Minutes | 0 | 0.0% |
Commute Time by Sex in Bridgeton
The most common commute times in Bridgeton are 30 to 34 minutes (49 commuters, 60.5%) for males and 10 to 14 minutes (42 commuters, 47.2%) for females.
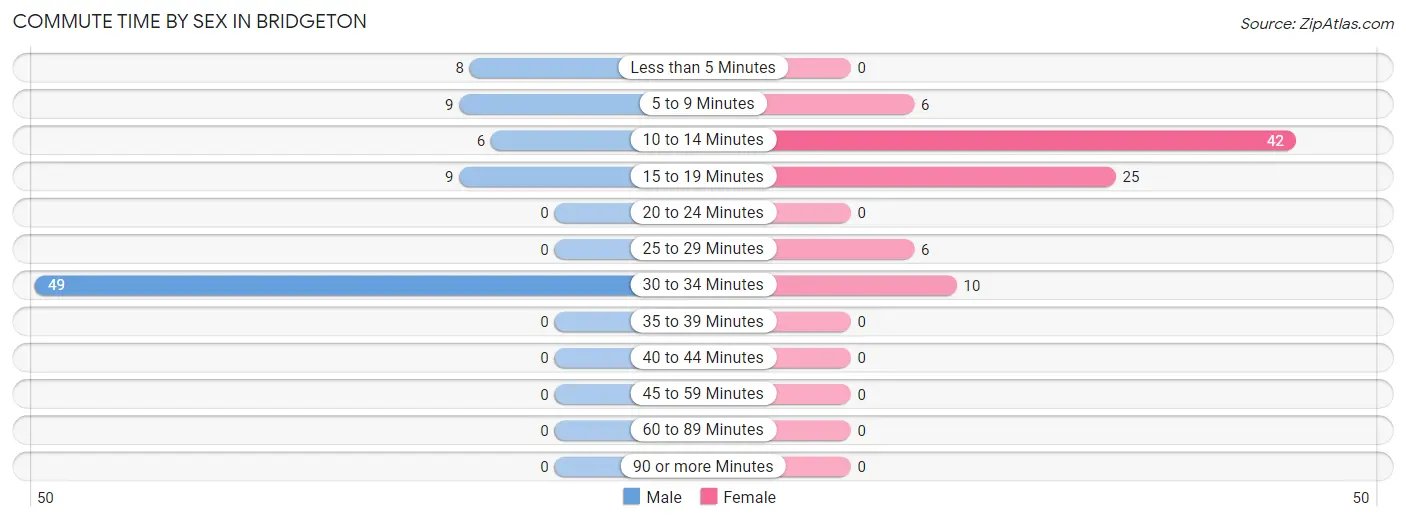
| Commute Time | Male | Female |
| Less than 5 Minutes | 8 (9.9%) | 0 (0.0%) |
| 5 to 9 Minutes | 9 (11.1%) | 6 (6.7%) |
| 10 to 14 Minutes | 6 (7.4%) | 42 (47.2%) |
| 15 to 19 Minutes | 9 (11.1%) | 25 (28.1%) |
| 20 to 24 Minutes | 0 (0.0%) | 0 (0.0%) |
| 25 to 29 Minutes | 0 (0.0%) | 6 (6.7%) |
| 30 to 34 Minutes | 49 (60.5%) | 10 (11.2%) |
| 35 to 39 Minutes | 0 (0.0%) | 0 (0.0%) |
| 40 to 44 Minutes | 0 (0.0%) | 0 (0.0%) |
| 45 to 59 Minutes | 0 (0.0%) | 0 (0.0%) |
| 60 to 89 Minutes | 0 (0.0%) | 0 (0.0%) |
| 90 or more Minutes | 0 (0.0%) | 0 (0.0%) |
Time of Departure to Work by Sex in Bridgeton
The most frequent times of departure to work in Bridgeton are 6:30 AM to 6:59 AM (32, 39.5%) for males and 8:00 AM to 8:29 AM (26, 29.2%) for females.
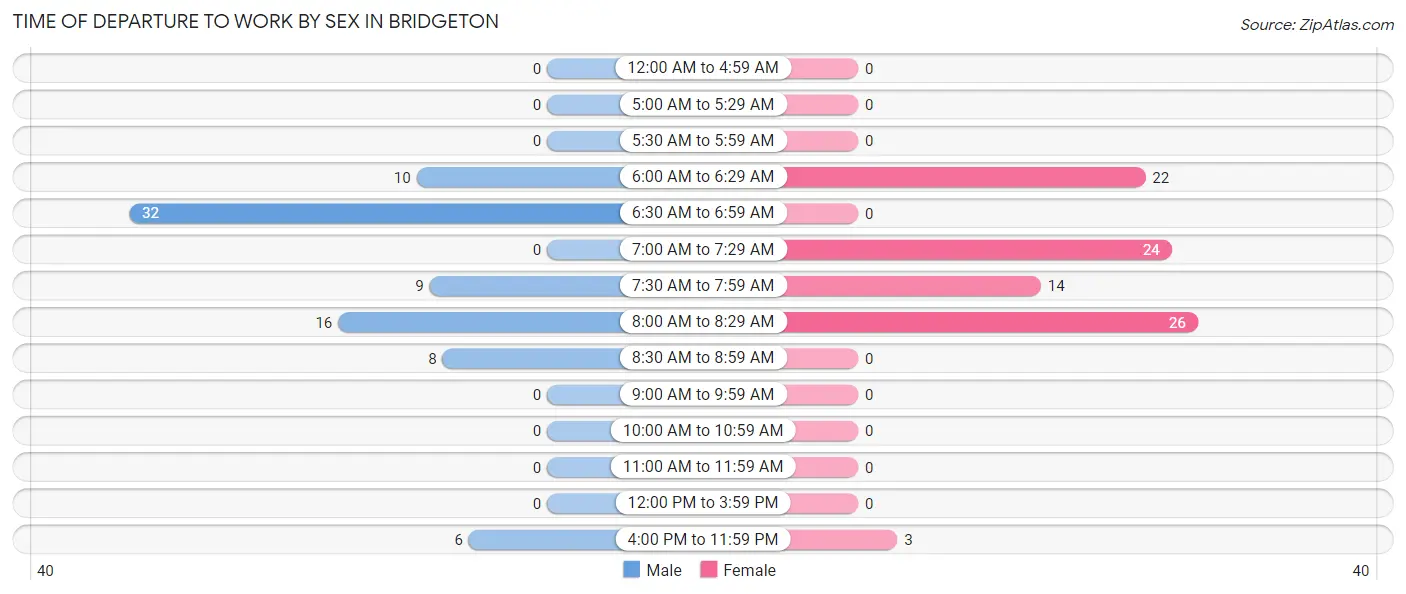
| Time of Departure | Male | Female |
| 12:00 AM to 4:59 AM | 0 (0.0%) | 0 (0.0%) |
| 5:00 AM to 5:29 AM | 0 (0.0%) | 0 (0.0%) |
| 5:30 AM to 5:59 AM | 0 (0.0%) | 0 (0.0%) |
| 6:00 AM to 6:29 AM | 10 (12.3%) | 22 (24.7%) |
| 6:30 AM to 6:59 AM | 32 (39.5%) | 0 (0.0%) |
| 7:00 AM to 7:29 AM | 0 (0.0%) | 24 (27.0%) |
| 7:30 AM to 7:59 AM | 9 (11.1%) | 14 (15.7%) |
| 8:00 AM to 8:29 AM | 16 (19.8%) | 26 (29.2%) |
| 8:30 AM to 8:59 AM | 8 (9.9%) | 0 (0.0%) |
| 9:00 AM to 9:59 AM | 0 (0.0%) | 0 (0.0%) |
| 10:00 AM to 10:59 AM | 0 (0.0%) | 0 (0.0%) |
| 11:00 AM to 11:59 AM | 0 (0.0%) | 0 (0.0%) |
| 12:00 PM to 3:59 PM | 0 (0.0%) | 0 (0.0%) |
| 4:00 PM to 11:59 PM | 6 (7.4%) | 3 (3.4%) |
| Total | 81 (100.0%) | 89 (100.0%) |
Housing Occupancy in Bridgeton
Occupancy by Ownership in Bridgeton
Of the total 201 dwellings in Bridgeton, owner-occupied units account for 141 (70.2%), while renter-occupied units make up 60 (29.8%).
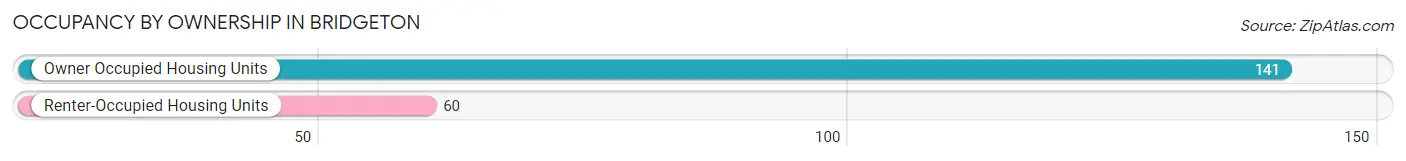
| Occupancy | # Housing Units | % Housing Units |
| Owner Occupied Housing Units | 141 | 70.2% |
| Renter-Occupied Housing Units | 60 | 29.8% |
| Total Occupied Housing Units | 201 | 100.0% |
Occupancy by Household Size in Bridgeton
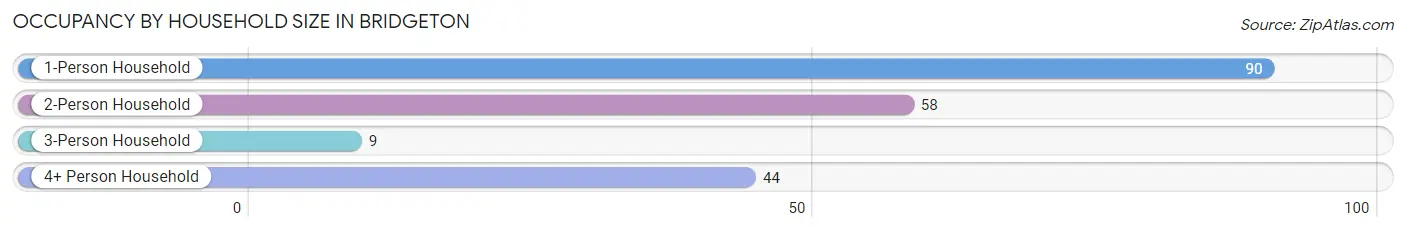
| Household Size | # Housing Units | % Housing Units |
| 1-Person Household | 90 | 44.8% |
| 2-Person Household | 58 | 28.9% |
| 3-Person Household | 9 | 4.5% |
| 4+ Person Household | 44 | 21.9% |
| Total Housing Units | 201 | 100.0% |
Occupancy by Ownership by Household Size in Bridgeton
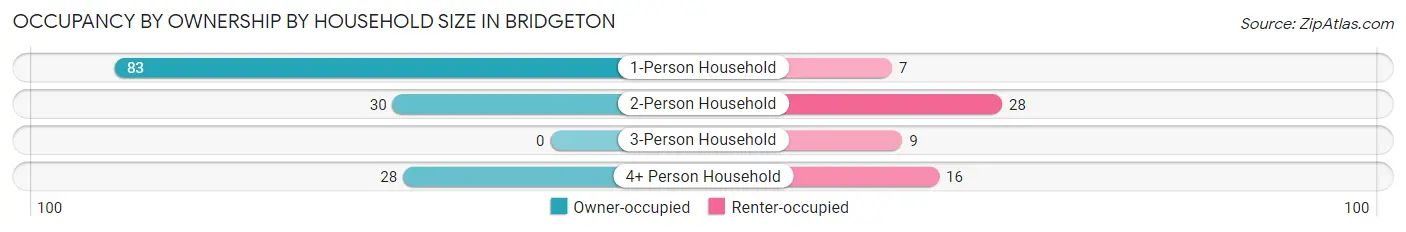
| Household Size | Owner-occupied | Renter-occupied |
| 1-Person Household | 83 (92.2%) | 7 (7.8%) |
| 2-Person Household | 30 (51.7%) | 28 (48.3%) |
| 3-Person Household | 0 (0.0%) | 9 (100.0%) |
| 4+ Person Household | 28 (63.6%) | 16 (36.4%) |
| Total Housing Units | 141 (70.2%) | 60 (29.8%) |
Occupancy by Educational Attainment in Bridgeton
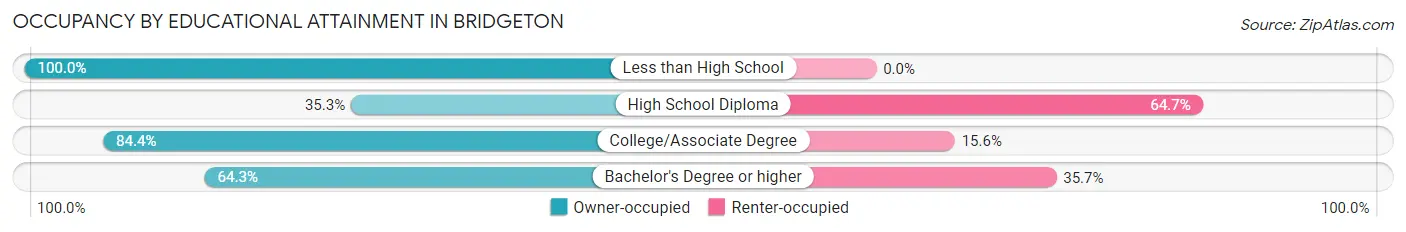
| Household Size | Owner-occupied | Renter-occupied |
| Less than High School | 31 (100.0%) | 0 (0.0%) |
| High School Diploma | 18 (35.3%) | 33 (64.7%) |
| College/Associate Degree | 65 (84.4%) | 12 (15.6%) |
| Bachelor's Degree or higher | 27 (64.3%) | 15 (35.7%) |
Occupancy by Age of Householder in Bridgeton
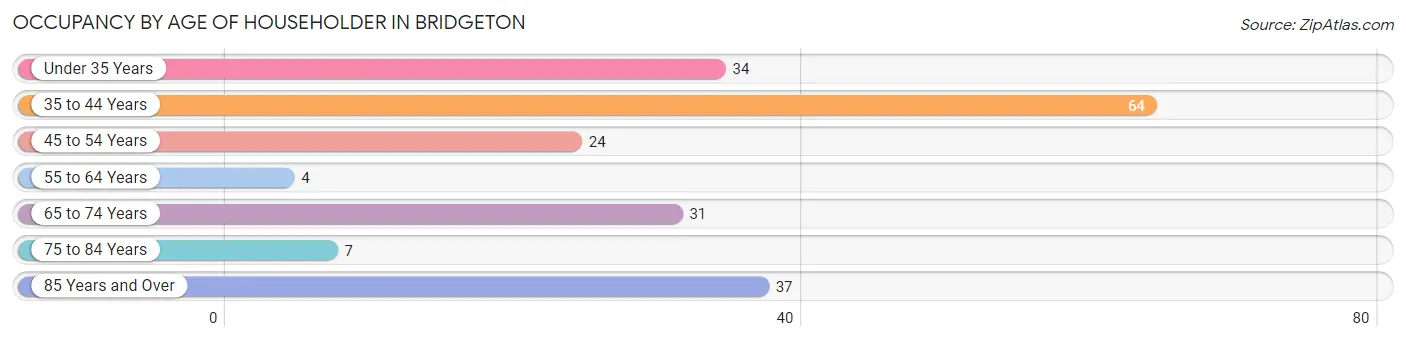
| Age Bracket | # Households | % Households |
| Under 35 Years | 34 | 16.9% |
| 35 to 44 Years | 64 | 31.8% |
| 45 to 54 Years | 24 | 11.9% |
| 55 to 64 Years | 4 | 2.0% |
| 65 to 74 Years | 31 | 15.4% |
| 75 to 84 Years | 7 | 3.5% |
| 85 Years and Over | 37 | 18.4% |
| Total | 201 | 100.0% |
Housing Finances in Bridgeton
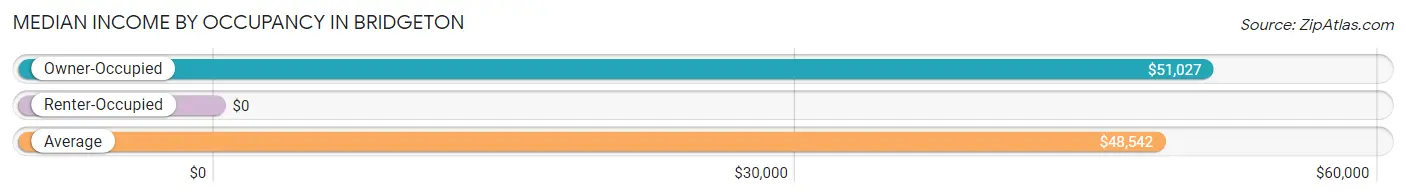
Median Income by Occupancy in Bridgeton
| Occupancy Type | # Households | Median Income |
| Owner-Occupied | 141 (70.2%) | $51,027 |
| Renter-Occupied | 60 (29.8%) | $0 |
| Average | 201 (100.0%) | $48,542 |
Occupancy by Householder Income Bracket in Bridgeton
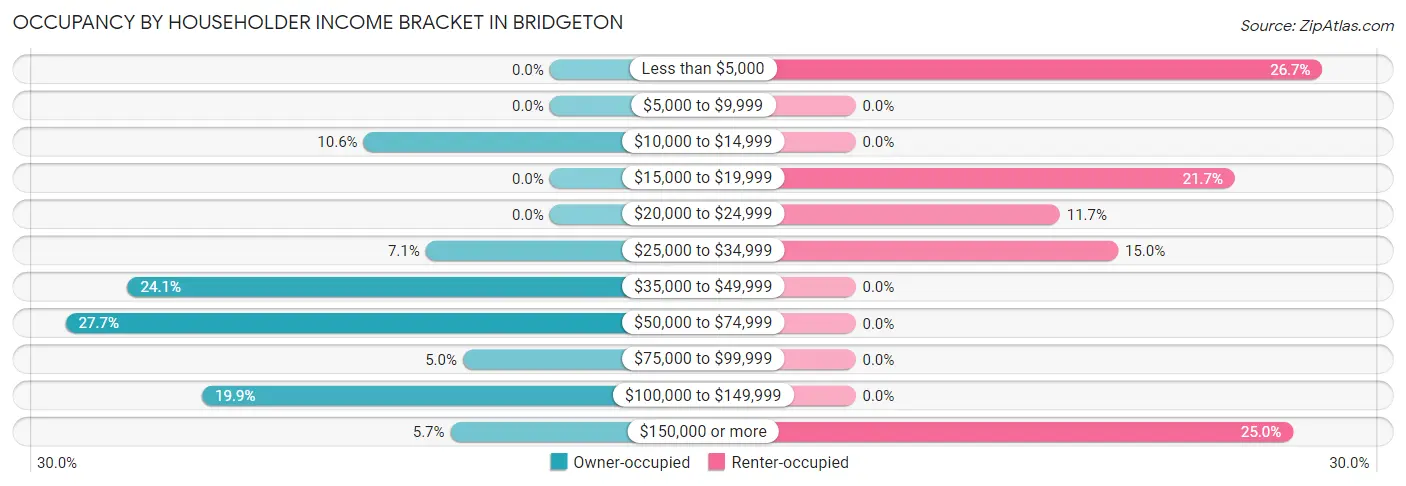
| Income Bracket | Owner-occupied | Renter-occupied |
| Less than $5,000 | 0 (0.0%) | 16 (26.7%) |
| $5,000 to $9,999 | 0 (0.0%) | 0 (0.0%) |
| $10,000 to $14,999 | 15 (10.6%) | 0 (0.0%) |
| $15,000 to $19,999 | 0 (0.0%) | 13 (21.7%) |
| $20,000 to $24,999 | 0 (0.0%) | 7 (11.7%) |
| $25,000 to $34,999 | 10 (7.1%) | 9 (15.0%) |
| $35,000 to $49,999 | 34 (24.1%) | 0 (0.0%) |
| $50,000 to $74,999 | 39 (27.7%) | 0 (0.0%) |
| $75,000 to $99,999 | 7 (5.0%) | 0 (0.0%) |
| $100,000 to $149,999 | 28 (19.9%) | 0 (0.0%) |
| $150,000 or more | 8 (5.7%) | 15 (25.0%) |
| Total | 141 (100.0%) | 60 (100.0%) |
Monthly Housing Cost Tiers in Bridgeton
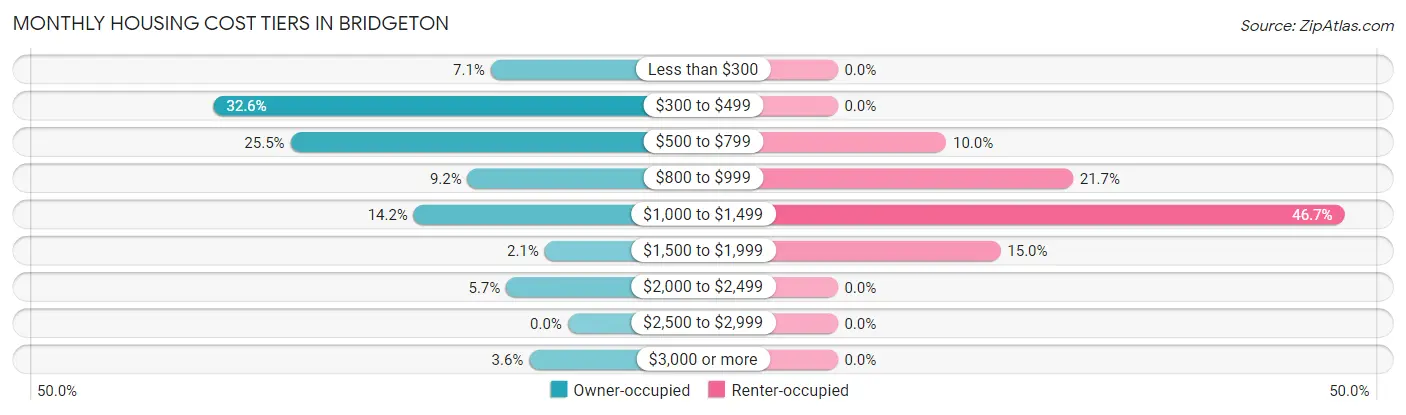
| Monthly Cost | Owner-occupied | Renter-occupied |
| Less than $300 | 10 (7.1%) | 0 (0.0%) |
| $300 to $499 | 46 (32.6%) | 0 (0.0%) |
| $500 to $799 | 36 (25.5%) | 6 (10.0%) |
| $800 to $999 | 13 (9.2%) | 13 (21.7%) |
| $1,000 to $1,499 | 20 (14.2%) | 28 (46.7%) |
| $1,500 to $1,999 | 3 (2.1%) | 9 (15.0%) |
| $2,000 to $2,499 | 8 (5.7%) | 0 (0.0%) |
| $2,500 to $2,999 | 0 (0.0%) | 0 (0.0%) |
| $3,000 or more | 5 (3.5%) | 0 (0.0%) |
| Total | 141 (100.0%) | 60 (100.0%) |
Physical Housing Characteristics in Bridgeton
Housing Structures in Bridgeton
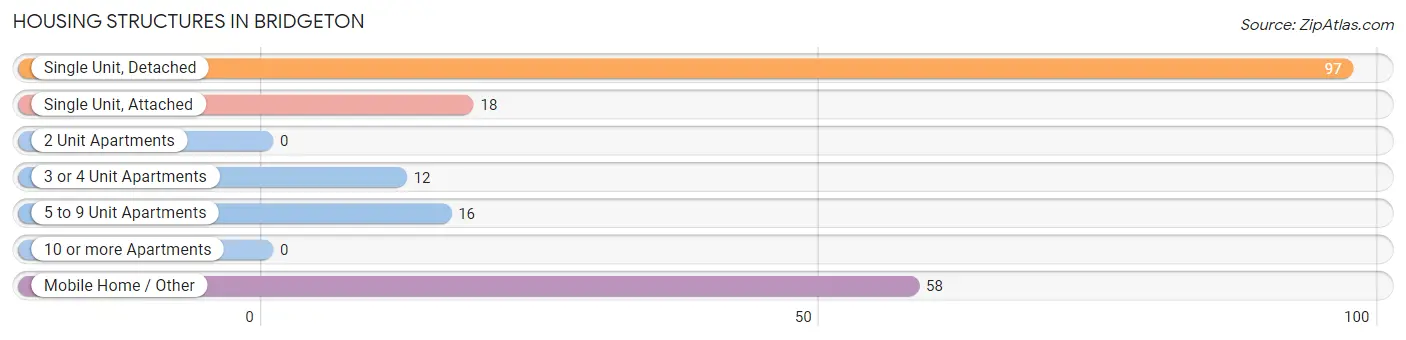
| Structure Type | # Housing Units | % Housing Units |
| Single Unit, Detached | 97 | 48.3% |
| Single Unit, Attached | 18 | 9.0% |
| 2 Unit Apartments | 0 | 0.0% |
| 3 or 4 Unit Apartments | 12 | 6.0% |
| 5 to 9 Unit Apartments | 16 | 8.0% |
| 10 or more Apartments | 0 | 0.0% |
| Mobile Home / Other | 58 | 28.9% |
| Total | 201 | 100.0% |
Housing Structures by Occupancy in Bridgeton
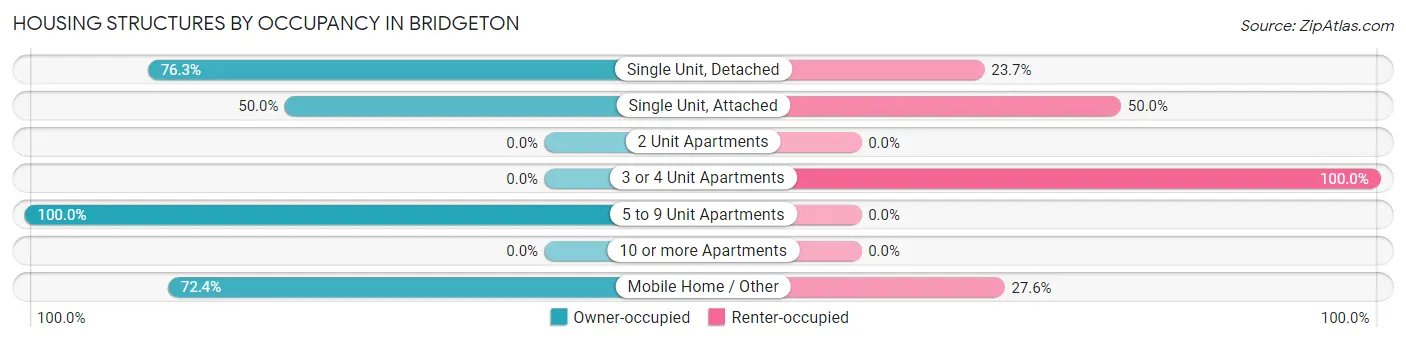
| Structure Type | Owner-occupied | Renter-occupied |
| Single Unit, Detached | 74 (76.3%) | 23 (23.7%) |
| Single Unit, Attached | 9 (50.0%) | 9 (50.0%) |
| 2 Unit Apartments | 0 (0.0%) | 0 (0.0%) |
| 3 or 4 Unit Apartments | 0 (0.0%) | 12 (100.0%) |
| 5 to 9 Unit Apartments | 16 (100.0%) | 0 (0.0%) |
| 10 or more Apartments | 0 (0.0%) | 0 (0.0%) |
| Mobile Home / Other | 42 (72.4%) | 16 (27.6%) |
| Total | 141 (70.2%) | 60 (29.8%) |
Housing Structures by Number of Rooms in Bridgeton
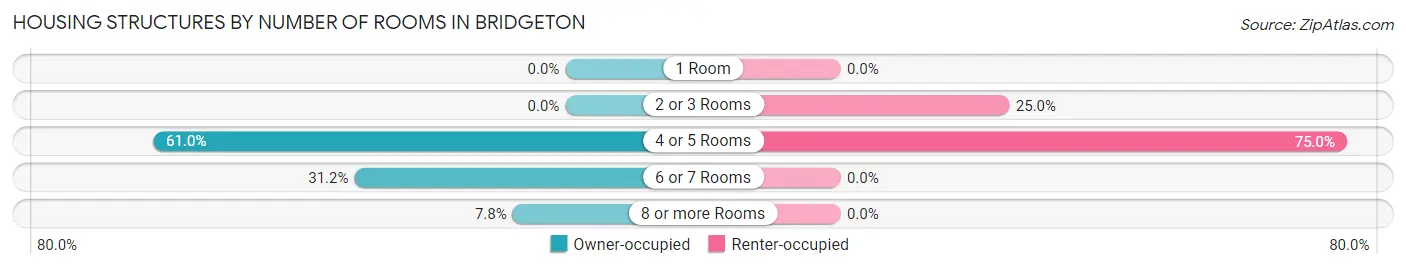
| Number of Rooms | Owner-occupied | Renter-occupied |
| 1 Room | 0 (0.0%) | 0 (0.0%) |
| 2 or 3 Rooms | 0 (0.0%) | 15 (25.0%) |
| 4 or 5 Rooms | 86 (61.0%) | 45 (75.0%) |
| 6 or 7 Rooms | 44 (31.2%) | 0 (0.0%) |
| 8 or more Rooms | 11 (7.8%) | 0 (0.0%) |
| Total | 141 (100.0%) | 60 (100.0%) |
Housing Structure by Heating Type in Bridgeton
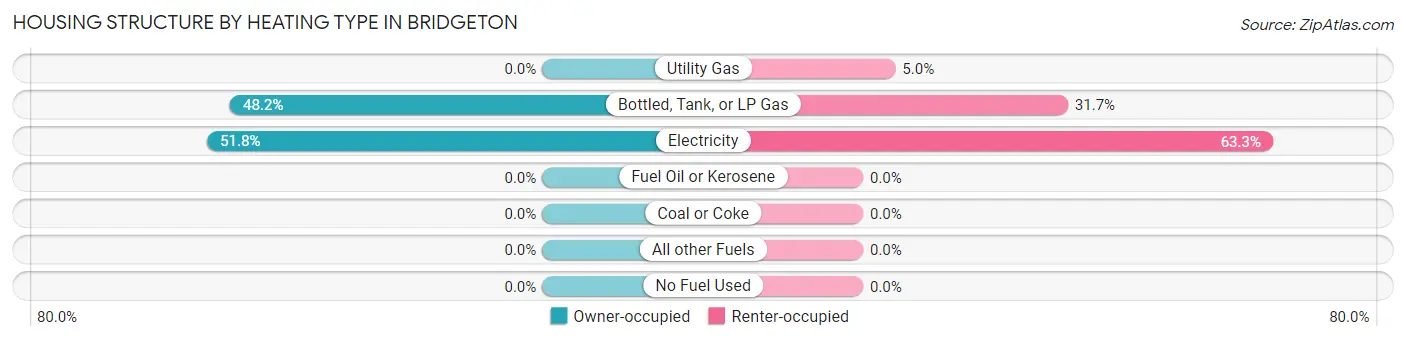
| Heating Type | Owner-occupied | Renter-occupied |
| Utility Gas | 0 (0.0%) | 3 (5.0%) |
| Bottled, Tank, or LP Gas | 68 (48.2%) | 19 (31.7%) |
| Electricity | 73 (51.8%) | 38 (63.3%) |
| Fuel Oil or Kerosene | 0 (0.0%) | 0 (0.0%) |
| Coal or Coke | 0 (0.0%) | 0 (0.0%) |
| All other Fuels | 0 (0.0%) | 0 (0.0%) |
| No Fuel Used | 0 (0.0%) | 0 (0.0%) |
| Total | 141 (100.0%) | 60 (100.0%) |
Household Vehicle Usage in Bridgeton
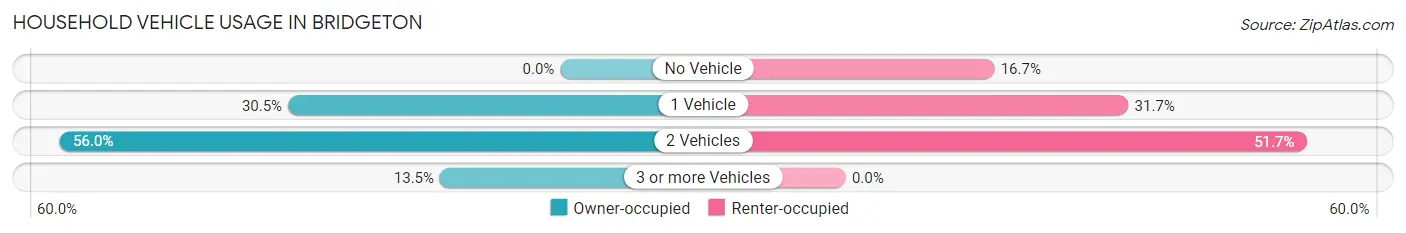
| Vehicles per Household | Owner-occupied | Renter-occupied |
| No Vehicle | 0 (0.0%) | 10 (16.7%) |
| 1 Vehicle | 43 (30.5%) | 19 (31.7%) |
| 2 Vehicles | 79 (56.0%) | 31 (51.7%) |
| 3 or more Vehicles | 19 (13.5%) | 0 (0.0%) |
| Total | 141 (100.0%) | 60 (100.0%) |
Real Estate & Mortgages in Bridgeton
Real Estate and Mortgage Overview in Bridgeton
| Characteristic | Without Mortgage | With Mortgage |
| Housing Units | 92 | 49 |
| Median Property Value | $104,700 | $176,000 |
| Median Household Income | $40,000 | $8 |
| Monthly Housing Costs | $409 | $5 |
| Real Estate Taxes | $1,269 | $0 |
Property Value by Mortgage Status in Bridgeton
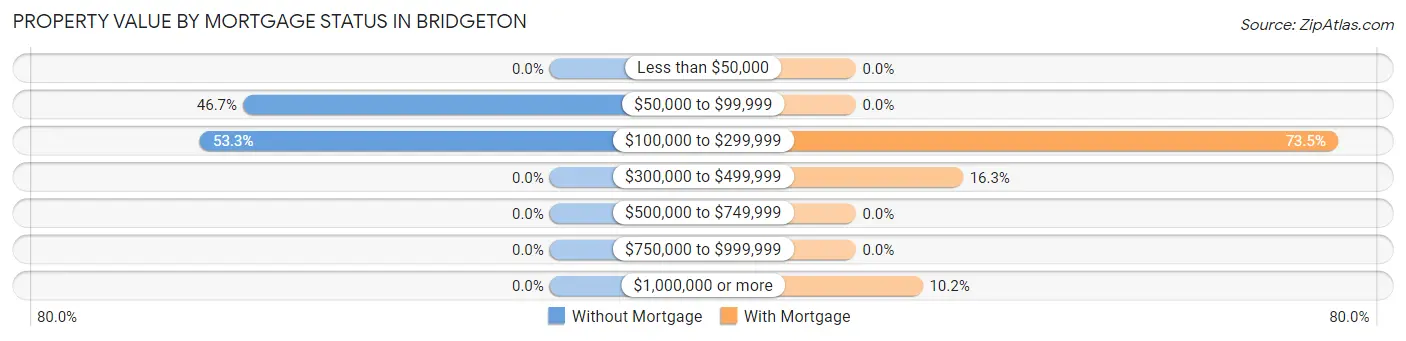
| Property Value | Without Mortgage | With Mortgage |
| Less than $50,000 | 0 (0.0%) | 0 (0.0%) |
| $50,000 to $99,999 | 43 (46.7%) | 0 (0.0%) |
| $100,000 to $299,999 | 49 (53.3%) | 36 (73.5%) |
| $300,000 to $499,999 | 0 (0.0%) | 8 (16.3%) |
| $500,000 to $749,999 | 0 (0.0%) | 0 (0.0%) |
| $750,000 to $999,999 | 0 (0.0%) | 0 (0.0%) |
| $1,000,000 or more | 0 (0.0%) | 5 (10.2%) |
| Total | 92 (100.0%) | 49 (100.0%) |
Household Income by Mortgage Status in Bridgeton
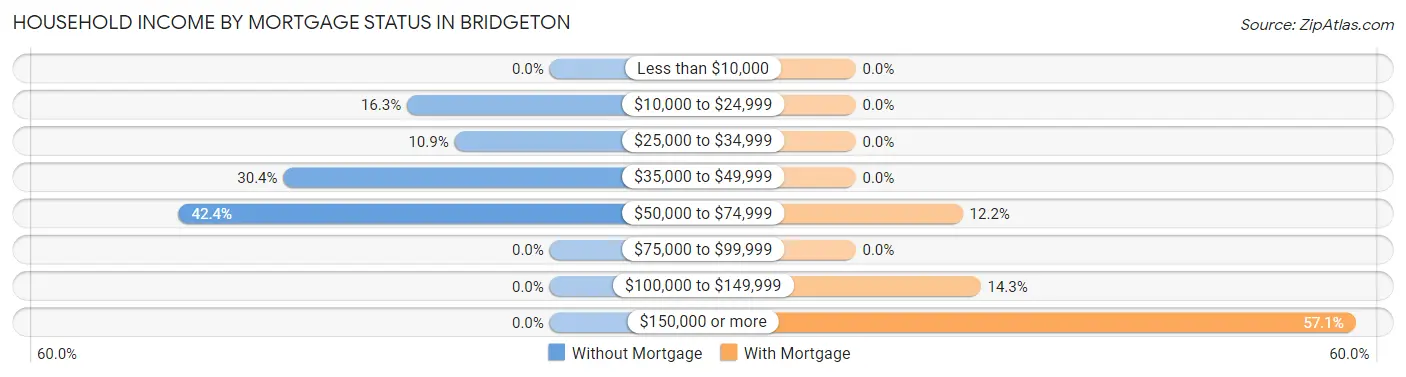
| Household Income | Without Mortgage | With Mortgage |
| Less than $10,000 | 0 (0.0%) | 0 (0.0%) |
| $10,000 to $24,999 | 15 (16.3%) | 0 (0.0%) |
| $25,000 to $34,999 | 10 (10.9%) | 0 (0.0%) |
| $35,000 to $49,999 | 28 (30.4%) | 0 (0.0%) |
| $50,000 to $74,999 | 39 (42.4%) | 6 (12.2%) |
| $75,000 to $99,999 | 0 (0.0%) | 0 (0.0%) |
| $100,000 to $149,999 | 0 (0.0%) | 7 (14.3%) |
| $150,000 or more | 0 (0.0%) | 28 (57.1%) |
| Total | 92 (100.0%) | 49 (100.0%) |
Property Value to Household Income Ratio in Bridgeton
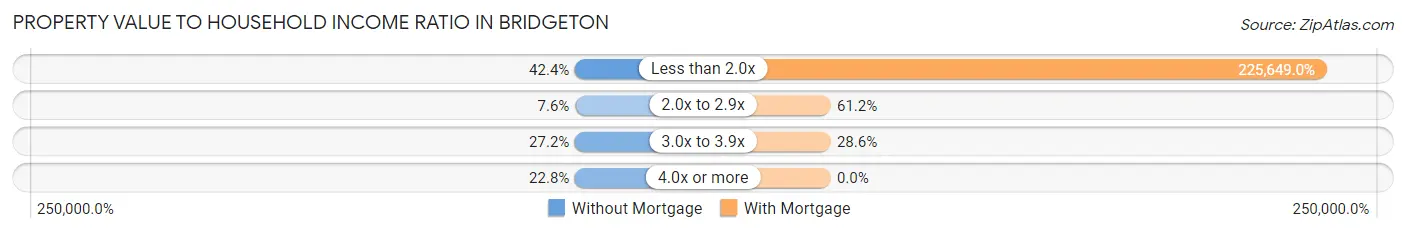
| Value-to-Income Ratio | Without Mortgage | With Mortgage |
| Less than 2.0x | 39 (42.4%) | 110,568 (225,649.0%) |
| 2.0x to 2.9x | 7 (7.6%) | 30 (61.2%) |
| 3.0x to 3.9x | 25 (27.2%) | 14 (28.6%) |
| 4.0x or more | 21 (22.8%) | 0 (0.0%) |
| Total | 92 (100.0%) | 49 (100.0%) |
Real Estate Taxes by Mortgage Status in Bridgeton
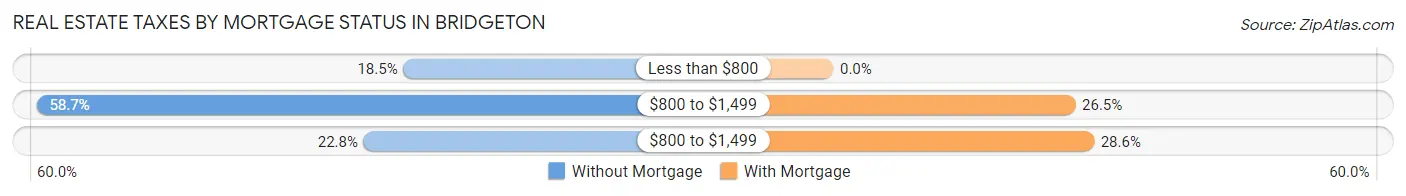
| Property Taxes | Without Mortgage | With Mortgage |
| Less than $800 | 17 (18.5%) | 0 (0.0%) |
| $800 to $1,499 | 54 (58.7%) | 13 (26.5%) |
| $800 to $1,499 | 21 (22.8%) | 14 (28.6%) |
| Total | 92 (100.0%) | 49 (100.0%) |
Health & Disability in Bridgeton
Health Insurance Coverage by Age in Bridgeton
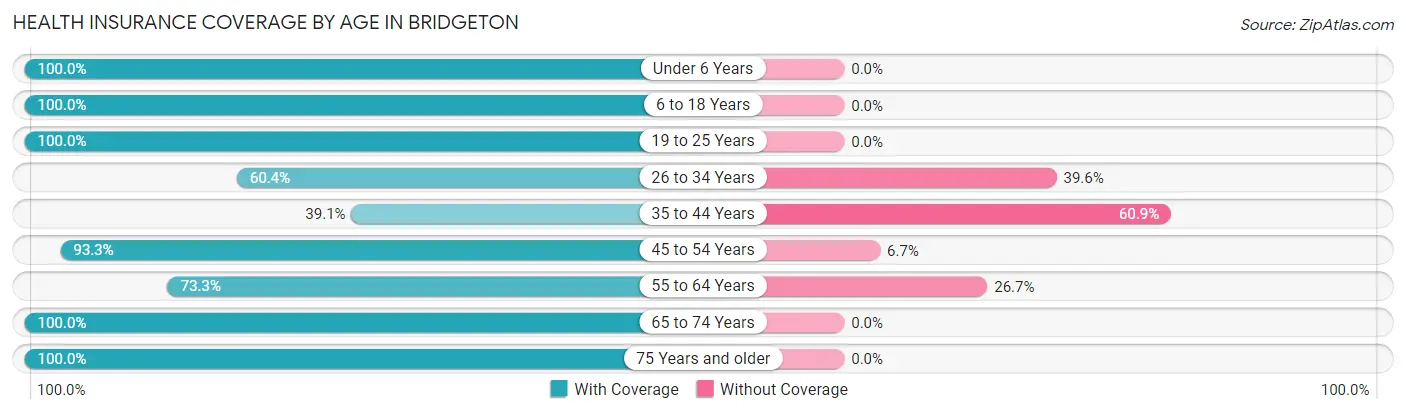
| Age Bracket | With Coverage | Without Coverage |
| Under 6 Years | 64 (100.0%) | 0 (0.0%) |
| 6 to 18 Years | 120 (100.0%) | 0 (0.0%) |
| 19 to 25 Years | 23 (100.0%) | 0 (0.0%) |
| 26 to 34 Years | 29 (60.4%) | 19 (39.6%) |
| 35 to 44 Years | 50 (39.1%) | 78 (60.9%) |
| 45 to 54 Years | 42 (93.3%) | 3 (6.7%) |
| 55 to 64 Years | 11 (73.3%) | 4 (26.7%) |
| 65 to 74 Years | 35 (100.0%) | 0 (0.0%) |
| 75 Years and older | 44 (100.0%) | 0 (0.0%) |
| Total | 418 (80.1%) | 104 (19.9%) |
Health Insurance Coverage by Citizenship Status in Bridgeton
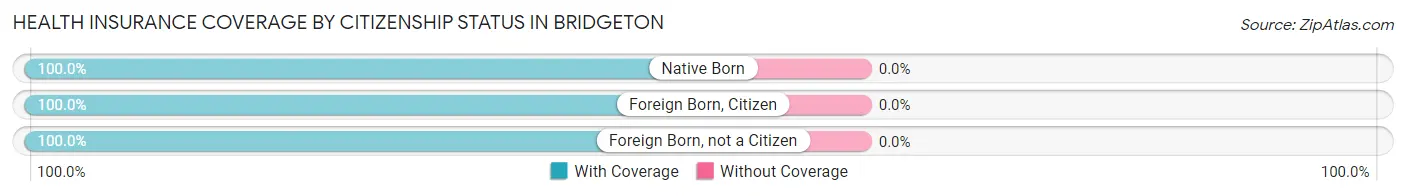
| Citizenship Status | With Coverage | Without Coverage |
| Native Born | 64 (100.0%) | 0 (0.0%) |
| Foreign Born, Citizen | 120 (100.0%) | 0 (0.0%) |
| Foreign Born, not a Citizen | 23 (100.0%) | 0 (0.0%) |
Health Insurance Coverage by Household Income in Bridgeton
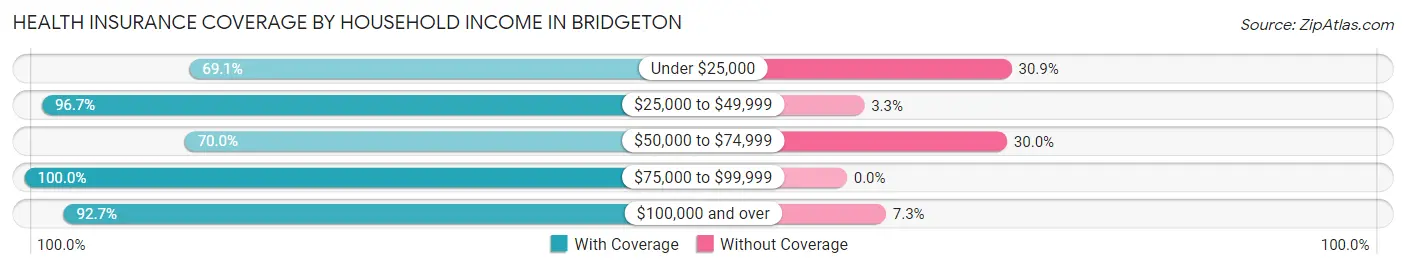
| Household Income | With Coverage | Without Coverage |
| Under $25,000 | 159 (69.1%) | 71 (30.9%) |
| $25,000 to $49,999 | 89 (96.7%) | 3 (3.3%) |
| $50,000 to $74,999 | 49 (70.0%) | 21 (30.0%) |
| $75,000 to $99,999 | 7 (100.0%) | 0 (0.0%) |
| $100,000 and over | 114 (92.7%) | 9 (7.3%) |
Public vs Private Health Insurance Coverage by Age in Bridgeton
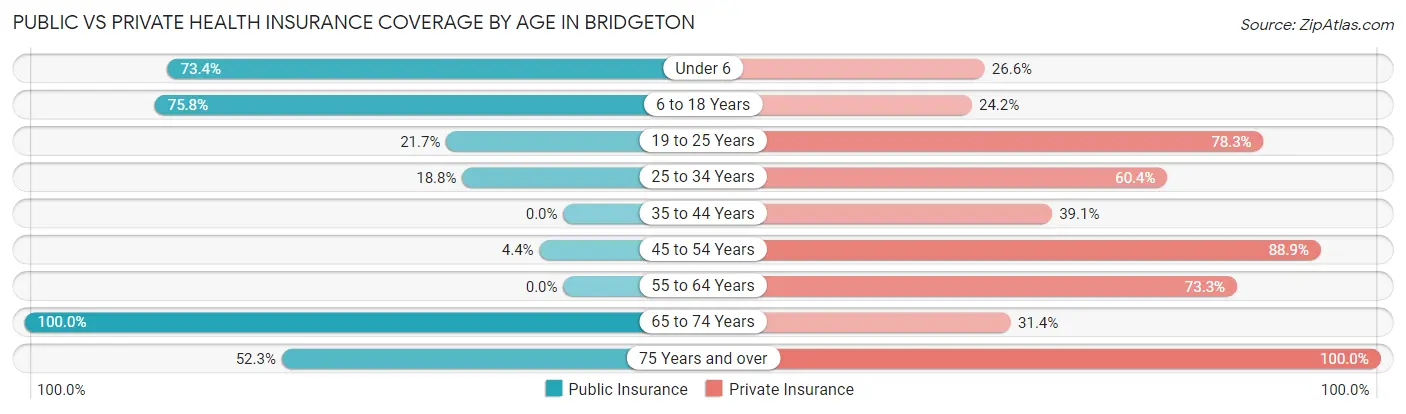
| Age Bracket | Public Insurance | Private Insurance |
| Under 6 | 47 (73.4%) | 17 (26.6%) |
| 6 to 18 Years | 91 (75.8%) | 29 (24.2%) |
| 19 to 25 Years | 5 (21.7%) | 18 (78.3%) |
| 25 to 34 Years | 9 (18.8%) | 29 (60.4%) |
| 35 to 44 Years | 0 (0.0%) | 50 (39.1%) |
| 45 to 54 Years | 2 (4.4%) | 40 (88.9%) |
| 55 to 64 Years | 0 (0.0%) | 11 (73.3%) |
| 65 to 74 Years | 35 (100.0%) | 11 (31.4%) |
| 75 Years and over | 23 (52.3%) | 44 (100.0%) |
| Total | 212 (40.6%) | 249 (47.7%) |
Disability Status by Sex by Age in Bridgeton
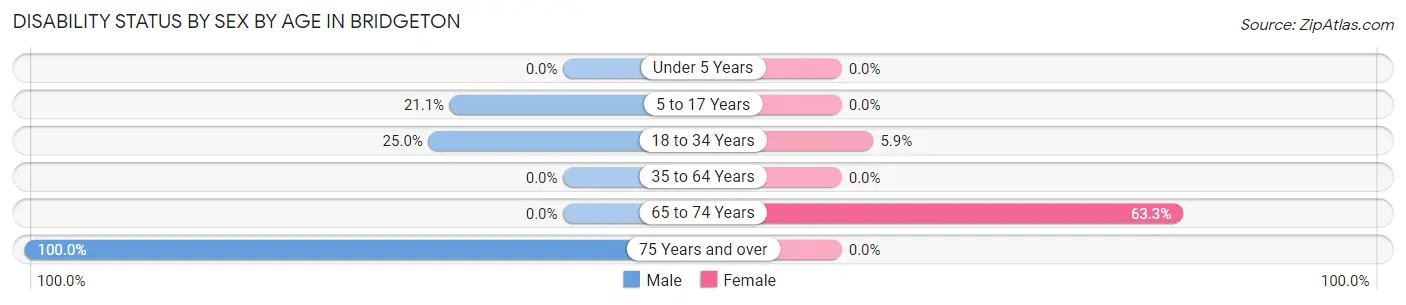
| Age Bracket | Male | Female |
| Under 5 Years | 0 (0.0%) | 0 (0.0%) |
| 5 to 17 Years | 8 (21.0%) | 0 (0.0%) |
| 18 to 34 Years | 5 (25.0%) | 3 (5.9%) |
| 35 to 64 Years | 0 (0.0%) | 0 (0.0%) |
| 65 to 74 Years | 0 (0.0%) | 19 (63.3%) |
| 75 Years and over | 28 (100.0%) | 0 (0.0%) |
Disability Class by Sex by Age in Bridgeton
Disability Class: Hearing Difficulty
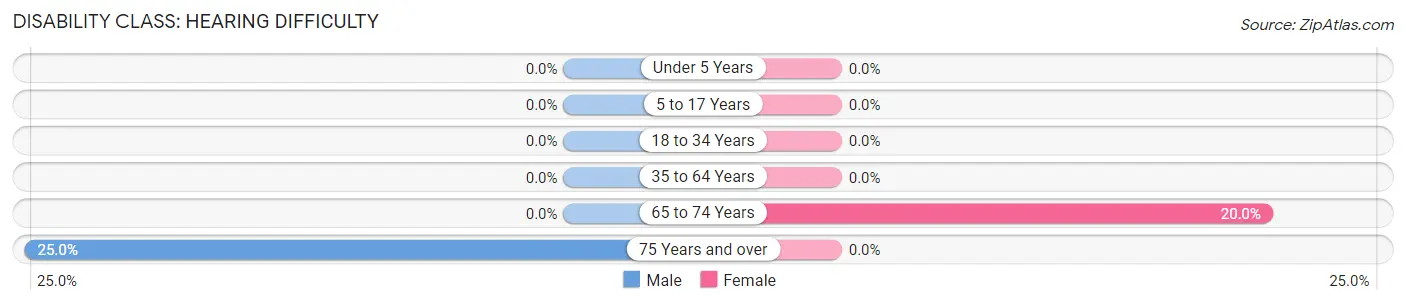
| Age Bracket | Male | Female |
| Under 5 Years | 0 (0.0%) | 0 (0.0%) |
| 5 to 17 Years | 0 (0.0%) | 0 (0.0%) |
| 18 to 34 Years | 0 (0.0%) | 0 (0.0%) |
| 35 to 64 Years | 0 (0.0%) | 0 (0.0%) |
| 65 to 74 Years | 0 (0.0%) | 6 (20.0%) |
| 75 Years and over | 7 (25.0%) | 0 (0.0%) |
Disability Class: Vision Difficulty
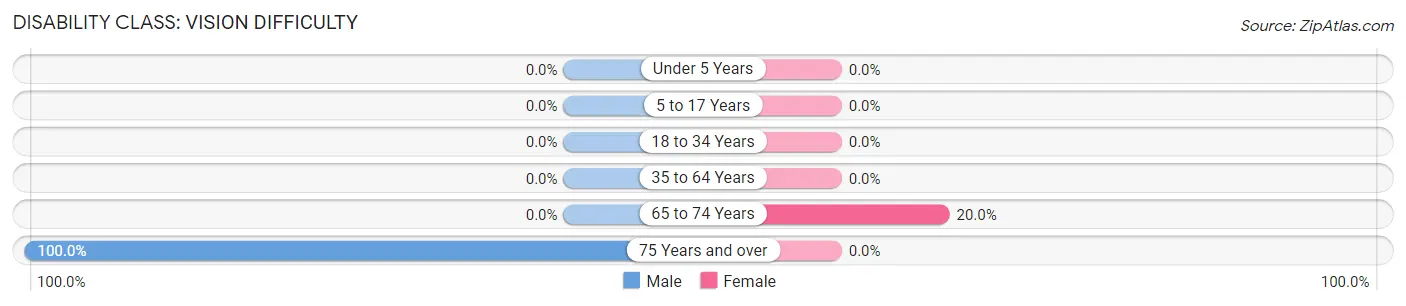
| Age Bracket | Male | Female |
| Under 5 Years | 0 (0.0%) | 0 (0.0%) |
| 5 to 17 Years | 0 (0.0%) | 0 (0.0%) |
| 18 to 34 Years | 0 (0.0%) | 0 (0.0%) |
| 35 to 64 Years | 0 (0.0%) | 0 (0.0%) |
| 65 to 74 Years | 0 (0.0%) | 6 (20.0%) |
| 75 Years and over | 28 (100.0%) | 0 (0.0%) |
Disability Class: Cognitive Difficulty
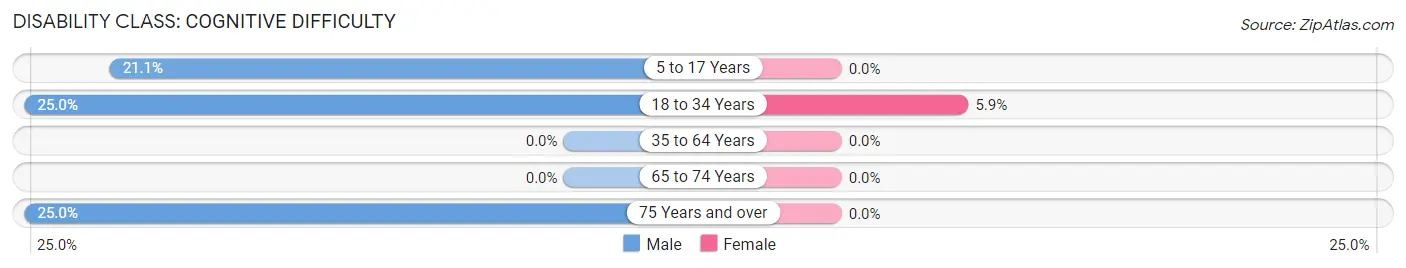
| Age Bracket | Male | Female |
| 5 to 17 Years | 8 (21.0%) | 0 (0.0%) |
| 18 to 34 Years | 5 (25.0%) | 3 (5.9%) |
| 35 to 64 Years | 0 (0.0%) | 0 (0.0%) |
| 65 to 74 Years | 0 (0.0%) | 0 (0.0%) |
| 75 Years and over | 7 (25.0%) | 0 (0.0%) |
Disability Class: Ambulatory Difficulty
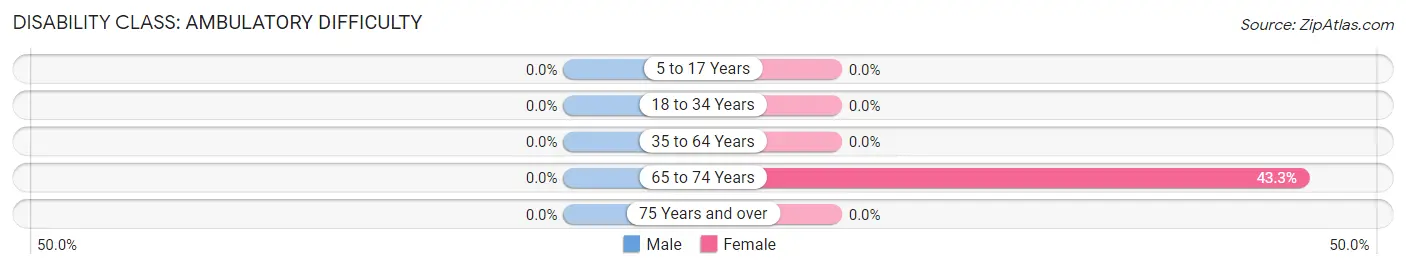
| Age Bracket | Male | Female |
| 5 to 17 Years | 0 (0.0%) | 0 (0.0%) |
| 18 to 34 Years | 0 (0.0%) | 0 (0.0%) |
| 35 to 64 Years | 0 (0.0%) | 0 (0.0%) |
| 65 to 74 Years | 0 (0.0%) | 13 (43.3%) |
| 75 Years and over | 0 (0.0%) | 0 (0.0%) |
Disability Class: Self-Care Difficulty
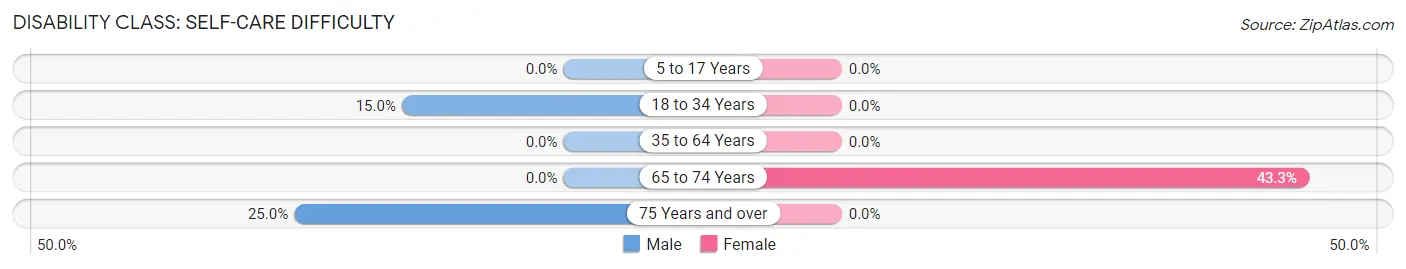
| Age Bracket | Male | Female |
| 5 to 17 Years | 0 (0.0%) | 0 (0.0%) |
| 18 to 34 Years | 3 (15.0%) | 0 (0.0%) |
| 35 to 64 Years | 0 (0.0%) | 0 (0.0%) |
| 65 to 74 Years | 0 (0.0%) | 13 (43.3%) |
| 75 Years and over | 7 (25.0%) | 0 (0.0%) |
Technology Access in Bridgeton
Computing Device Access in Bridgeton
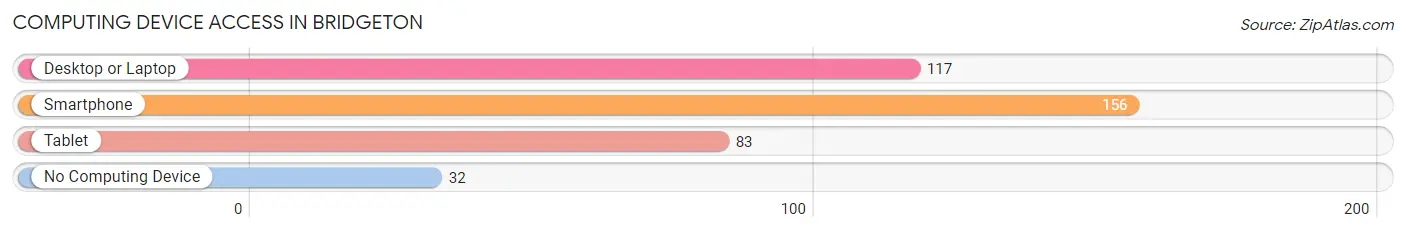
| Device Type | # Households | % Households |
| Desktop or Laptop | 117 | 58.2% |
| Smartphone | 156 | 77.6% |
| Tablet | 83 | 41.3% |
| No Computing Device | 32 | 15.9% |
| Total | 201 | 100.0% |
Internet Access in Bridgeton
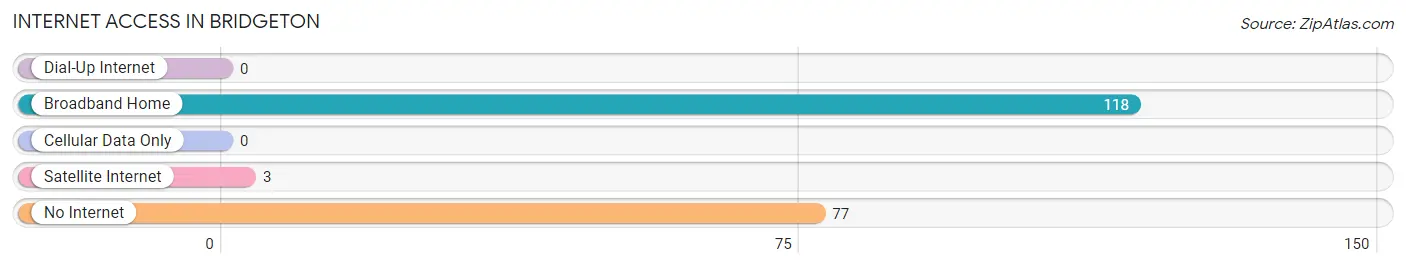
| Internet Type | # Households | % Households |
| Dial-Up Internet | 0 | 0.0% |
| Broadband Home | 118 | 58.7% |
| Cellular Data Only | 0 | 0.0% |
| Satellite Internet | 3 | 1.5% |
| No Internet | 77 | 38.3% |
| Total | 201 | 100.0% |
Bridgeton Summary
Bridgeton is a small town located in Craven County, North Carolina. It is situated on the Neuse River, approximately 20 miles east of New Bern. The town was founded in 1795 and has a population of approximately 1,500 people.
Geography
Bridgeton is located in the Coastal Plain region of North Carolina. The town is situated on the Neuse River, which is a major tributary of the Pamlico Sound. The town is surrounded by a variety of natural features, including the Croatan National Forest, the Neuse River, and the Pamlico Sound. The town is also located near the Croatan National Forest, which is a popular destination for outdoor recreation.
The town is located in a humid subtropical climate zone, with hot, humid summers and mild winters. The average annual temperature is around 70 degrees Fahrenheit, with an average high of around 90 degrees in the summer and an average low of around 50 degrees in the winter. The town receives an average of around 50 inches of precipitation per year, with most of it falling in the summer months.
History
Bridgeton was founded in 1795 by a group of settlers from New Bern. The town was named after the bridge that was built over the Neuse River, which connected the town to New Bern. The town quickly grew and became a popular destination for travelers and traders.
In the early 1800s, the town was a major port for the export of cotton and other goods. The town was also a major center for the slave trade, with many slaves being sold in the town.
In the late 1800s, the town began to decline as the railroad bypassed the town and the cotton industry moved elsewhere. The town was also hit hard by the Great Depression, and many of the town’s businesses closed.
In the late 20th century, the town began to experience a resurgence as a tourist destination. The town is now home to a variety of attractions, including the Bridgeton Museum, the Bridgeton Historic District, and the Bridgeton Riverwalk.
Economy
The economy of Bridgeton is largely based on tourism and agriculture. The town is home to a variety of tourist attractions, including the Bridgeton Museum, the Bridgeton Historic District, and the Bridgeton Riverwalk. The town is also home to a variety of agricultural businesses, including farms, nurseries, and greenhouses.
The town is also home to a variety of small businesses, including restaurants, shops, and other services. The town is also home to a variety of manufacturing businesses, including a furniture factory and a boat manufacturing plant.
Demographics
As of the 2010 census, the population of Bridgeton was 1,500 people. The town is predominantly white, with around 85% of the population being white. The town is also home to a small African American population, with around 10% of the population being African American. The town is also home to a small Hispanic population, with around 5% of the population being Hispanic.
The median household income in Bridgeton is around $35,000, which is slightly lower than the national average. The town also has a higher poverty rate than the national average, with around 20% of the population living below the poverty line.
Conclusion
Bridgeton is a small town located in Craven County, North Carolina. The town was founded in 1795 and has a population of approximately 1,500 people. The town is situated on the Neuse River and is surrounded by a variety of natural features, including the Croatan National Forest, the Neuse River, and the Pamlico Sound. The town is home to a variety of tourist attractions, agricultural businesses, and small businesses. The town is predominantly white, with around 85% of the population being white. The median household income in Bridgeton is around $35,000, which is slightly lower than the national average.
Common Questions
What is Per Capita Income in Bridgeton?
Per Capita income in Bridgeton is $24,259.
What is the Median Family Income in Bridgeton?
Median Family Income in Bridgeton is $48,958.
What is the Median Household income in Bridgeton?
Median Household Income in Bridgeton is $48,542.
What is Income or Wage Gap in Bridgeton?
Income or Wage Gap in Bridgeton is 51.7%.
Women in Bridgeton earn 48.3 cents for every dollar earned by a man.
What is Inequality or Gini Index in Bridgeton?
Inequality or Gini Index in Bridgeton is 0.46.
What is the Total Population of Bridgeton?
Total Population of Bridgeton is 532.
What is the Total Male Population of Bridgeton?
Total Male Population of Bridgeton is 269.
What is the Total Female Population of Bridgeton?
Total Female Population of Bridgeton is 263.
What is the Ratio of Males per 100 Females in Bridgeton?
There are 102.28 Males per 100 Females in Bridgeton.
What is the Ratio of Females per 100 Males in Bridgeton?
There are 97.77 Females per 100 Males in Bridgeton.
What is the Median Population Age in Bridgeton?
Median Population Age in Bridgeton is 37.2 Years.
What is the Average Family Size in Bridgeton
Average Family Size in Bridgeton is 4.5 People.
What is the Average Household Size in Bridgeton
Average Household Size in Bridgeton is 2.6 People.
How Large is the Labor Force in Bridgeton?
There are 191 People in the Labor Forcein in Bridgeton.
What is the Percentage of People in the Labor Force in Bridgeton?
54.4% of People are in the Labor Force in Bridgeton.
What is the Unemployment Rate in Bridgeton?
Unemployment Rate in Bridgeton is 5.0%.