Gloucester, NC Map & Demographics
Gloucester Map
Gloucester Overview
$27,571
PER CAPITA INCOME
$81,250
AVG FAMILY INCOME
$53,036
AVG HOUSEHOLD INCOME
0.39
INEQUALITY / GINI INDEX
506
TOTAL POPULATION
282
MALE POPULATION
224
FEMALE POPULATION
125.89
MALES / 100 FEMALES
79.43
FEMALES / 100 MALES
49.3
MEDIAN AGE
3.0
AVG FAMILY SIZE
2.4
AVG HOUSEHOLD SIZE
219
LABOR FORCE [ PEOPLE ]
55.0%
PERCENT IN LABOR FORCE
3.2%
UNEMPLOYMENT RATE
Gloucester Zip Codes
Income in Gloucester
Income Overview in Gloucester
Per Capita Income in Gloucester is $27,571, while median incomes of families and households are $81,250 and $53,036 respectively.
| Characteristic | Number | Measure |
| Per Capita Income | 506 | $27,571 |
| Median Family Income | 134 | $81,250 |
| Mean Family Income | 134 | $84,598 |
| Median Household Income | 212 | $53,036 |
| Mean Household Income | 212 | $64,575 |
| Income Deficit | 134 | $0 |
| Wage / Income Gap (%) | 506 | 0.00% |
| Wage / Income Gap ($) | 506 | 100.00¢ per $1 |
| Gini / Inequality Index | 506 | 0.39 |
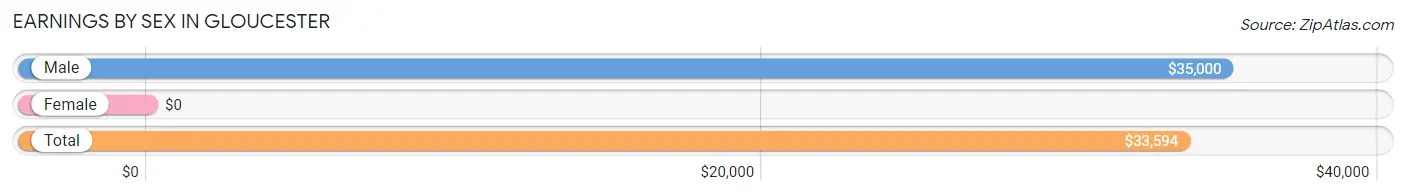
Earnings by Sex in Gloucester
| Sex | Number | Average Earnings |
| Male | 108 (49.3%) | $35,000 |
| Female | 111 (50.7%) | $0 |
| Total | 219 (100.0%) | $33,594 |
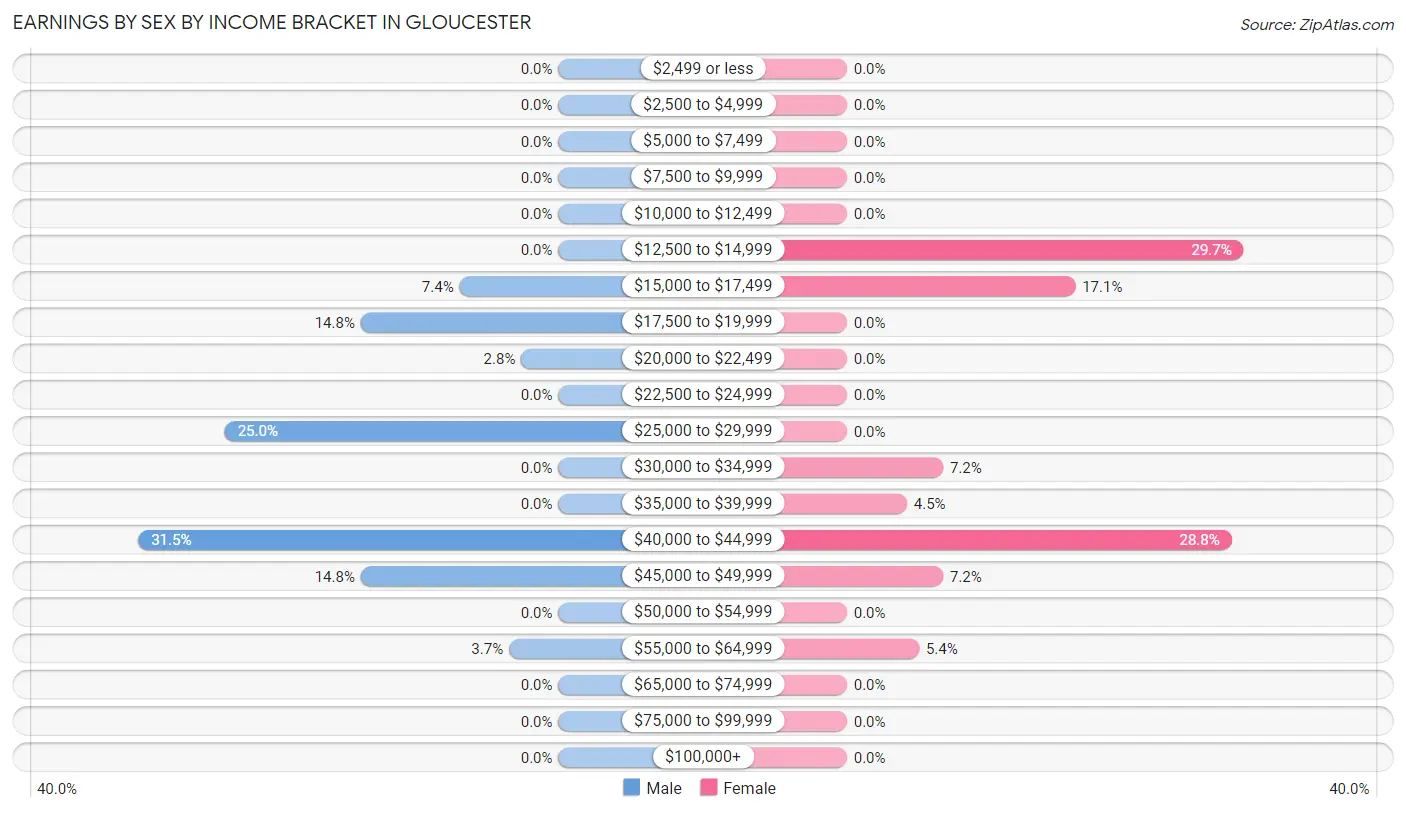
Earnings by Sex by Income Bracket in Gloucester
The most common earnings brackets in Gloucester are $40,000 to $44,999 for men (34 | 31.5%) and $12,500 to $14,999 for women (33 | 29.7%).
| Income | Male | Female |
| $2,499 or less | 0 (0.0%) | 0 (0.0%) |
| $2,500 to $4,999 | 0 (0.0%) | 0 (0.0%) |
| $5,000 to $7,499 | 0 (0.0%) | 0 (0.0%) |
| $7,500 to $9,999 | 0 (0.0%) | 0 (0.0%) |
| $10,000 to $12,499 | 0 (0.0%) | 0 (0.0%) |
| $12,500 to $14,999 | 0 (0.0%) | 33 (29.7%) |
| $15,000 to $17,499 | 8 (7.4%) | 19 (17.1%) |
| $17,500 to $19,999 | 16 (14.8%) | 0 (0.0%) |
| $20,000 to $22,499 | 3 (2.8%) | 0 (0.0%) |
| $22,500 to $24,999 | 0 (0.0%) | 0 (0.0%) |
| $25,000 to $29,999 | 27 (25.0%) | 0 (0.0%) |
| $30,000 to $34,999 | 0 (0.0%) | 8 (7.2%) |
| $35,000 to $39,999 | 0 (0.0%) | 5 (4.5%) |
| $40,000 to $44,999 | 34 (31.5%) | 32 (28.8%) |
| $45,000 to $49,999 | 16 (14.8%) | 8 (7.2%) |
| $50,000 to $54,999 | 0 (0.0%) | 0 (0.0%) |
| $55,000 to $64,999 | 4 (3.7%) | 6 (5.4%) |
| $65,000 to $74,999 | 0 (0.0%) | 0 (0.0%) |
| $75,000 to $99,999 | 0 (0.0%) | 0 (0.0%) |
| $100,000+ | 0 (0.0%) | 0 (0.0%) |
| Total | 108 (100.0%) | 111 (100.0%) |
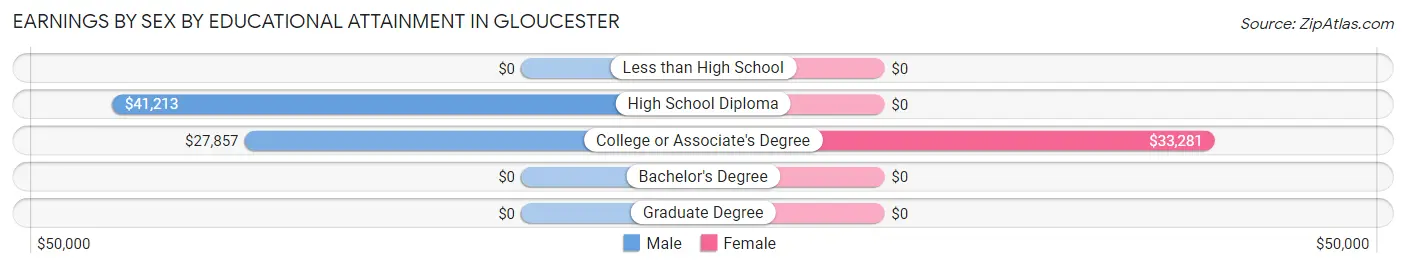
Earnings by Sex by Educational Attainment in Gloucester
| Educational Attainment | Male Income | Female Income |
| Less than High School | - | - |
| High School Diploma | $41,213 | $0 |
| College or Associate's Degree | $27,857 | $33,281 |
| Bachelor's Degree | - | - |
| Graduate Degree | - | - |
| Total | $35,000 | $0 |
Family Income in Gloucester
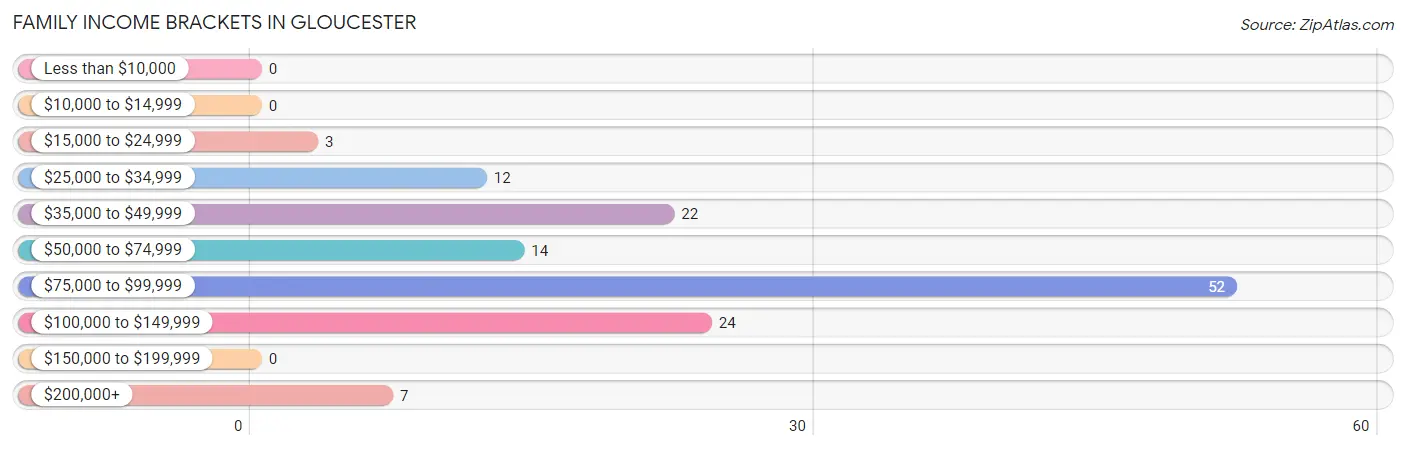
Family Income Brackets in Gloucester
According to the Gloucester family income data, there are 52 families falling into the $75,000 to $99,999 income range, which is the most common income bracket and makes up 38.8% of all families.
| Income Bracket | # Families | % Families |
| Less than $10,000 | 0 | 0.0% |
| $10,000 to $14,999 | 0 | 0.0% |
| $15,000 to $24,999 | 3 | 2.2% |
| $25,000 to $34,999 | 12 | 9.0% |
| $35,000 to $49,999 | 22 | 16.4% |
| $50,000 to $74,999 | 14 | 10.4% |
| $75,000 to $99,999 | 52 | 38.8% |
| $100,000 to $149,999 | 24 | 17.9% |
| $150,000 to $199,999 | 0 | 0.0% |
| $200,000+ | 7 | 5.2% |
Family Income by Famaliy Size in Gloucester
| Income Bracket | # Families | Median Income |
| 2-Person Families | 72 (53.7%) | $0 |
| 3-Person Families | 9 (6.7%) | $0 |
| 4-Person Families | 44 (32.8%) | $0 |
| 5-Person Families | 0 (0.0%) | $0 |
| 6-Person Families | 9 (6.7%) | $0 |
| 7+ Person Families | 0 (0.0%) | $0 |
| Total | 134 (100.0%) | $81,250 |
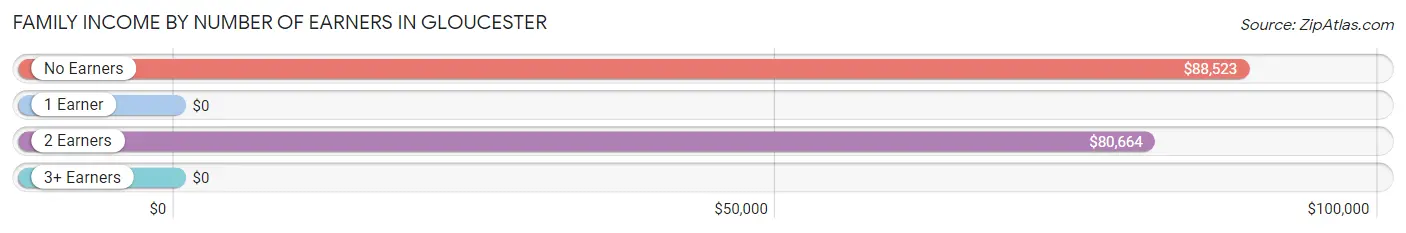
Family Income by Number of Earners in Gloucester
| Number of Earners | # Families | Median Income |
| No Earners | 53 (39.6%) | $88,523 |
| 1 Earner | 3 (2.2%) | $0 |
| 2 Earners | 69 (51.5%) | $80,664 |
| 3+ Earners | 9 (6.7%) | $0 |
| Total | 134 (100.0%) | $81,250 |
Household Income in Gloucester
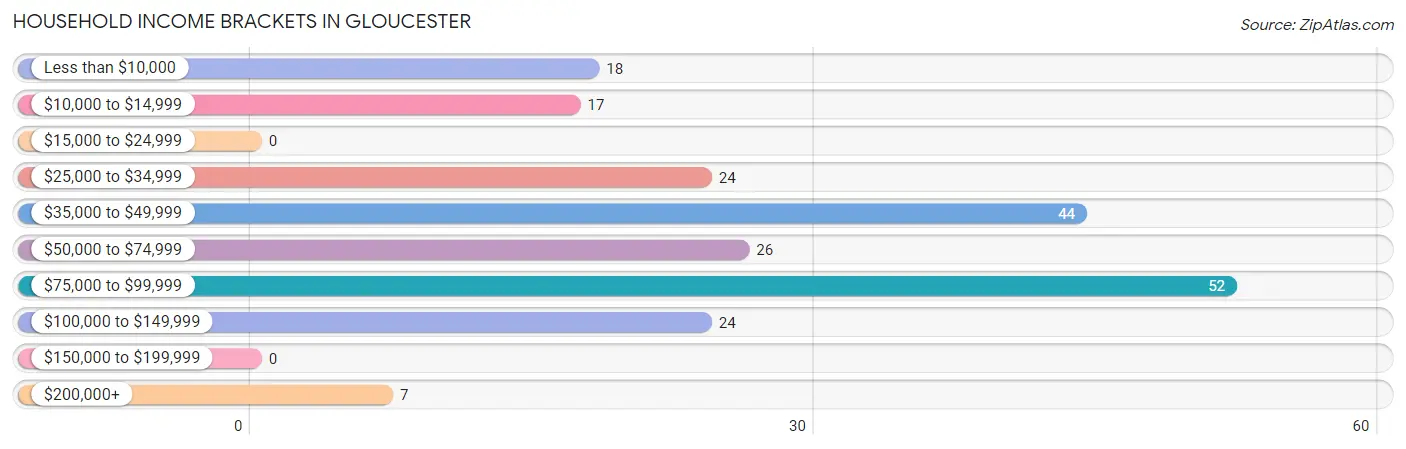
Household Income Brackets in Gloucester
With 52 households falling in the category, the $75,000 to $99,999 income range is the most frequent in Gloucester, accounting for 24.5% of all households.
| Income Bracket | # Households | % Households |
| Less than $10,000 | 18 | 8.5% |
| $10,000 to $14,999 | 17 | 8.0% |
| $15,000 to $24,999 | 0 | 0.0% |
| $25,000 to $34,999 | 24 | 11.3% |
| $35,000 to $49,999 | 44 | 20.8% |
| $50,000 to $74,999 | 26 | 12.3% |
| $75,000 to $99,999 | 52 | 24.5% |
| $100,000 to $149,999 | 24 | 11.3% |
| $150,000 to $199,999 | 0 | 0.0% |
| $200,000+ | 7 | 3.3% |
Household Income by Householder Age in Gloucester
The median household income in Gloucester is $53,036, with the highest median household income of $80,977 found in the 25 to 44 years age bracket for the primary householder. A total of 47 households (22.2%) fall into this category.
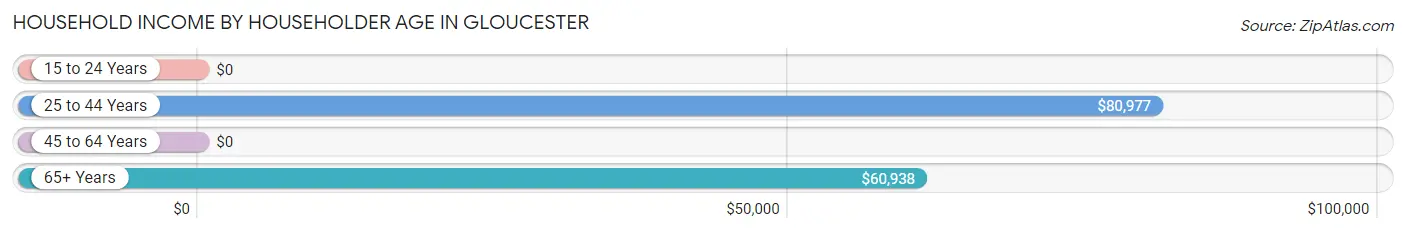
| Income Bracket | # Households | Median Income |
| 15 to 24 Years | 0 (0.0%) | $0 |
| 25 to 44 Years | 47 (22.2%) | $80,977 |
| 45 to 64 Years | 96 (45.3%) | $0 |
| 65+ Years | 69 (32.6%) | $60,938 |
| Total | 212 (100.0%) | $53,036 |
Poverty in Gloucester
Income Below Poverty by Sex and Age in Gloucester
With 6.0% poverty level for males and 13.0% for females among the residents of Gloucester, 55 to 64 year old males and 25 to 34 year old females are the most vulnerable to poverty, with 17 males (40.5%) and 11 females (100.0%) in their respective age groups living below the poverty level.
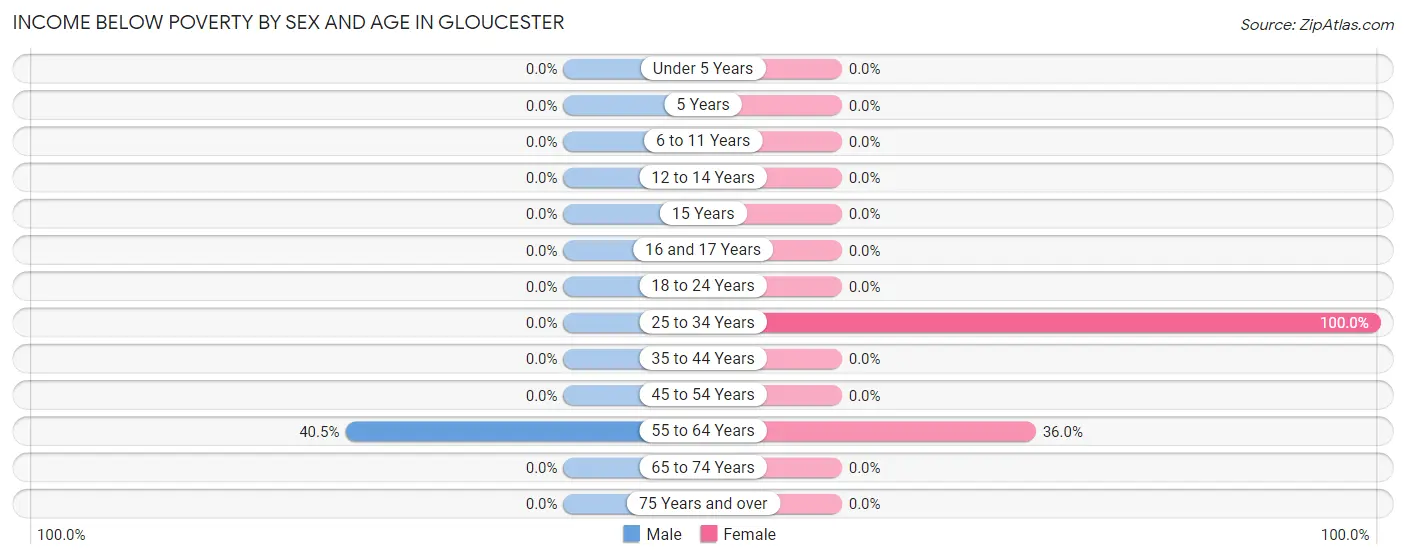
| Age Bracket | Male | Female |
| Under 5 Years | 0 (0.0%) | 0 (0.0%) |
| 5 Years | 0 (0.0%) | 0 (0.0%) |
| 6 to 11 Years | 0 (0.0%) | 0 (0.0%) |
| 12 to 14 Years | 0 (0.0%) | 0 (0.0%) |
| 15 Years | 0 (0.0%) | 0 (0.0%) |
| 16 and 17 Years | 0 (0.0%) | 0 (0.0%) |
| 18 to 24 Years | 0 (0.0%) | 0 (0.0%) |
| 25 to 34 Years | 0 (0.0%) | 11 (100.0%) |
| 35 to 44 Years | 0 (0.0%) | 0 (0.0%) |
| 45 to 54 Years | 0 (0.0%) | 0 (0.0%) |
| 55 to 64 Years | 17 (40.5%) | 18 (36.0%) |
| 65 to 74 Years | 0 (0.0%) | 0 (0.0%) |
| 75 Years and over | 0 (0.0%) | 0 (0.0%) |
| Total | 17 (6.0%) | 29 (13.0%) |
Income Above Poverty by Sex and Age in Gloucester
According to the poverty statistics in Gloucester, males aged 6 to 11 years and females aged 12 to 14 years are the age groups that are most secure financially, with 100.0% of males and 100.0% of females in these age groups living above the poverty line.
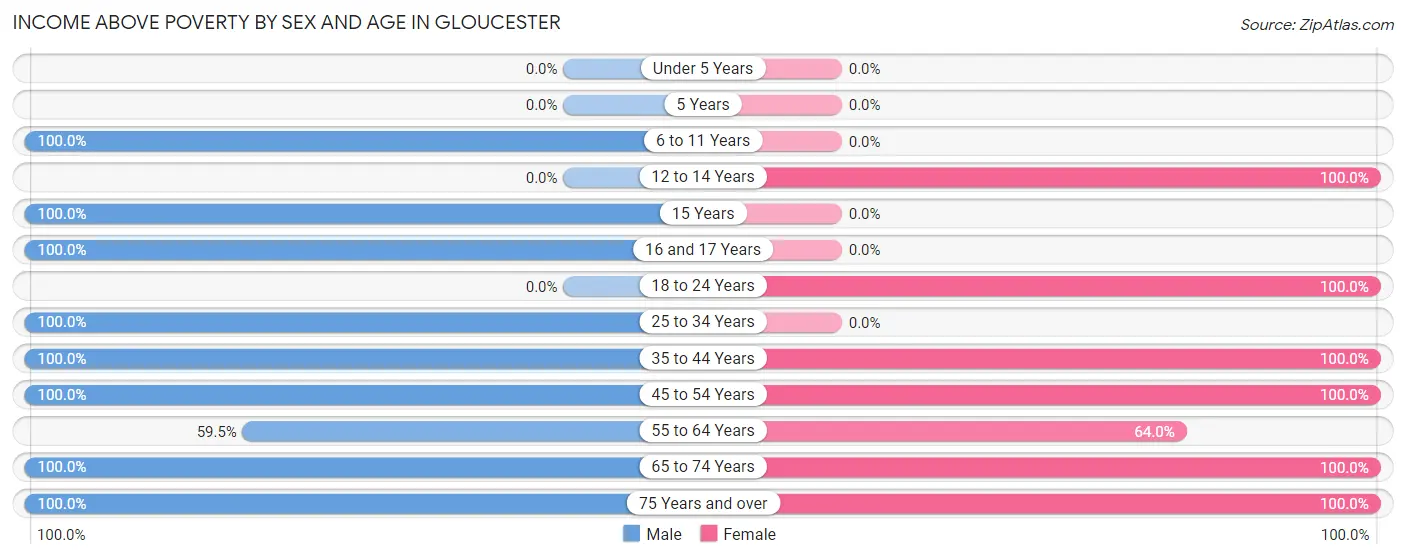
| Age Bracket | Male | Female |
| Under 5 Years | 0 (0.0%) | 0 (0.0%) |
| 5 Years | 0 (0.0%) | 0 (0.0%) |
| 6 to 11 Years | 74 (100.0%) | 0 (0.0%) |
| 12 to 14 Years | 0 (0.0%) | 24 (100.0%) |
| 15 Years | 10 (100.0%) | 0 (0.0%) |
| 16 and 17 Years | 9 (100.0%) | 0 (0.0%) |
| 18 to 24 Years | 0 (0.0%) | 5 (100.0%) |
| 25 to 34 Years | 25 (100.0%) | 0 (0.0%) |
| 35 to 44 Years | 34 (100.0%) | 55 (100.0%) |
| 45 to 54 Years | 28 (100.0%) | 12 (100.0%) |
| 55 to 64 Years | 25 (59.5%) | 32 (64.0%) |
| 65 to 74 Years | 32 (100.0%) | 28 (100.0%) |
| 75 Years and over | 28 (100.0%) | 39 (100.0%) |
| Total | 265 (94.0%) | 195 (87.1%) |
Income Below Poverty Among Married-Couple Families in Gloucester
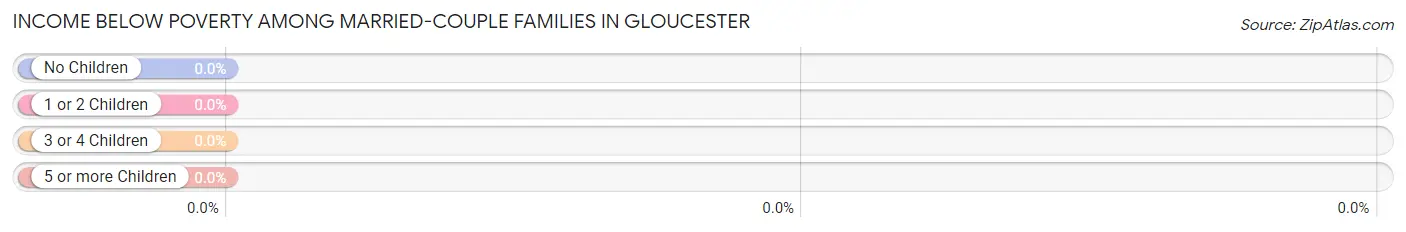
| Children | Above Poverty | Below Poverty |
| No Children | 65 (100.0%) | 0 (0.0%) |
| 1 or 2 Children | 44 (100.0%) | 0 (0.0%) |
| 3 or 4 Children | 9 (100.0%) | 0 (0.0%) |
| 5 or more Children | 0 (0.0%) | 0 (0.0%) |
| Total | 118 (100.0%) | 0 (0.0%) |
Income Below Poverty Among Single-Parent Households in Gloucester
| Children | Single Father | Single Mother |
| No Children | 0 (0.0%) | 0 (0.0%) |
| 1 or 2 Children | 0 (0.0%) | 0 (0.0%) |
| 3 or 4 Children | 0 (0.0%) | 0 (0.0%) |
| 5 or more Children | 0 (0.0%) | 0 (0.0%) |
| Total | 0 (0.0%) | 0 (0.0%) |
Income Below Poverty Among Married-Couple vs Single-Parent Households in Gloucester
| Children | Married-Couple Families | Single-Parent Households |
| No Children | 0 (0.0%) | 0 (0.0%) |
| 1 or 2 Children | 0 (0.0%) | 0 (0.0%) |
| 3 or 4 Children | 0 (0.0%) | 0 (0.0%) |
| 5 or more Children | 0 (0.0%) | 0 (0.0%) |
| Total | 0 (0.0%) | 0 (0.0%) |
Race in Gloucester
The most populous races in Gloucester are White / Caucasian (466 | 92.1%), Two or more Races (21 | 4.2%), and Some other Race (10 | 2.0%).
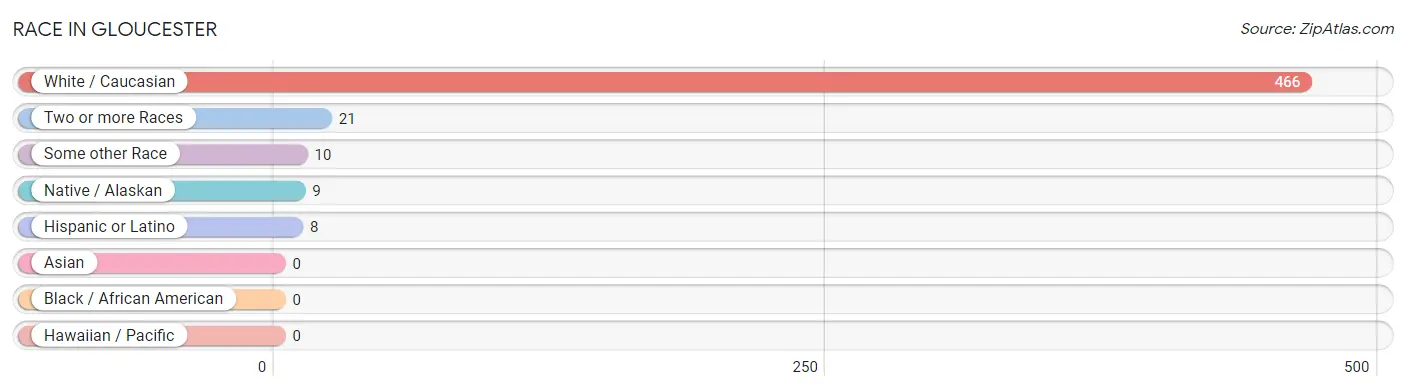
| Race | # Population | % Population |
| Asian | 0 | 0.0% |
| Black / African American | 0 | 0.0% |
| Hawaiian / Pacific | 0 | 0.0% |
| Hispanic or Latino | 8 | 1.6% |
| Native / Alaskan | 9 | 1.8% |
| White / Caucasian | 466 | 92.1% |
| Two or more Races | 21 | 4.2% |
| Some other Race | 10 | 2.0% |
| Total | 506 | 100.0% |
Ancestry in Gloucester
The most populous ancestries reported in Gloucester are German (171 | 33.8%), Irish (159 | 31.4%), English (76 | 15.0%), American (48 | 9.5%), and European (25 | 4.9%), together accounting for 94.7% of all Gloucester residents.
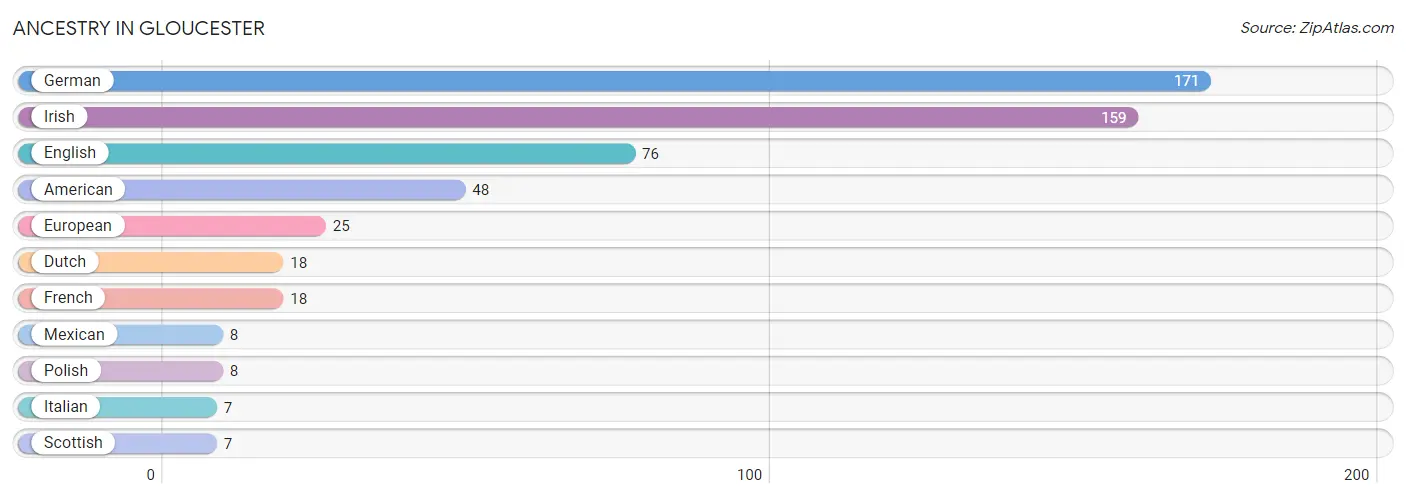
| Ancestry | # Population | % Population |
| American | 48 | 9.5% |
| Dutch | 18 | 3.6% |
| English | 76 | 15.0% |
| European | 25 | 4.9% |
| French | 18 | 3.6% |
| German | 171 | 33.8% |
| Irish | 159 | 31.4% |
| Italian | 7 | 1.4% |
| Mexican | 8 | 1.6% |
| Polish | 8 | 1.6% |
| Scottish | 7 | 1.4% | View All 11 Rows |
Immigrants in Gloucester
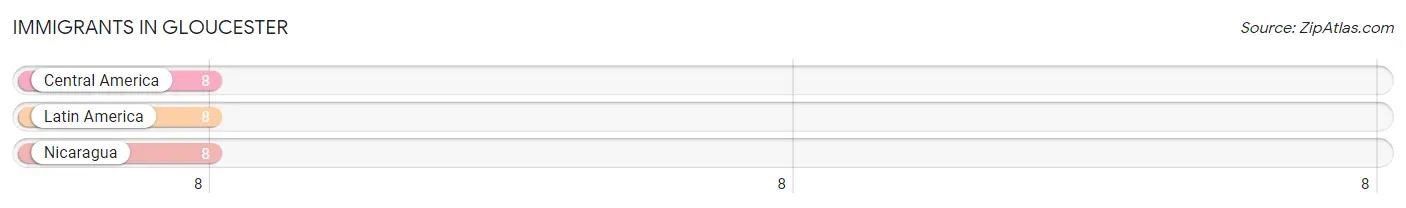
The most numerous immigrant groups reported in Gloucester came from Central America (8 | 1.6%), Latin America (8 | 1.6%), and Nicaragua (8 | 1.6%), together accounting for 4.7% of all Gloucester residents.
| Immigration Origin | # Population | % Population |
| Central America | 8 | 1.6% |
| Latin America | 8 | 1.6% |
| Nicaragua | 8 | 1.6% | View All 3 Rows |
Sex and Age in Gloucester
Sex and Age in Gloucester
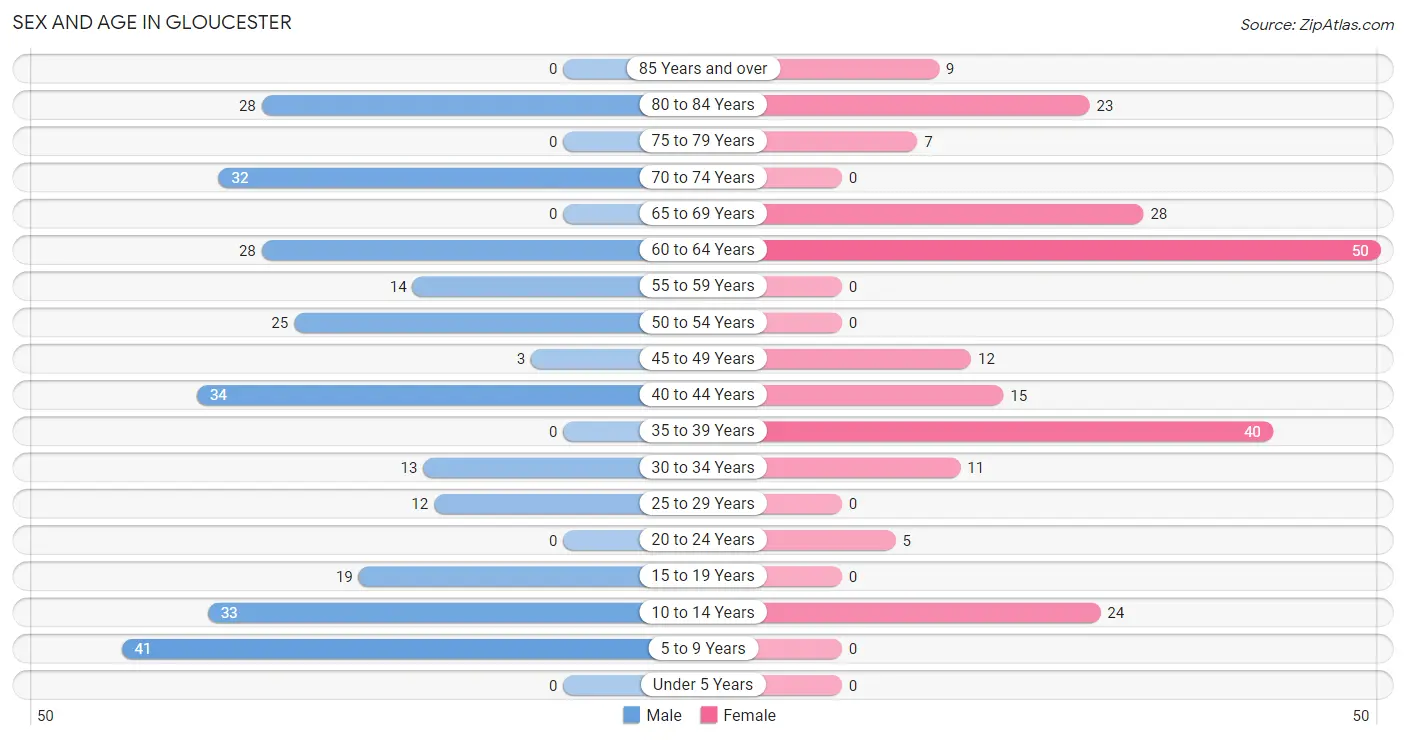
The most populous age groups in Gloucester are 5 to 9 Years (41 | 14.5%) for men and 60 to 64 Years (50 | 22.3%) for women.
| Age Bracket | Male | Female |
| Under 5 Years | 0 (0.0%) | 0 (0.0%) |
| 5 to 9 Years | 41 (14.5%) | 0 (0.0%) |
| 10 to 14 Years | 33 (11.7%) | 24 (10.7%) |
| 15 to 19 Years | 19 (6.7%) | 0 (0.0%) |
| 20 to 24 Years | 0 (0.0%) | 5 (2.2%) |
| 25 to 29 Years | 12 (4.3%) | 0 (0.0%) |
| 30 to 34 Years | 13 (4.6%) | 11 (4.9%) |
| 35 to 39 Years | 0 (0.0%) | 40 (17.9%) |
| 40 to 44 Years | 34 (12.1%) | 15 (6.7%) |
| 45 to 49 Years | 3 (1.1%) | 12 (5.4%) |
| 50 to 54 Years | 25 (8.9%) | 0 (0.0%) |
| 55 to 59 Years | 14 (5.0%) | 0 (0.0%) |
| 60 to 64 Years | 28 (9.9%) | 50 (22.3%) |
| 65 to 69 Years | 0 (0.0%) | 28 (12.5%) |
| 70 to 74 Years | 32 (11.4%) | 0 (0.0%) |
| 75 to 79 Years | 0 (0.0%) | 7 (3.1%) |
| 80 to 84 Years | 28 (9.9%) | 23 (10.3%) |
| 85 Years and over | 0 (0.0%) | 9 (4.0%) |
| Total | 282 (100.0%) | 224 (100.0%) |
Families and Households in Gloucester
Median Family Size in Gloucester
The median family size in Gloucester is 2.99 persons per family, with married-couple families (118 | 88.1%) accounting for the largest median family size of 3.06 persons per family. On the other hand, single male/father families (7 | 5.2%) represent the smallest median family size with 2.00 persons per family.
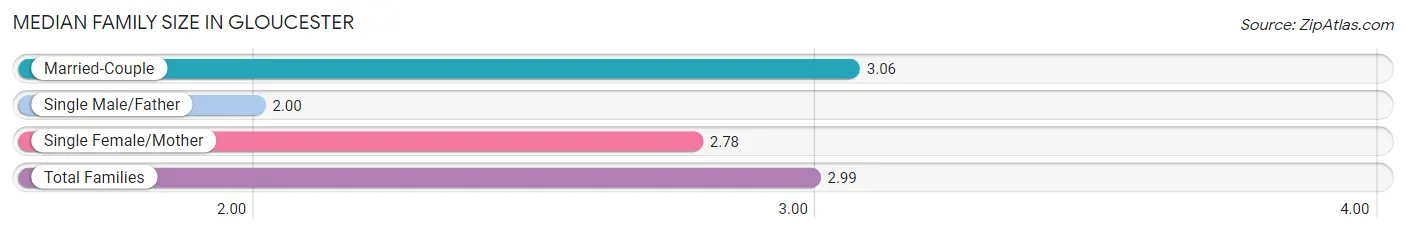
| Family Type | # Families | Family Size |
| Married-Couple | 118 (88.1%) | 3.06 |
| Single Male/Father | 7 (5.2%) | 2.00 |
| Single Female/Mother | 9 (6.7%) | 2.78 |
| Total Families | 134 (100.0%) | 2.99 |
Median Household Size in Gloucester
The median household size in Gloucester is 2.39 persons per household, with single male/father households (7 | 3.3%) accounting for the largest median household size of 4.14 persons per household. non-family households (78 | 36.8%) represent the smallest median household size with 1.17 persons per household.
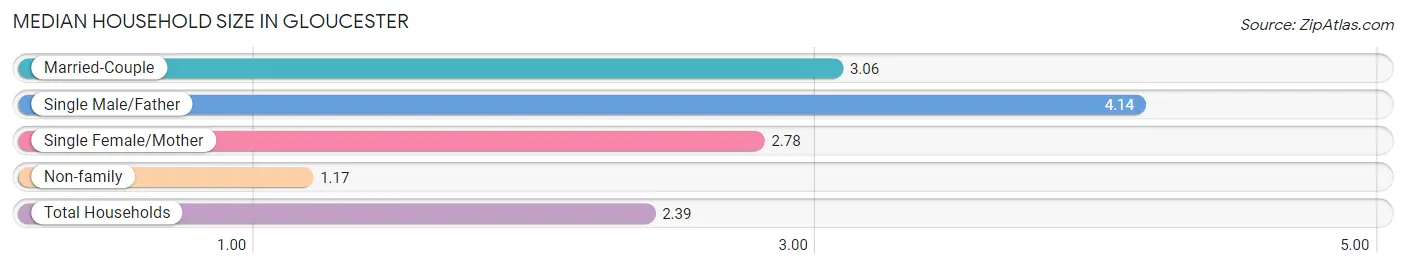
| Household Type | # Households | Household Size |
| Married-Couple | 118 (55.7%) | 3.06 |
| Single Male/Father | 7 (3.3%) | 4.14 |
| Single Female/Mother | 9 (4.3%) | 2.78 |
| Non-family | 78 (36.8%) | 1.17 |
| Total Households | 212 (100.0%) | 2.39 |
Household Size by Marriage Status in Gloucester
Out of a total of 212 households in Gloucester, 134 (63.2%) are family households, while 78 (36.8%) are nonfamily households. The most numerous type of family households are 2-person households, comprising 65, and the most common type of nonfamily households are 1-person households, comprising 67.
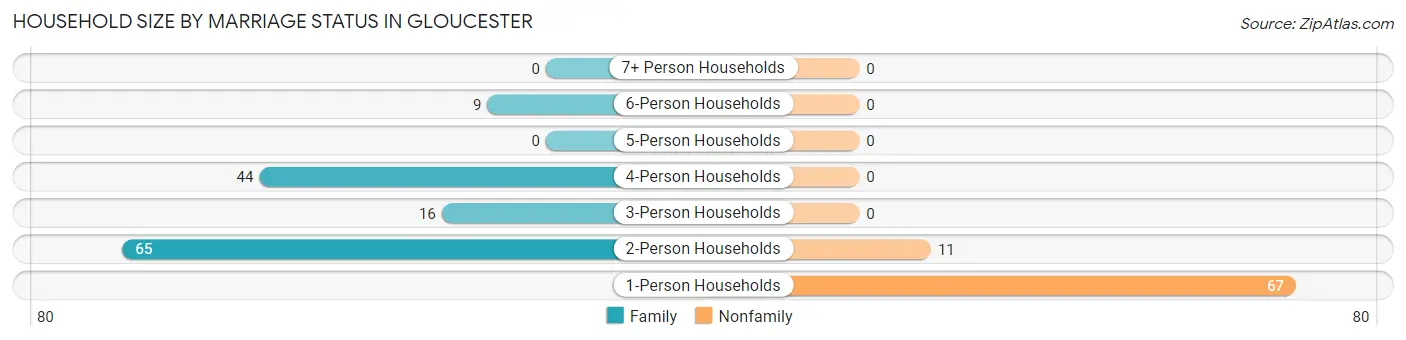
| Household Size | Family Households | Nonfamily Households |
| 1-Person Households | - | 67 (31.6%) |
| 2-Person Households | 65 (30.7%) | 11 (5.2%) |
| 3-Person Households | 16 (7.5%) | 0 (0.0%) |
| 4-Person Households | 44 (20.7%) | 0 (0.0%) |
| 5-Person Households | 0 (0.0%) | 0 (0.0%) |
| 6-Person Households | 9 (4.3%) | 0 (0.0%) |
| 7+ Person Households | 0 (0.0%) | 0 (0.0%) |
| Total | 134 (63.2%) | 78 (36.8%) |
Female Fertility in Gloucester
Fertility by Age in Gloucester
| Age Bracket | Women with Births | Births / 1,000 Women |
| 15 to 19 years | 0 (0.0%) | 0.0 |
| 20 to 34 years | 0 (0.0%) | 0.0 |
| 35 to 50 years | 0 (0.0%) | 0.0 |
| Total | 0 (0.0%) | 0.0 |
Fertility by Age by Marriage Status in Gloucester
| Age Bracket | Married | Unmarried |
| 15 to 19 years | 0 (0.0%) | 0 (0.0%) |
| 20 to 34 years | 0 (0.0%) | 0 (0.0%) |
| 35 to 50 years | 0 (0.0%) | 0 (0.0%) |
| Total | 0 (0.0%) | 0 (0.0%) |
Fertility by Education in Gloucester
| Educational Attainment | Women with Births | Births / 1,000 Women |
| Less than High School | 0 (0.0%) | 0.0 |
| High School Diploma | 0 (0.0%) | 0.0 |
| College or Associate's Degree | 0 (0.0%) | 0.0 |
| Bachelor's Degree | 0 (0.0%) | 0.0 |
| Graduate Degree | 0 (0.0%) | 0.0 |
| Total | 0 (0.0%) | 0.0 |
Fertility by Education by Marriage Status in Gloucester
| Educational Attainment | Married | Unmarried |
| Less than High School | 0 (0.0%) | 0 (0.0%) |
| High School Diploma | 0 (0.0%) | 0 (0.0%) |
| College or Associate's Degree | 0 (0.0%) | 0 (0.0%) |
| Bachelor's Degree | 0 (0.0%) | 0 (0.0%) |
| Graduate Degree | 0 (0.0%) | 0 (0.0%) |
| Total | 0 (0.0%) | 0 (0.0%) |
Employment Characteristics in Gloucester
Employment by Class of Employer in Gloucester
Among the 207 employed individuals in Gloucester, private company employees (163 | 78.7%), self-employed (not incorporated) (16 | 7.7%), and local government employees (16 | 7.7%) make up the most common classes of employment.
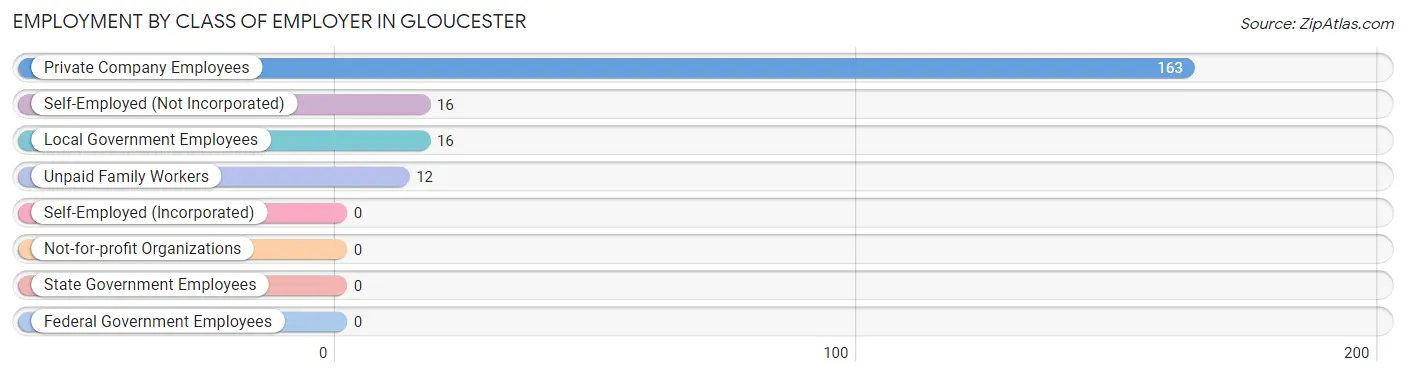
| Employer Class | # Employees | % Employees |
| Private Company Employees | 163 | 78.7% |
| Self-Employed (Incorporated) | 0 | 0.0% |
| Self-Employed (Not Incorporated) | 16 | 7.7% |
| Not-for-profit Organizations | 0 | 0.0% |
| Local Government Employees | 16 | 7.7% |
| State Government Employees | 0 | 0.0% |
| Federal Government Employees | 0 | 0.0% |
| Unpaid Family Workers | 12 | 5.8% |
| Total | 207 | 100.0% |
Employment Status by Age in Gloucester
According to the labor force statistics for Gloucester, out of the total population over 16 years of age (398), 55.0% or 219 individuals are in the labor force, with 3.2% or 7 of them unemployed. The age group with the highest labor force participation rate is 20 to 24 years, with 100.0% or 5 individuals in the labor force. Within the labor force, the 60 to 64 years age range has the highest percentage of unemployed individuals, with 20.0% or 7 of them being unemployed.
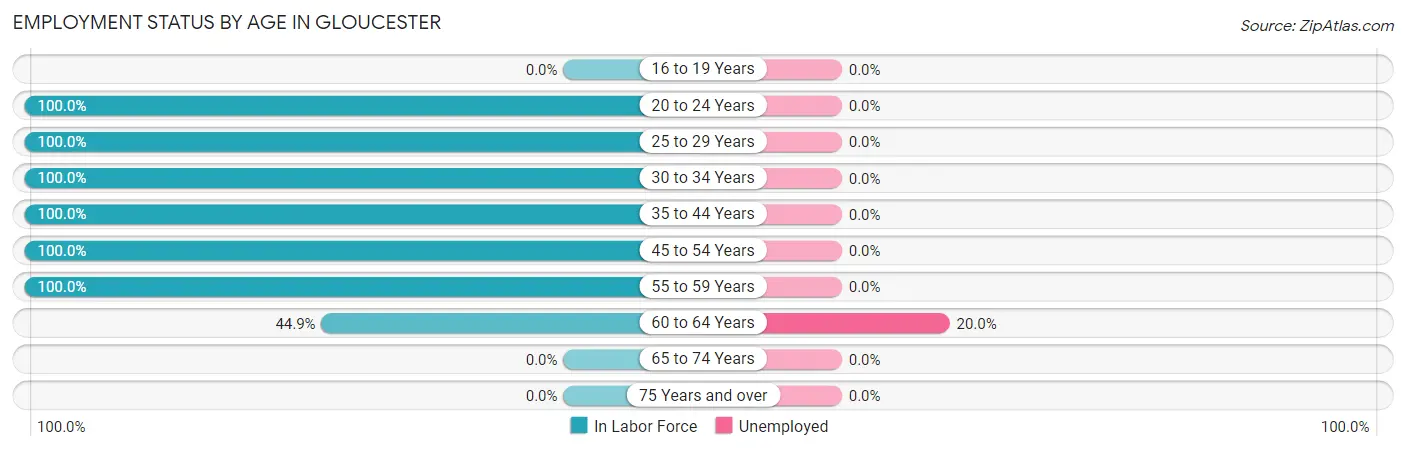
| Age Bracket | In Labor Force | Unemployed |
| 16 to 19 Years | 0 (0.0%) | 0 (0.0%) |
| 20 to 24 Years | 5 (100.0%) | 0 (0.0%) |
| 25 to 29 Years | 12 (100.0%) | 0 (0.0%) |
| 30 to 34 Years | 24 (100.0%) | 0 (0.0%) |
| 35 to 44 Years | 89 (100.0%) | 0 (0.0%) |
| 45 to 54 Years | 40 (100.0%) | 0 (0.0%) |
| 55 to 59 Years | 14 (100.0%) | 0 (0.0%) |
| 60 to 64 Years | 35 (44.9%) | 7 (20.0%) |
| 65 to 74 Years | 0 (0.0%) | 0 (0.0%) |
| 75 Years and over | 0 (0.0%) | 0 (0.0%) |
| Total | 219 (55.0%) | 7 (3.2%) |
Employment Status by Educational Attainment in Gloucester
According to labor force statistics for Gloucester, 83.3% of individuals (214) out of the total population between 25 and 64 years of age (257) are in the labor force, with 3.3% or 7 of them being unemployed. The group with the highest labor force participation rate are those with the educational attainment of less than high school, with 100.0% or 13 individuals in the labor force. Within the labor force, individuals with high school diploma education have the highest percentage of unemployment, with 9.7% or 7 of them being unemployed.
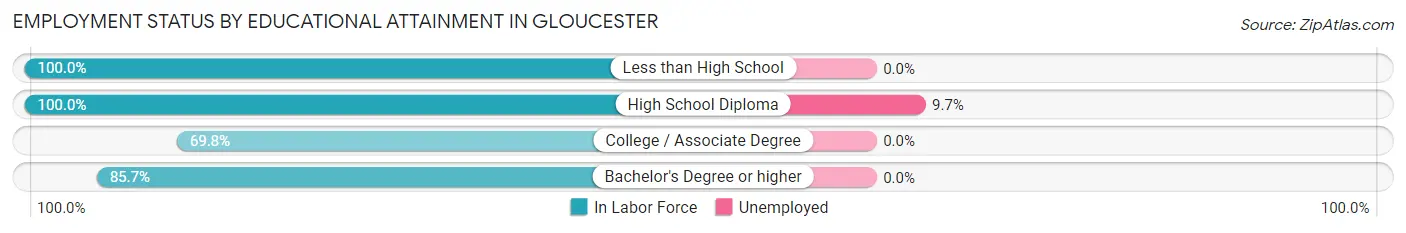
| Educational Attainment | In Labor Force | Unemployed |
| Less than High School | 13 (100.0%) | 0 (0.0%) |
| High School Diploma | 72 (100.0%) | 7 (9.7%) |
| College / Associate Degree | 81 (69.8%) | 0 (0.0%) |
| Bachelor's Degree or higher | 48 (85.7%) | 0 (0.0%) |
| Total | 214 (83.3%) | 8 (3.3%) |
Employment Occupations by Sex in Gloucester
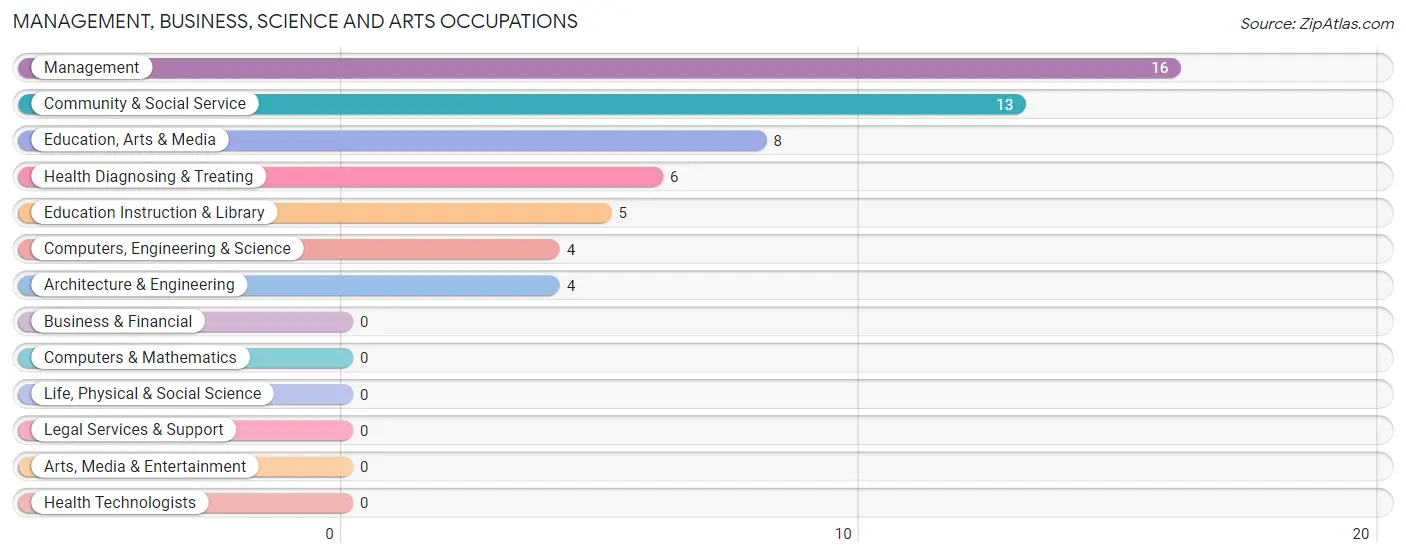
Management, Business, Science and Arts Occupations
The most common Management, Business, Science and Arts occupations in Gloucester are Management (16 | 7.5%), Community & Social Service (13 | 6.1%), Education, Arts & Media (8 | 3.8%), Health Diagnosing & Treating (6 | 2.8%), and Education Instruction & Library (5 | 2.4%).
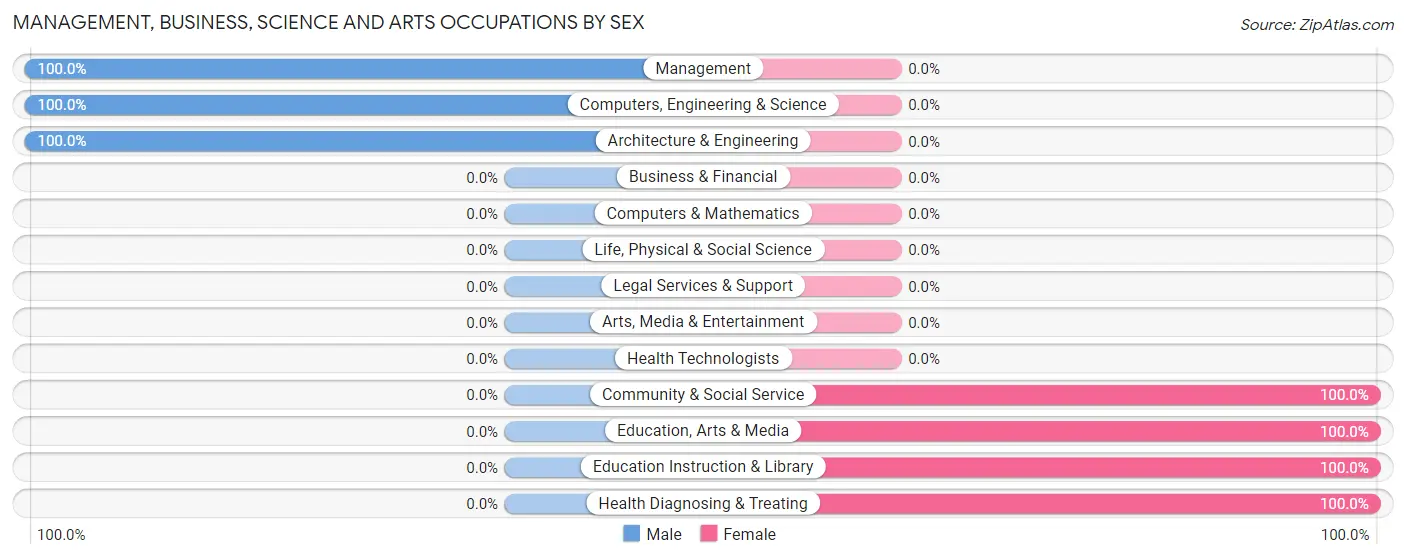
Management, Business, Science and Arts Occupations by Sex
Within the Management, Business, Science and Arts occupations in Gloucester, the most male-oriented occupations are Management (100.0%), Computers, Engineering & Science (100.0%), and Architecture & Engineering (100.0%), while the most female-oriented occupations are Community & Social Service (100.0%), Education, Arts & Media (100.0%), and Education Instruction & Library (100.0%).
| Occupation | Male | Female |
| Management | 16 (100.0%) | 0 (0.0%) |
| Business & Financial | 0 (0.0%) | 0 (0.0%) |
| Computers, Engineering & Science | 4 (100.0%) | 0 (0.0%) |
| Computers & Mathematics | 0 (0.0%) | 0 (0.0%) |
| Architecture & Engineering | 4 (100.0%) | 0 (0.0%) |
| Life, Physical & Social Science | 0 (0.0%) | 0 (0.0%) |
| Community & Social Service | 0 (0.0%) | 13 (100.0%) |
| Education, Arts & Media | 0 (0.0%) | 8 (100.0%) |
| Legal Services & Support | 0 (0.0%) | 0 (0.0%) |
| Education Instruction & Library | 0 (0.0%) | 5 (100.0%) |
| Arts, Media & Entertainment | 0 (0.0%) | 0 (0.0%) |
| Health Diagnosing & Treating | 0 (0.0%) | 6 (100.0%) |
| Health Technologists | 0 (0.0%) | 0 (0.0%) |
| Total (Category) | 20 (51.3%) | 19 (48.7%) |
| Total (Overall) | 101 (47.6%) | 111 (52.4%) |
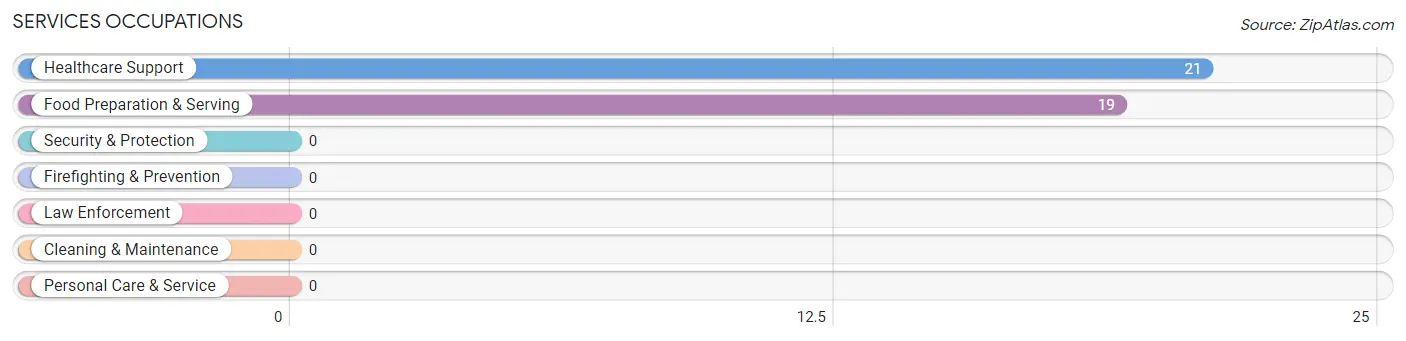
Services Occupations
The most common Services occupations in Gloucester are Healthcare Support (21 | 9.9%), and Food Preparation & Serving (19 | 9.0%).
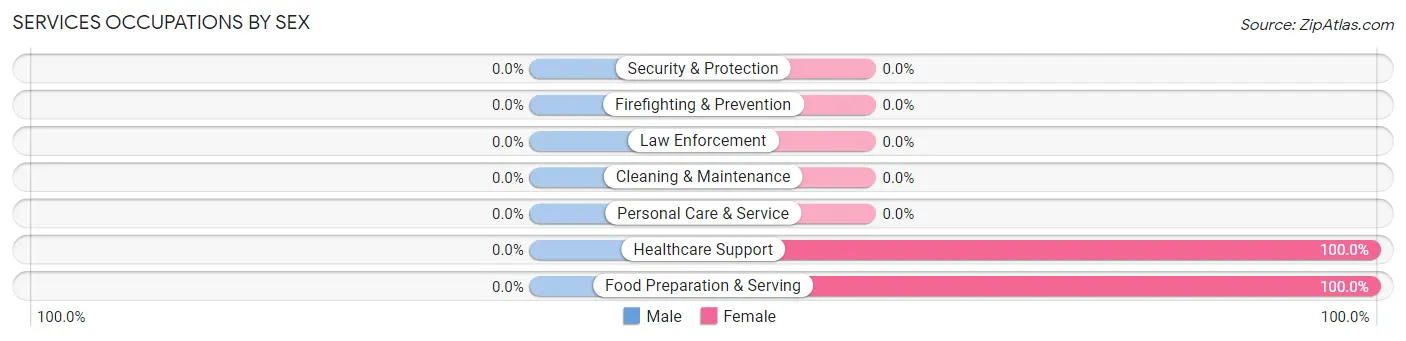
Services Occupations by Sex
| Occupation | Male | Female |
| Healthcare Support | 0 (0.0%) | 21 (100.0%) |
| Security & Protection | 0 (0.0%) | 0 (0.0%) |
| Firefighting & Prevention | 0 (0.0%) | 0 (0.0%) |
| Law Enforcement | 0 (0.0%) | 0 (0.0%) |
| Food Preparation & Serving | 0 (0.0%) | 19 (100.0%) |
| Cleaning & Maintenance | 0 (0.0%) | 0 (0.0%) |
| Personal Care & Service | 0 (0.0%) | 0 (0.0%) |
| Total (Category) | 0 (0.0%) | 40 (100.0%) |
| Total (Overall) | 101 (47.6%) | 111 (52.4%) |
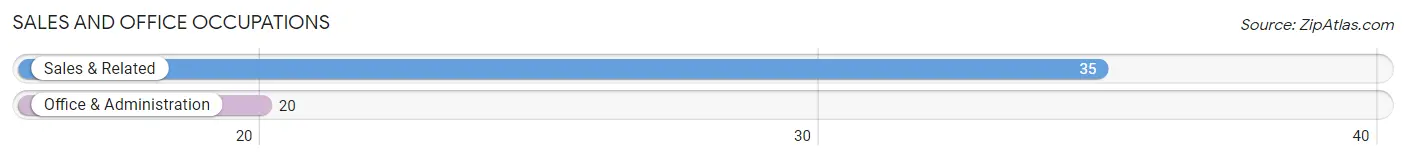
Sales and Office Occupations
The most common Sales and Office occupations in Gloucester are Sales & Related (35 | 16.5%), and Office & Administration (20 | 9.4%).
Sales and Office Occupations by Sex
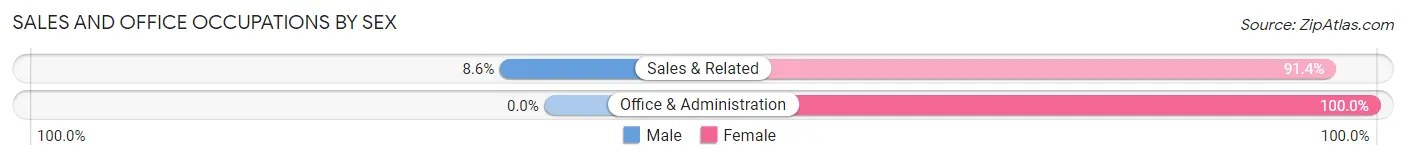
| Occupation | Male | Female |
| Sales & Related | 3 (8.6%) | 32 (91.4%) |
| Office & Administration | 0 (0.0%) | 20 (100.0%) |
| Total (Category) | 3 (5.4%) | 52 (94.6%) |
| Total (Overall) | 101 (47.6%) | 111 (52.4%) |
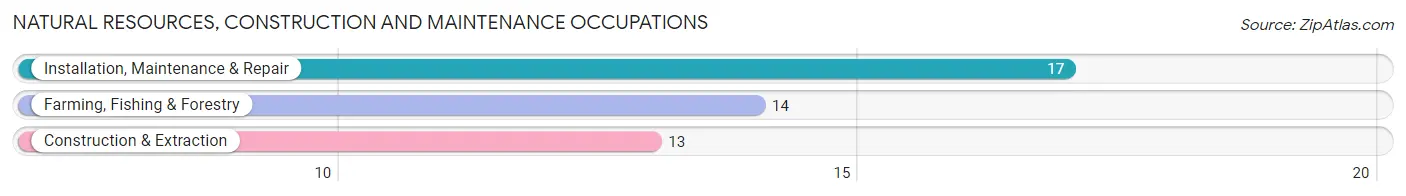
Natural Resources, Construction and Maintenance Occupations
The most common Natural Resources, Construction and Maintenance occupations in Gloucester are Installation, Maintenance & Repair (17 | 8.0%), Farming, Fishing & Forestry (14 | 6.6%), and Construction & Extraction (13 | 6.1%).
Natural Resources, Construction and Maintenance Occupations by Sex
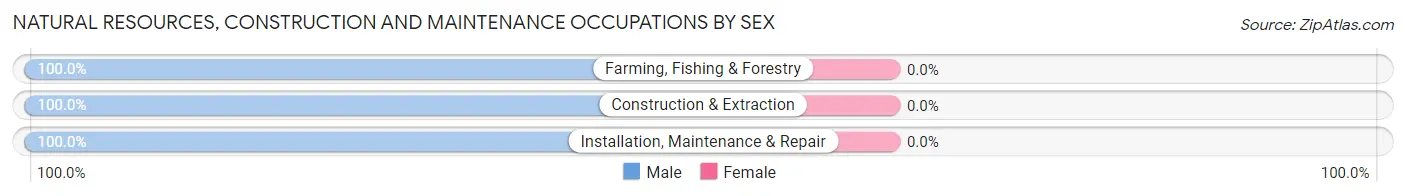
| Occupation | Male | Female |
| Farming, Fishing & Forestry | 14 (100.0%) | 0 (0.0%) |
| Construction & Extraction | 13 (100.0%) | 0 (0.0%) |
| Installation, Maintenance & Repair | 17 (100.0%) | 0 (0.0%) |
| Total (Category) | 44 (100.0%) | 0 (0.0%) |
| Total (Overall) | 101 (47.6%) | 111 (52.4%) |
Production, Transportation and Moving Occupations
The most common Production, Transportation and Moving occupations in Gloucester are , and Production (34 | 16.0%).
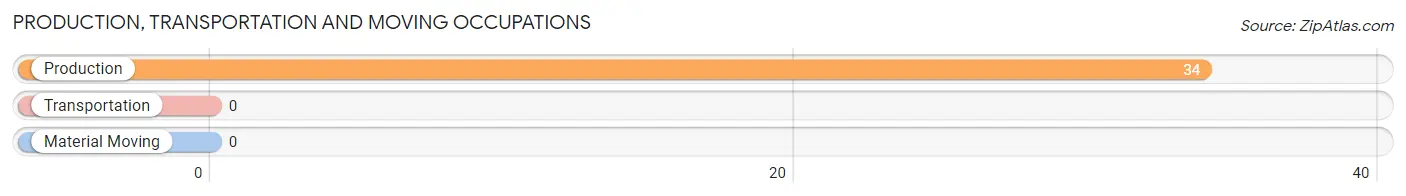
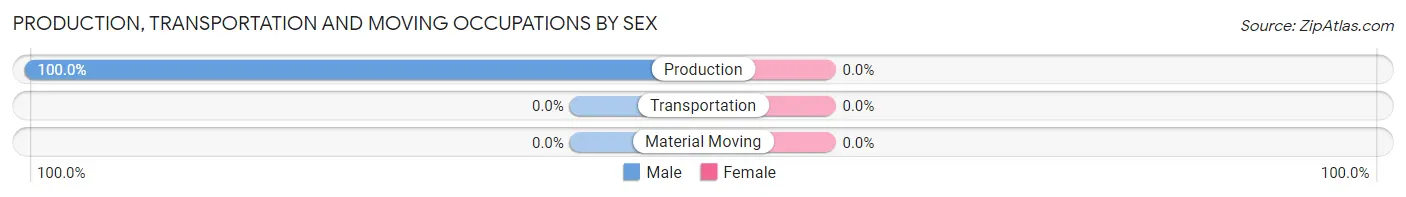
Production, Transportation and Moving Occupations by Sex
| Occupation | Male | Female |
| Production | 34 (100.0%) | 0 (0.0%) |
| Transportation | 0 (0.0%) | 0 (0.0%) |
| Material Moving | 0 (0.0%) | 0 (0.0%) |
| Total (Category) | 34 (100.0%) | 0 (0.0%) |
| Total (Overall) | 101 (47.6%) | 111 (52.4%) |
Employment Industries by Sex in Gloucester
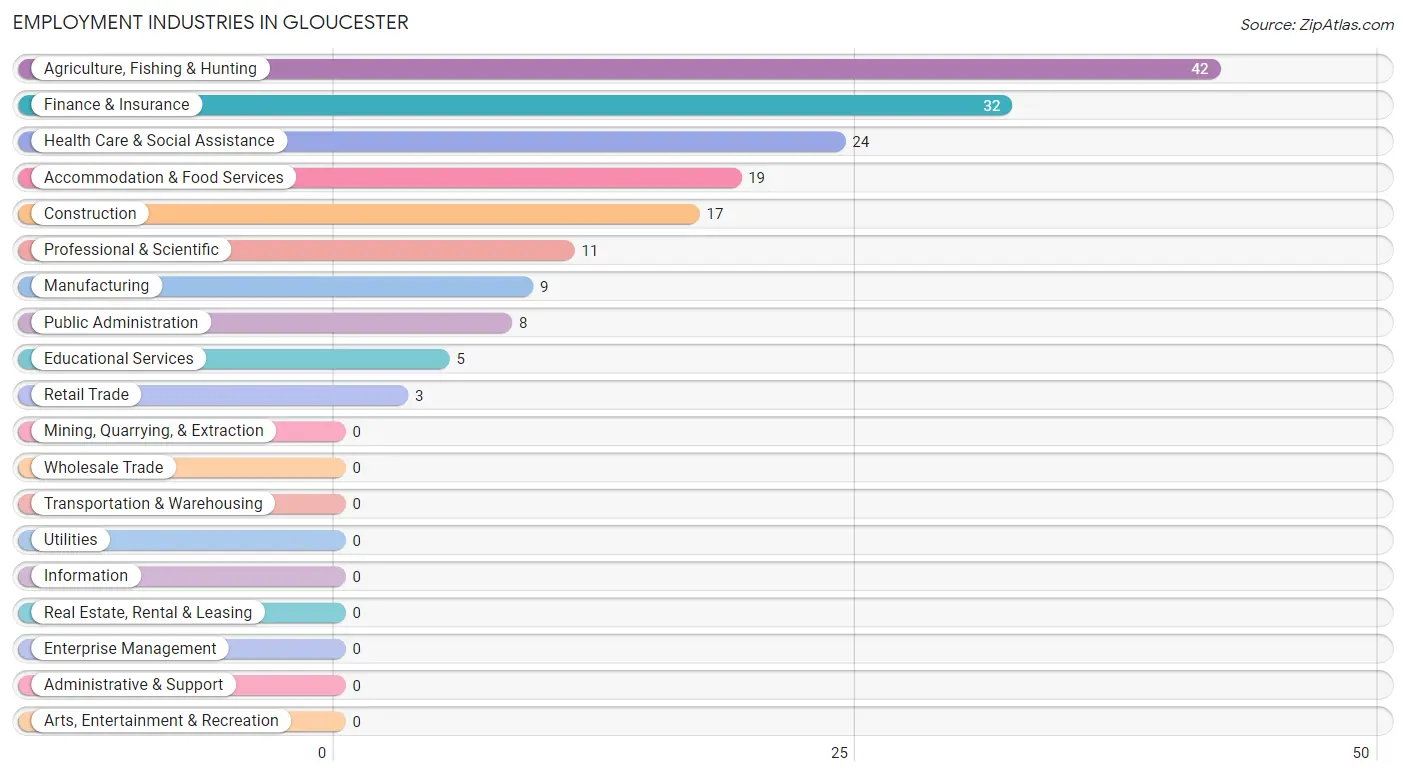
Employment Industries in Gloucester
The major employment industries in Gloucester include Agriculture, Fishing & Hunting (42 | 19.8%), Finance & Insurance (32 | 15.1%), Health Care & Social Assistance (24 | 11.3%), Accommodation & Food Services (19 | 9.0%), and Construction (17 | 8.0%).
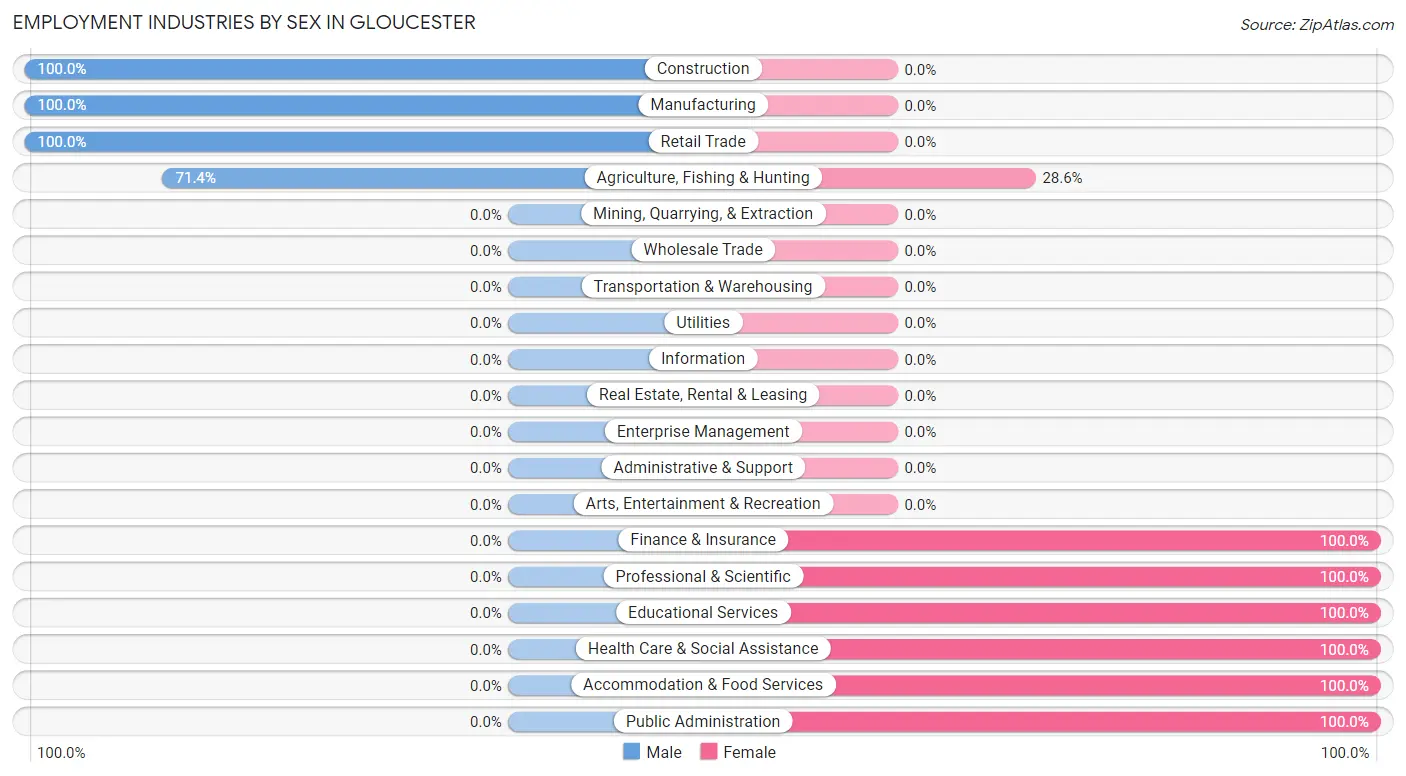
Employment Industries by Sex in Gloucester
The Gloucester industries that see more men than women are Construction (100.0%), Manufacturing (100.0%), and Retail Trade (100.0%), whereas the industries that tend to have a higher number of women are Finance & Insurance (100.0%), Professional & Scientific (100.0%), and Educational Services (100.0%).
| Industry | Male | Female |
| Agriculture, Fishing & Hunting | 30 (71.4%) | 12 (28.6%) |
| Mining, Quarrying, & Extraction | 0 (0.0%) | 0 (0.0%) |
| Construction | 17 (100.0%) | 0 (0.0%) |
| Manufacturing | 9 (100.0%) | 0 (0.0%) |
| Wholesale Trade | 0 (0.0%) | 0 (0.0%) |
| Retail Trade | 3 (100.0%) | 0 (0.0%) |
| Transportation & Warehousing | 0 (0.0%) | 0 (0.0%) |
| Utilities | 0 (0.0%) | 0 (0.0%) |
| Information | 0 (0.0%) | 0 (0.0%) |
| Finance & Insurance | 0 (0.0%) | 32 (100.0%) |
| Real Estate, Rental & Leasing | 0 (0.0%) | 0 (0.0%) |
| Professional & Scientific | 0 (0.0%) | 11 (100.0%) |
| Enterprise Management | 0 (0.0%) | 0 (0.0%) |
| Administrative & Support | 0 (0.0%) | 0 (0.0%) |
| Educational Services | 0 (0.0%) | 5 (100.0%) |
| Health Care & Social Assistance | 0 (0.0%) | 24 (100.0%) |
| Arts, Entertainment & Recreation | 0 (0.0%) | 0 (0.0%) |
| Accommodation & Food Services | 0 (0.0%) | 19 (100.0%) |
| Public Administration | 0 (0.0%) | 8 (100.0%) |
| Total | 101 (47.6%) | 111 (52.4%) |
Education in Gloucester
School Enrollment in Gloucester
The most common levels of schooling among the 125 students in Gloucester are middle school (57 | 45.6%), elementary school (41 | 32.8%), and high school (27 | 21.6%).
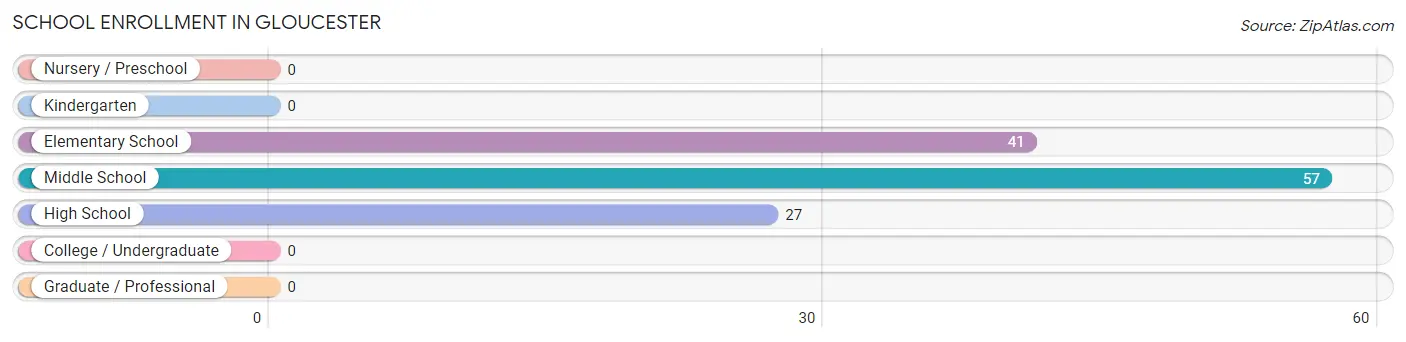
| School Level | # Students | % Students |
| Nursery / Preschool | 0 | 0.0% |
| Kindergarten | 0 | 0.0% |
| Elementary School | 41 | 32.8% |
| Middle School | 57 | 45.6% |
| High School | 27 | 21.6% |
| College / Undergraduate | 0 | 0.0% |
| Graduate / Professional | 0 | 0.0% |
| Total | 125 | 100.0% |
School Enrollment by Age by Funding Source in Gloucester
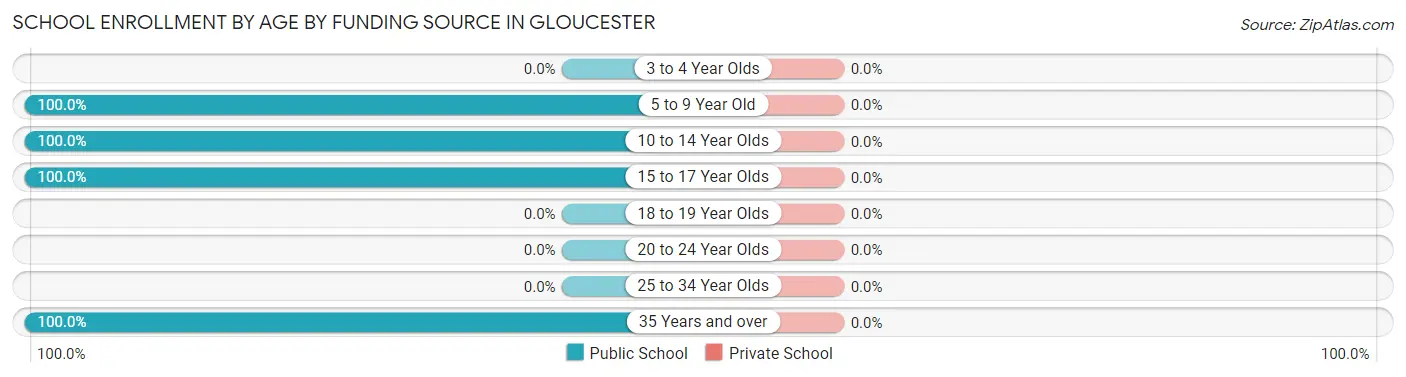
| Age Bracket | Public School | Private School |
| 3 to 4 Year Olds | 0 (0.0%) | 0 (0.0%) |
| 5 to 9 Year Old | 41 (100.0%) | 0 (0.0%) |
| 10 to 14 Year Olds | 57 (100.0%) | 0 (0.0%) |
| 15 to 17 Year Olds | 19 (100.0%) | 0 (0.0%) |
| 18 to 19 Year Olds | 0 (0.0%) | 0 (0.0%) |
| 20 to 24 Year Olds | 0 (0.0%) | 0 (0.0%) |
| 25 to 34 Year Olds | 0 (0.0%) | 0 (0.0%) |
| 35 Years and over | 8 (100.0%) | 0 (0.0%) |
| Total | 125 (100.0%) | 0 (0.0%) |
Educational Attainment by Field of Study in Gloucester
Communications (32 | 27.8%), literature & languages (18 | 15.7%), arts & humanities (16 | 13.9%), bio, nature & agricultural (12 | 10.4%), and engineering (12 | 10.4%) are the most common fields of study among 115 individuals in Gloucester who have obtained a bachelor's degree or higher.
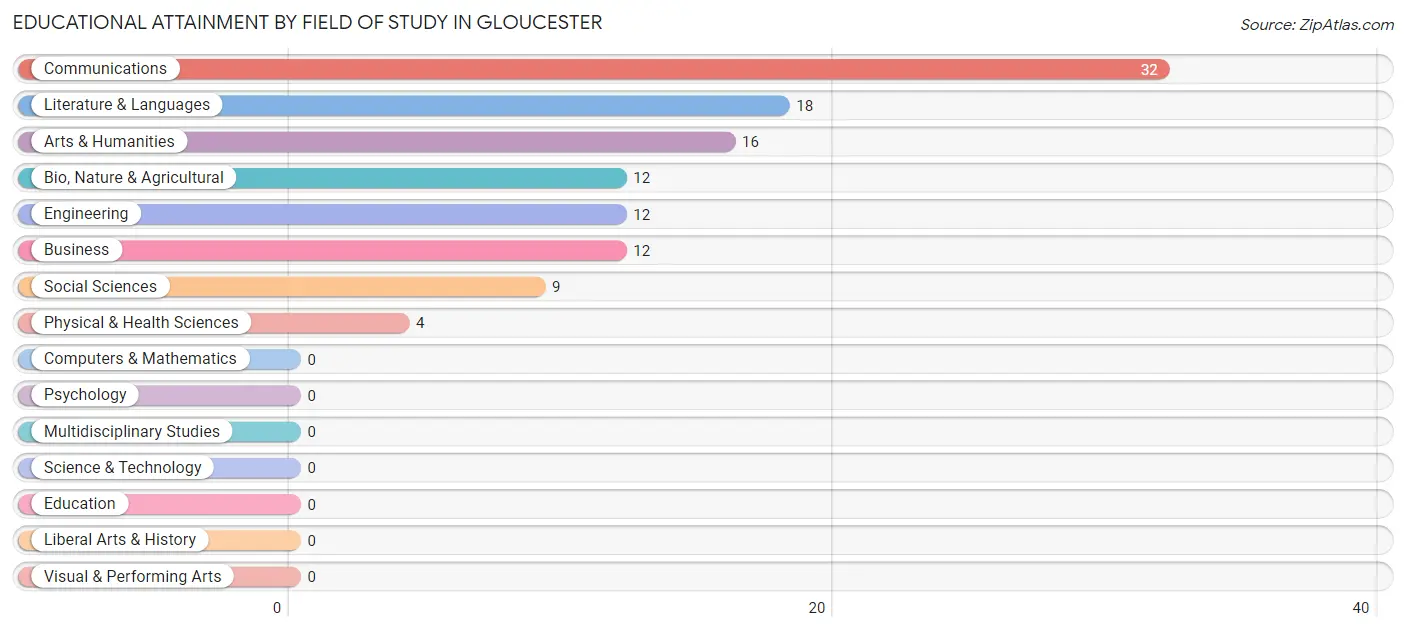
| Field of Study | # Graduates | % Graduates |
| Computers & Mathematics | 0 | 0.0% |
| Bio, Nature & Agricultural | 12 | 10.4% |
| Physical & Health Sciences | 4 | 3.5% |
| Psychology | 0 | 0.0% |
| Social Sciences | 9 | 7.8% |
| Engineering | 12 | 10.4% |
| Multidisciplinary Studies | 0 | 0.0% |
| Science & Technology | 0 | 0.0% |
| Business | 12 | 10.4% |
| Education | 0 | 0.0% |
| Literature & Languages | 18 | 15.7% |
| Liberal Arts & History | 0 | 0.0% |
| Visual & Performing Arts | 0 | 0.0% |
| Communications | 32 | 27.8% |
| Arts & Humanities | 16 | 13.9% |
| Total | 115 | 100.0% |
Transportation & Commute in Gloucester
Vehicle Availability by Sex in Gloucester
The most prevalent vehicle ownership categories in Gloucester are males with 2 vehicles (62, accounting for 61.4%) and females with 2 vehicles (68, making up 58.5%).
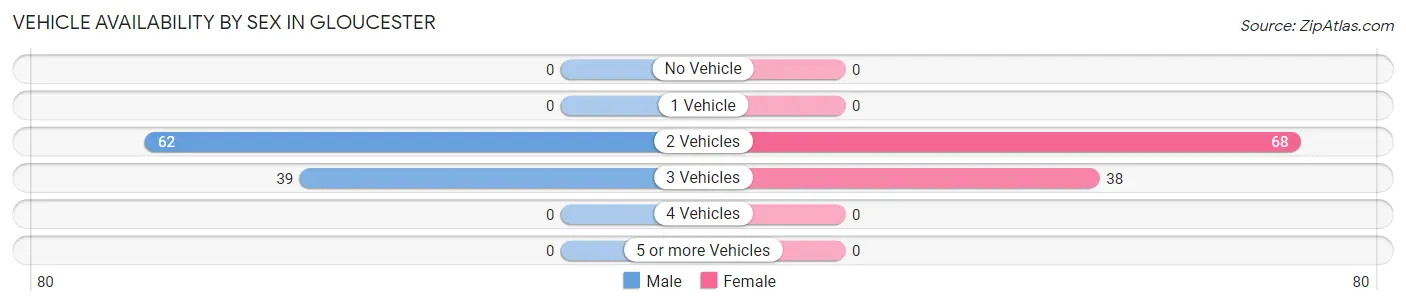
| Vehicles Available | Male | Female |
| No Vehicle | 0 (0.0%) | 0 (0.0%) |
| 1 Vehicle | 0 (0.0%) | 0 (0.0%) |
| 2 Vehicles | 62 (61.4%) | 68 (64.1%) |
| 3 Vehicles | 39 (38.6%) | 38 (35.8%) |
| 4 Vehicles | 0 (0.0%) | 0 (0.0%) |
| 5 or more Vehicles | 0 (0.0%) | 0 (0.0%) |
| Total | 101 (100.0%) | 106 (100.0%) |
Commute Time in Gloucester
The most frequently occuring commute durations in Gloucester are 45 to 59 minutes (46 commuters, 25.7%), 20 to 24 minutes (40 commuters, 22.4%), and 35 to 39 minutes (24 commuters, 13.4%).
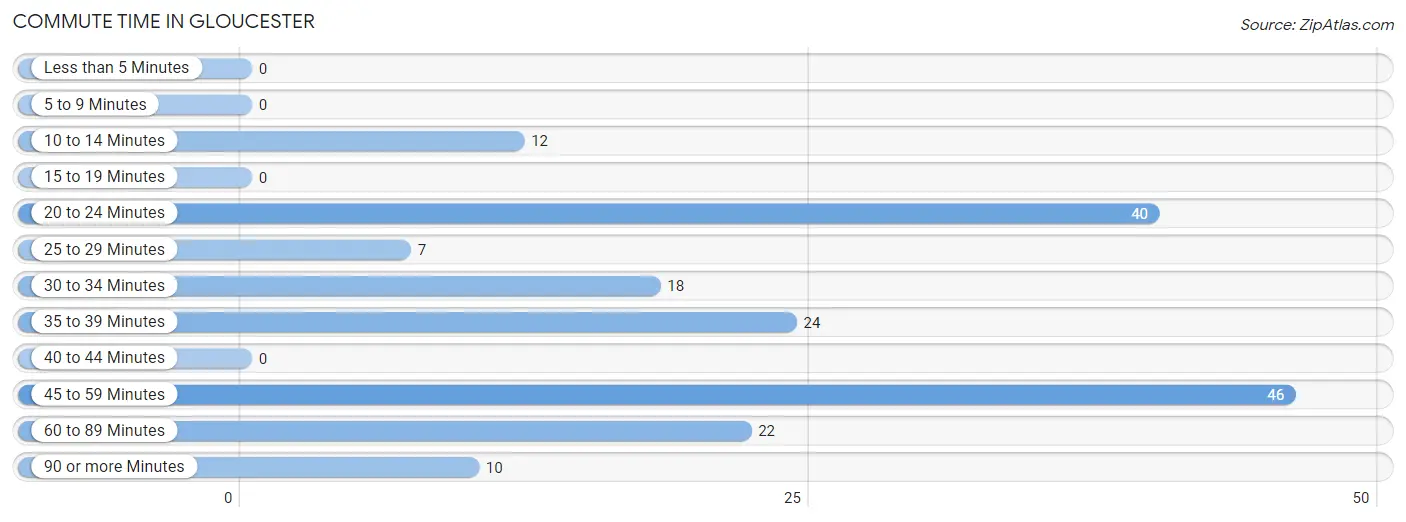
| Commute Time | # Commuters | % Commuters |
| Less than 5 Minutes | 0 | 0.0% |
| 5 to 9 Minutes | 0 | 0.0% |
| 10 to 14 Minutes | 12 | 6.7% |
| 15 to 19 Minutes | 0 | 0.0% |
| 20 to 24 Minutes | 40 | 22.4% |
| 25 to 29 Minutes | 7 | 3.9% |
| 30 to 34 Minutes | 18 | 10.1% |
| 35 to 39 Minutes | 24 | 13.4% |
| 40 to 44 Minutes | 0 | 0.0% |
| 45 to 59 Minutes | 46 | 25.7% |
| 60 to 89 Minutes | 22 | 12.3% |
| 90 or more Minutes | 10 | 5.6% |
Commute Time by Sex in Gloucester
The most common commute times in Gloucester are 45 to 59 minutes (38 commuters, 44.7%) for males and 20 to 24 minutes (40 commuters, 42.5%) for females.
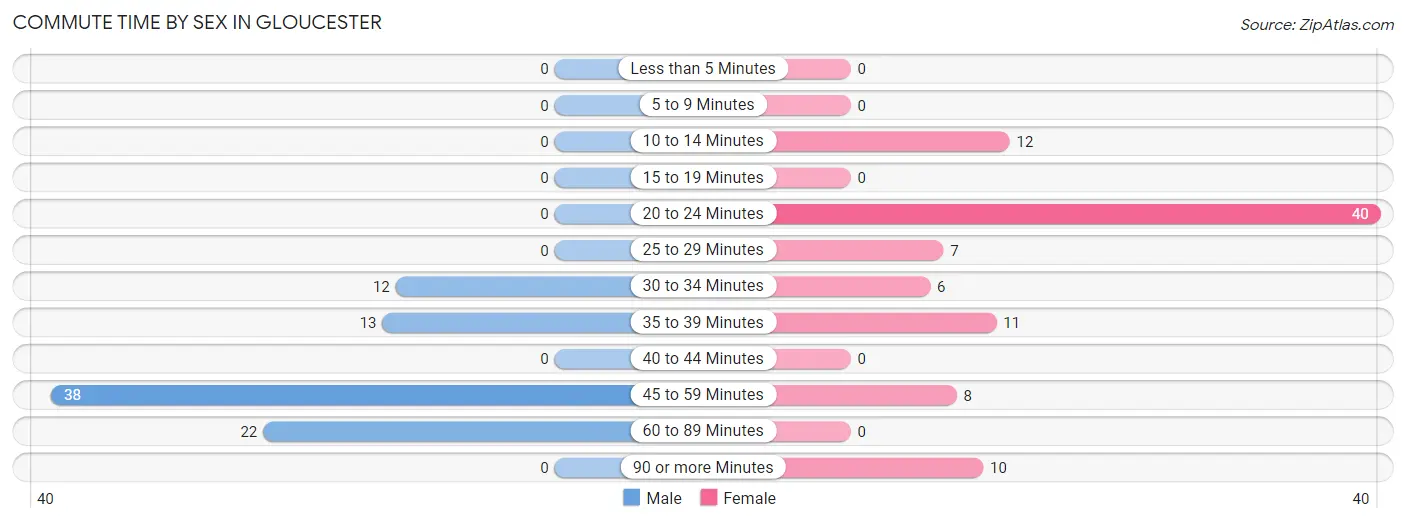
| Commute Time | Male | Female |
| Less than 5 Minutes | 0 (0.0%) | 0 (0.0%) |
| 5 to 9 Minutes | 0 (0.0%) | 0 (0.0%) |
| 10 to 14 Minutes | 0 (0.0%) | 12 (12.8%) |
| 15 to 19 Minutes | 0 (0.0%) | 0 (0.0%) |
| 20 to 24 Minutes | 0 (0.0%) | 40 (42.5%) |
| 25 to 29 Minutes | 0 (0.0%) | 7 (7.4%) |
| 30 to 34 Minutes | 12 (14.1%) | 6 (6.4%) |
| 35 to 39 Minutes | 13 (15.3%) | 11 (11.7%) |
| 40 to 44 Minutes | 0 (0.0%) | 0 (0.0%) |
| 45 to 59 Minutes | 38 (44.7%) | 8 (8.5%) |
| 60 to 89 Minutes | 22 (25.9%) | 0 (0.0%) |
| 90 or more Minutes | 0 (0.0%) | 10 (10.6%) |
Time of Departure to Work by Sex in Gloucester
The most frequent times of departure to work in Gloucester are 6:00 AM to 6:29 AM (34, 40.0%) for males and 7:30 AM to 7:59 AM (43, 45.7%) for females.
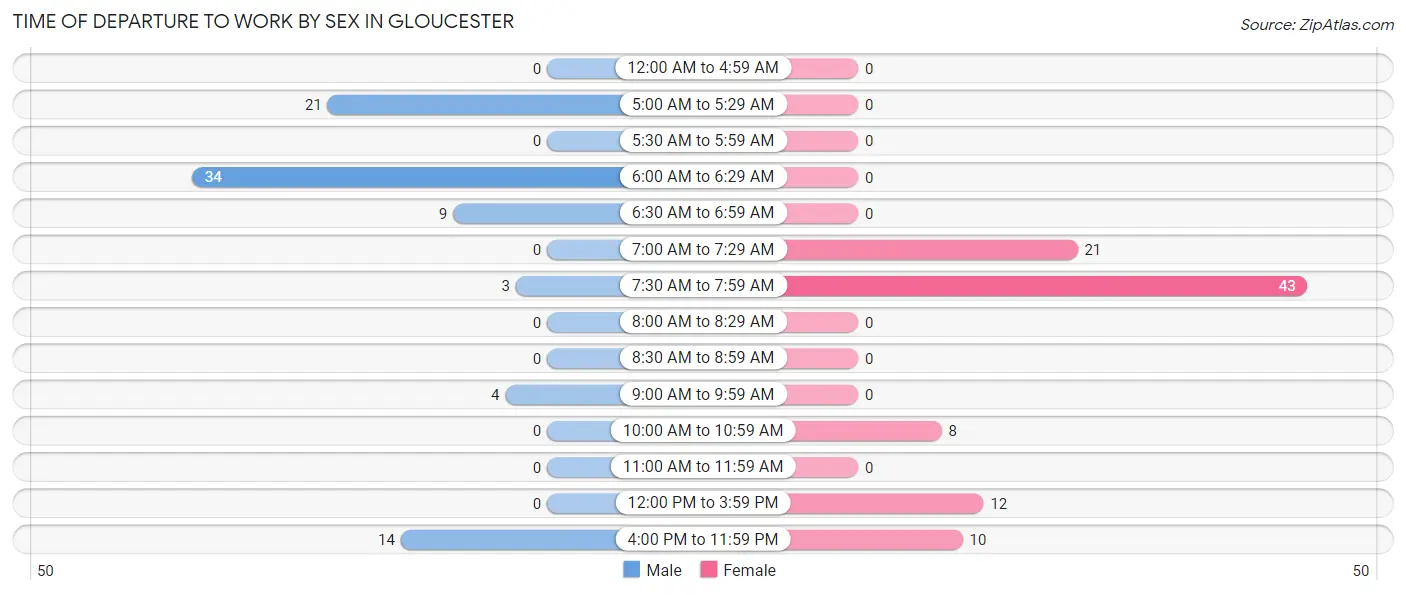
| Time of Departure | Male | Female |
| 12:00 AM to 4:59 AM | 0 (0.0%) | 0 (0.0%) |
| 5:00 AM to 5:29 AM | 21 (24.7%) | 0 (0.0%) |
| 5:30 AM to 5:59 AM | 0 (0.0%) | 0 (0.0%) |
| 6:00 AM to 6:29 AM | 34 (40.0%) | 0 (0.0%) |
| 6:30 AM to 6:59 AM | 9 (10.6%) | 0 (0.0%) |
| 7:00 AM to 7:29 AM | 0 (0.0%) | 21 (22.3%) |
| 7:30 AM to 7:59 AM | 3 (3.5%) | 43 (45.7%) |
| 8:00 AM to 8:29 AM | 0 (0.0%) | 0 (0.0%) |
| 8:30 AM to 8:59 AM | 0 (0.0%) | 0 (0.0%) |
| 9:00 AM to 9:59 AM | 4 (4.7%) | 0 (0.0%) |
| 10:00 AM to 10:59 AM | 0 (0.0%) | 8 (8.5%) |
| 11:00 AM to 11:59 AM | 0 (0.0%) | 0 (0.0%) |
| 12:00 PM to 3:59 PM | 0 (0.0%) | 12 (12.8%) |
| 4:00 PM to 11:59 PM | 14 (16.5%) | 10 (10.6%) |
| Total | 85 (100.0%) | 94 (100.0%) |
Housing Occupancy in Gloucester
Occupancy by Ownership in Gloucester
Of the total 212 dwellings in Gloucester, owner-occupied units account for 171 (80.7%), while renter-occupied units make up 41 (19.3%).
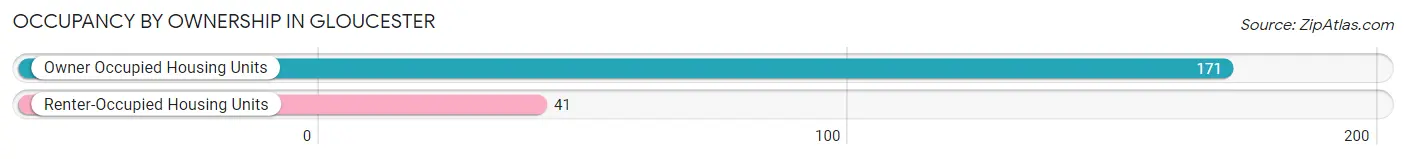
| Occupancy | # Housing Units | % Housing Units |
| Owner Occupied Housing Units | 171 | 80.7% |
| Renter-Occupied Housing Units | 41 | 19.3% |
| Total Occupied Housing Units | 212 | 100.0% |
Occupancy by Household Size in Gloucester
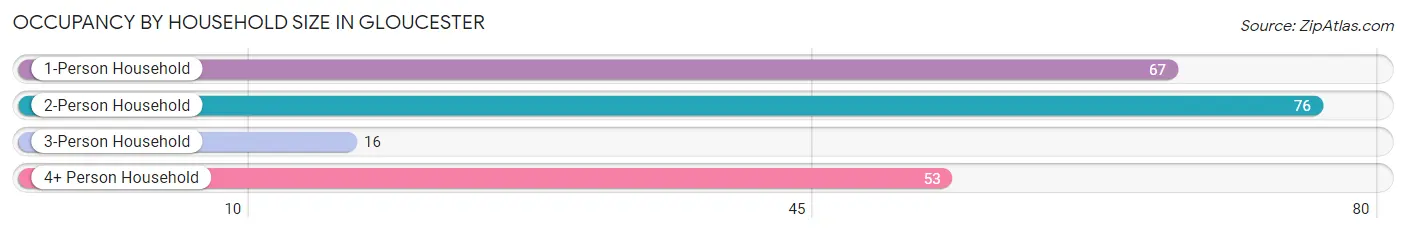
| Household Size | # Housing Units | % Housing Units |
| 1-Person Household | 67 | 31.6% |
| 2-Person Household | 76 | 35.8% |
| 3-Person Household | 16 | 7.5% |
| 4+ Person Household | 53 | 25.0% |
| Total Housing Units | 212 | 100.0% |
Occupancy by Ownership by Household Size in Gloucester
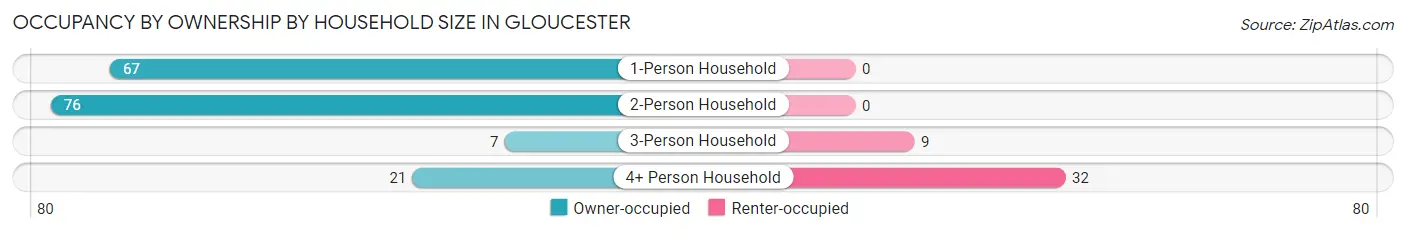
| Household Size | Owner-occupied | Renter-occupied |
| 1-Person Household | 67 (100.0%) | 0 (0.0%) |
| 2-Person Household | 76 (100.0%) | 0 (0.0%) |
| 3-Person Household | 7 (43.8%) | 9 (56.2%) |
| 4+ Person Household | 21 (39.6%) | 32 (60.4%) |
| Total Housing Units | 171 (80.7%) | 41 (19.3%) |
Occupancy by Educational Attainment in Gloucester
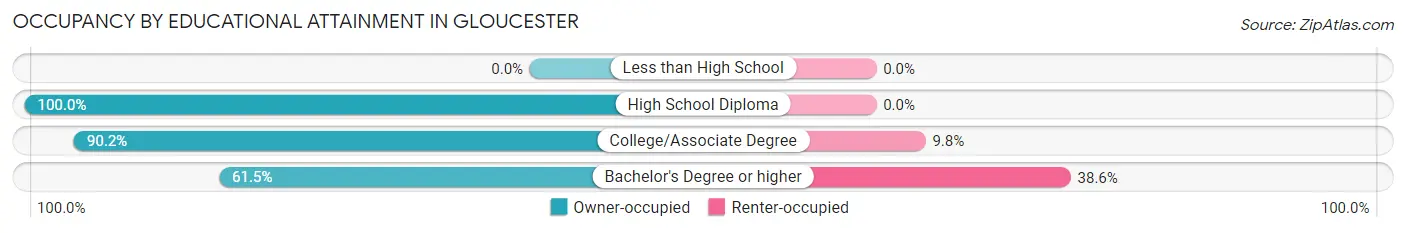
| Household Size | Owner-occupied | Renter-occupied |
| Less than High School | 0 (0.0%) | 0 (0.0%) |
| High School Diploma | 37 (100.0%) | 0 (0.0%) |
| College/Associate Degree | 83 (90.2%) | 9 (9.8%) |
| Bachelor's Degree or higher | 51 (61.5%) | 32 (38.6%) |
Occupancy by Age of Householder in Gloucester
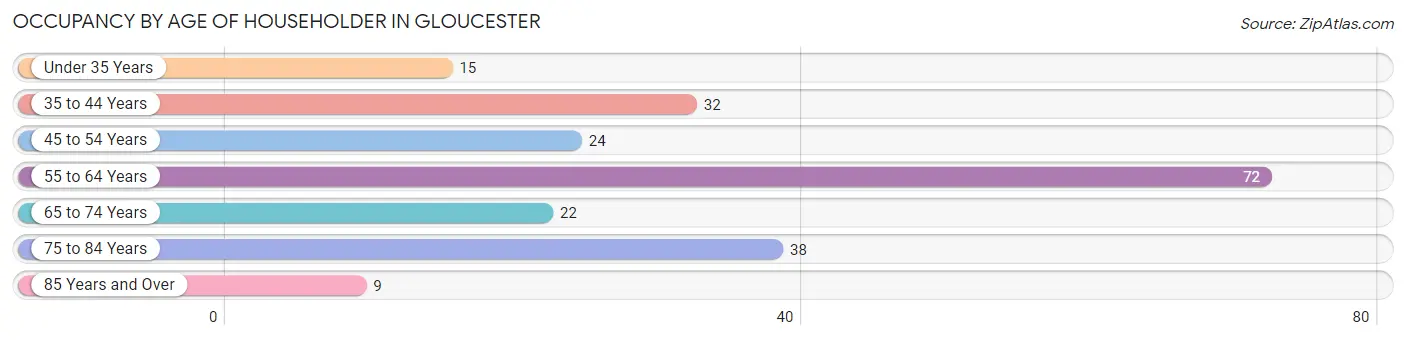
| Age Bracket | # Households | % Households |
| Under 35 Years | 15 | 7.1% |
| 35 to 44 Years | 32 | 15.1% |
| 45 to 54 Years | 24 | 11.3% |
| 55 to 64 Years | 72 | 34.0% |
| 65 to 74 Years | 22 | 10.4% |
| 75 to 84 Years | 38 | 17.9% |
| 85 Years and Over | 9 | 4.3% |
| Total | 212 | 100.0% |
Housing Finances in Gloucester
Median Income by Occupancy in Gloucester
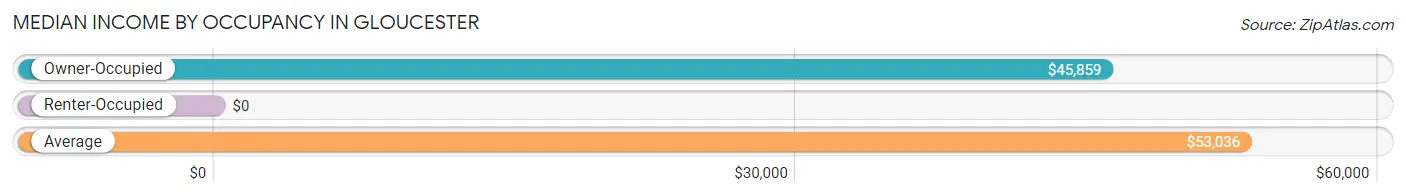
| Occupancy Type | # Households | Median Income |
| Owner-Occupied | 171 (80.7%) | $45,859 |
| Renter-Occupied | 41 (19.3%) | $0 |
| Average | 212 (100.0%) | $53,036 |
Occupancy by Householder Income Bracket in Gloucester
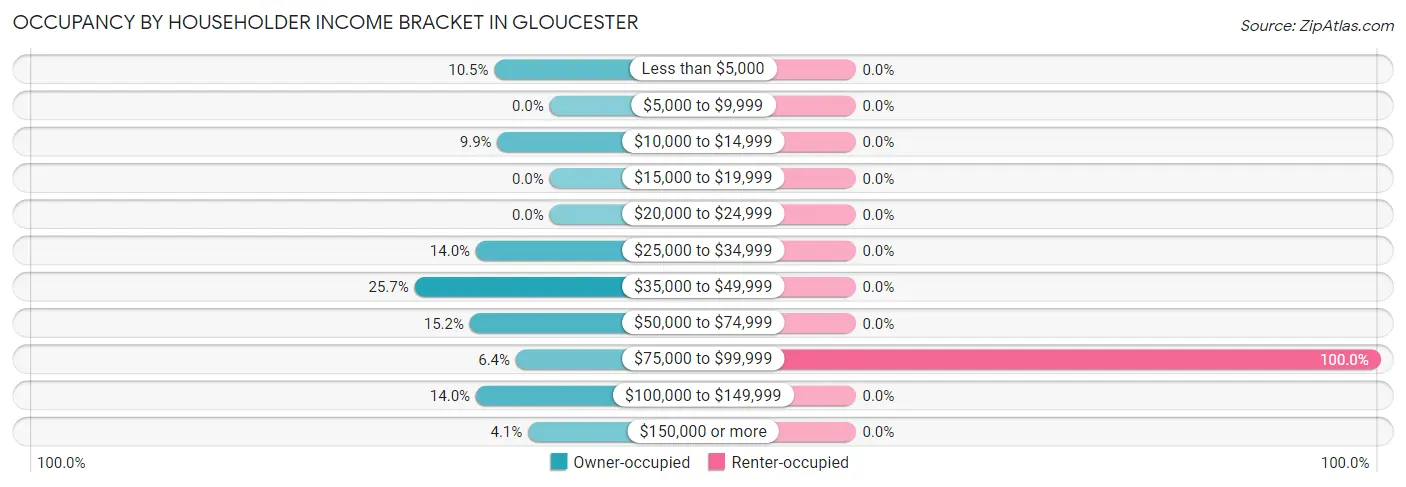
| Income Bracket | Owner-occupied | Renter-occupied |
| Less than $5,000 | 18 (10.5%) | 0 (0.0%) |
| $5,000 to $9,999 | 0 (0.0%) | 0 (0.0%) |
| $10,000 to $14,999 | 17 (9.9%) | 0 (0.0%) |
| $15,000 to $19,999 | 0 (0.0%) | 0 (0.0%) |
| $20,000 to $24,999 | 0 (0.0%) | 0 (0.0%) |
| $25,000 to $34,999 | 24 (14.0%) | 0 (0.0%) |
| $35,000 to $49,999 | 44 (25.7%) | 0 (0.0%) |
| $50,000 to $74,999 | 26 (15.2%) | 0 (0.0%) |
| $75,000 to $99,999 | 11 (6.4%) | 41 (100.0%) |
| $100,000 to $149,999 | 24 (14.0%) | 0 (0.0%) |
| $150,000 or more | 7 (4.1%) | 0 (0.0%) |
| Total | 171 (100.0%) | 41 (100.0%) |
Monthly Housing Cost Tiers in Gloucester
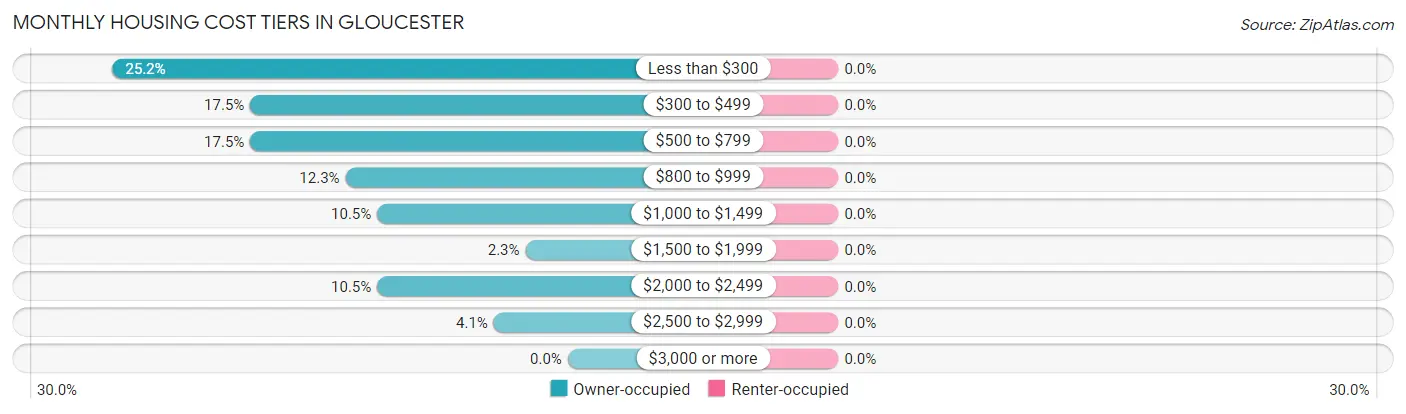
| Monthly Cost | Owner-occupied | Renter-occupied |
| Less than $300 | 43 (25.2%) | 0 (0.0%) |
| $300 to $499 | 30 (17.5%) | 0 (0.0%) |
| $500 to $799 | 30 (17.5%) | 0 (0.0%) |
| $800 to $999 | 21 (12.3%) | 0 (0.0%) |
| $1,000 to $1,499 | 18 (10.5%) | 0 (0.0%) |
| $1,500 to $1,999 | 4 (2.3%) | 0 (0.0%) |
| $2,000 to $2,499 | 18 (10.5%) | 0 (0.0%) |
| $2,500 to $2,999 | 7 (4.1%) | 0 (0.0%) |
| $3,000 or more | 0 (0.0%) | 0 (0.0%) |
| Total | 171 (100.0%) | 41 (100.0%) |
Physical Housing Characteristics in Gloucester
Housing Structures in Gloucester
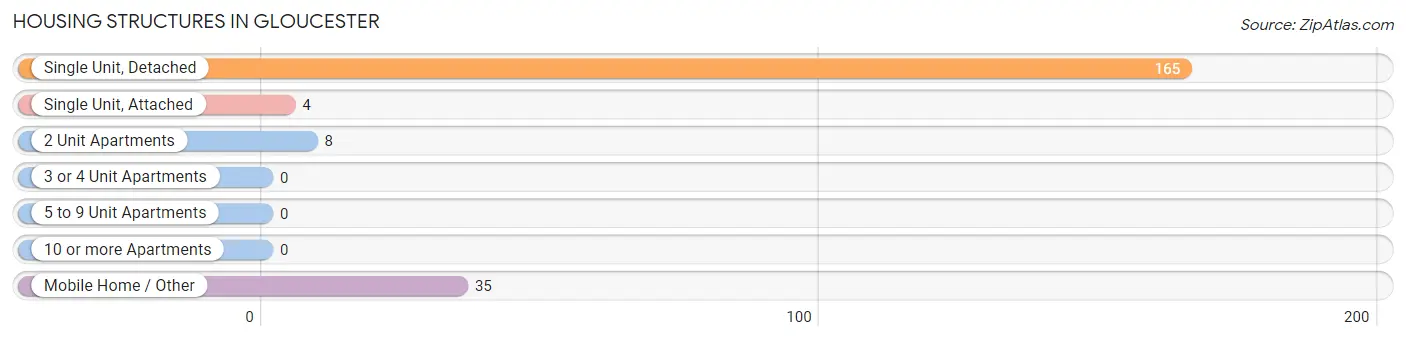
| Structure Type | # Housing Units | % Housing Units |
| Single Unit, Detached | 165 | 77.8% |
| Single Unit, Attached | 4 | 1.9% |
| 2 Unit Apartments | 8 | 3.8% |
| 3 or 4 Unit Apartments | 0 | 0.0% |
| 5 to 9 Unit Apartments | 0 | 0.0% |
| 10 or more Apartments | 0 | 0.0% |
| Mobile Home / Other | 35 | 16.5% |
| Total | 212 | 100.0% |
Housing Structures by Occupancy in Gloucester
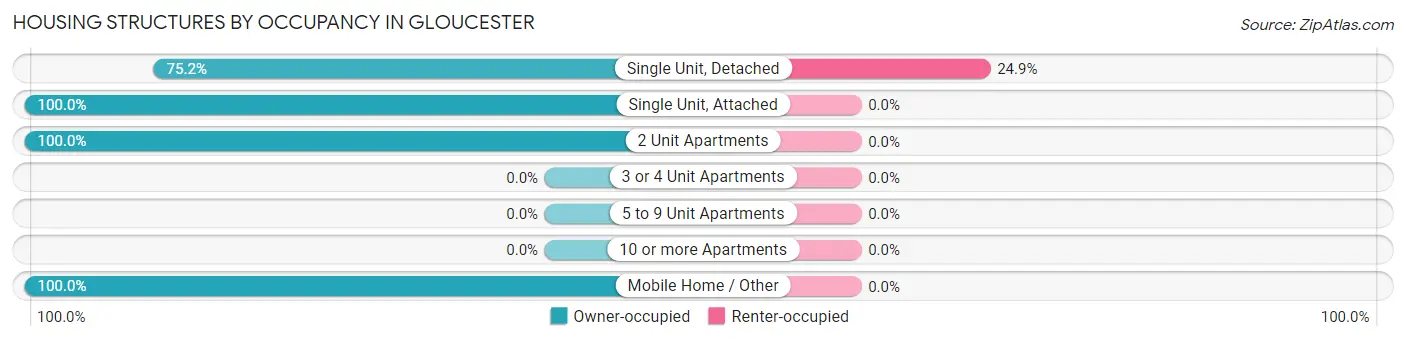
| Structure Type | Owner-occupied | Renter-occupied |
| Single Unit, Detached | 124 (75.1%) | 41 (24.8%) |
| Single Unit, Attached | 4 (100.0%) | 0 (0.0%) |
| 2 Unit Apartments | 8 (100.0%) | 0 (0.0%) |
| 3 or 4 Unit Apartments | 0 (0.0%) | 0 (0.0%) |
| 5 to 9 Unit Apartments | 0 (0.0%) | 0 (0.0%) |
| 10 or more Apartments | 0 (0.0%) | 0 (0.0%) |
| Mobile Home / Other | 35 (100.0%) | 0 (0.0%) |
| Total | 171 (80.7%) | 41 (19.3%) |
Housing Structures by Number of Rooms in Gloucester
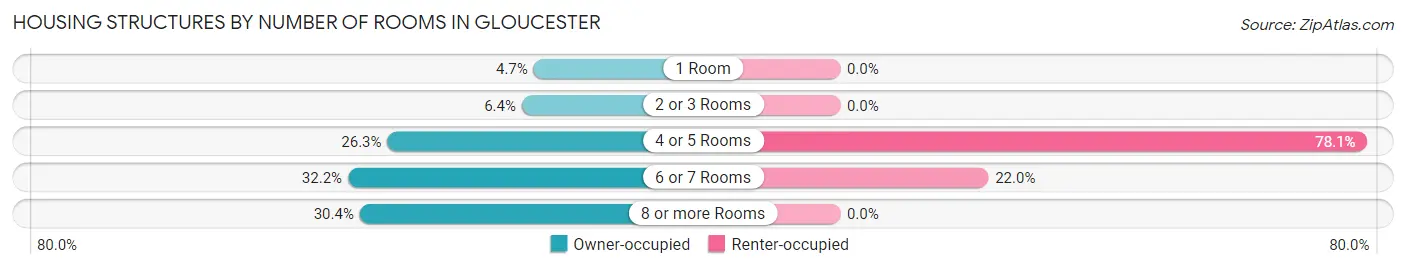
| Number of Rooms | Owner-occupied | Renter-occupied |
| 1 Room | 8 (4.7%) | 0 (0.0%) |
| 2 or 3 Rooms | 11 (6.4%) | 0 (0.0%) |
| 4 or 5 Rooms | 45 (26.3%) | 32 (78.0%) |
| 6 or 7 Rooms | 55 (32.2%) | 9 (22.0%) |
| 8 or more Rooms | 52 (30.4%) | 0 (0.0%) |
| Total | 171 (100.0%) | 41 (100.0%) |
Housing Structure by Heating Type in Gloucester
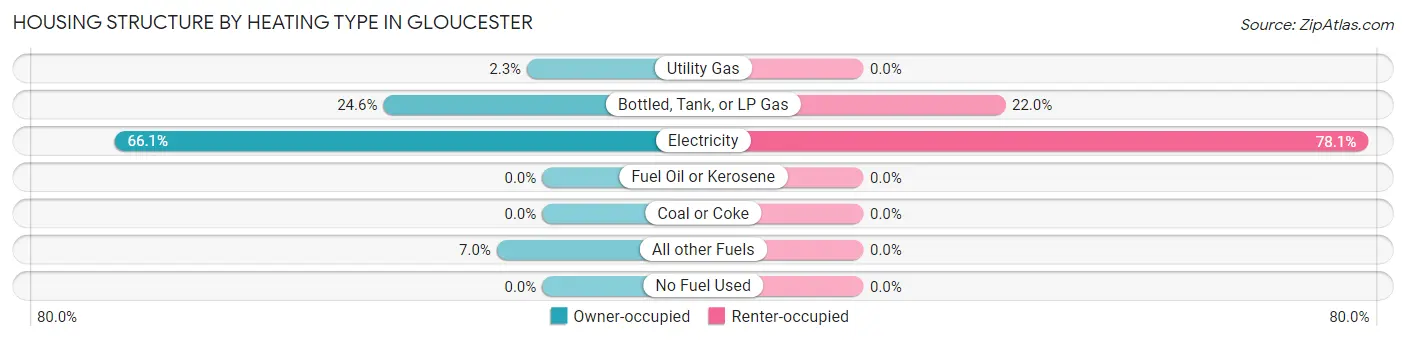
| Heating Type | Owner-occupied | Renter-occupied |
| Utility Gas | 4 (2.3%) | 0 (0.0%) |
| Bottled, Tank, or LP Gas | 42 (24.6%) | 9 (22.0%) |
| Electricity | 113 (66.1%) | 32 (78.0%) |
| Fuel Oil or Kerosene | 0 (0.0%) | 0 (0.0%) |
| Coal or Coke | 0 (0.0%) | 0 (0.0%) |
| All other Fuels | 12 (7.0%) | 0 (0.0%) |
| No Fuel Used | 0 (0.0%) | 0 (0.0%) |
| Total | 171 (100.0%) | 41 (100.0%) |
Household Vehicle Usage in Gloucester
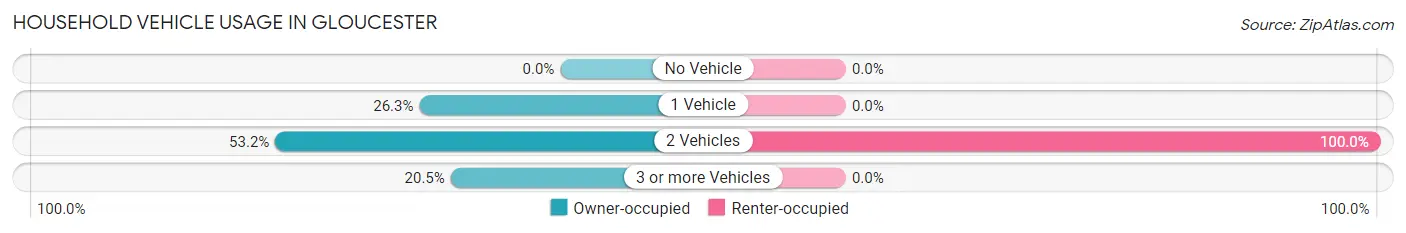
| Vehicles per Household | Owner-occupied | Renter-occupied |
| No Vehicle | 0 (0.0%) | 0 (0.0%) |
| 1 Vehicle | 45 (26.3%) | 0 (0.0%) |
| 2 Vehicles | 91 (53.2%) | 41 (100.0%) |
| 3 or more Vehicles | 35 (20.5%) | 0 (0.0%) |
| Total | 171 (100.0%) | 41 (100.0%) |
Real Estate & Mortgages in Gloucester
Real Estate and Mortgage Overview in Gloucester
| Characteristic | Without Mortgage | With Mortgage |
| Housing Units | 103 | 68 |
| Median Property Value | - | - |
| Median Household Income | $33,438 | $0 |
| Monthly Housing Costs | $378 | $0 |
| Real Estate Taxes | $722 | $0 |
Property Value by Mortgage Status in Gloucester
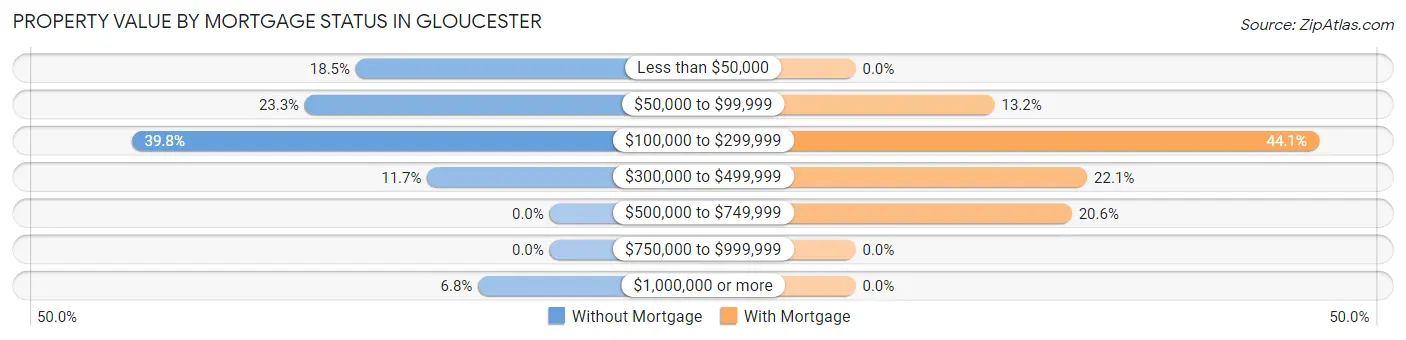
| Property Value | Without Mortgage | With Mortgage |
| Less than $50,000 | 19 (18.4%) | 0 (0.0%) |
| $50,000 to $99,999 | 24 (23.3%) | 9 (13.2%) |
| $100,000 to $299,999 | 41 (39.8%) | 30 (44.1%) |
| $300,000 to $499,999 | 12 (11.7%) | 15 (22.1%) |
| $500,000 to $749,999 | 0 (0.0%) | 14 (20.6%) |
| $750,000 to $999,999 | 0 (0.0%) | 0 (0.0%) |
| $1,000,000 or more | 7 (6.8%) | 0 (0.0%) |
| Total | 103 (100.0%) | 68 (100.0%) |
Household Income by Mortgage Status in Gloucester
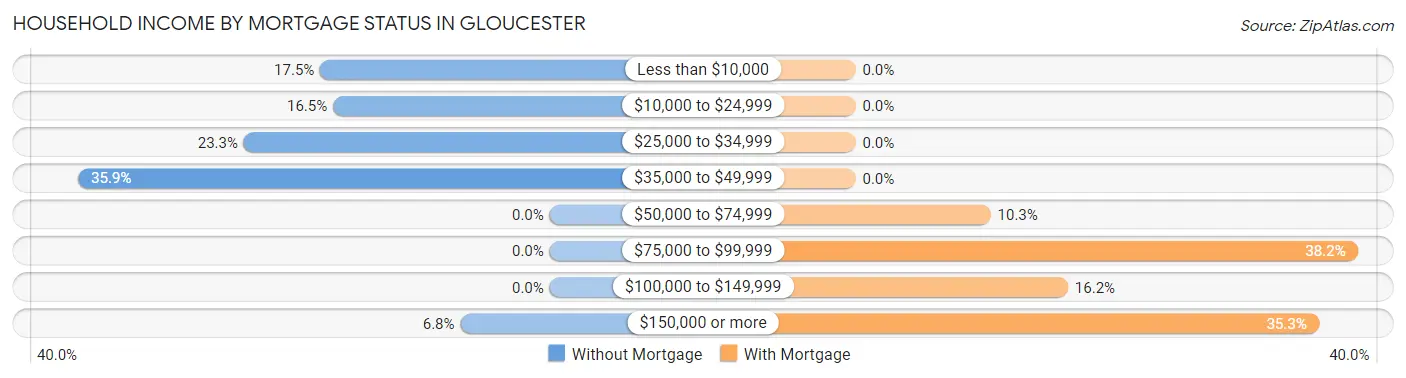
| Household Income | Without Mortgage | With Mortgage |
| Less than $10,000 | 18 (17.5%) | 0 (0.0%) |
| $10,000 to $24,999 | 17 (16.5%) | 0 (0.0%) |
| $25,000 to $34,999 | 24 (23.3%) | 0 (0.0%) |
| $35,000 to $49,999 | 37 (35.9%) | 0 (0.0%) |
| $50,000 to $74,999 | 0 (0.0%) | 7 (10.3%) |
| $75,000 to $99,999 | 0 (0.0%) | 26 (38.2%) |
| $100,000 to $149,999 | 0 (0.0%) | 11 (16.2%) |
| $150,000 or more | 7 (6.8%) | 24 (35.3%) |
| Total | 103 (100.0%) | 68 (100.0%) |
Property Value to Household Income Ratio in Gloucester
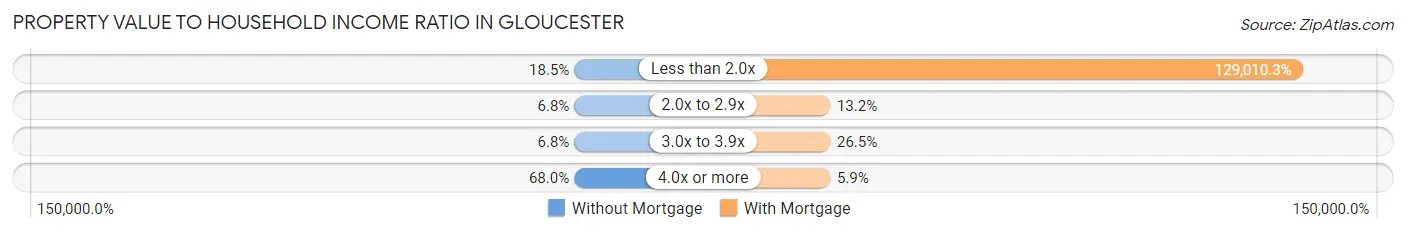
| Value-to-Income Ratio | Without Mortgage | With Mortgage |
| Less than 2.0x | 19 (18.4%) | 87,727 (129,010.3%) |
| 2.0x to 2.9x | 7 (6.8%) | 9 (13.2%) |
| 3.0x to 3.9x | 7 (6.8%) | 18 (26.5%) |
| 4.0x or more | 70 (68.0%) | 4 (5.9%) |
| Total | 103 (100.0%) | 68 (100.0%) |
Real Estate Taxes by Mortgage Status in Gloucester
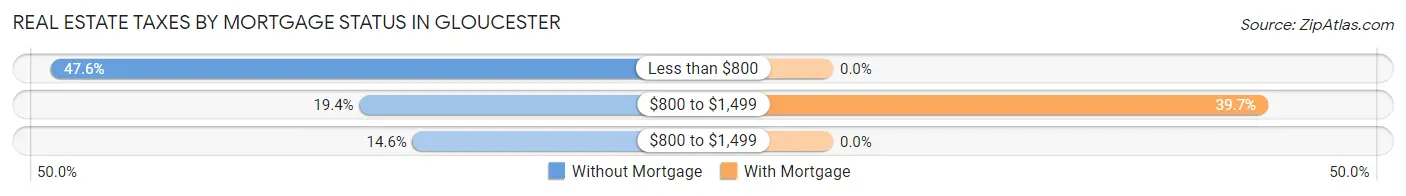
| Property Taxes | Without Mortgage | With Mortgage |
| Less than $800 | 49 (47.6%) | 0 (0.0%) |
| $800 to $1,499 | 20 (19.4%) | 27 (39.7%) |
| $800 to $1,499 | 15 (14.6%) | 0 (0.0%) |
| Total | 103 (100.0%) | 68 (100.0%) |
Health & Disability in Gloucester
Health Insurance Coverage by Age in Gloucester
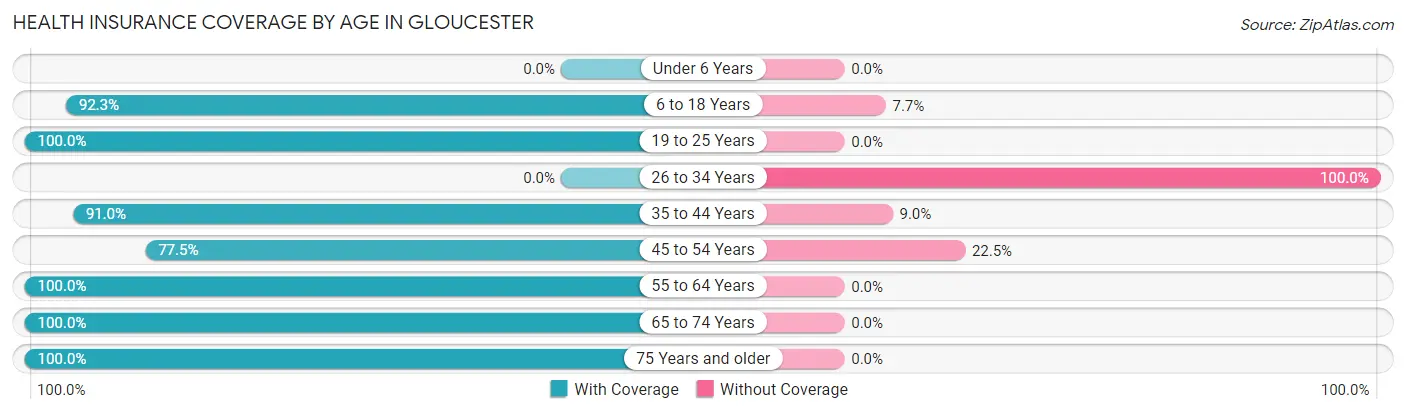
| Age Bracket | With Coverage | Without Coverage |
| Under 6 Years | 0 (0.0%) | 0 (0.0%) |
| 6 to 18 Years | 108 (92.3%) | 9 (7.7%) |
| 19 to 25 Years | 9 (100.0%) | 0 (0.0%) |
| 26 to 34 Years | 0 (0.0%) | 32 (100.0%) |
| 35 to 44 Years | 81 (91.0%) | 8 (9.0%) |
| 45 to 54 Years | 31 (77.5%) | 9 (22.5%) |
| 55 to 64 Years | 92 (100.0%) | 0 (0.0%) |
| 65 to 74 Years | 60 (100.0%) | 0 (0.0%) |
| 75 Years and older | 67 (100.0%) | 0 (0.0%) |
| Total | 448 (88.5%) | 58 (11.5%) |
Health Insurance Coverage by Citizenship Status in Gloucester
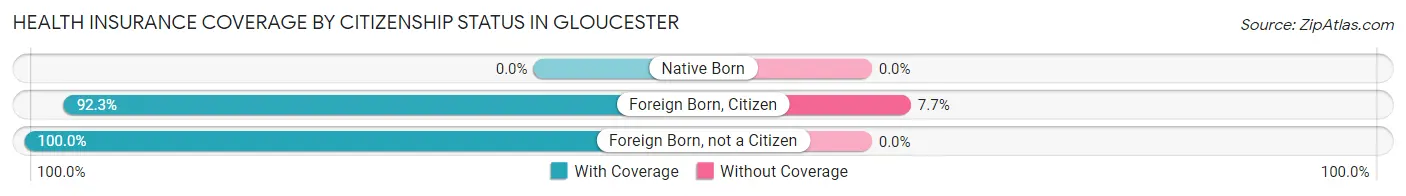
| Citizenship Status | With Coverage | Without Coverage |
| Native Born | 0 (0.0%) | 0 (0.0%) |
| Foreign Born, Citizen | 108 (92.3%) | 9 (7.7%) |
| Foreign Born, not a Citizen | 9 (100.0%) | 0 (0.0%) |
Health Insurance Coverage by Household Income in Gloucester
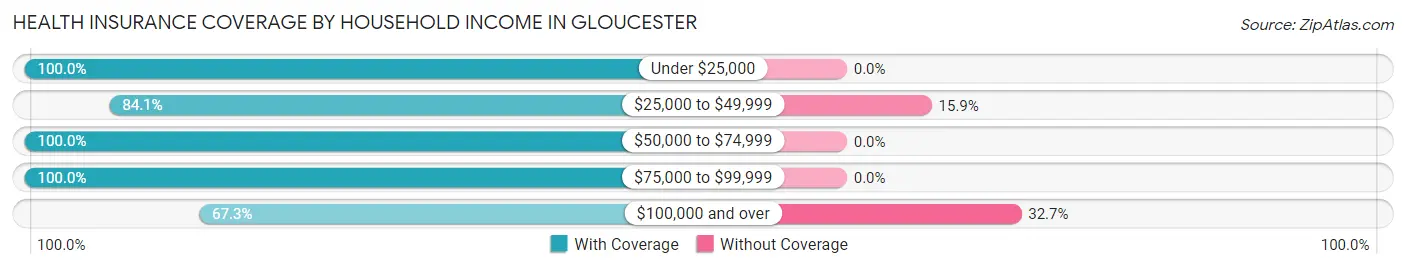
| Household Income | With Coverage | Without Coverage |
| Under $25,000 | 35 (100.0%) | 0 (0.0%) |
| $25,000 to $49,999 | 127 (84.1%) | 24 (15.9%) |
| $50,000 to $74,999 | 36 (100.0%) | 0 (0.0%) |
| $75,000 to $99,999 | 180 (100.0%) | 0 (0.0%) |
| $100,000 and over | 70 (67.3%) | 34 (32.7%) |
Public vs Private Health Insurance Coverage by Age in Gloucester
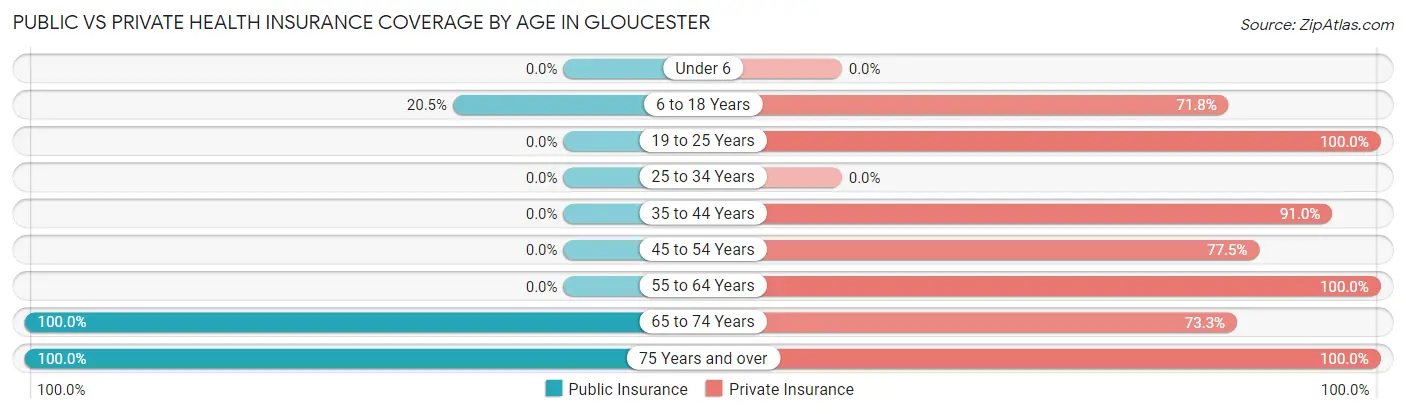
| Age Bracket | Public Insurance | Private Insurance |
| Under 6 | 0 (0.0%) | 0 (0.0%) |
| 6 to 18 Years | 24 (20.5%) | 84 (71.8%) |
| 19 to 25 Years | 0 (0.0%) | 9 (100.0%) |
| 25 to 34 Years | 0 (0.0%) | 0 (0.0%) |
| 35 to 44 Years | 0 (0.0%) | 81 (91.0%) |
| 45 to 54 Years | 0 (0.0%) | 31 (77.5%) |
| 55 to 64 Years | 0 (0.0%) | 92 (100.0%) |
| 65 to 74 Years | 60 (100.0%) | 44 (73.3%) |
| 75 Years and over | 67 (100.0%) | 67 (100.0%) |
| Total | 151 (29.8%) | 408 (80.6%) |
Disability Status by Sex by Age in Gloucester
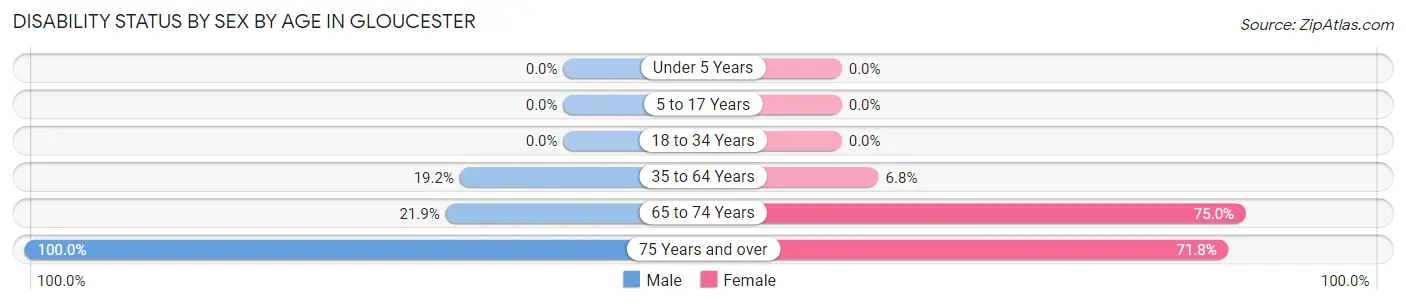
| Age Bracket | Male | Female |
| Under 5 Years | 0 (0.0%) | 0 (0.0%) |
| 5 to 17 Years | 0 (0.0%) | 0 (0.0%) |
| 18 to 34 Years | 0 (0.0%) | 0 (0.0%) |
| 35 to 64 Years | 20 (19.2%) | 8 (6.8%) |
| 65 to 74 Years | 7 (21.9%) | 21 (75.0%) |
| 75 Years and over | 28 (100.0%) | 28 (71.8%) |
Disability Class by Sex by Age in Gloucester
Disability Class: Hearing Difficulty
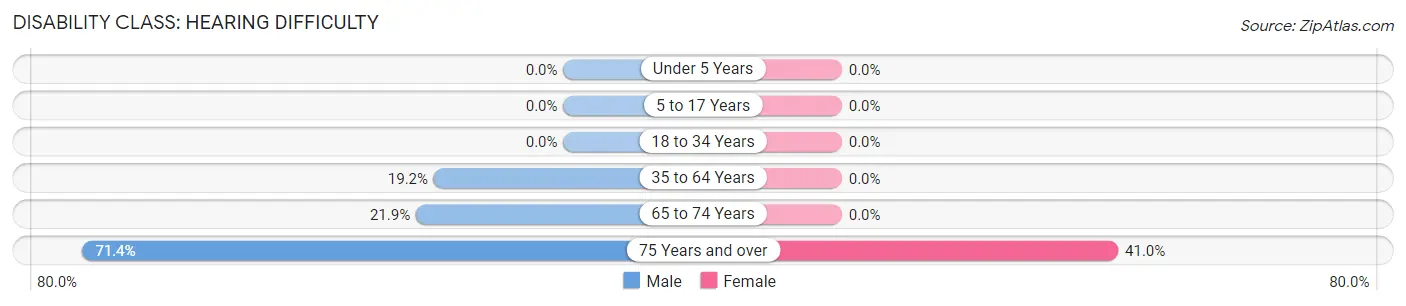
| Age Bracket | Male | Female |
| Under 5 Years | 0 (0.0%) | 0 (0.0%) |
| 5 to 17 Years | 0 (0.0%) | 0 (0.0%) |
| 18 to 34 Years | 0 (0.0%) | 0 (0.0%) |
| 35 to 64 Years | 20 (19.2%) | 0 (0.0%) |
| 65 to 74 Years | 7 (21.9%) | 0 (0.0%) |
| 75 Years and over | 20 (71.4%) | 16 (41.0%) |
Disability Class: Vision Difficulty
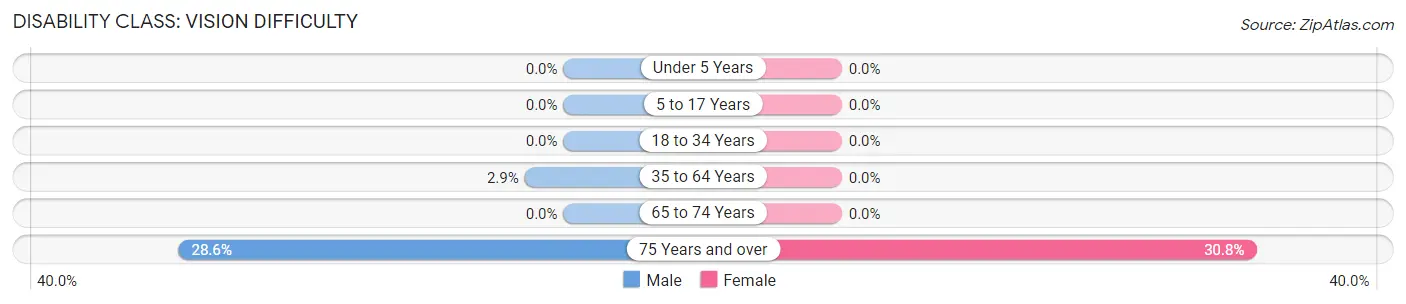
| Age Bracket | Male | Female |
| Under 5 Years | 0 (0.0%) | 0 (0.0%) |
| 5 to 17 Years | 0 (0.0%) | 0 (0.0%) |
| 18 to 34 Years | 0 (0.0%) | 0 (0.0%) |
| 35 to 64 Years | 3 (2.9%) | 0 (0.0%) |
| 65 to 74 Years | 0 (0.0%) | 0 (0.0%) |
| 75 Years and over | 8 (28.6%) | 12 (30.8%) |
Disability Class: Cognitive Difficulty
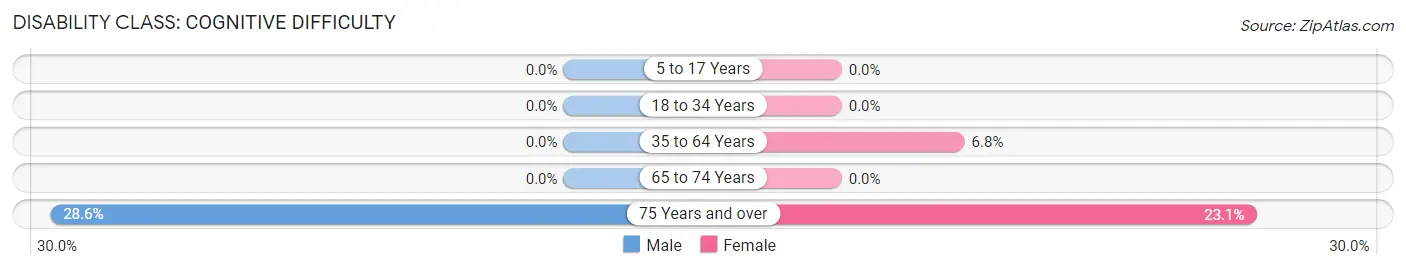
| Age Bracket | Male | Female |
| 5 to 17 Years | 0 (0.0%) | 0 (0.0%) |
| 18 to 34 Years | 0 (0.0%) | 0 (0.0%) |
| 35 to 64 Years | 0 (0.0%) | 8 (6.8%) |
| 65 to 74 Years | 0 (0.0%) | 0 (0.0%) |
| 75 Years and over | 8 (28.6%) | 9 (23.1%) |
Disability Class: Ambulatory Difficulty
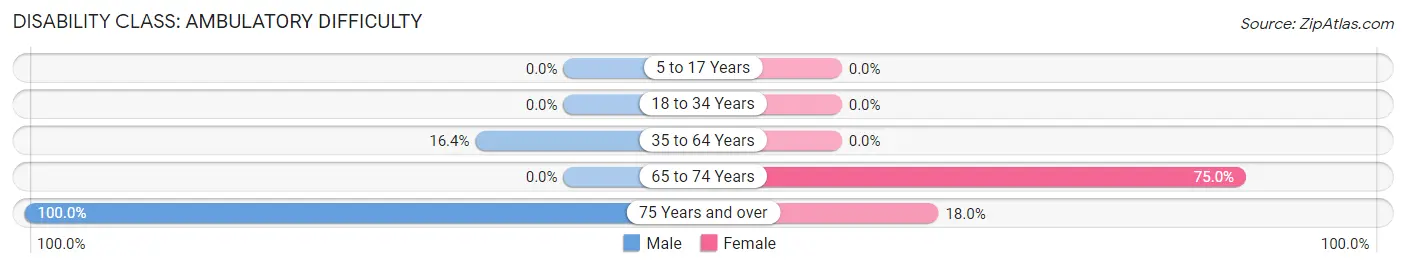
| Age Bracket | Male | Female |
| 5 to 17 Years | 0 (0.0%) | 0 (0.0%) |
| 18 to 34 Years | 0 (0.0%) | 0 (0.0%) |
| 35 to 64 Years | 17 (16.4%) | 0 (0.0%) |
| 65 to 74 Years | 0 (0.0%) | 21 (75.0%) |
| 75 Years and over | 28 (100.0%) | 7 (17.9%) |
Disability Class: Self-Care Difficulty
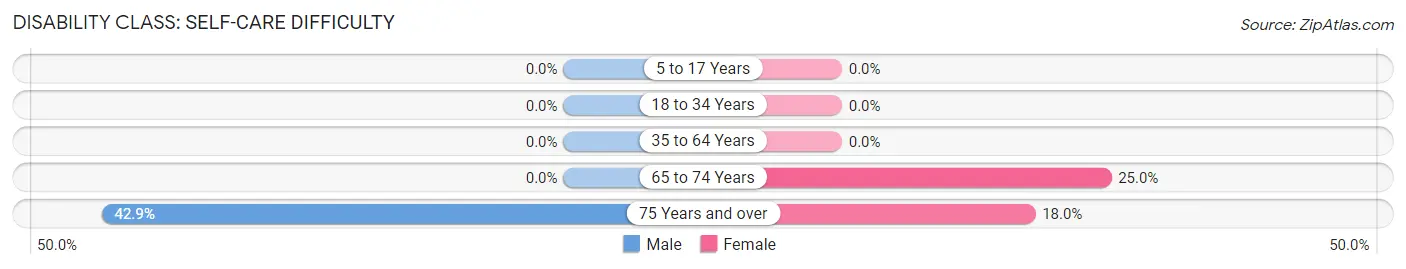
| Age Bracket | Male | Female |
| 5 to 17 Years | 0 (0.0%) | 0 (0.0%) |
| 18 to 34 Years | 0 (0.0%) | 0 (0.0%) |
| 35 to 64 Years | 0 (0.0%) | 0 (0.0%) |
| 65 to 74 Years | 0 (0.0%) | 7 (25.0%) |
| 75 Years and over | 12 (42.9%) | 7 (17.9%) |
Technology Access in Gloucester
Computing Device Access in Gloucester
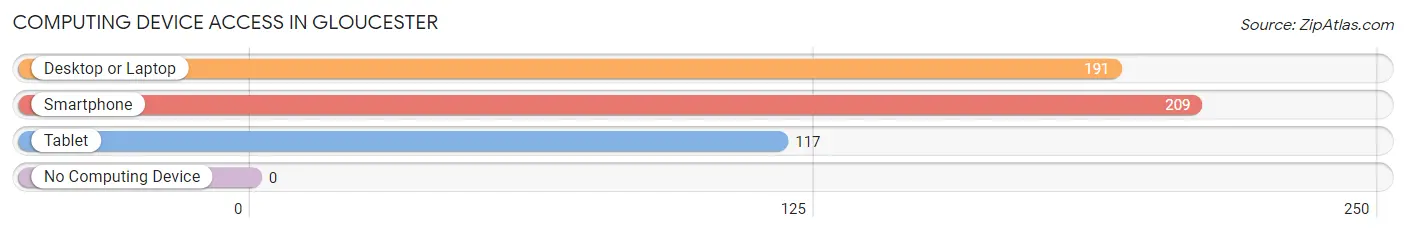
| Device Type | # Households | % Households |
| Desktop or Laptop | 191 | 90.1% |
| Smartphone | 209 | 98.6% |
| Tablet | 117 | 55.2% |
| No Computing Device | 0 | 0.0% |
| Total | 212 | 100.0% |
Internet Access in Gloucester
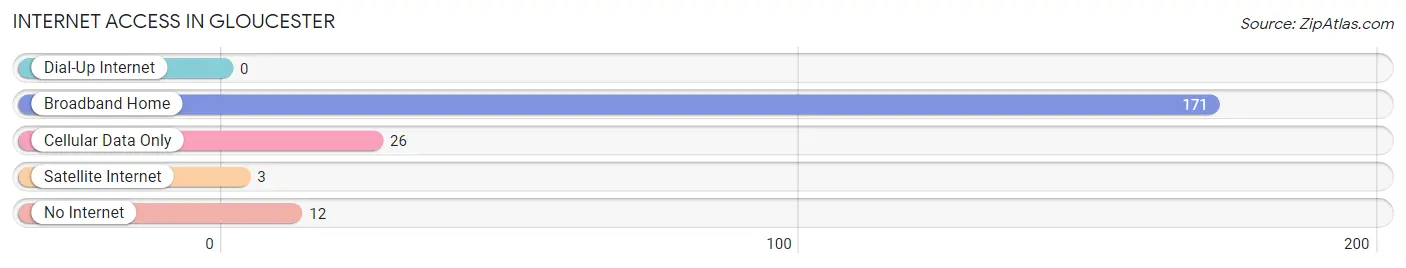
| Internet Type | # Households | % Households |
| Dial-Up Internet | 0 | 0.0% |
| Broadband Home | 171 | 80.7% |
| Cellular Data Only | 26 | 12.3% |
| Satellite Internet | 3 | 1.4% |
| No Internet | 12 | 5.7% |
| Total | 212 | 100.0% |
Gloucester Summary
Gloucester is a small, rural county located in the eastern part of the state of North Carolina. It is bordered by the counties of Carteret, Craven, Pamlico, and Onslow. The county seat is the town of Gloucester, which is located on the banks of the Neuse River. The county was formed in 1705 and is named after Henry Stuart, Duke of Gloucester.
Geography
Gloucester County is located in the Coastal Plain region of North Carolina. It is bordered by the counties of Carteret, Craven, Pamlico, and Onslow. The county has a total area of 545 square miles, of which 543 square miles is land and 2 square miles is water. The terrain is generally flat, with some rolling hills in the northern part of the county. The highest point in the county is located in the northern part of the county, near the town of Gloucester, and is approximately 100 feet above sea level.
The county is drained by the Neuse River, which forms the northern boundary of the county. Other major waterways in the county include the White Oak River, the Newport River, and the Core Sound. The county is also home to several small lakes, including Lake Phelps, Lake Mattamuskeet, and Lake Waccamaw.
Climate
Gloucester County has a humid subtropical climate, with mild winters and hot, humid summers. The average annual temperature is around 70 degrees Fahrenheit, with average lows in the winter months around 40 degrees Fahrenheit and average highs in the summer months around 90 degrees Fahrenheit. The average annual precipitation is around 50 inches, with most of the precipitation occurring in the summer months.
Demographics
As of the 2010 census, Gloucester County had a population of 35,717. The population was spread out, with 24.3% under the age of 18, 8.2% from 18 to 24, 28.2% from 25 to 44, 24.7% from 45 to 64, and 14.6% who were 65 years of age or older. The median age was 38.4 years. The gender makeup of the county was 48.7% male and 51.3% female.
The racial makeup of the county was 79.2% White, 15.3% African American, 0.4% Native American, 0.7% Asian, 0.1% Pacific Islander, 2.7% from other races, and 1.6% from two or more races. Hispanic or Latino of any race were 5.2% of the population.
Economy
The economy of Gloucester County is largely based on agriculture and fishing. The county is home to several large farms, which produce a variety of crops, including corn, soybeans, wheat, and cotton. The county is also home to several commercial fishing operations, which harvest a variety of seafood, including shrimp, oysters, and crabs.
In addition to agriculture and fishing, Gloucester County is home to several manufacturing companies, which produce a variety of products, including furniture, textiles, and electronics. The county is also home to several retail stores, restaurants, and other businesses.
The unemployment rate in Gloucester County was 5.2% in 2019, which is lower than the national average of 3.7%. The median household income in the county was $45,845 in 2019, which is lower than the national average of $61,937.
Common Questions
What is Per Capita Income in Gloucester?
Per Capita income in Gloucester is $27,571.
What is the Median Family Income in Gloucester?
Median Family Income in Gloucester is $81,250.
What is the Median Household income in Gloucester?
Median Household Income in Gloucester is $53,036.
What is Inequality or Gini Index in Gloucester?
Inequality or Gini Index in Gloucester is 0.39.
What is the Total Population of Gloucester?
Total Population of Gloucester is 506.
What is the Total Male Population of Gloucester?
Total Male Population of Gloucester is 282.
What is the Total Female Population of Gloucester?
Total Female Population of Gloucester is 224.
What is the Ratio of Males per 100 Females in Gloucester?
There are 125.89 Males per 100 Females in Gloucester.
What is the Ratio of Females per 100 Males in Gloucester?
There are 79.43 Females per 100 Males in Gloucester.
What is the Median Population Age in Gloucester?
Median Population Age in Gloucester is 49.3 Years.
What is the Average Family Size in Gloucester
Average Family Size in Gloucester is 3.0 People.
What is the Average Household Size in Gloucester
Average Household Size in Gloucester is 2.4 People.
How Large is the Labor Force in Gloucester?
There are 219 People in the Labor Forcein in Gloucester.
What is the Percentage of People in the Labor Force in Gloucester?
55.0% of People are in the Labor Force in Gloucester.
What is the Unemployment Rate in Gloucester?
Unemployment Rate in Gloucester is 3.2%.