Elon, NC Map & Demographics
Elon Map
Elon Overview
$28,817
PER CAPITA INCOME
$122,772
AVG FAMILY INCOME
$73,597
AVG HOUSEHOLD INCOME
54.7%
WAGE / INCOME GAP [ % ]
45.3¢/ $1
WAGE / INCOME GAP [ $ ]
0.49
INEQUALITY / GINI INDEX
11,161
TOTAL POPULATION
5,107
MALE POPULATION
6,054
FEMALE POPULATION
84.36
MALES / 100 FEMALES
118.54
FEMALES / 100 MALES
22.1
MEDIAN AGE
2.9
AVG FAMILY SIZE
2.6
AVG HOUSEHOLD SIZE
4,650
LABOR FORCE [ PEOPLE ]
45.4%
PERCENT IN LABOR FORCE
3.9%
UNEMPLOYMENT RATE
Elon Zip Codes
Elon Area Codes
Income in Elon
Income Overview in Elon
Per Capita Income in Elon is $28,817, while median incomes of families and households are $122,772 and $73,597 respectively.
| Characteristic | Number | Measure |
| Per Capita Income | 11,161 | $28,817 |
| Median Family Income | 1,733 | $122,772 |
| Mean Family Income | 1,733 | $144,974 |
| Median Household Income | 2,949 | $73,597 |
| Mean Household Income | 2,949 | $103,187 |
| Income Deficit | 1,733 | $0 |
| Wage / Income Gap (%) | 11,161 | 54.74% |
| Wage / Income Gap ($) | 11,161 | 45.26¢ per $1 |
| Gini / Inequality Index | 11,161 | 0.49 |
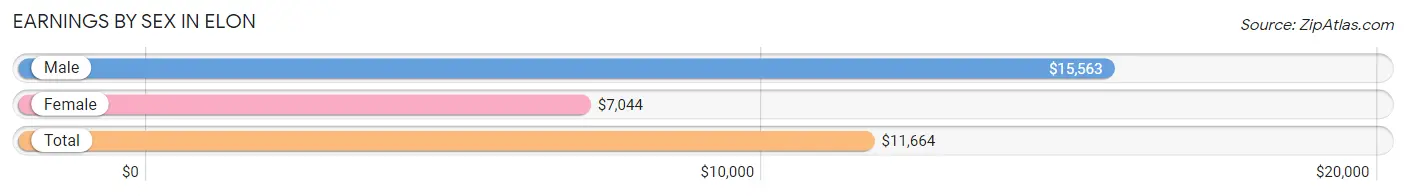
Earnings by Sex in Elon
Average Earnings in Elon are $11,664, $15,563 for men and $7,044 for women, a difference of 54.7%.
| Sex | Number | Average Earnings |
| Male | 3,273 (54.7%) | $15,563 |
| Female | 2,711 (45.3%) | $7,044 |
| Total | 5,984 (100.0%) | $11,664 |
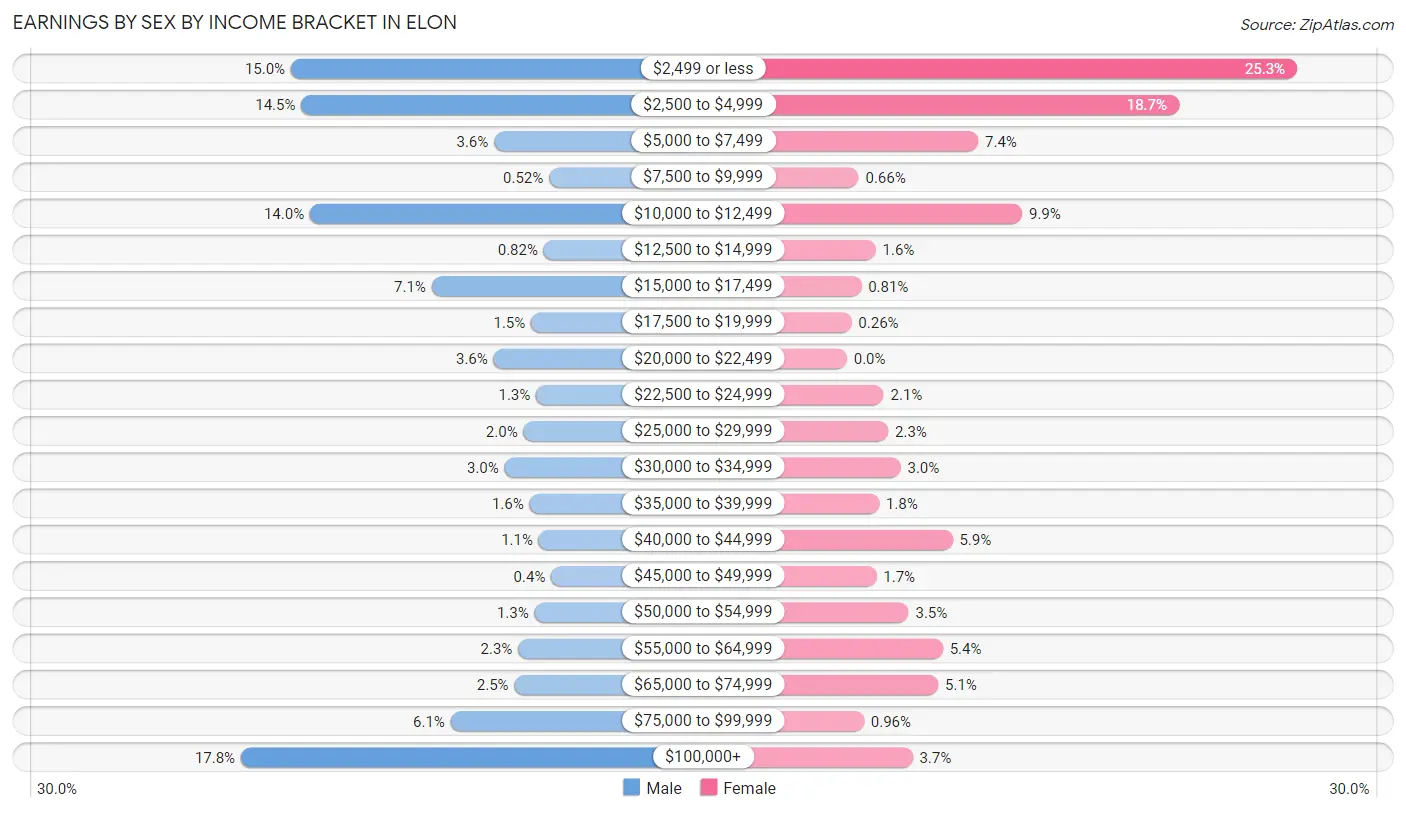
Earnings by Sex by Income Bracket in Elon
The most common earnings brackets in Elon are $100,000+ for men (584 | 17.8%) and $2,499 or less for women (686 | 25.3%).
| Income | Male | Female |
| $2,499 or less | 492 (15.0%) | 686 (25.3%) |
| $2,500 to $4,999 | 473 (14.4%) | 506 (18.7%) |
| $5,000 to $7,499 | 118 (3.6%) | 200 (7.4%) |
| $7,500 to $9,999 | 17 (0.5%) | 18 (0.7%) |
| $10,000 to $12,499 | 457 (14.0%) | 267 (9.9%) |
| $12,500 to $14,999 | 27 (0.8%) | 44 (1.6%) |
| $15,000 to $17,499 | 233 (7.1%) | 22 (0.8%) |
| $17,500 to $19,999 | 50 (1.5%) | 7 (0.3%) |
| $20,000 to $22,499 | 119 (3.6%) | 0 (0.0%) |
| $22,500 to $24,999 | 41 (1.3%) | 56 (2.1%) |
| $25,000 to $29,999 | 64 (2.0%) | 63 (2.3%) |
| $30,000 to $34,999 | 99 (3.0%) | 82 (3.0%) |
| $35,000 to $39,999 | 53 (1.6%) | 49 (1.8%) |
| $40,000 to $44,999 | 36 (1.1%) | 161 (5.9%) |
| $45,000 to $49,999 | 13 (0.4%) | 45 (1.7%) |
| $50,000 to $54,999 | 44 (1.3%) | 94 (3.5%) |
| $55,000 to $64,999 | 74 (2.3%) | 146 (5.4%) |
| $65,000 to $74,999 | 81 (2.5%) | 139 (5.1%) |
| $75,000 to $99,999 | 198 (6.0%) | 26 (1.0%) |
| $100,000+ | 584 (17.8%) | 100 (3.7%) |
| Total | 3,273 (100.0%) | 2,711 (100.0%) |
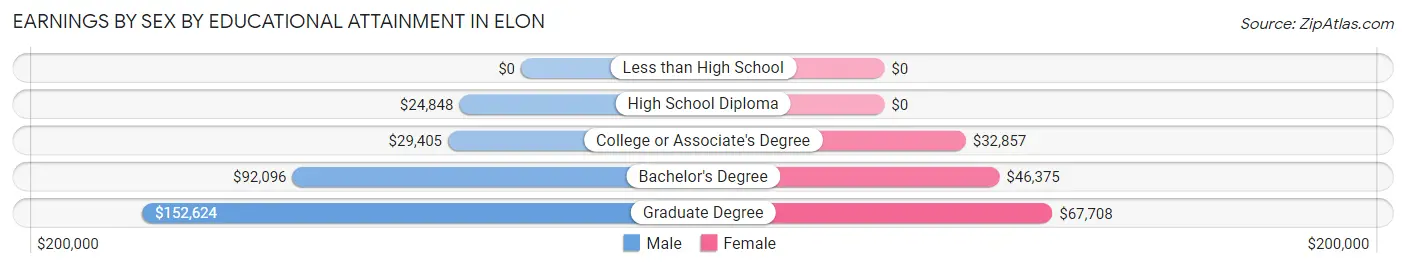
Earnings by Sex by Educational Attainment in Elon
Average earnings in Elon are $84,917 for men and $41,556 for women, a difference of 51.1%. Men with an educational attainment of graduate degree enjoy the highest average annual earnings of $152,624, while those with high school diploma education earn the least with $24,848. Women with an educational attainment of graduate degree earn the most with the average annual earnings of $67,708, while those with college or associate's degree education have the smallest earnings of $32,857.
| Educational Attainment | Male Income | Female Income |
| Less than High School | - | - |
| High School Diploma | $24,848 | $0 |
| College or Associate's Degree | $29,405 | $32,857 |
| Bachelor's Degree | $92,096 | $46,375 |
| Graduate Degree | $152,624 | $67,708 |
| Total | $84,917 | $41,556 |
Family Income in Elon
Family Income Brackets in Elon
According to the Elon family income data, there are 496 families falling into the $150,000 to $199,999 income range, which is the most common income bracket and makes up 28.6% of all families. Conversely, the $10,000 to $14,999 income bracket is the least frequent group with only 10 families (0.6%) belonging to this category.
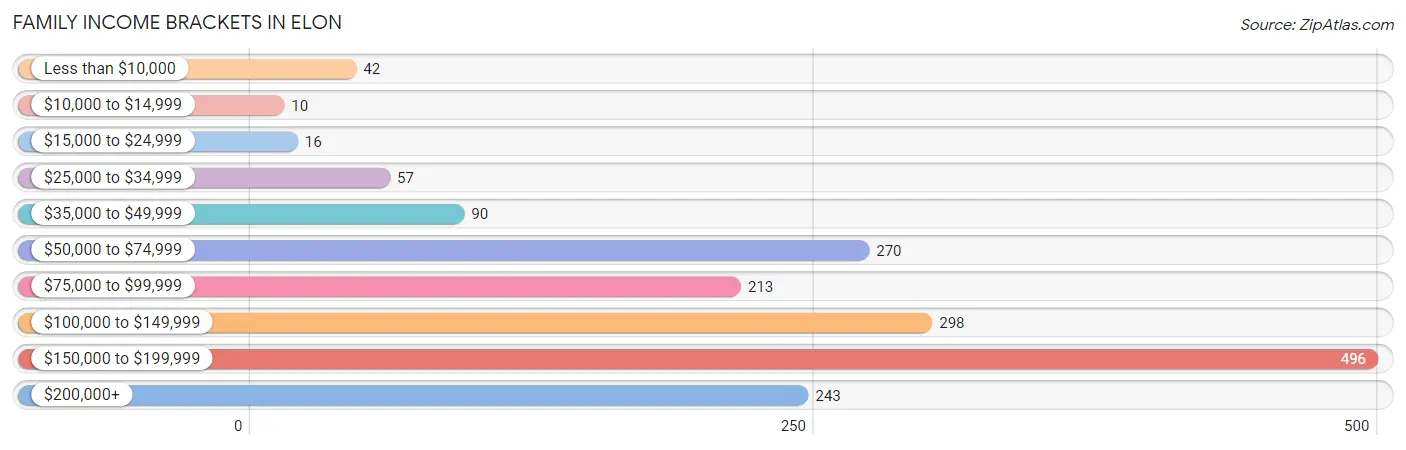
| Income Bracket | # Families | % Families |
| Less than $10,000 | 42 | 2.4% |
| $10,000 to $14,999 | 10 | 0.6% |
| $15,000 to $24,999 | 16 | 0.9% |
| $25,000 to $34,999 | 57 | 3.3% |
| $35,000 to $49,999 | 90 | 5.2% |
| $50,000 to $74,999 | 270 | 15.6% |
| $75,000 to $99,999 | 213 | 12.3% |
| $100,000 to $149,999 | 298 | 17.2% |
| $150,000 to $199,999 | 496 | 28.6% |
| $200,000+ | 243 | 14.0% |
Family Income by Famaliy Size in Elon
4-person families (481 | 27.8%) account for the highest median family income in Elon with $168,194 per family, while 2-person families (804 | 46.4%) have the highest median income of $48,646 per family member.
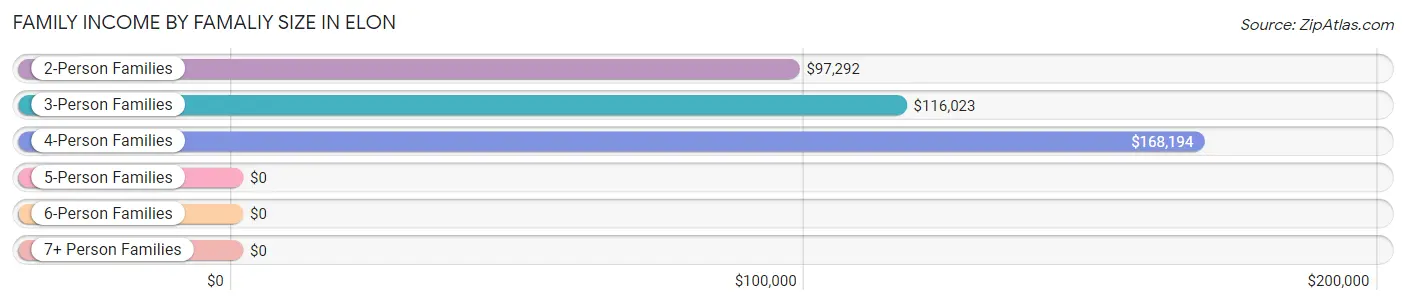
| Income Bracket | # Families | Median Income |
| 2-Person Families | 804 (46.4%) | $97,292 |
| 3-Person Families | 359 (20.7%) | $116,023 |
| 4-Person Families | 481 (27.8%) | $168,194 |
| 5-Person Families | 56 (3.2%) | $0 |
| 6-Person Families | 33 (1.9%) | $0 |
| 7+ Person Families | 0 (0.0%) | $0 |
| Total | 1,733 (100.0%) | $122,772 |
Family Income by Number of Earners in Elon
The median family income in Elon is $122,772, with families comprising 3+ earners (304) having the highest median family income of $169,217, while families with no earners (313) have the lowest median family income of $69,271, accounting for 17.5% and 18.1% of families, respectively.
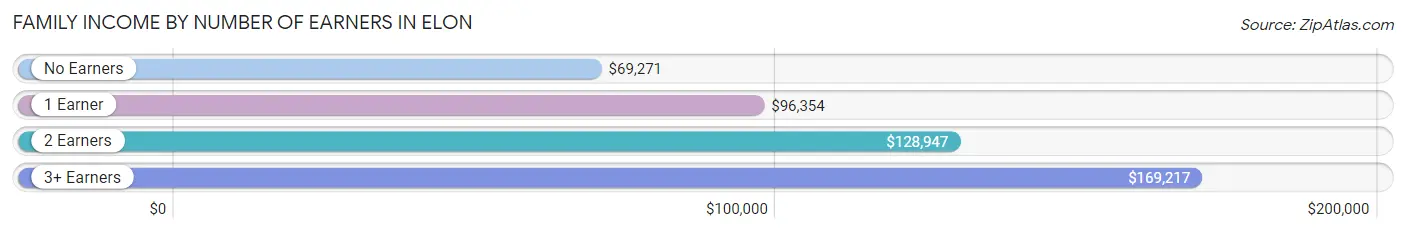
| Number of Earners | # Families | Median Income |
| No Earners | 313 (18.1%) | $69,271 |
| 1 Earner | 446 (25.7%) | $96,354 |
| 2 Earners | 670 (38.7%) | $128,947 |
| 3+ Earners | 304 (17.5%) | $169,217 |
| Total | 1,733 (100.0%) | $122,772 |
Household Income in Elon
Household Income Brackets in Elon
With 549 households falling in the category, the $150,000 to $199,999 income range is the most frequent in Elon, accounting for 18.6% of all households. In contrast, only 150 households (5.1%) fall into the $10,000 to $14,999 income bracket, making it the least populous group.
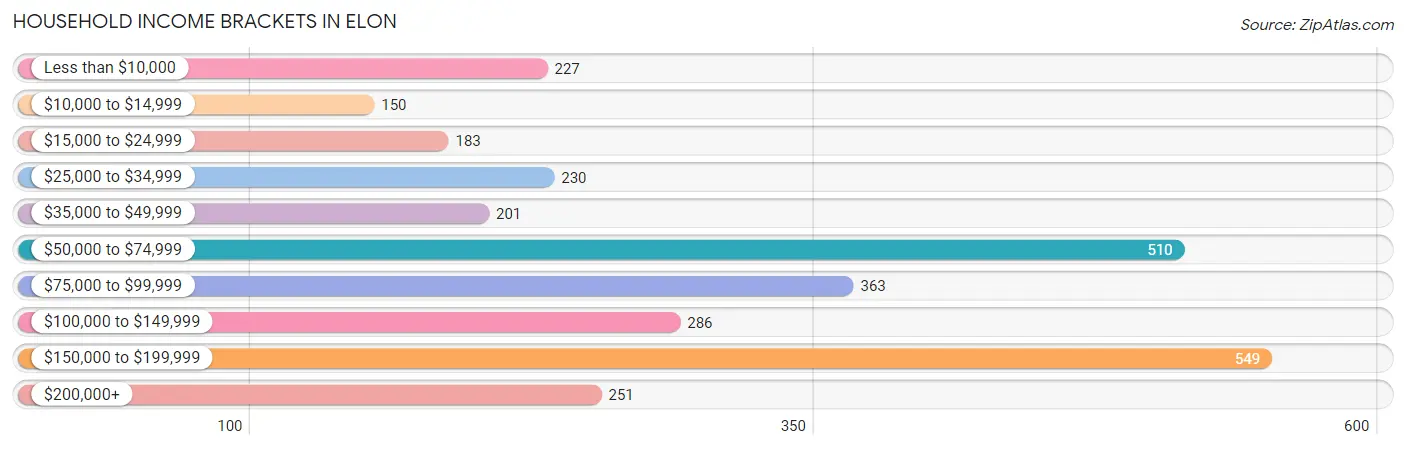
| Income Bracket | # Households | % Households |
| Less than $10,000 | 227 | 7.7% |
| $10,000 to $14,999 | 150 | 5.1% |
| $15,000 to $24,999 | 183 | 6.2% |
| $25,000 to $34,999 | 230 | 7.8% |
| $35,000 to $49,999 | 201 | 6.8% |
| $50,000 to $74,999 | 510 | 17.3% |
| $75,000 to $99,999 | 363 | 12.3% |
| $100,000 to $149,999 | 286 | 9.7% |
| $150,000 to $199,999 | 549 | 18.6% |
| $200,000+ | 251 | 8.5% |
Household Income by Householder Age in Elon
The median household income in Elon is $73,597, with the highest median household income of $159,853 found in the 25 to 44 years age bracket for the primary householder. A total of 566 households (19.2%) fall into this category. Meanwhile, the 15 to 24 years age bracket for the primary householder has the lowest median household income of $17,604, with 515 households (17.5%) in this group.
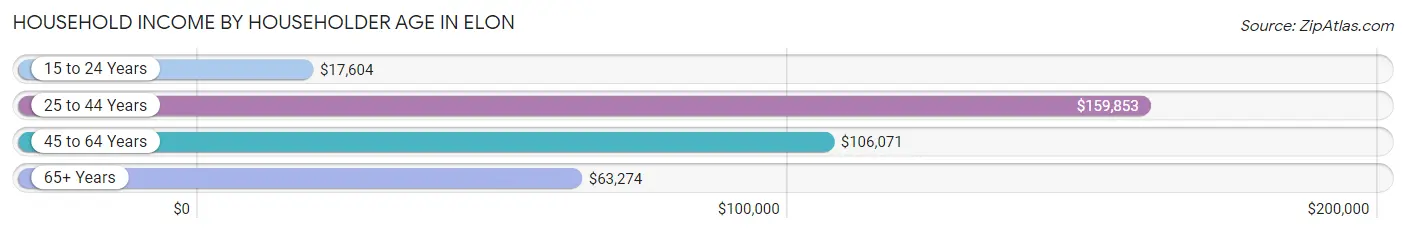
| Income Bracket | # Households | Median Income |
| 15 to 24 Years | 515 (17.5%) | $17,604 |
| 25 to 44 Years | 566 (19.2%) | $159,853 |
| 45 to 64 Years | 908 (30.8%) | $106,071 |
| 65+ Years | 960 (32.6%) | $63,274 |
| Total | 2,949 (100.0%) | $73,597 |
Poverty in Elon
Income Below Poverty by Sex and Age in Elon
With 24.6% poverty level for males and 25.4% for females among the residents of Elon, 18 to 24 year old males and 18 to 24 year old females are the most vulnerable to poverty, with 701 males (65.3%) and 840 females (90.1%) in their respective age groups living below the poverty level.
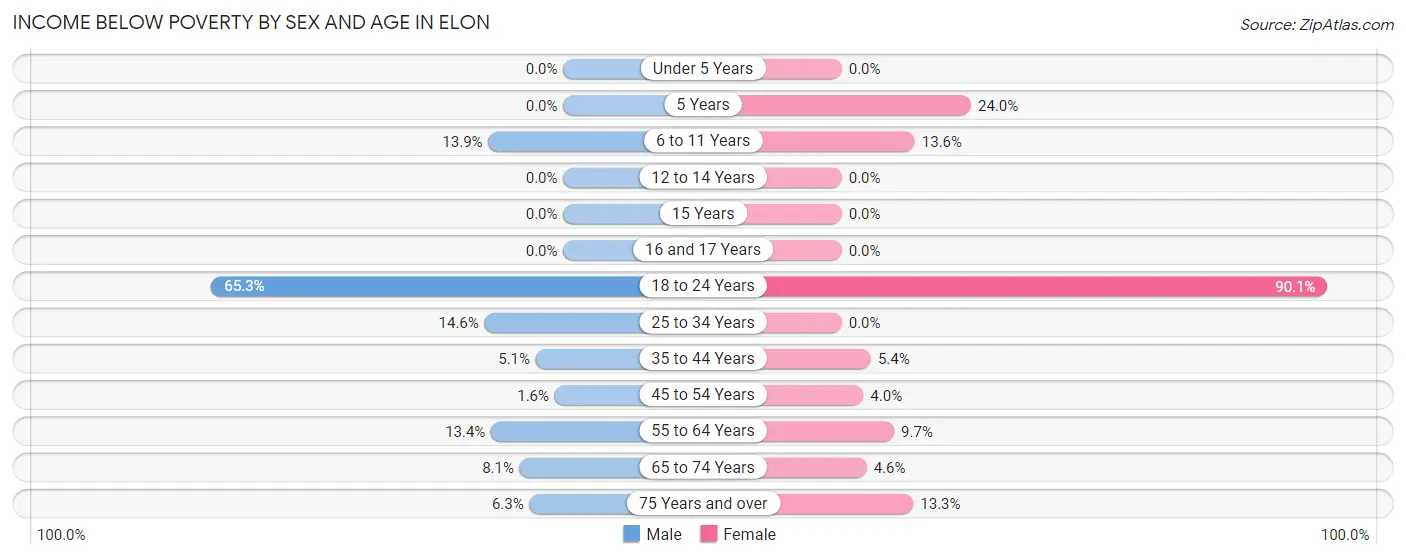
| Age Bracket | Male | Female |
| Under 5 Years | 0 (0.0%) | 0 (0.0%) |
| 5 Years | 0 (0.0%) | 12 (24.0%) |
| 6 to 11 Years | 16 (13.9%) | 16 (13.6%) |
| 12 to 14 Years | 0 (0.0%) | 0 (0.0%) |
| 15 Years | 0 (0.0%) | 0 (0.0%) |
| 16 and 17 Years | 0 (0.0%) | 0 (0.0%) |
| 18 to 24 Years | 701 (65.3%) | 840 (90.1%) |
| 25 to 34 Years | 32 (14.6%) | 0 (0.0%) |
| 35 to 44 Years | 25 (5.1%) | 26 (5.4%) |
| 45 to 54 Years | 6 (1.6%) | 13 (4.0%) |
| 55 to 64 Years | 64 (13.4%) | 52 (9.7%) |
| 65 to 74 Years | 14 (8.1%) | 15 (4.6%) |
| 75 Years and over | 19 (6.3%) | 79 (13.3%) |
| Total | 877 (24.6%) | 1,053 (25.4%) |
Income Above Poverty by Sex and Age in Elon
According to the poverty statistics in Elon, males aged under 5 years and females aged under 5 years are the age groups that are most secure financially, with 100.0% of males and 100.0% of females in these age groups living above the poverty line.
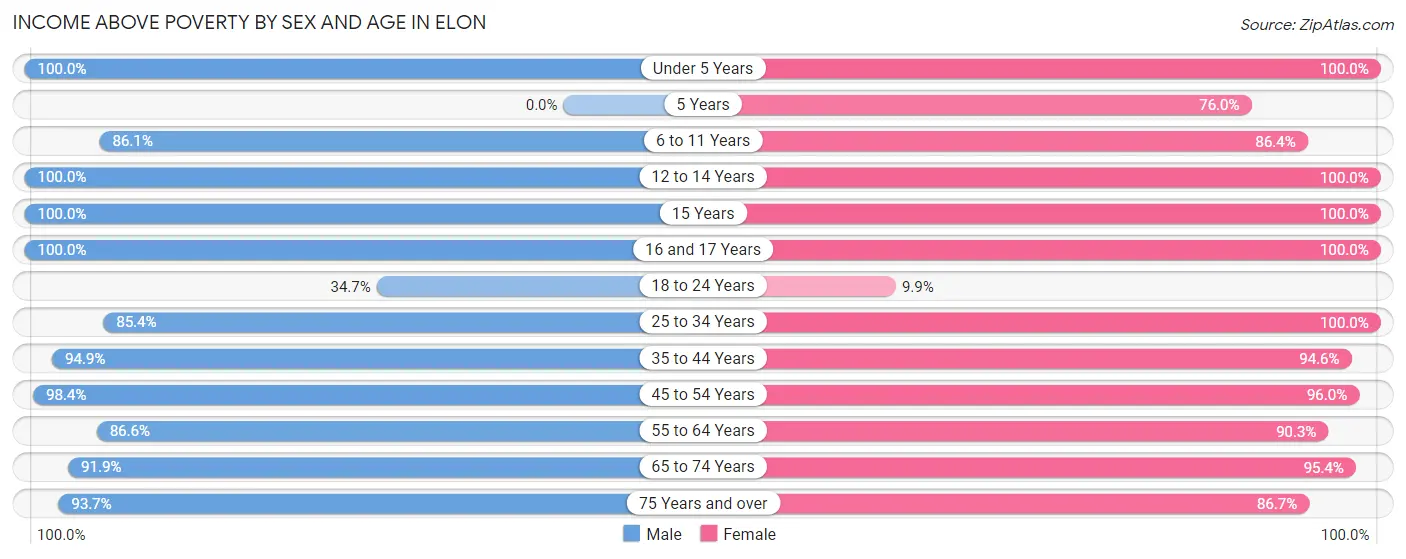
| Age Bracket | Male | Female |
| Under 5 Years | 56 (100.0%) | 271 (100.0%) |
| 5 Years | 0 (0.0%) | 38 (76.0%) |
| 6 to 11 Years | 99 (86.1%) | 102 (86.4%) |
| 12 to 14 Years | 127 (100.0%) | 51 (100.0%) |
| 15 Years | 18 (100.0%) | 93 (100.0%) |
| 16 and 17 Years | 134 (100.0%) | 203 (100.0%) |
| 18 to 24 Years | 372 (34.7%) | 92 (9.9%) |
| 25 to 34 Years | 187 (85.4%) | 166 (100.0%) |
| 35 to 44 Years | 465 (94.9%) | 454 (94.6%) |
| 45 to 54 Years | 373 (98.4%) | 311 (96.0%) |
| 55 to 64 Years | 414 (86.6%) | 483 (90.3%) |
| 65 to 74 Years | 159 (91.9%) | 310 (95.4%) |
| 75 Years and over | 284 (93.7%) | 516 (86.7%) |
| Total | 2,688 (75.4%) | 3,090 (74.6%) |
Income Below Poverty Among Married-Couple Families in Elon
The poverty statistics for married-couple families in Elon show that 3.7% or 57 of the total 1,536 families live below the poverty line. Families with no children have the highest poverty rate of 5.0%, comprising of 41 families. On the other hand, families with 3 or 4 children have the lowest poverty rate of 0.0%, which includes 0 families.
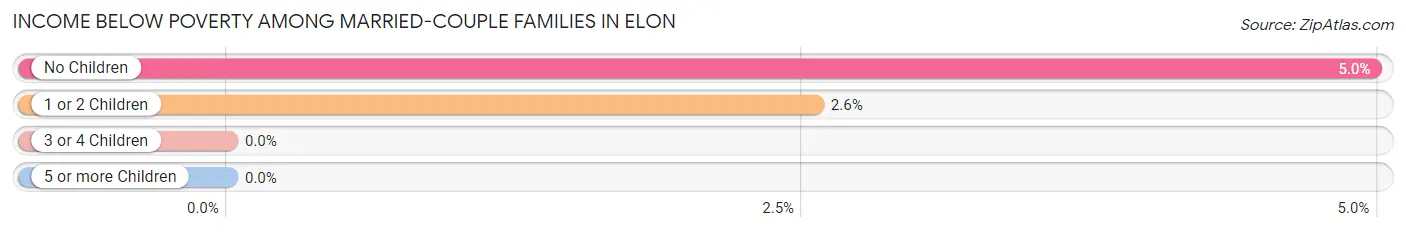
| Children | Above Poverty | Below Poverty |
| No Children | 783 (95.0%) | 41 (5.0%) |
| 1 or 2 Children | 612 (97.5%) | 16 (2.5%) |
| 3 or 4 Children | 84 (100.0%) | 0 (0.0%) |
| 5 or more Children | 0 (0.0%) | 0 (0.0%) |
| Total | 1,479 (96.3%) | 57 (3.7%) |
Income Below Poverty Among Single-Parent Households in Elon
According to the poverty data in Elon, 44.4% or 16 single-father households and 6.2% or 10 single-mother households are living below the poverty line. Among single-father households, those with 1 or 2 children have the highest poverty rate, with 16 households (44.4%) experiencing poverty. Likewise, among single-mother households, those with no children have the highest poverty rate, with 10 households (8.6%) falling below the poverty line.
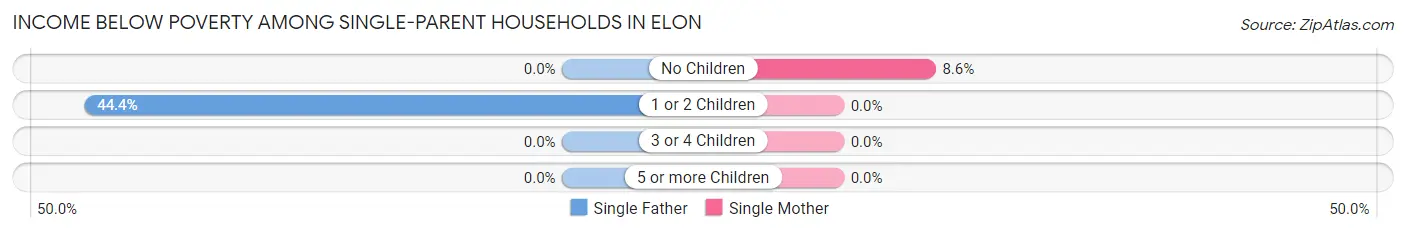
| Children | Single Father | Single Mother |
| No Children | 0 (0.0%) | 10 (8.6%) |
| 1 or 2 Children | 16 (44.4%) | 0 (0.0%) |
| 3 or 4 Children | 0 (0.0%) | 0 (0.0%) |
| 5 or more Children | 0 (0.0%) | 0 (0.0%) |
| Total | 16 (44.4%) | 10 (6.2%) |
Income Below Poverty Among Married-Couple vs Single-Parent Households in Elon
The poverty data for Elon shows that 57 of the married-couple family households (3.7%) and 26 of the single-parent households (13.2%) are living below the poverty level. Within the married-couple family households, those with no children have the highest poverty rate, with 41 households (5.0%) falling below the poverty line. Among the single-parent households, those with 1 or 2 children have the highest poverty rate, with 16 household (20.0%) living below poverty.
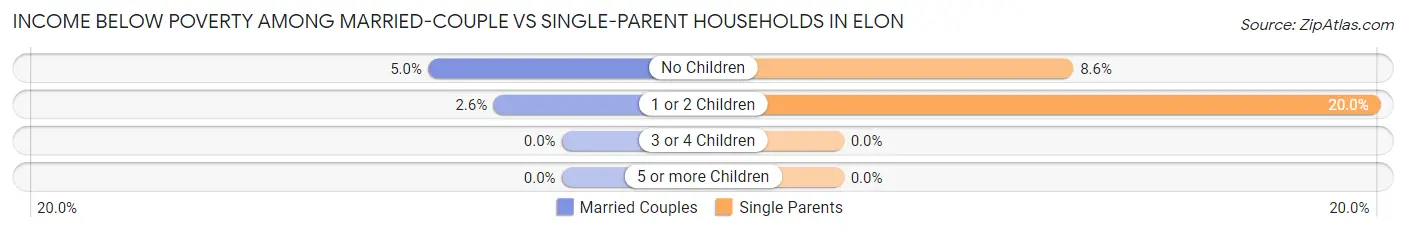
| Children | Married-Couple Families | Single-Parent Households |
| No Children | 41 (5.0%) | 10 (8.6%) |
| 1 or 2 Children | 16 (2.5%) | 16 (20.0%) |
| 3 or 4 Children | 0 (0.0%) | 0 (0.0%) |
| 5 or more Children | 0 (0.0%) | 0 (0.0%) |
| Total | 57 (3.7%) | 26 (13.2%) |
Race in Elon
The most populous races in Elon are White / Caucasian (9,482 | 85.0%), Black / African American (874 | 7.8%), and Hispanic or Latino (568 | 5.1%).
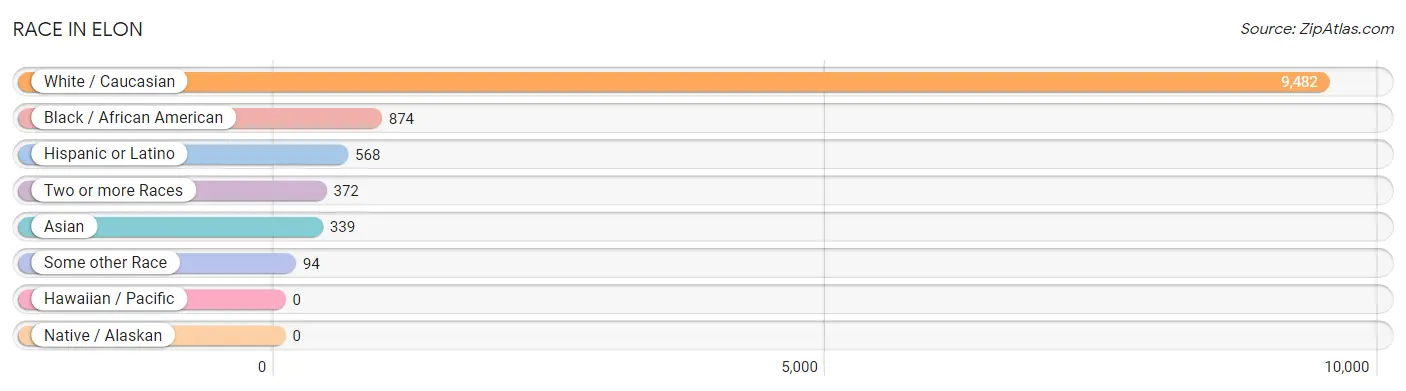
| Race | # Population | % Population |
| Asian | 339 | 3.0% |
| Black / African American | 874 | 7.8% |
| Hawaiian / Pacific | 0 | 0.0% |
| Hispanic or Latino | 568 | 5.1% |
| Native / Alaskan | 0 | 0.0% |
| White / Caucasian | 9,482 | 85.0% |
| Two or more Races | 372 | 3.3% |
| Some other Race | 94 | 0.8% |
| Total | 11,161 | 100.0% |
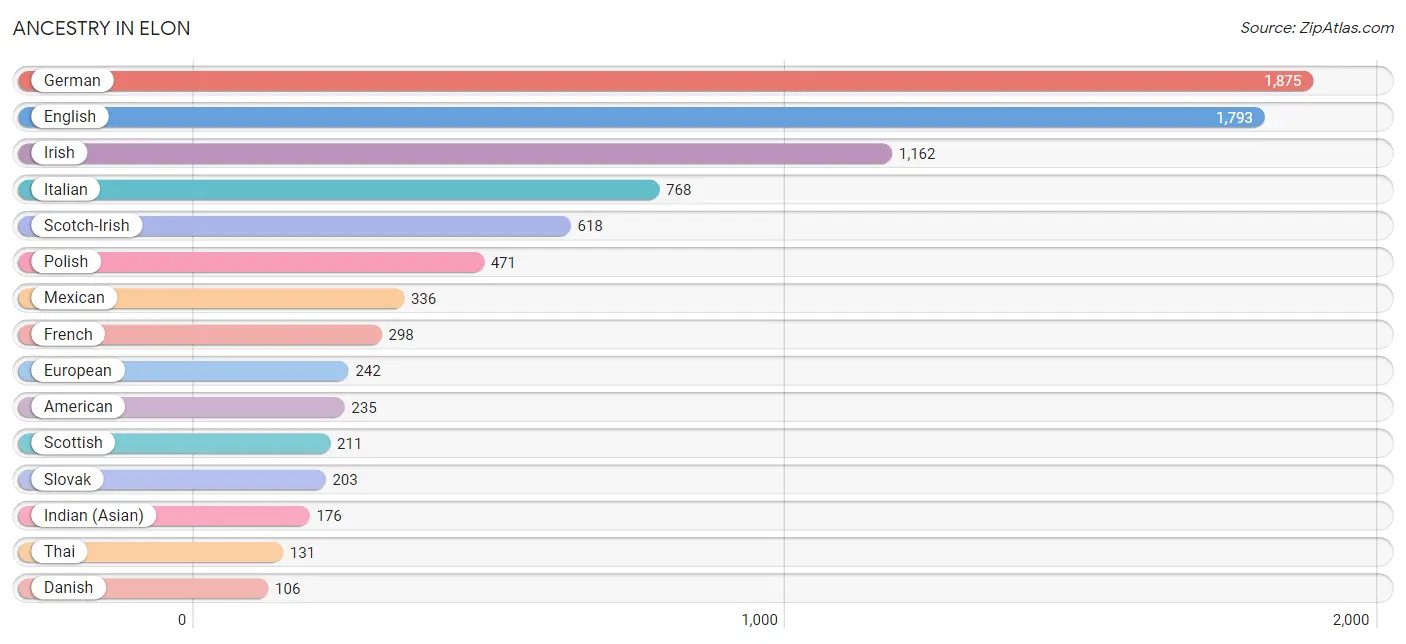
Ancestry in Elon
The most populous ancestries reported in Elon are German (1,875 | 16.8%), English (1,793 | 16.1%), Irish (1,162 | 10.4%), Italian (768 | 6.9%), and Scotch-Irish (618 | 5.5%), together accounting for 55.7% of all Elon residents.
| Ancestry | # Population | % Population |
| African | 50 | 0.4% |
| American | 235 | 2.1% |
| Arab | 22 | 0.2% |
| Austrian | 17 | 0.2% |
| Belgian | 30 | 0.3% |
| Bhutanese | 8 | 0.1% |
| British | 14 | 0.1% |
| Burmese | 18 | 0.2% |
| Canadian | 26 | 0.2% |
| Cherokee | 40 | 0.4% |
| Colombian | 33 | 0.3% |
| Czech | 22 | 0.2% |
| Czechoslovakian | 53 | 0.5% |
| Danish | 106 | 0.9% |
| Dutch | 91 | 0.8% |
| Eastern European | 68 | 0.6% |
| English | 1,793 | 16.1% |
| European | 242 | 2.2% |
| Filipino | 28 | 0.3% |
| Finnish | 11 | 0.1% |
| French | 298 | 2.7% |
| French Canadian | 44 | 0.4% |
| German | 1,875 | 16.8% |
| Greek | 24 | 0.2% |
| Hungarian | 52 | 0.5% |
| Indian (Asian) | 176 | 1.6% |
| Iranian | 33 | 0.3% |
| Irish | 1,162 | 10.4% |
| Italian | 768 | 6.9% |
| Jamaican | 28 | 0.3% |
| Korean | 51 | 0.5% |
| Mexican | 336 | 3.0% |
| Navajo | 28 | 0.3% |
| Norwegian | 46 | 0.4% |
| Pakistani | 7 | 0.1% |
| Polish | 471 | 4.2% |
| Portuguese | 14 | 0.1% |
| Puerto Rican | 49 | 0.4% |
| Russian | 50 | 0.4% |
| Scotch-Irish | 618 | 5.5% |
| Scottish | 211 | 1.9% |
| Slovak | 203 | 1.8% |
| Slovene | 46 | 0.4% |
| South American | 62 | 0.6% |
| Spaniard | 70 | 0.6% |
| Spanish | 9 | 0.1% |
| Sri Lankan | 4 | 0.0% |
| Subsaharan African | 50 | 0.4% |
| Swedish | 88 | 0.8% |
| Swiss | 40 | 0.4% |
| Thai | 131 | 1.2% |
| Uruguayan | 29 | 0.3% |
| Welsh | 91 | 0.8% | View All 53 Rows |
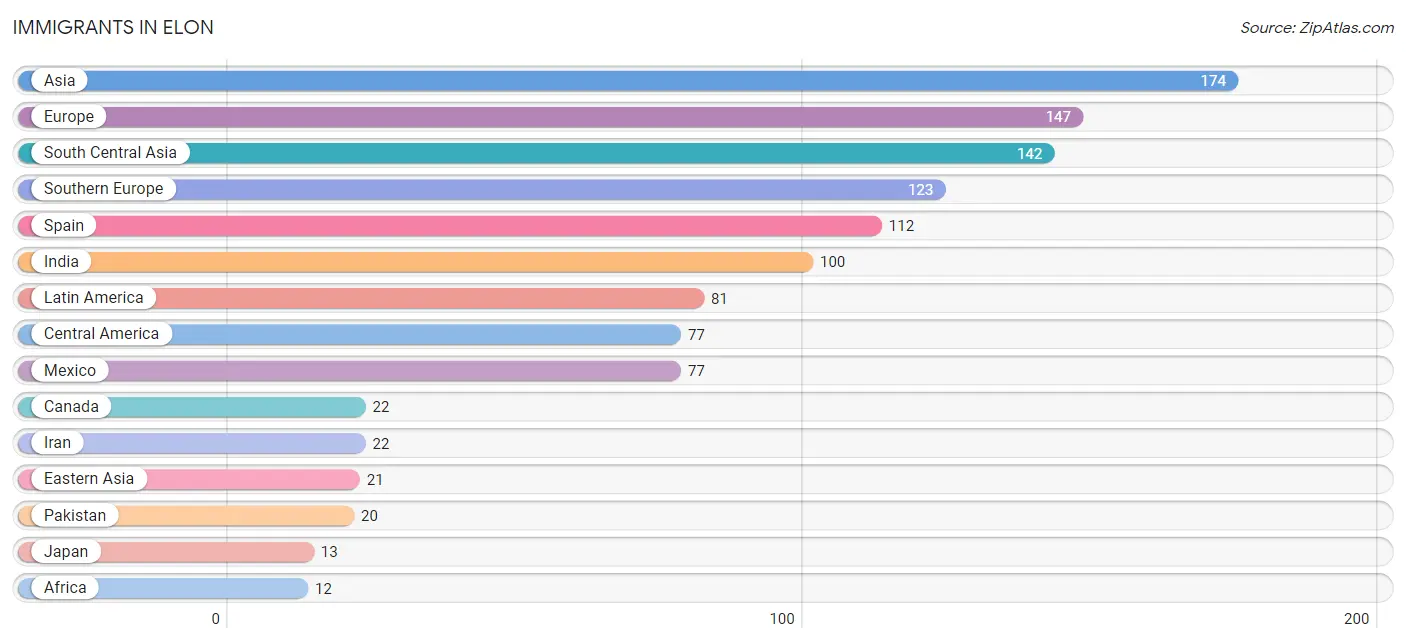
Immigrants in Elon
The most numerous immigrant groups reported in Elon came from Asia (174 | 1.6%), Europe (147 | 1.3%), South Central Asia (142 | 1.3%), Southern Europe (123 | 1.1%), and Spain (112 | 1.0%), together accounting for 6.2% of all Elon residents.
| Immigration Origin | # Population | % Population |
| Africa | 12 | 0.1% |
| Asia | 174 | 1.6% |
| Australia | 9 | 0.1% |
| Canada | 22 | 0.2% |
| Caribbean | 4 | 0.0% |
| Central America | 77 | 0.7% |
| China | 8 | 0.1% |
| Eastern Asia | 21 | 0.2% |
| Eastern Europe | 11 | 0.1% |
| Europe | 147 | 1.3% |
| Germany | 12 | 0.1% |
| India | 100 | 0.9% |
| Iran | 22 | 0.2% |
| Italy | 9 | 0.1% |
| Japan | 13 | 0.1% |
| Latin America | 81 | 0.7% |
| Malaysia | 4 | 0.0% |
| Mexico | 77 | 0.7% |
| Middle Africa | 12 | 0.1% |
| Northern Europe | 1 | 0.0% |
| Oceania | 9 | 0.1% |
| Pakistan | 20 | 0.2% |
| Portugal | 2 | 0.0% |
| Russia | 11 | 0.1% |
| South Central Asia | 142 | 1.3% |
| South Eastern Asia | 11 | 0.1% |
| Southern Europe | 123 | 1.1% |
| Spain | 112 | 1.0% |
| Thailand | 7 | 0.1% |
| Western Europe | 12 | 0.1% |
| Zaire | 12 | 0.1% | View All 31 Rows |
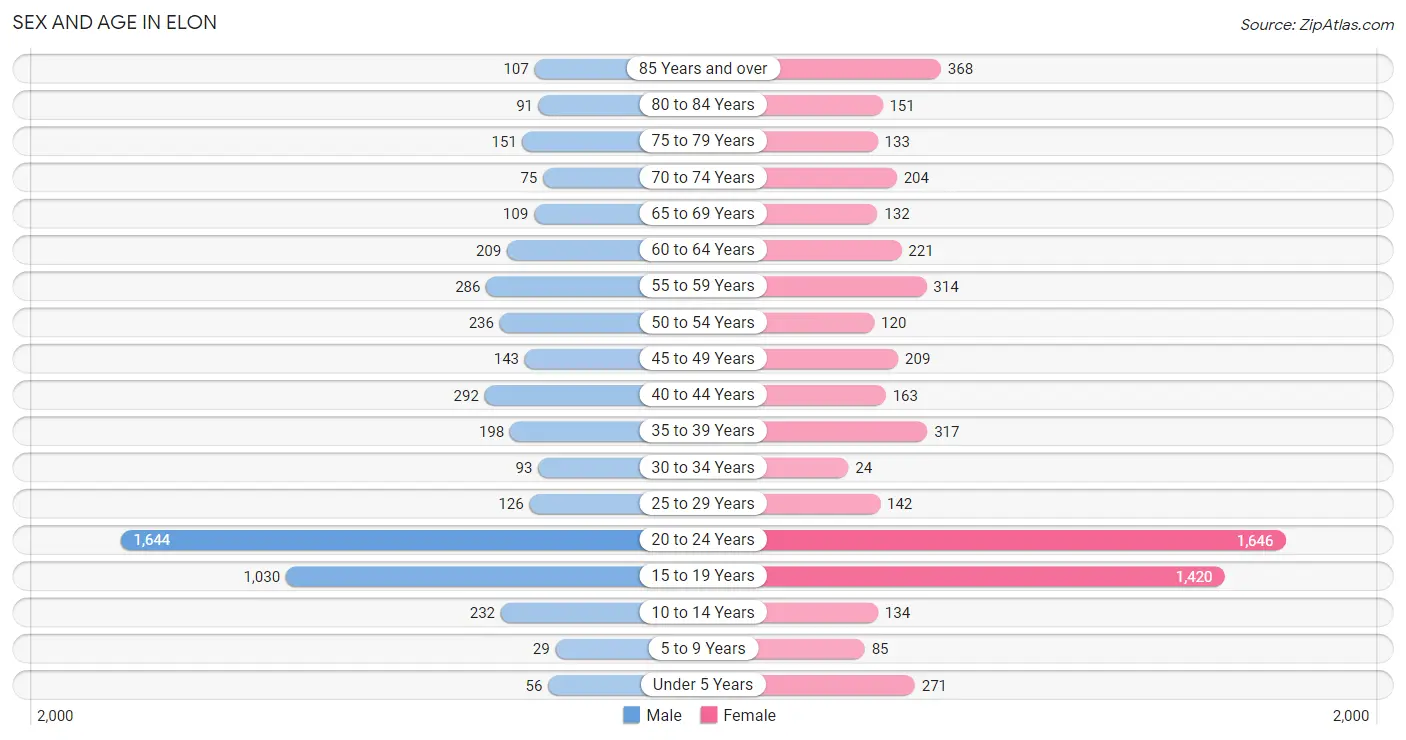
Sex and Age in Elon
Sex and Age in Elon
The most populous age groups in Elon are 20 to 24 Years (1,644 | 32.2%) for men and 20 to 24 Years (1,646 | 27.2%) for women.
| Age Bracket | Male | Female |
| Under 5 Years | 56 (1.1%) | 271 (4.5%) |
| 5 to 9 Years | 29 (0.6%) | 85 (1.4%) |
| 10 to 14 Years | 232 (4.5%) | 134 (2.2%) |
| 15 to 19 Years | 1,030 (20.2%) | 1,420 (23.5%) |
| 20 to 24 Years | 1,644 (32.2%) | 1,646 (27.2%) |
| 25 to 29 Years | 126 (2.5%) | 142 (2.4%) |
| 30 to 34 Years | 93 (1.8%) | 24 (0.4%) |
| 35 to 39 Years | 198 (3.9%) | 317 (5.2%) |
| 40 to 44 Years | 292 (5.7%) | 163 (2.7%) |
| 45 to 49 Years | 143 (2.8%) | 209 (3.5%) |
| 50 to 54 Years | 236 (4.6%) | 120 (2.0%) |
| 55 to 59 Years | 286 (5.6%) | 314 (5.2%) |
| 60 to 64 Years | 209 (4.1%) | 221 (3.6%) |
| 65 to 69 Years | 109 (2.1%) | 132 (2.2%) |
| 70 to 74 Years | 75 (1.5%) | 204 (3.4%) |
| 75 to 79 Years | 151 (3.0%) | 133 (2.2%) |
| 80 to 84 Years | 91 (1.8%) | 151 (2.5%) |
| 85 Years and over | 107 (2.1%) | 368 (6.1%) |
| Total | 5,107 (100.0%) | 6,054 (100.0%) |
Families and Households in Elon
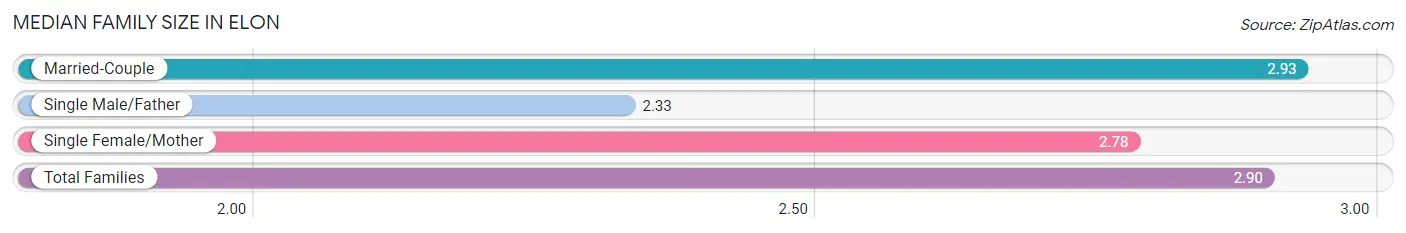
Median Family Size in Elon
The median family size in Elon is 2.90 persons per family, with married-couple families (1,536 | 88.6%) accounting for the largest median family size of 2.93 persons per family. On the other hand, single male/father families (36 | 2.1%) represent the smallest median family size with 2.33 persons per family.
| Family Type | # Families | Family Size |
| Married-Couple | 1,536 (88.6%) | 2.93 |
| Single Male/Father | 36 (2.1%) | 2.33 |
| Single Female/Mother | 161 (9.3%) | 2.78 |
| Total Families | 1,733 (100.0%) | 2.90 |
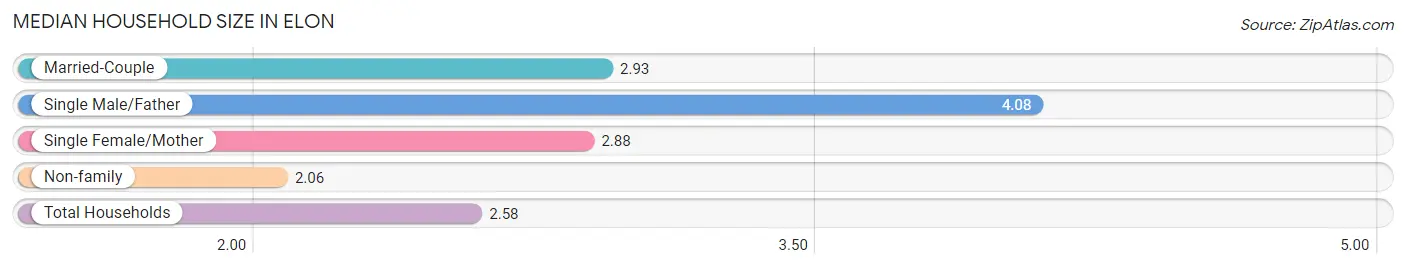
Median Household Size in Elon
The median household size in Elon is 2.58 persons per household, with single male/father households (36 | 1.2%) accounting for the largest median household size of 4.08 persons per household. non-family households (1,216 | 41.2%) represent the smallest median household size with 2.06 persons per household.
| Household Type | # Households | Household Size |
| Married-Couple | 1,536 (52.1%) | 2.93 |
| Single Male/Father | 36 (1.2%) | 4.08 |
| Single Female/Mother | 161 (5.5%) | 2.88 |
| Non-family | 1,216 (41.2%) | 2.06 |
| Total Households | 2,949 (100.0%) | 2.58 |
Household Size by Marriage Status in Elon
Out of a total of 2,949 households in Elon, 1,733 (58.8%) are family households, while 1,216 (41.2%) are nonfamily households. The most numerous type of family households are 2-person households, comprising 773, and the most common type of nonfamily households are 1-person households, comprising 670.
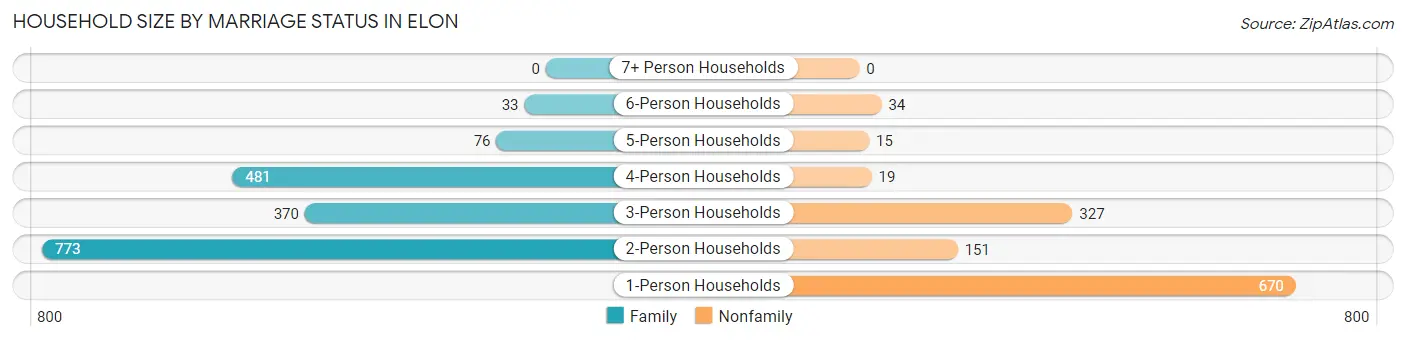
| Household Size | Family Households | Nonfamily Households |
| 1-Person Households | - | 670 (22.7%) |
| 2-Person Households | 773 (26.2%) | 151 (5.1%) |
| 3-Person Households | 370 (12.6%) | 327 (11.1%) |
| 4-Person Households | 481 (16.3%) | 19 (0.6%) |
| 5-Person Households | 76 (2.6%) | 15 (0.5%) |
| 6-Person Households | 33 (1.1%) | 34 (1.1%) |
| 7+ Person Households | 0 (0.0%) | 0 (0.0%) |
| Total | 1,733 (58.8%) | 1,216 (41.2%) |
Female Fertility in Elon
Fertility by Age in Elon
Average fertility rate in Elon is 25.0 births per 1,000 women. Women in the age bracket of 20 to 34 years have the highest fertility rate with 31.0 births per 1,000 women. Women in the age bracket of 20 to 34 years acount for 57.7% of all women with births.
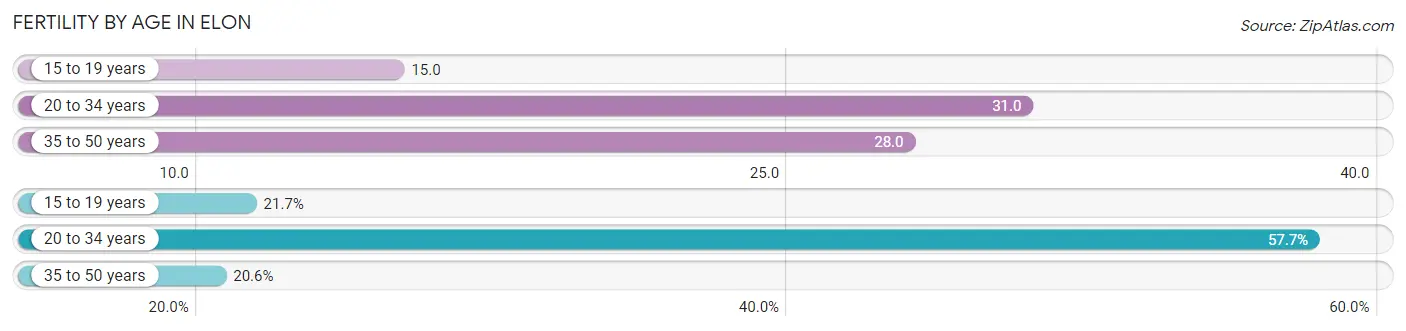
| Age Bracket | Women with Births | Births / 1,000 Women |
| 15 to 19 years | 21 (21.6%) | 15.0 |
| 20 to 34 years | 56 (57.7%) | 31.0 |
| 35 to 50 years | 20 (20.6%) | 28.0 |
| Total | 97 (100.0%) | 25.0 |
Fertility by Age by Marriage Status in Elon
37.1% of women with births (97) in Elon are married. The highest percentage of unmarried women with births falls into 15 to 19 years age bracket with 100.0% of them unmarried at the time of birth, while the lowest percentage of unmarried women with births belong to 35 to 50 years age bracket with 0.0% of them unmarried.
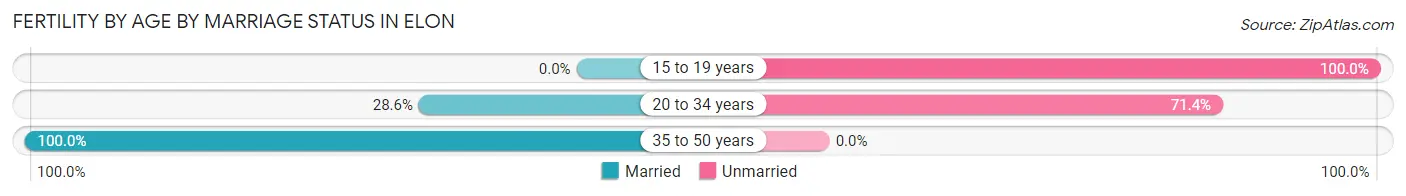
| Age Bracket | Married | Unmarried |
| 15 to 19 years | 0 (0.0%) | 21 (100.0%) |
| 20 to 34 years | 16 (28.6%) | 40 (71.4%) |
| 35 to 50 years | 20 (100.0%) | 0 (0.0%) |
| Total | 36 (37.1%) | 61 (62.9%) |
Fertility by Education in Elon
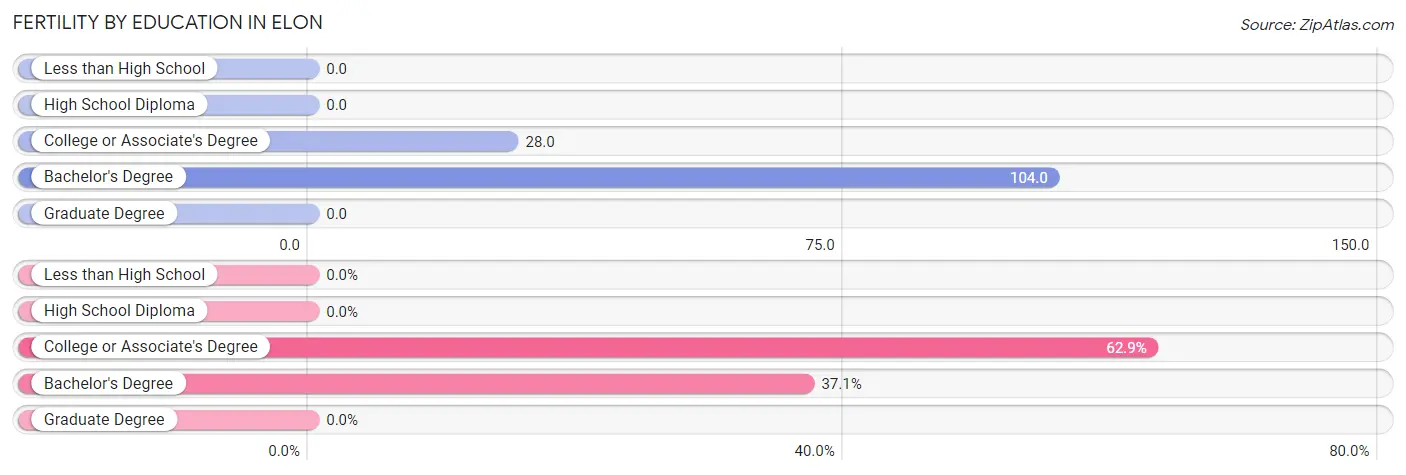
| Educational Attainment | Women with Births | Births / 1,000 Women |
| Less than High School | 0 (0.0%) | 0.0 |
| High School Diploma | 0 (0.0%) | 0.0 |
| College or Associate's Degree | 61 (62.9%) | 28.0 |
| Bachelor's Degree | 36 (37.1%) | 104.0 |
| Graduate Degree | 0 (0.0%) | 0.0 |
| Total | 97 (100.0%) | 25.0 |
Fertility by Education by Marriage Status in Elon
62.9% of women with births in Elon are unmarried. Women with the educational attainment of bachelor's degree are most likely to be married with 100.0% of them married at childbirth, while women with the educational attainment of college or associate's degree are least likely to be married with 100.0% of them unmarried at childbirth.
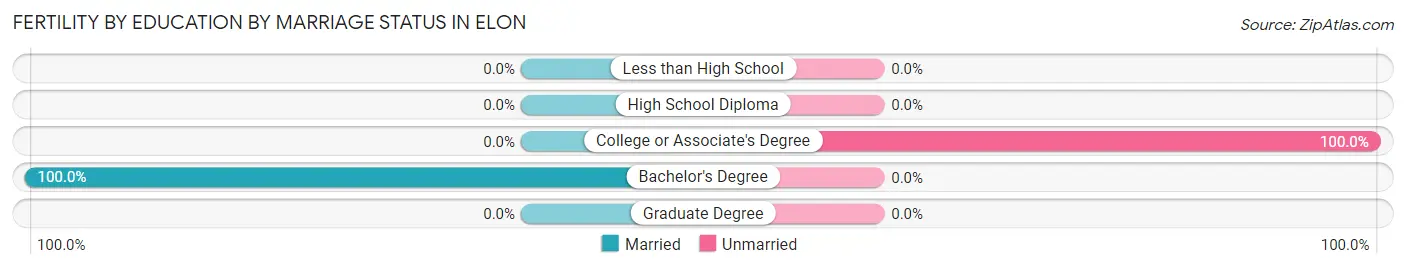
| Educational Attainment | Married | Unmarried |
| Less than High School | 0 (0.0%) | 0 (0.0%) |
| High School Diploma | 0 (0.0%) | 0 (0.0%) |
| College or Associate's Degree | 0 (0.0%) | 61 (100.0%) |
| Bachelor's Degree | 36 (100.0%) | 0 (0.0%) |
| Graduate Degree | 0 (0.0%) | 0 (0.0%) |
| Total | 36 (37.1%) | 61 (62.9%) |
Employment Characteristics in Elon
Employment by Class of Employer in Elon
Among the 4,377 employed individuals in Elon, private company employees (2,965 | 67.7%), not-for-profit organizations (396 | 9.0%), and local government employees (304 | 7.0%) make up the most common classes of employment.
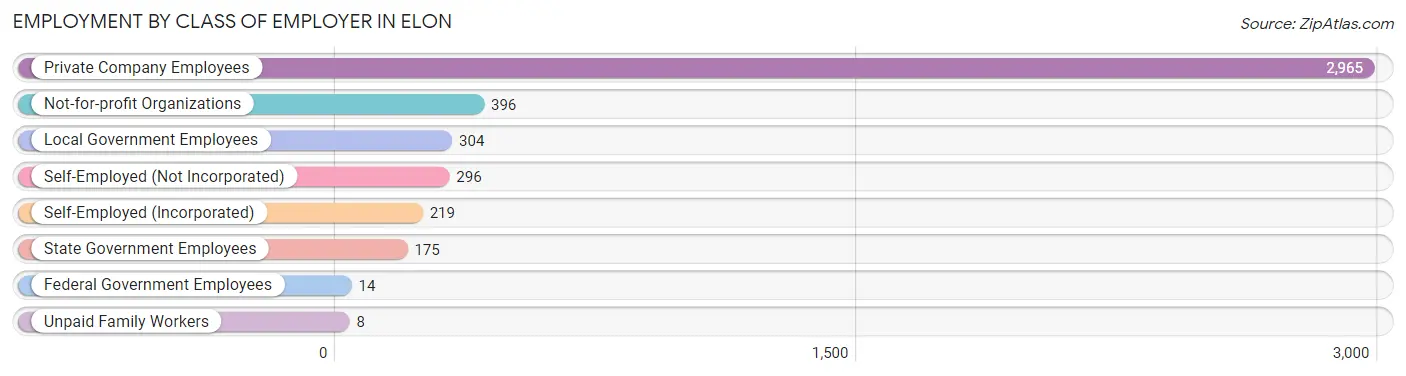
| Employer Class | # Employees | % Employees |
| Private Company Employees | 2,965 | 67.7% |
| Self-Employed (Incorporated) | 219 | 5.0% |
| Self-Employed (Not Incorporated) | 296 | 6.8% |
| Not-for-profit Organizations | 396 | 9.0% |
| Local Government Employees | 304 | 7.0% |
| State Government Employees | 175 | 4.0% |
| Federal Government Employees | 14 | 0.3% |
| Unpaid Family Workers | 8 | 0.2% |
| Total | 4,377 | 100.0% |
Employment Status by Age in Elon
According to the labor force statistics for Elon, out of the total population over 16 years of age (10,243), 45.4% or 4,650 individuals are in the labor force, with 3.9% or 181 of them unemployed. The age group with the highest labor force participation rate is 30 to 34 years, with 100.0% or 117 individuals in the labor force. Within the labor force, the 55 to 59 years age range has the highest percentage of unemployed individuals, with 14.5% or 69 of them being unemployed.
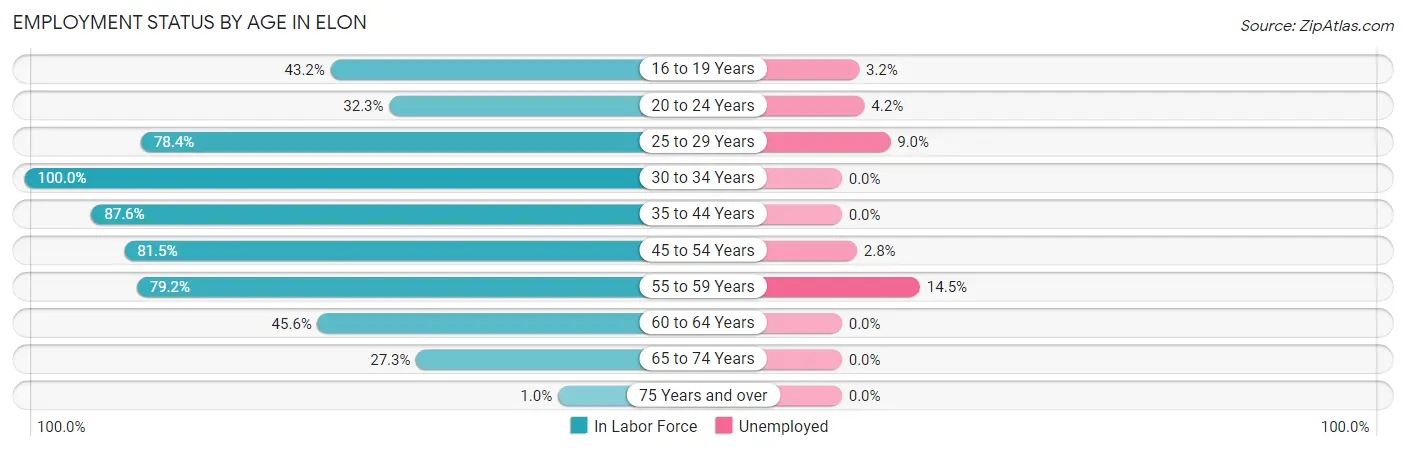
| Age Bracket | In Labor Force | Unemployed |
| 16 to 19 Years | 1,010 (43.2%) | 32 (3.2%) |
| 20 to 24 Years | 1,063 (32.3%) | 45 (4.2%) |
| 25 to 29 Years | 210 (78.4%) | 19 (9.0%) |
| 30 to 34 Years | 117 (100.0%) | 0 (0.0%) |
| 35 to 44 Years | 850 (87.6%) | 0 (0.0%) |
| 45 to 54 Years | 577 (81.5%) | 16 (2.8%) |
| 55 to 59 Years | 475 (79.2%) | 69 (14.5%) |
| 60 to 64 Years | 196 (45.6%) | 0 (0.0%) |
| 65 to 74 Years | 142 (27.3%) | 0 (0.0%) |
| 75 Years and over | 10 (1.0%) | 0 (0.0%) |
| Total | 4,650 (45.4%) | 181 (3.9%) |
Employment Status by Educational Attainment in Elon
According to labor force statistics for Elon, 78.4% of individuals (2,425) out of the total population between 25 and 64 years of age (3,093) are in the labor force, with 4.3% or 104 of them being unemployed. The group with the highest labor force participation rate are those with the educational attainment of bachelor's degree or higher, with 88.1% or 1,484 individuals in the labor force. Within the labor force, individuals with high school diploma education have the highest percentage of unemployment, with 15.8% or 19 of them being unemployed.
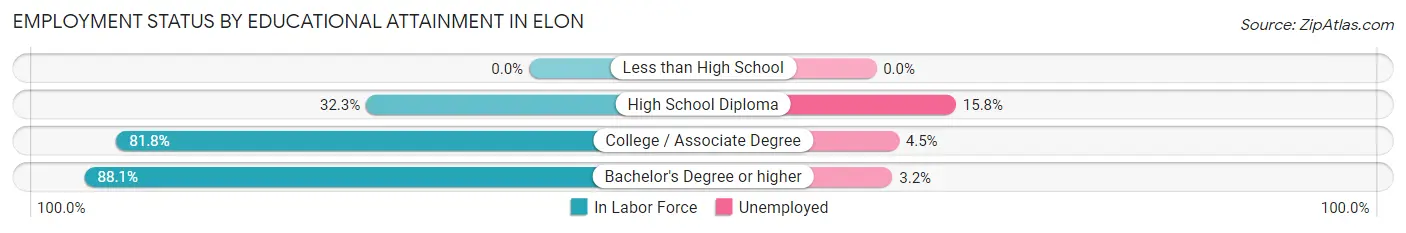
| Educational Attainment | In Labor Force | Unemployed |
| Less than High School | 0 (0.0%) | 0 (0.0%) |
| High School Diploma | 120 (32.3%) | 59 (15.8%) |
| College / Associate Degree | 820 (81.8%) | 45 (4.5%) |
| Bachelor's Degree or higher | 1,484 (88.1%) | 54 (3.2%) |
| Total | 2,425 (78.4%) | 133 (4.3%) |
Employment Occupations by Sex in Elon
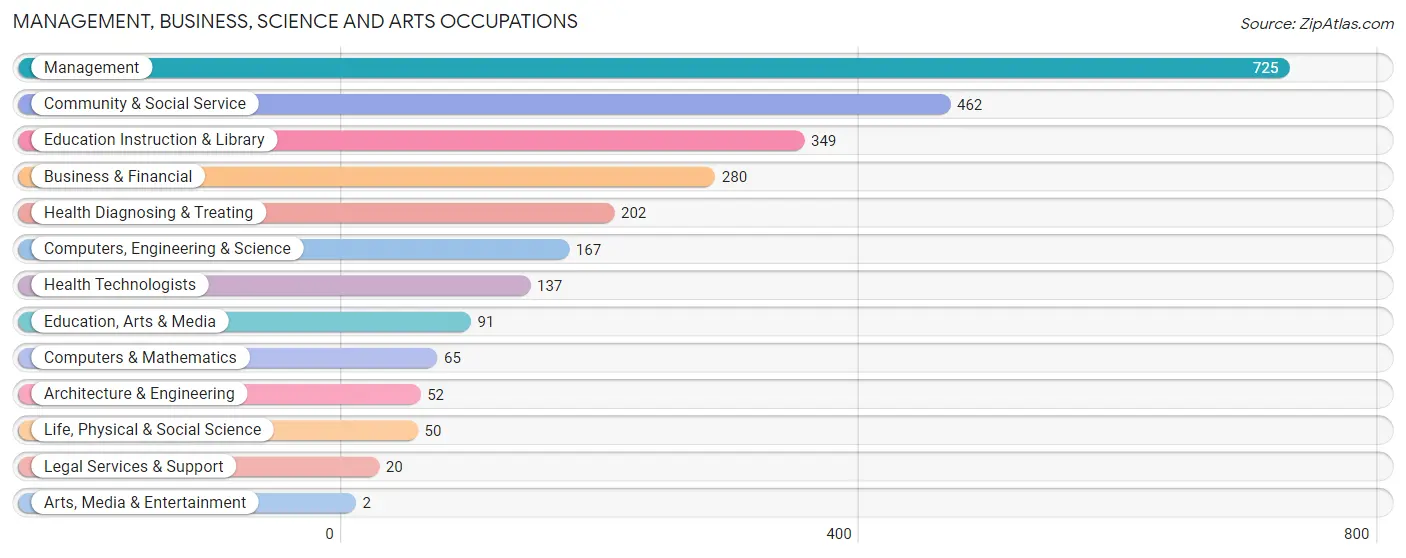
Management, Business, Science and Arts Occupations
The most common Management, Business, Science and Arts occupations in Elon are Management (725 | 16.2%), Community & Social Service (462 | 10.3%), Education Instruction & Library (349 | 7.8%), Business & Financial (280 | 6.3%), and Health Diagnosing & Treating (202 | 4.5%).
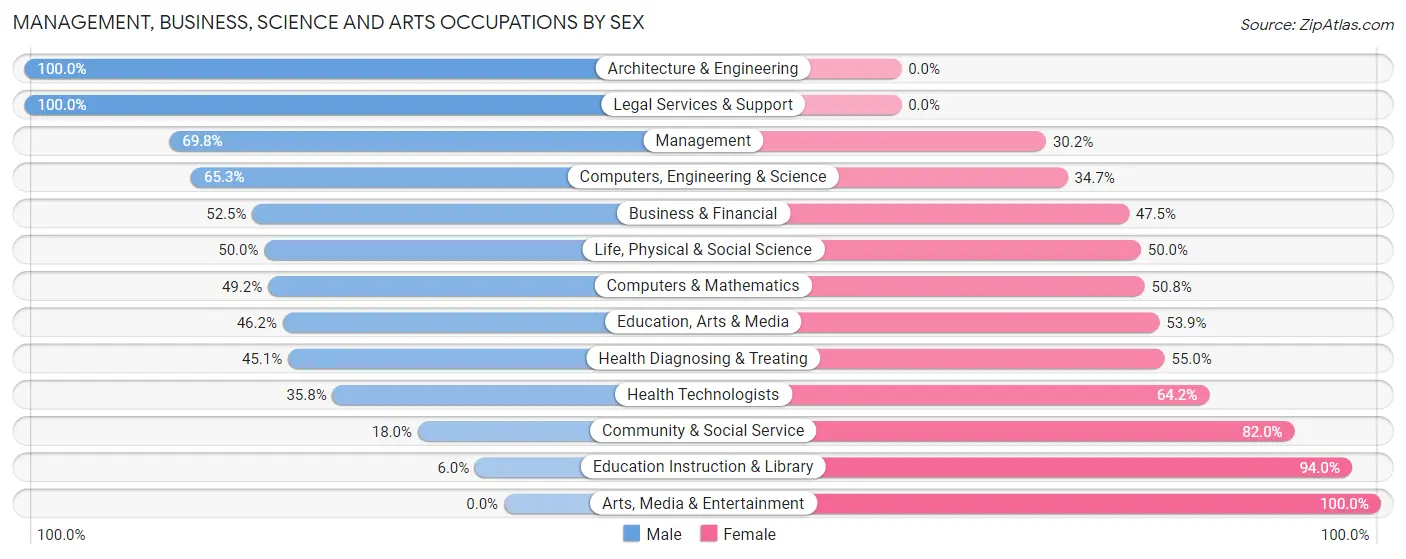
Management, Business, Science and Arts Occupations by Sex
Within the Management, Business, Science and Arts occupations in Elon, the most male-oriented occupations are Architecture & Engineering (100.0%), Legal Services & Support (100.0%), and Management (69.8%), while the most female-oriented occupations are Arts, Media & Entertainment (100.0%), Education Instruction & Library (94.0%), and Community & Social Service (82.0%).
| Occupation | Male | Female |
| Management | 506 (69.8%) | 219 (30.2%) |
| Business & Financial | 147 (52.5%) | 133 (47.5%) |
| Computers, Engineering & Science | 109 (65.3%) | 58 (34.7%) |
| Computers & Mathematics | 32 (49.2%) | 33 (50.8%) |
| Architecture & Engineering | 52 (100.0%) | 0 (0.0%) |
| Life, Physical & Social Science | 25 (50.0%) | 25 (50.0%) |
| Community & Social Service | 83 (18.0%) | 379 (82.0%) |
| Education, Arts & Media | 42 (46.2%) | 49 (53.8%) |
| Legal Services & Support | 20 (100.0%) | 0 (0.0%) |
| Education Instruction & Library | 21 (6.0%) | 328 (94.0%) |
| Arts, Media & Entertainment | 0 (0.0%) | 2 (100.0%) |
| Health Diagnosing & Treating | 91 (45.1%) | 111 (54.9%) |
| Health Technologists | 49 (35.8%) | 88 (64.2%) |
| Total (Category) | 936 (51.0%) | 900 (49.0%) |
| Total (Overall) | 2,605 (58.3%) | 1,863 (41.7%) |
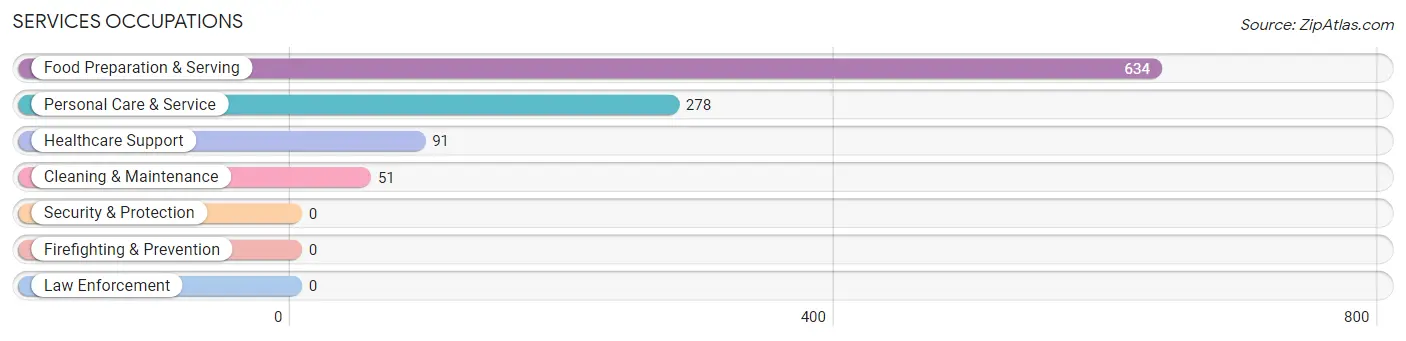
Services Occupations
The most common Services occupations in Elon are Food Preparation & Serving (634 | 14.2%), Personal Care & Service (278 | 6.2%), Healthcare Support (91 | 2.0%), and Cleaning & Maintenance (51 | 1.1%).
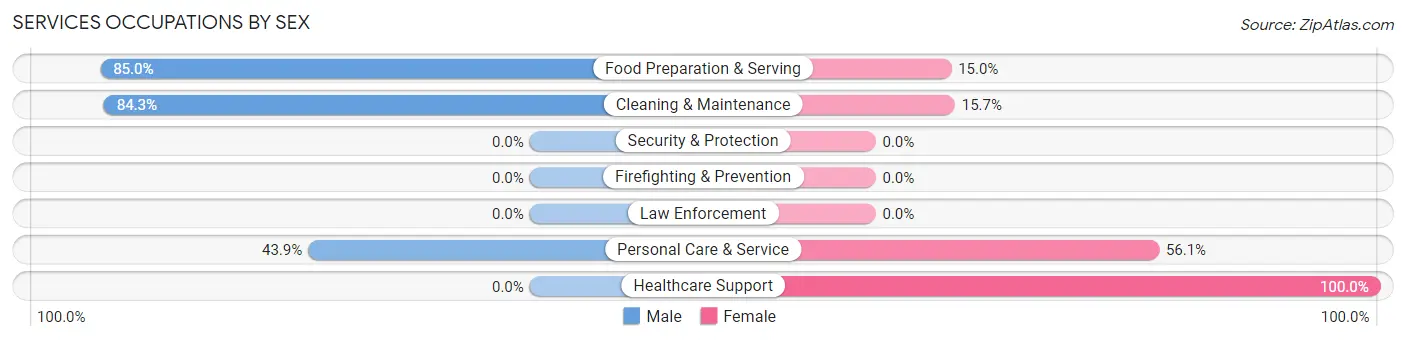
Services Occupations by Sex
Within the Services occupations in Elon, the most male-oriented occupations are Food Preparation & Serving (85.0%), Cleaning & Maintenance (84.3%), and Personal Care & Service (43.9%), while the most female-oriented occupations are Healthcare Support (100.0%), Personal Care & Service (56.1%), and Cleaning & Maintenance (15.7%).
| Occupation | Male | Female |
| Healthcare Support | 0 (0.0%) | 91 (100.0%) |
| Security & Protection | 0 (0.0%) | 0 (0.0%) |
| Firefighting & Prevention | 0 (0.0%) | 0 (0.0%) |
| Law Enforcement | 0 (0.0%) | 0 (0.0%) |
| Food Preparation & Serving | 539 (85.0%) | 95 (15.0%) |
| Cleaning & Maintenance | 43 (84.3%) | 8 (15.7%) |
| Personal Care & Service | 122 (43.9%) | 156 (56.1%) |
| Total (Category) | 704 (66.8%) | 350 (33.2%) |
| Total (Overall) | 2,605 (58.3%) | 1,863 (41.7%) |
Sales and Office Occupations
The most common Sales and Office occupations in Elon are Office & Administration (560 | 12.5%), and Sales & Related (318 | 7.1%).

Sales and Office Occupations by Sex
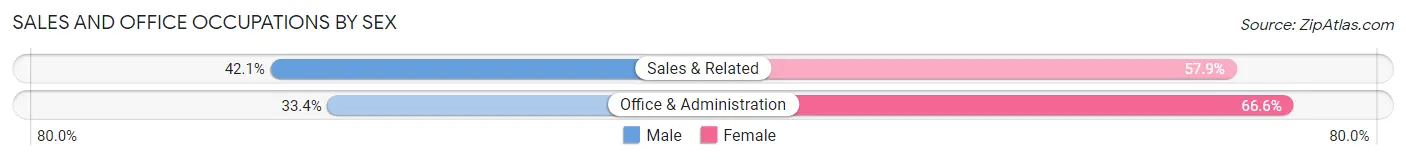
| Occupation | Male | Female |
| Sales & Related | 134 (42.1%) | 184 (57.9%) |
| Office & Administration | 187 (33.4%) | 373 (66.6%) |
| Total (Category) | 321 (36.6%) | 557 (63.4%) |
| Total (Overall) | 2,605 (58.3%) | 1,863 (41.7%) |
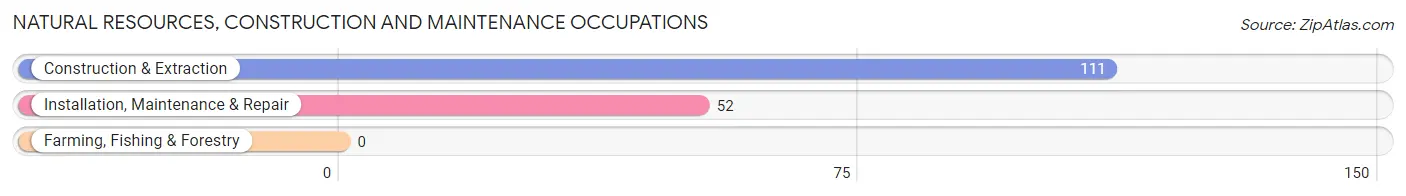
Natural Resources, Construction and Maintenance Occupations
The most common Natural Resources, Construction and Maintenance occupations in Elon are Construction & Extraction (111 | 2.5%), and Installation, Maintenance & Repair (52 | 1.2%).
Natural Resources, Construction and Maintenance Occupations by Sex
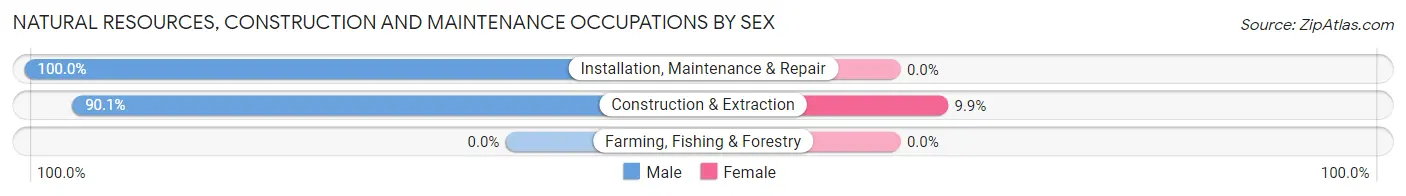
| Occupation | Male | Female |
| Farming, Fishing & Forestry | 0 (0.0%) | 0 (0.0%) |
| Construction & Extraction | 100 (90.1%) | 11 (9.9%) |
| Installation, Maintenance & Repair | 52 (100.0%) | 0 (0.0%) |
| Total (Category) | 152 (93.2%) | 11 (6.8%) |
| Total (Overall) | 2,605 (58.3%) | 1,863 (41.7%) |
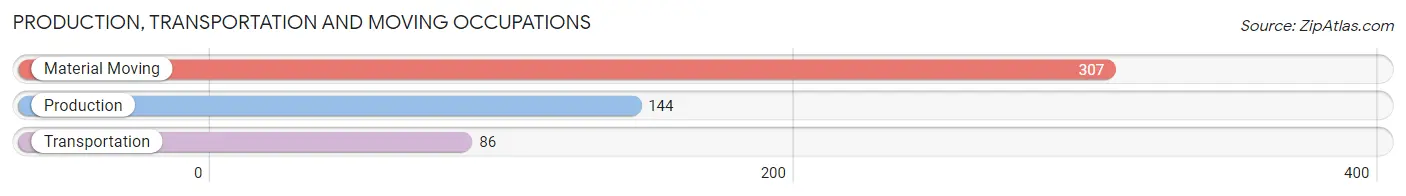
Production, Transportation and Moving Occupations
The most common Production, Transportation and Moving occupations in Elon are Material Moving (307 | 6.9%), Production (144 | 3.2%), and Transportation (86 | 1.9%).
Production, Transportation and Moving Occupations by Sex
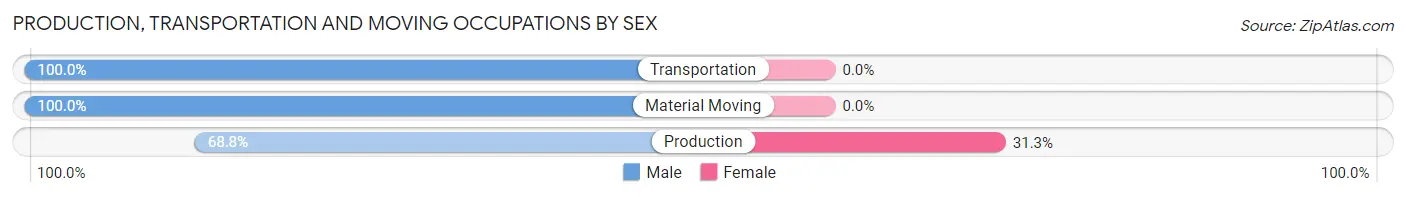
| Occupation | Male | Female |
| Production | 99 (68.8%) | 45 (31.2%) |
| Transportation | 86 (100.0%) | 0 (0.0%) |
| Material Moving | 307 (100.0%) | 0 (0.0%) |
| Total (Category) | 492 (91.6%) | 45 (8.4%) |
| Total (Overall) | 2,605 (58.3%) | 1,863 (41.7%) |
Employment Industries by Sex in Elon
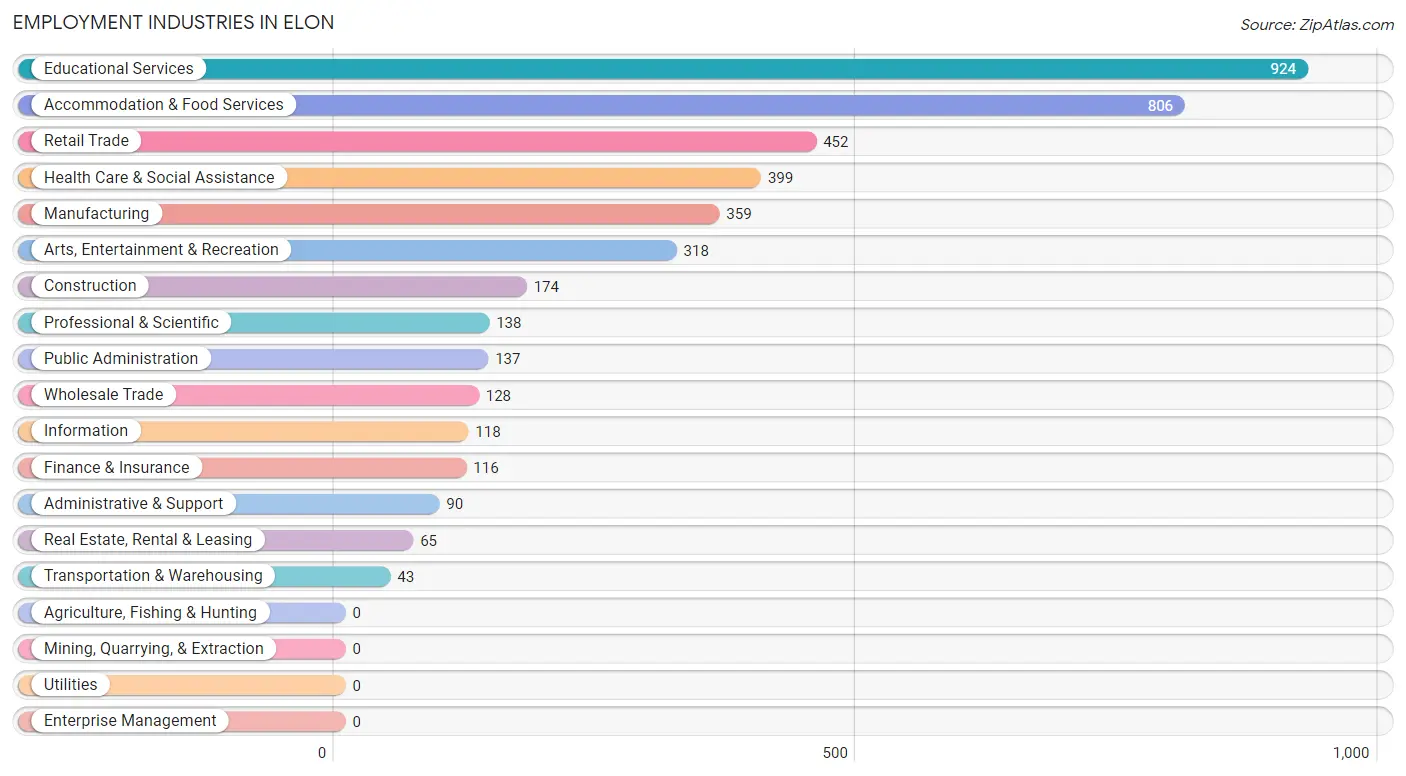
Employment Industries in Elon
The major employment industries in Elon include Educational Services (924 | 20.7%), Accommodation & Food Services (806 | 18.0%), Retail Trade (452 | 10.1%), Health Care & Social Assistance (399 | 8.9%), and Manufacturing (359 | 8.0%).
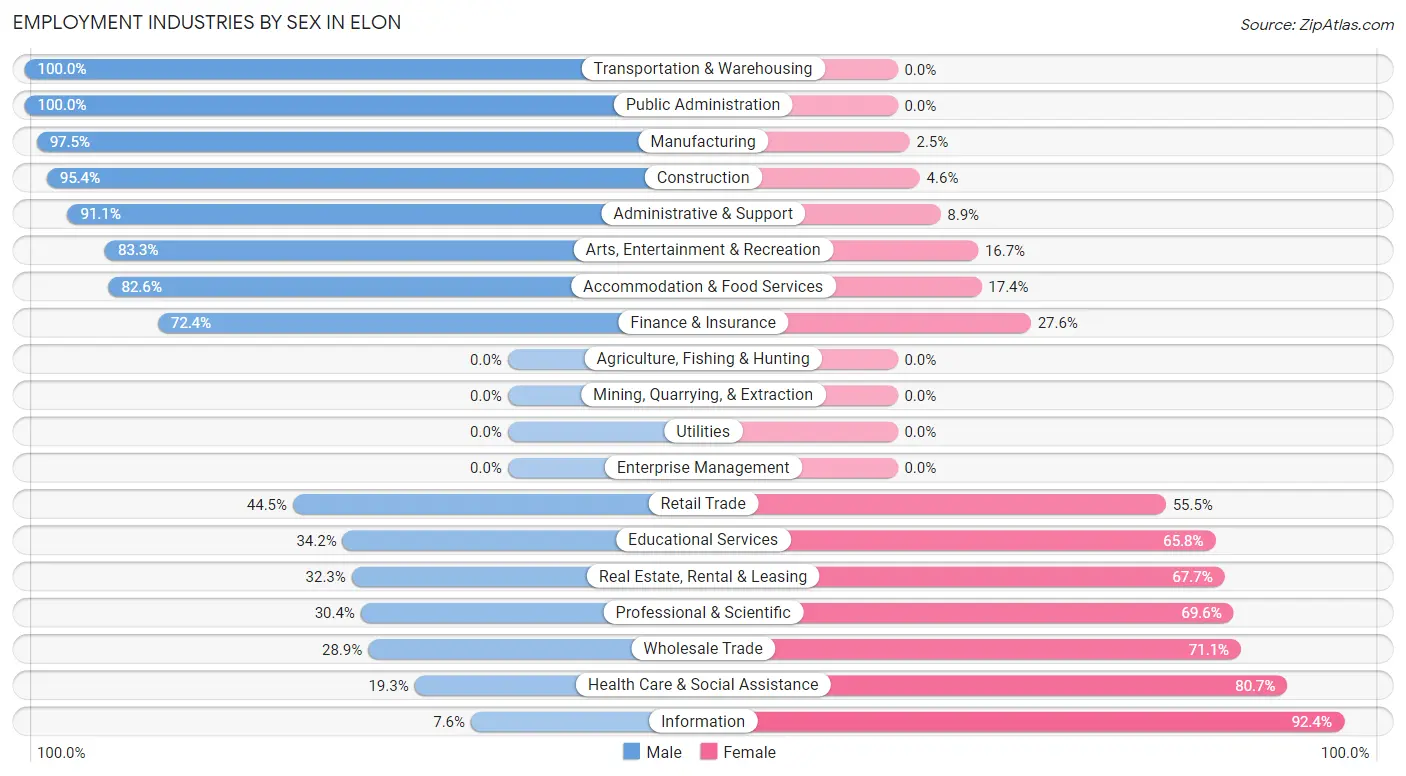
Employment Industries by Sex in Elon
The Elon industries that see more men than women are Transportation & Warehousing (100.0%), Public Administration (100.0%), and Manufacturing (97.5%), whereas the industries that tend to have a higher number of women are Information (92.4%), Health Care & Social Assistance (80.7%), and Wholesale Trade (71.1%).
| Industry | Male | Female |
| Agriculture, Fishing & Hunting | 0 (0.0%) | 0 (0.0%) |
| Mining, Quarrying, & Extraction | 0 (0.0%) | 0 (0.0%) |
| Construction | 166 (95.4%) | 8 (4.6%) |
| Manufacturing | 350 (97.5%) | 9 (2.5%) |
| Wholesale Trade | 37 (28.9%) | 91 (71.1%) |
| Retail Trade | 201 (44.5%) | 251 (55.5%) |
| Transportation & Warehousing | 43 (100.0%) | 0 (0.0%) |
| Utilities | 0 (0.0%) | 0 (0.0%) |
| Information | 9 (7.6%) | 109 (92.4%) |
| Finance & Insurance | 84 (72.4%) | 32 (27.6%) |
| Real Estate, Rental & Leasing | 21 (32.3%) | 44 (67.7%) |
| Professional & Scientific | 42 (30.4%) | 96 (69.6%) |
| Enterprise Management | 0 (0.0%) | 0 (0.0%) |
| Administrative & Support | 82 (91.1%) | 8 (8.9%) |
| Educational Services | 316 (34.2%) | 608 (65.8%) |
| Health Care & Social Assistance | 77 (19.3%) | 322 (80.7%) |
| Arts, Entertainment & Recreation | 265 (83.3%) | 53 (16.7%) |
| Accommodation & Food Services | 666 (82.6%) | 140 (17.4%) |
| Public Administration | 137 (100.0%) | 0 (0.0%) |
| Total | 2,605 (58.3%) | 1,863 (41.7%) |
Education in Elon
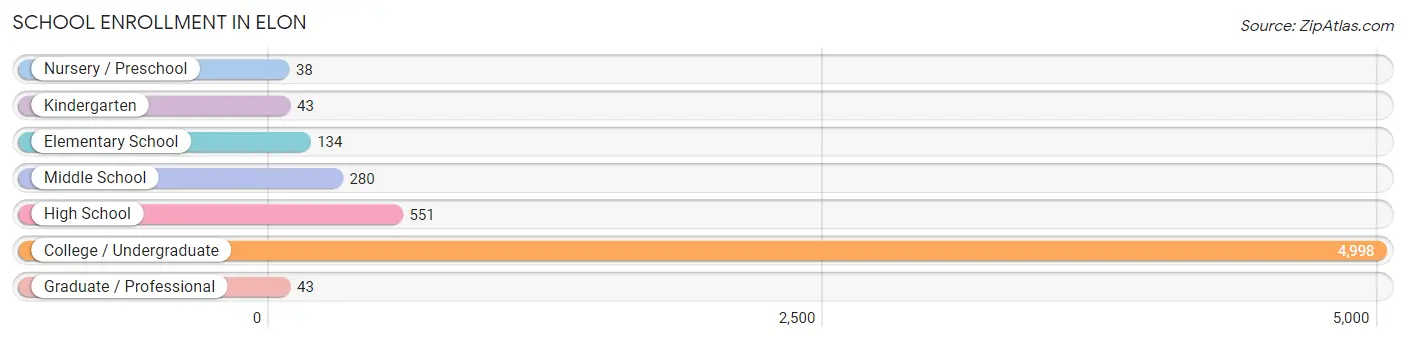
School Enrollment in Elon
The most common levels of schooling among the 6,087 students in Elon are college / undergraduate (4,998 | 82.1%), high school (551 | 9.0%), and middle school (280 | 4.6%).
| School Level | # Students | % Students |
| Nursery / Preschool | 38 | 0.6% |
| Kindergarten | 43 | 0.7% |
| Elementary School | 134 | 2.2% |
| Middle School | 280 | 4.6% |
| High School | 551 | 9.0% |
| College / Undergraduate | 4,998 | 82.1% |
| Graduate / Professional | 43 | 0.7% |
| Total | 6,087 | 100.0% |
School Enrollment by Age by Funding Source in Elon
Out of a total of 6,087 students who are enrolled in schools in Elon, 4,517 (74.2%) attend a private institution, while the remaining 1,570 (25.8%) are enrolled in public schools. The age group of 18 to 19 year olds has the highest likelihood of being enrolled in private schools, with 1,716 (87.0% in the age bracket) enrolled. Conversely, the age group of 25 to 34 year olds has the lowest likelihood of being enrolled in a private school, with 16 (100.0% in the age bracket) attending a public institution.
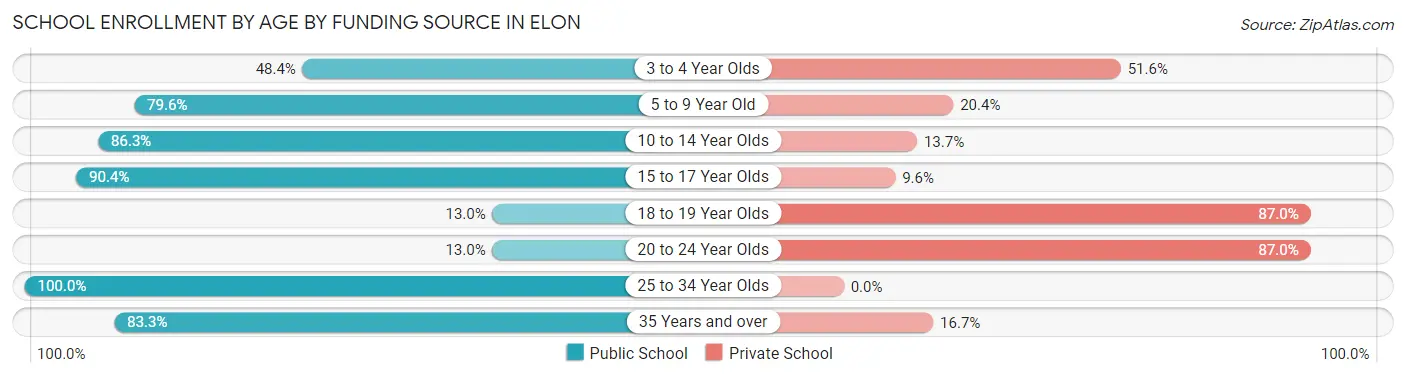
| Age Bracket | Public School | Private School |
| 3 to 4 Year Olds | 15 (48.4%) | 16 (51.6%) |
| 5 to 9 Year Old | 78 (79.6%) | 20 (20.4%) |
| 10 to 14 Year Olds | 316 (86.3%) | 50 (13.7%) |
| 15 to 17 Year Olds | 405 (90.4%) | 43 (9.6%) |
| 18 to 19 Year Olds | 257 (13.0%) | 1,716 (87.0%) |
| 20 to 24 Year Olds | 398 (13.0%) | 2,655 (87.0%) |
| 25 to 34 Year Olds | 16 (100.0%) | 0 (0.0%) |
| 35 Years and over | 85 (83.3%) | 17 (16.7%) |
| Total | 1,570 (25.8%) | 4,517 (74.2%) |
Educational Attainment by Field of Study in Elon
Business (503 | 19.6%), education (389 | 15.2%), science & technology (295 | 11.5%), communications (268 | 10.5%), and arts & humanities (178 | 7.0%) are the most common fields of study among 2,561 individuals in Elon who have obtained a bachelor's degree or higher.
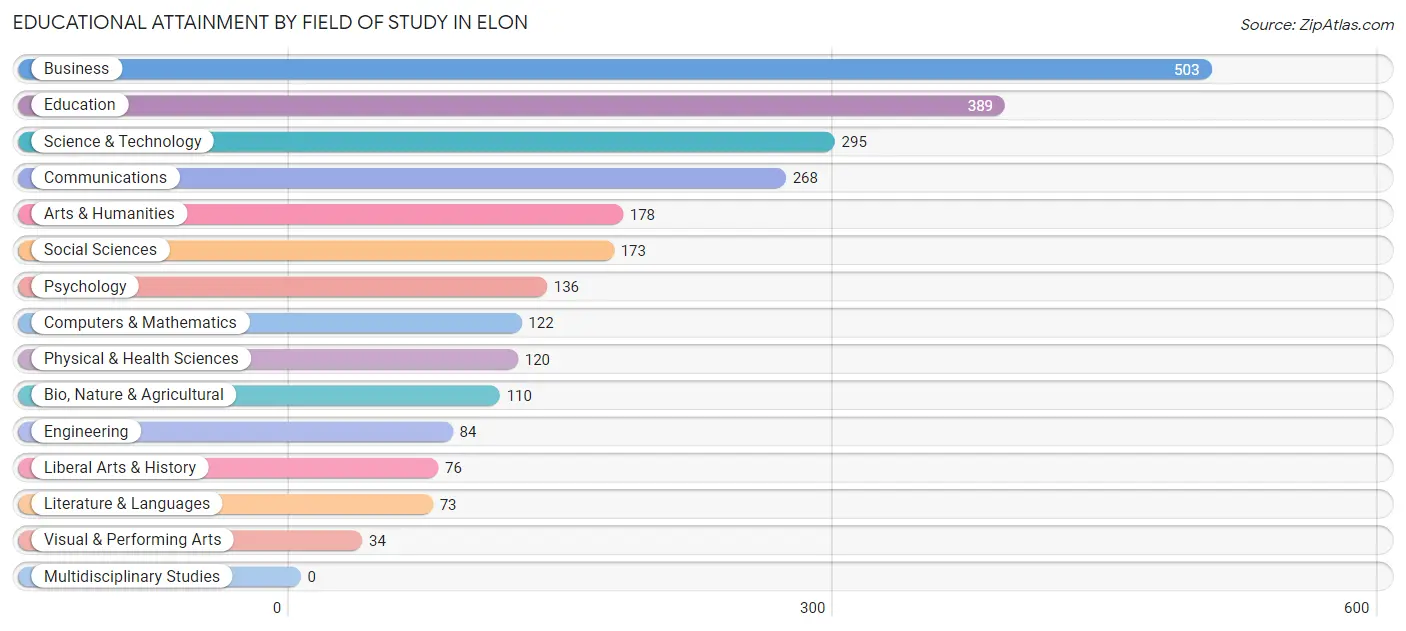
| Field of Study | # Graduates | % Graduates |
| Computers & Mathematics | 122 | 4.8% |
| Bio, Nature & Agricultural | 110 | 4.3% |
| Physical & Health Sciences | 120 | 4.7% |
| Psychology | 136 | 5.3% |
| Social Sciences | 173 | 6.8% |
| Engineering | 84 | 3.3% |
| Multidisciplinary Studies | 0 | 0.0% |
| Science & Technology | 295 | 11.5% |
| Business | 503 | 19.6% |
| Education | 389 | 15.2% |
| Literature & Languages | 73 | 2.9% |
| Liberal Arts & History | 76 | 3.0% |
| Visual & Performing Arts | 34 | 1.3% |
| Communications | 268 | 10.5% |
| Arts & Humanities | 178 | 7.0% |
| Total | 2,561 | 100.0% |
Transportation & Commute in Elon
Vehicle Availability by Sex in Elon
The most prevalent vehicle ownership categories in Elon are males with 2 vehicles (656, accounting for 35.4%) and females with 2 vehicles (515, making up 44.3%).
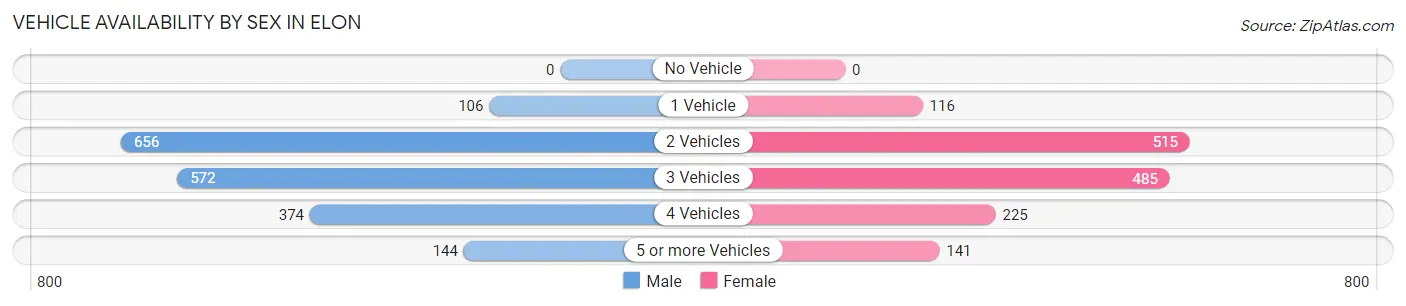
| Vehicles Available | Male | Female |
| No Vehicle | 0 (0.0%) | 0 (0.0%) |
| 1 Vehicle | 106 (5.7%) | 116 (7.8%) |
| 2 Vehicles | 656 (35.4%) | 515 (34.7%) |
| 3 Vehicles | 572 (30.9%) | 485 (32.7%) |
| 4 Vehicles | 374 (20.2%) | 225 (15.2%) |
| 5 or more Vehicles | 144 (7.8%) | 141 (9.5%) |
| Total | 1,852 (100.0%) | 1,482 (100.0%) |
Commute Time in Elon
The most frequently occuring commute durations in Elon are 10 to 14 minutes (658 commuters, 17.7%), 5 to 9 minutes (576 commuters, 15.5%), and 20 to 24 minutes (449 commuters, 12.0%).
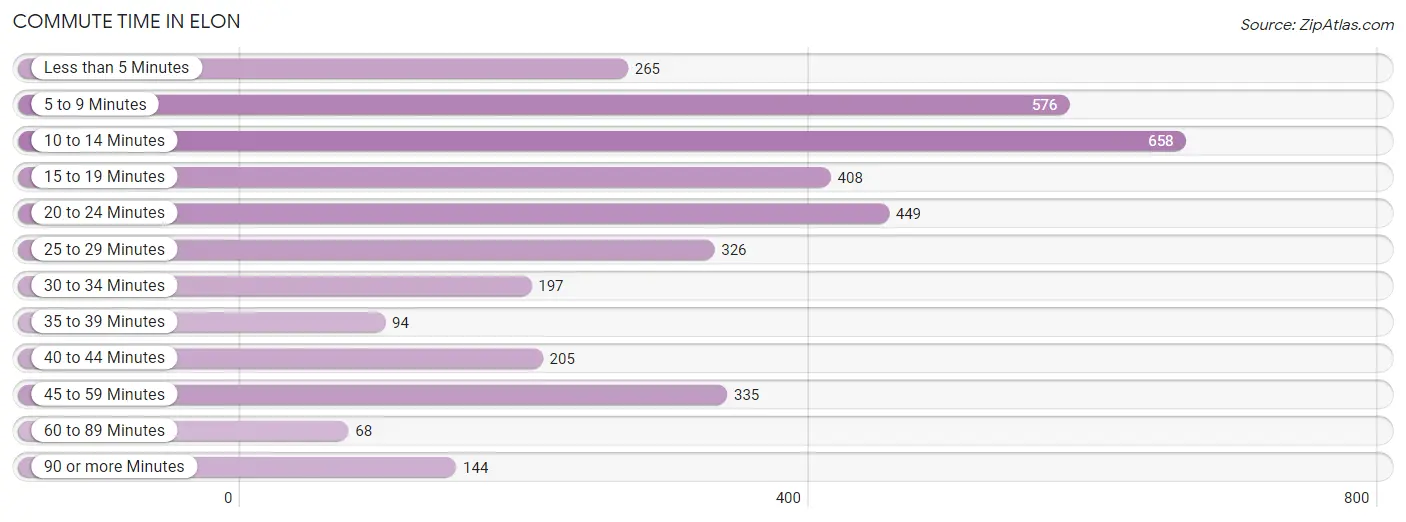
| Commute Time | # Commuters | % Commuters |
| Less than 5 Minutes | 265 | 7.1% |
| 5 to 9 Minutes | 576 | 15.5% |
| 10 to 14 Minutes | 658 | 17.7% |
| 15 to 19 Minutes | 408 | 11.0% |
| 20 to 24 Minutes | 449 | 12.0% |
| 25 to 29 Minutes | 326 | 8.7% |
| 30 to 34 Minutes | 197 | 5.3% |
| 35 to 39 Minutes | 94 | 2.5% |
| 40 to 44 Minutes | 205 | 5.5% |
| 45 to 59 Minutes | 335 | 9.0% |
| 60 to 89 Minutes | 68 | 1.8% |
| 90 or more Minutes | 144 | 3.9% |
Commute Time by Sex in Elon
The most common commute times in Elon are 20 to 24 minutes (345 commuters, 15.1%) for males and 10 to 14 minutes (356 commuters, 24.6%) for females.
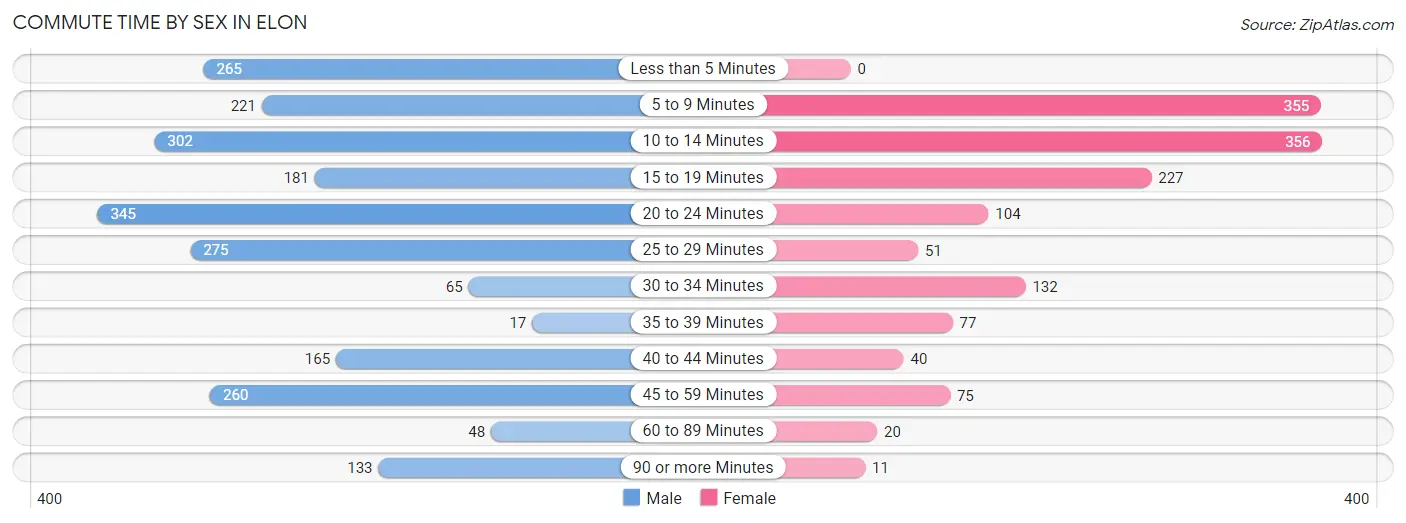
| Commute Time | Male | Female |
| Less than 5 Minutes | 265 (11.6%) | 0 (0.0%) |
| 5 to 9 Minutes | 221 (9.7%) | 355 (24.5%) |
| 10 to 14 Minutes | 302 (13.3%) | 356 (24.6%) |
| 15 to 19 Minutes | 181 (8.0%) | 227 (15.7%) |
| 20 to 24 Minutes | 345 (15.1%) | 104 (7.2%) |
| 25 to 29 Minutes | 275 (12.1%) | 51 (3.5%) |
| 30 to 34 Minutes | 65 (2.9%) | 132 (9.1%) |
| 35 to 39 Minutes | 17 (0.7%) | 77 (5.3%) |
| 40 to 44 Minutes | 165 (7.2%) | 40 (2.8%) |
| 45 to 59 Minutes | 260 (11.4%) | 75 (5.2%) |
| 60 to 89 Minutes | 48 (2.1%) | 20 (1.4%) |
| 90 or more Minutes | 133 (5.8%) | 11 (0.8%) |
Time of Departure to Work by Sex in Elon
The most frequent times of departure to work in Elon are 8:30 AM to 8:59 AM (371, 16.3%) for males and 12:00 PM to 3:59 PM (405, 28.0%) for females.
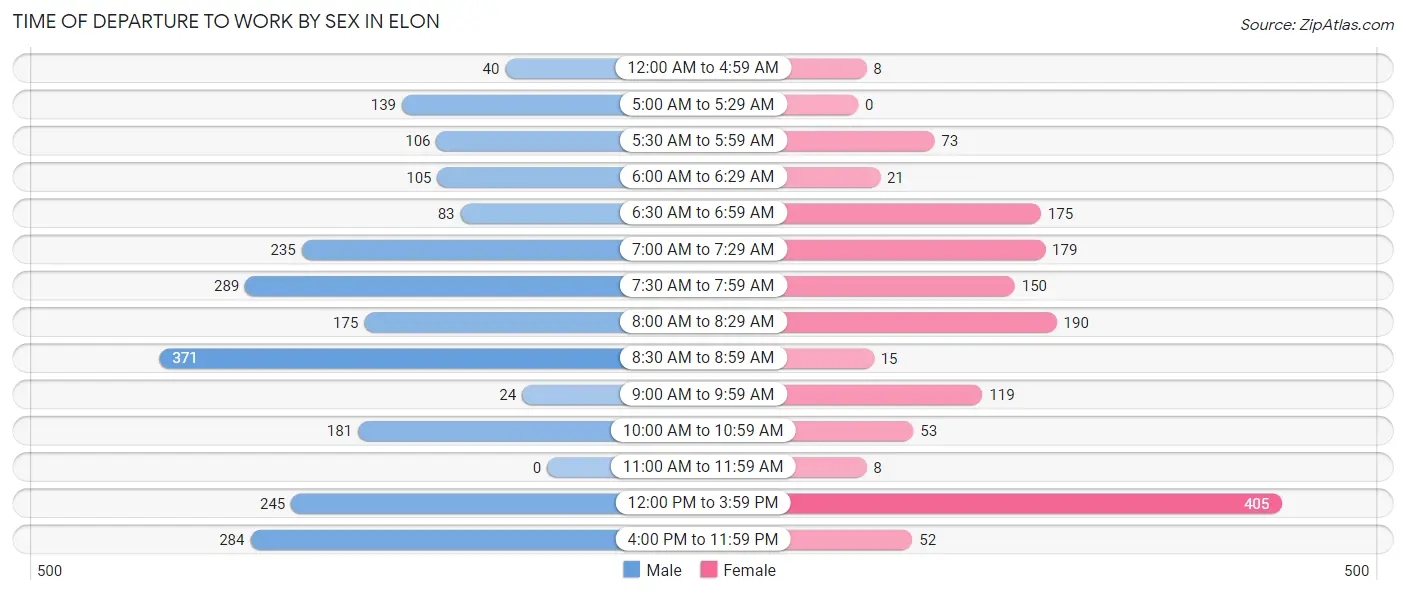
| Time of Departure | Male | Female |
| 12:00 AM to 4:59 AM | 40 (1.8%) | 8 (0.5%) |
| 5:00 AM to 5:29 AM | 139 (6.1%) | 0 (0.0%) |
| 5:30 AM to 5:59 AM | 106 (4.7%) | 73 (5.0%) |
| 6:00 AM to 6:29 AM | 105 (4.6%) | 21 (1.5%) |
| 6:30 AM to 6:59 AM | 83 (3.6%) | 175 (12.1%) |
| 7:00 AM to 7:29 AM | 235 (10.3%) | 179 (12.4%) |
| 7:30 AM to 7:59 AM | 289 (12.7%) | 150 (10.4%) |
| 8:00 AM to 8:29 AM | 175 (7.7%) | 190 (13.1%) |
| 8:30 AM to 8:59 AM | 371 (16.3%) | 15 (1.0%) |
| 9:00 AM to 9:59 AM | 24 (1.1%) | 119 (8.2%) |
| 10:00 AM to 10:59 AM | 181 (8.0%) | 53 (3.7%) |
| 11:00 AM to 11:59 AM | 0 (0.0%) | 8 (0.5%) |
| 12:00 PM to 3:59 PM | 245 (10.8%) | 405 (28.0%) |
| 4:00 PM to 11:59 PM | 284 (12.5%) | 52 (3.6%) |
| Total | 2,277 (100.0%) | 1,448 (100.0%) |
Housing Occupancy in Elon
Occupancy by Ownership in Elon
Of the total 2,949 dwellings in Elon, owner-occupied units account for 1,750 (59.3%), while renter-occupied units make up 1,199 (40.7%).
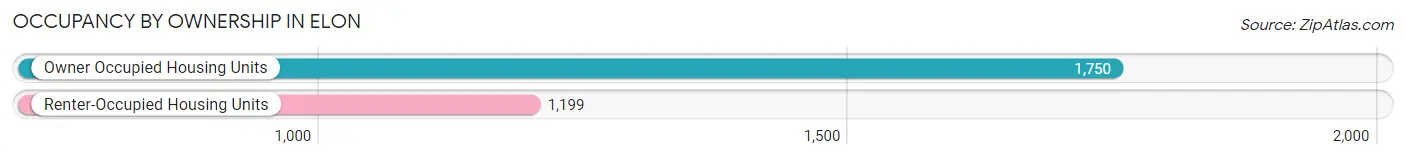
| Occupancy | # Housing Units | % Housing Units |
| Owner Occupied Housing Units | 1,750 | 59.3% |
| Renter-Occupied Housing Units | 1,199 | 40.7% |
| Total Occupied Housing Units | 2,949 | 100.0% |
Occupancy by Household Size in Elon
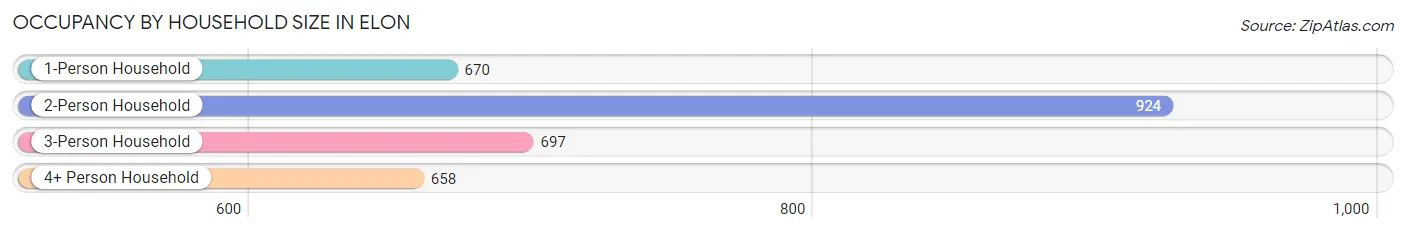
| Household Size | # Housing Units | % Housing Units |
| 1-Person Household | 670 | 22.7% |
| 2-Person Household | 924 | 31.3% |
| 3-Person Household | 697 | 23.6% |
| 4+ Person Household | 658 | 22.3% |
| Total Housing Units | 2,949 | 100.0% |
Occupancy by Ownership by Household Size in Elon
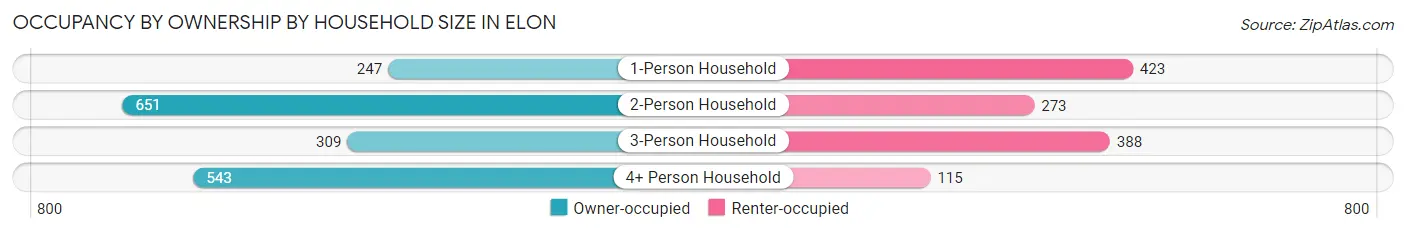
| Household Size | Owner-occupied | Renter-occupied |
| 1-Person Household | 247 (36.9%) | 423 (63.1%) |
| 2-Person Household | 651 (70.5%) | 273 (29.5%) |
| 3-Person Household | 309 (44.3%) | 388 (55.7%) |
| 4+ Person Household | 543 (82.5%) | 115 (17.5%) |
| Total Housing Units | 1,750 (59.3%) | 1,199 (40.7%) |
Occupancy by Educational Attainment in Elon
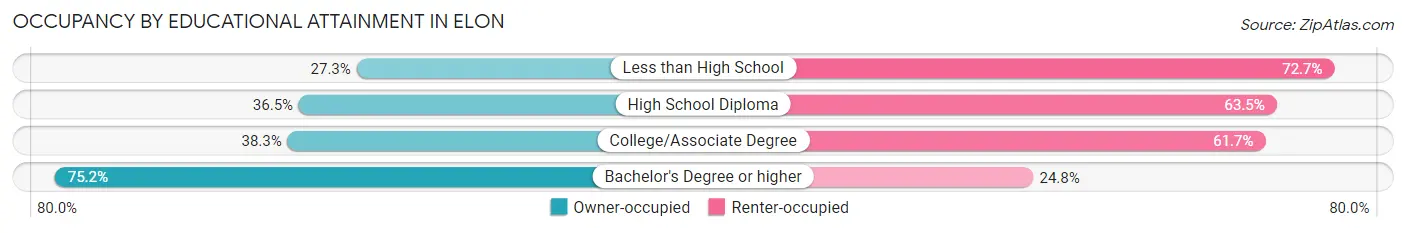
| Household Size | Owner-occupied | Renter-occupied |
| Less than High School | 38 (27.3%) | 101 (72.7%) |
| High School Diploma | 81 (36.5%) | 141 (63.5%) |
| College/Associate Degree | 327 (38.3%) | 527 (61.7%) |
| Bachelor's Degree or higher | 1,304 (75.2%) | 430 (24.8%) |
Occupancy by Age of Householder in Elon

| Age Bracket | # Households | % Households |
| Under 35 Years | 620 | 21.0% |
| 35 to 44 Years | 461 | 15.6% |
| 45 to 54 Years | 362 | 12.3% |
| 55 to 64 Years | 546 | 18.5% |
| 65 to 74 Years | 322 | 10.9% |
| 75 to 84 Years | 313 | 10.6% |
| 85 Years and Over | 325 | 11.0% |
| Total | 2,949 | 100.0% |
Housing Finances in Elon
Median Income by Occupancy in Elon
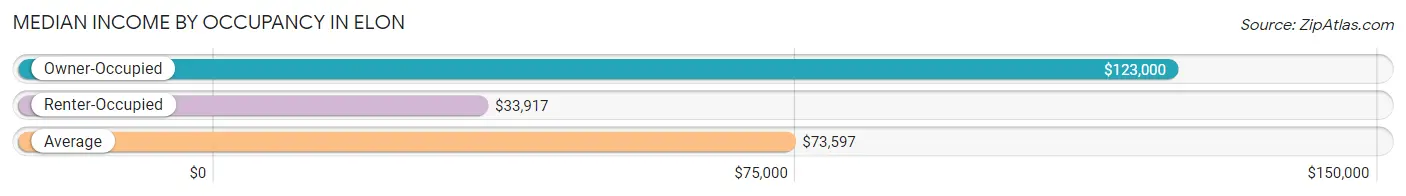
| Occupancy Type | # Households | Median Income |
| Owner-Occupied | 1,750 (59.3%) | $123,000 |
| Renter-Occupied | 1,199 (40.7%) | $33,917 |
| Average | 2,949 (100.0%) | $73,597 |
Occupancy by Householder Income Bracket in Elon
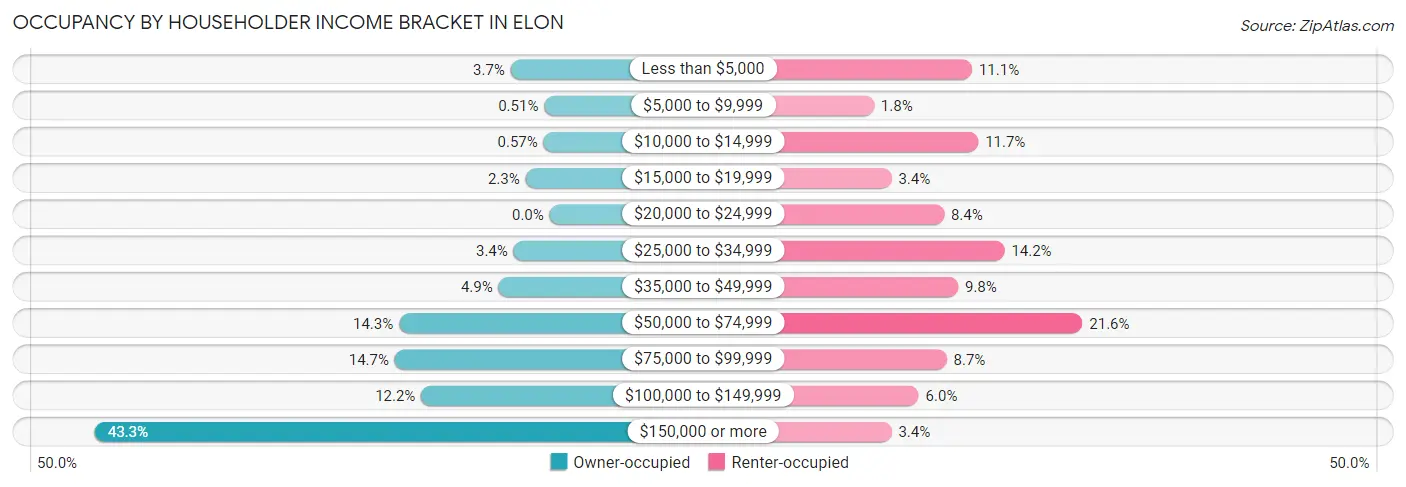
| Income Bracket | Owner-occupied | Renter-occupied |
| Less than $5,000 | 65 (3.7%) | 133 (11.1%) |
| $5,000 to $9,999 | 9 (0.5%) | 21 (1.8%) |
| $10,000 to $14,999 | 10 (0.6%) | 140 (11.7%) |
| $15,000 to $19,999 | 40 (2.3%) | 41 (3.4%) |
| $20,000 to $24,999 | 0 (0.0%) | 101 (8.4%) |
| $25,000 to $34,999 | 60 (3.4%) | 170 (14.2%) |
| $35,000 to $49,999 | 85 (4.9%) | 117 (9.8%) |
| $50,000 to $74,999 | 251 (14.3%) | 259 (21.6%) |
| $75,000 to $99,999 | 258 (14.7%) | 104 (8.7%) |
| $100,000 to $149,999 | 214 (12.2%) | 72 (6.0%) |
| $150,000 or more | 758 (43.3%) | 41 (3.4%) |
| Total | 1,750 (100.0%) | 1,199 (100.0%) |
Monthly Housing Cost Tiers in Elon
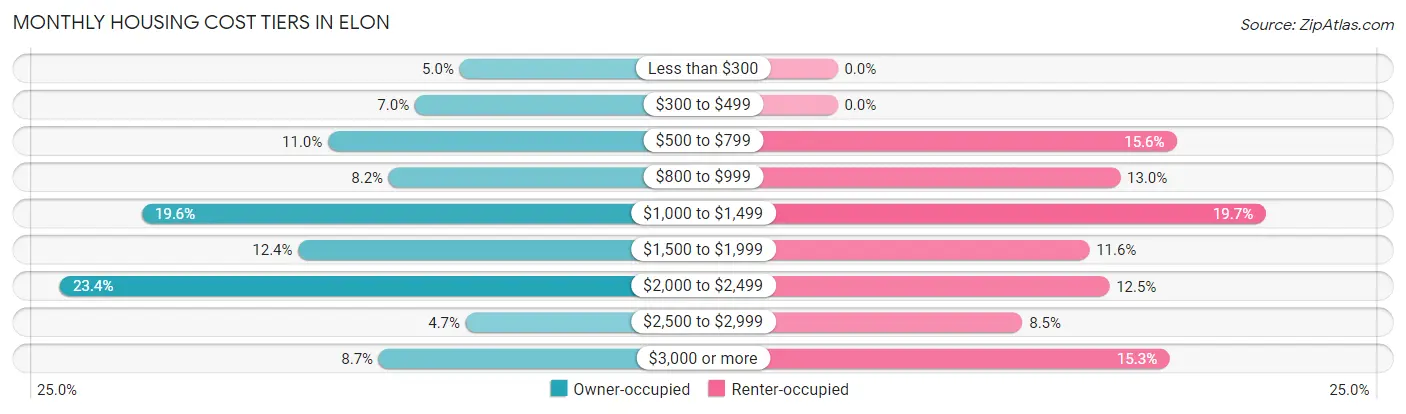
| Monthly Cost | Owner-occupied | Renter-occupied |
| Less than $300 | 87 (5.0%) | 0 (0.0%) |
| $300 to $499 | 123 (7.0%) | 0 (0.0%) |
| $500 to $799 | 193 (11.0%) | 187 (15.6%) |
| $800 to $999 | 144 (8.2%) | 156 (13.0%) |
| $1,000 to $1,499 | 343 (19.6%) | 236 (19.7%) |
| $1,500 to $1,999 | 217 (12.4%) | 139 (11.6%) |
| $2,000 to $2,499 | 409 (23.4%) | 150 (12.5%) |
| $2,500 to $2,999 | 82 (4.7%) | 102 (8.5%) |
| $3,000 or more | 152 (8.7%) | 183 (15.3%) |
| Total | 1,750 (100.0%) | 1,199 (100.0%) |
Physical Housing Characteristics in Elon
Housing Structures in Elon
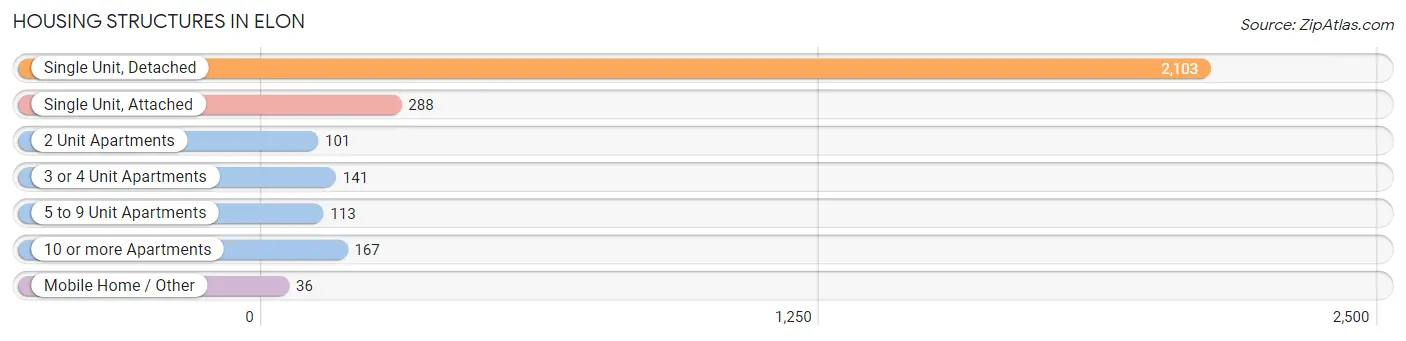
| Structure Type | # Housing Units | % Housing Units |
| Single Unit, Detached | 2,103 | 71.3% |
| Single Unit, Attached | 288 | 9.8% |
| 2 Unit Apartments | 101 | 3.4% |
| 3 or 4 Unit Apartments | 141 | 4.8% |
| 5 to 9 Unit Apartments | 113 | 3.8% |
| 10 or more Apartments | 167 | 5.7% |
| Mobile Home / Other | 36 | 1.2% |
| Total | 2,949 | 100.0% |
Housing Structures by Occupancy in Elon
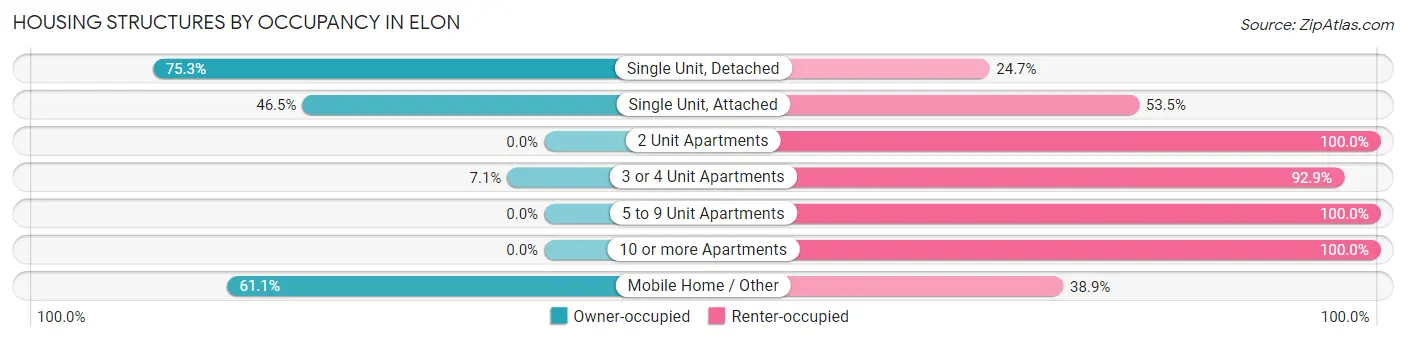
| Structure Type | Owner-occupied | Renter-occupied |
| Single Unit, Detached | 1,584 (75.3%) | 519 (24.7%) |
| Single Unit, Attached | 134 (46.5%) | 154 (53.5%) |
| 2 Unit Apartments | 0 (0.0%) | 101 (100.0%) |
| 3 or 4 Unit Apartments | 10 (7.1%) | 131 (92.9%) |
| 5 to 9 Unit Apartments | 0 (0.0%) | 113 (100.0%) |
| 10 or more Apartments | 0 (0.0%) | 167 (100.0%) |
| Mobile Home / Other | 22 (61.1%) | 14 (38.9%) |
| Total | 1,750 (59.3%) | 1,199 (40.7%) |
Housing Structures by Number of Rooms in Elon
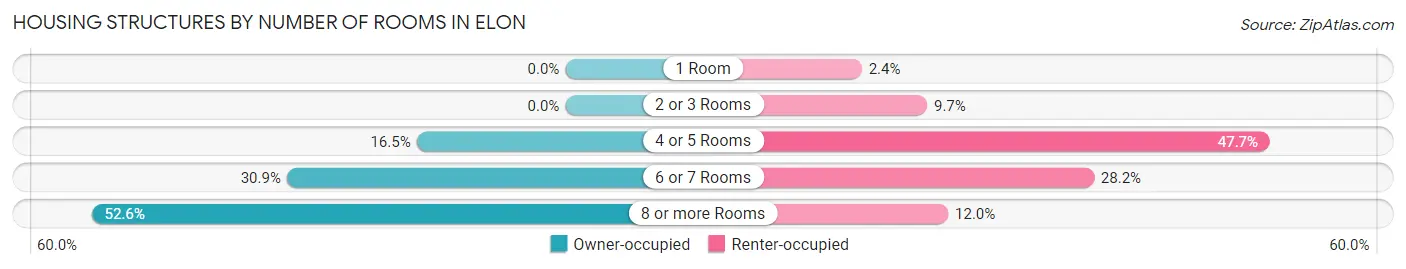
| Number of Rooms | Owner-occupied | Renter-occupied |
| 1 Room | 0 (0.0%) | 29 (2.4%) |
| 2 or 3 Rooms | 0 (0.0%) | 116 (9.7%) |
| 4 or 5 Rooms | 289 (16.5%) | 572 (47.7%) |
| 6 or 7 Rooms | 541 (30.9%) | 338 (28.2%) |
| 8 or more Rooms | 920 (52.6%) | 144 (12.0%) |
| Total | 1,750 (100.0%) | 1,199 (100.0%) |
Housing Structure by Heating Type in Elon
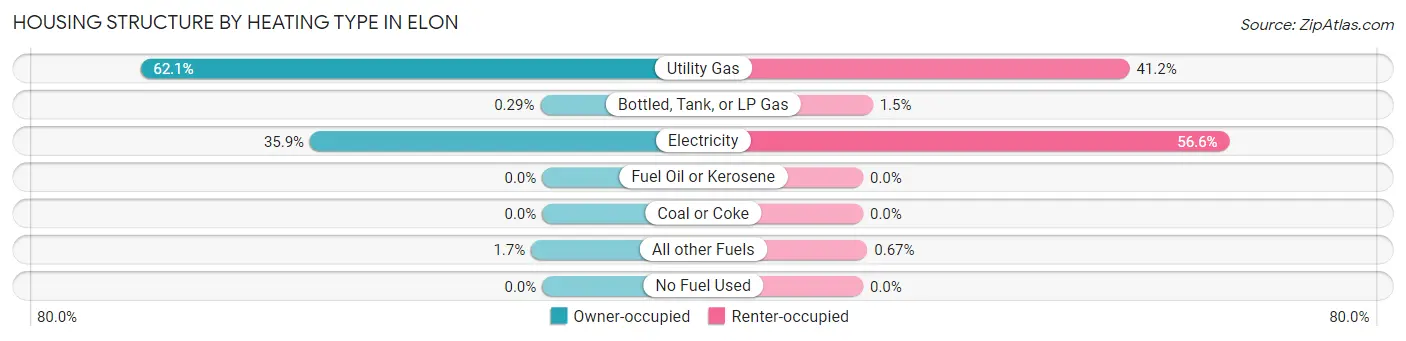
| Heating Type | Owner-occupied | Renter-occupied |
| Utility Gas | 1,087 (62.1%) | 494 (41.2%) |
| Bottled, Tank, or LP Gas | 5 (0.3%) | 18 (1.5%) |
| Electricity | 628 (35.9%) | 679 (56.6%) |
| Fuel Oil or Kerosene | 0 (0.0%) | 0 (0.0%) |
| Coal or Coke | 0 (0.0%) | 0 (0.0%) |
| All other Fuels | 30 (1.7%) | 8 (0.7%) |
| No Fuel Used | 0 (0.0%) | 0 (0.0%) |
| Total | 1,750 (100.0%) | 1,199 (100.0%) |
Household Vehicle Usage in Elon
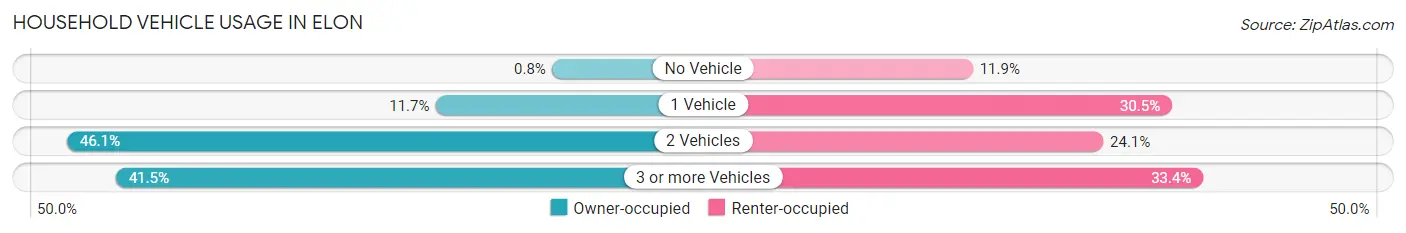
| Vehicles per Household | Owner-occupied | Renter-occupied |
| No Vehicle | 14 (0.8%) | 143 (11.9%) |
| 1 Vehicle | 204 (11.7%) | 366 (30.5%) |
| 2 Vehicles | 806 (46.1%) | 289 (24.1%) |
| 3 or more Vehicles | 726 (41.5%) | 401 (33.4%) |
| Total | 1,750 (100.0%) | 1,199 (100.0%) |
Real Estate & Mortgages in Elon
Real Estate and Mortgage Overview in Elon
| Characteristic | Without Mortgage | With Mortgage |
| Housing Units | 505 | 1,245 |
| Median Property Value | $271,200 | $352,300 |
| Median Household Income | $64,205 | $643 |
| Monthly Housing Costs | $583 | $152 |
| Real Estate Taxes | $2,255 | $67 |
Property Value by Mortgage Status in Elon
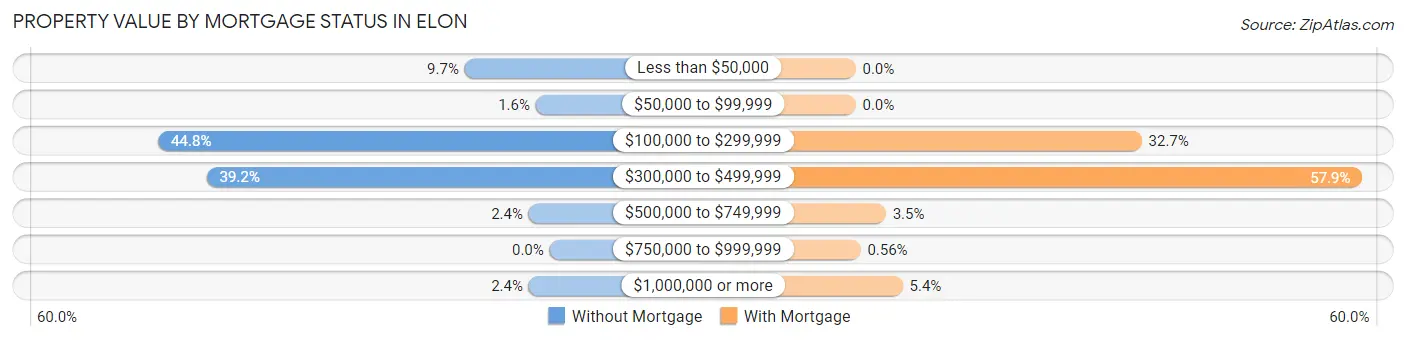
| Property Value | Without Mortgage | With Mortgage |
| Less than $50,000 | 49 (9.7%) | 0 (0.0%) |
| $50,000 to $99,999 | 8 (1.6%) | 0 (0.0%) |
| $100,000 to $299,999 | 226 (44.8%) | 407 (32.7%) |
| $300,000 to $499,999 | 198 (39.2%) | 721 (57.9%) |
| $500,000 to $749,999 | 12 (2.4%) | 43 (3.5%) |
| $750,000 to $999,999 | 0 (0.0%) | 7 (0.6%) |
| $1,000,000 or more | 12 (2.4%) | 67 (5.4%) |
| Total | 505 (100.0%) | 1,245 (100.0%) |
Household Income by Mortgage Status in Elon
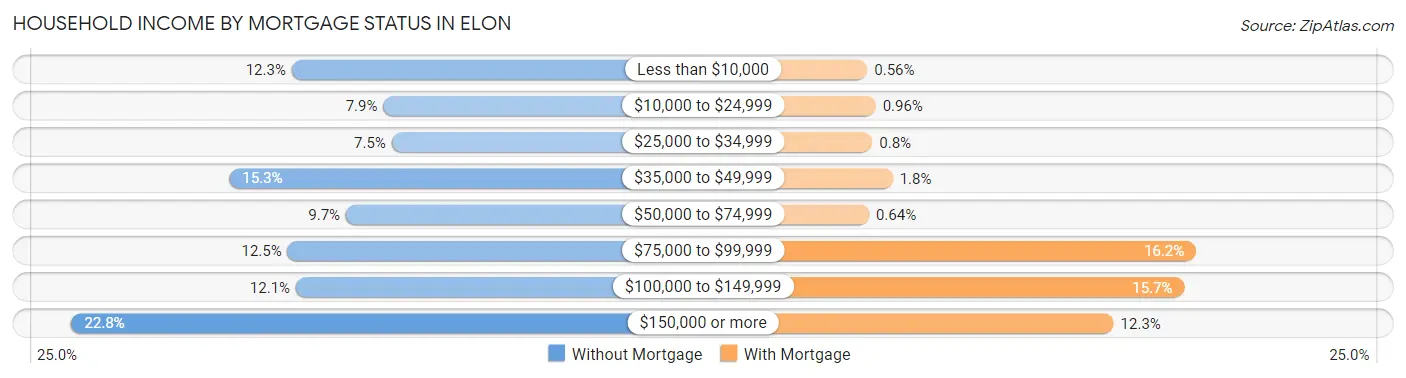
| Household Income | Without Mortgage | With Mortgage |
| Less than $10,000 | 62 (12.3%) | 7 (0.6%) |
| $10,000 to $24,999 | 40 (7.9%) | 12 (1.0%) |
| $25,000 to $34,999 | 38 (7.5%) | 10 (0.8%) |
| $35,000 to $49,999 | 77 (15.2%) | 22 (1.8%) |
| $50,000 to $74,999 | 49 (9.7%) | 8 (0.6%) |
| $75,000 to $99,999 | 63 (12.5%) | 202 (16.2%) |
| $100,000 to $149,999 | 61 (12.1%) | 195 (15.7%) |
| $150,000 or more | 115 (22.8%) | 153 (12.3%) |
| Total | 505 (100.0%) | 1,245 (100.0%) |
Property Value to Household Income Ratio in Elon
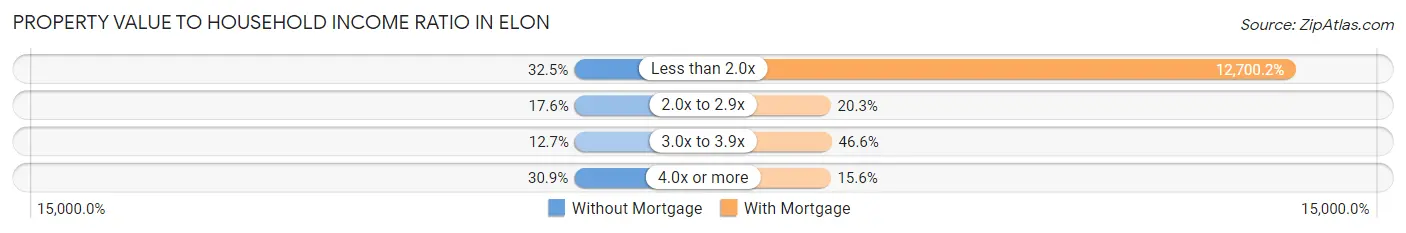
| Value-to-Income Ratio | Without Mortgage | With Mortgage |
| Less than 2.0x | 164 (32.5%) | 158,117 (12,700.2%) |
| 2.0x to 2.9x | 89 (17.6%) | 253 (20.3%) |
| 3.0x to 3.9x | 64 (12.7%) | 580 (46.6%) |
| 4.0x or more | 156 (30.9%) | 194 (15.6%) |
| Total | 505 (100.0%) | 1,245 (100.0%) |
Real Estate Taxes by Mortgage Status in Elon
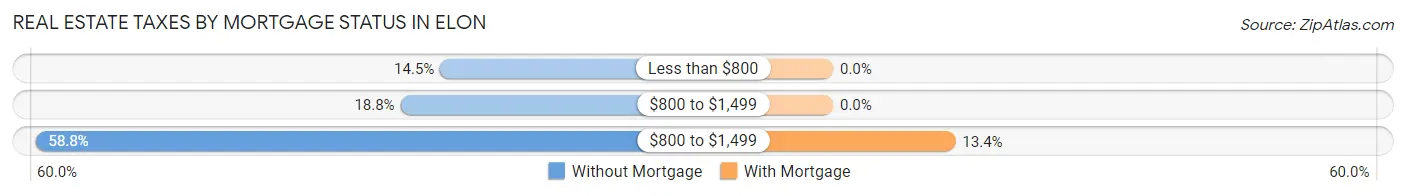
| Property Taxes | Without Mortgage | With Mortgage |
| Less than $800 | 73 (14.5%) | 0 (0.0%) |
| $800 to $1,499 | 95 (18.8%) | 0 (0.0%) |
| $800 to $1,499 | 297 (58.8%) | 167 (13.4%) |
| Total | 505 (100.0%) | 1,245 (100.0%) |
Health & Disability in Elon
Health Insurance Coverage by Age in Elon
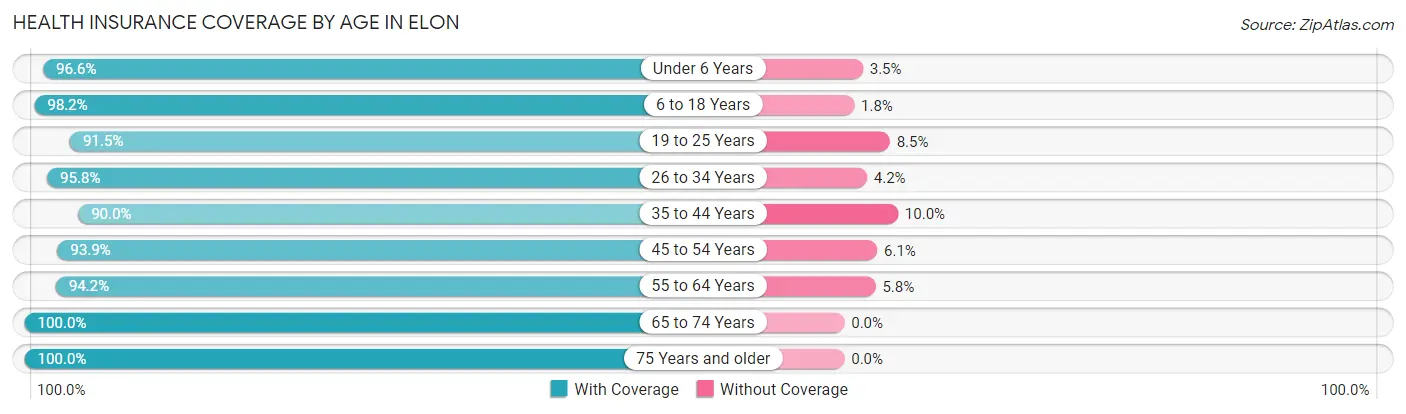
| Age Bracket | With Coverage | Without Coverage |
| Under 6 Years | 364 (96.6%) | 13 (3.5%) |
| 6 to 18 Years | 1,936 (98.2%) | 36 (1.8%) |
| 19 to 25 Years | 3,890 (91.5%) | 360 (8.5%) |
| 26 to 34 Years | 319 (95.8%) | 14 (4.2%) |
| 35 to 44 Years | 873 (90.0%) | 97 (10.0%) |
| 45 to 54 Years | 660 (93.9%) | 43 (6.1%) |
| 55 to 64 Years | 954 (94.2%) | 59 (5.8%) |
| 65 to 74 Years | 498 (100.0%) | 0 (0.0%) |
| 75 Years and older | 898 (100.0%) | 0 (0.0%) |
| Total | 10,392 (94.4%) | 622 (5.7%) |
Health Insurance Coverage by Citizenship Status in Elon
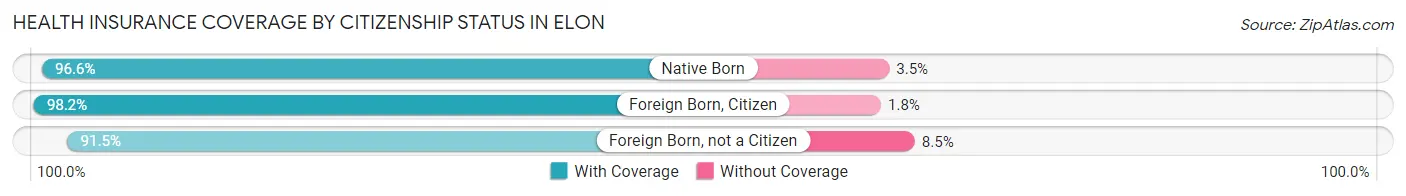
| Citizenship Status | With Coverage | Without Coverage |
| Native Born | 364 (96.6%) | 13 (3.5%) |
| Foreign Born, Citizen | 1,936 (98.2%) | 36 (1.8%) |
| Foreign Born, not a Citizen | 3,890 (91.5%) | 360 (8.5%) |
Health Insurance Coverage by Household Income in Elon
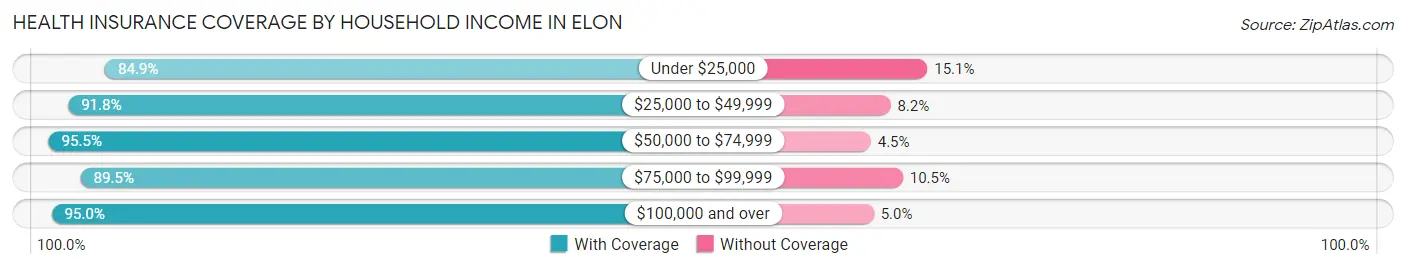
| Household Income | With Coverage | Without Coverage |
| Under $25,000 | 1,125 (84.9%) | 200 (15.1%) |
| $25,000 to $49,999 | 954 (91.8%) | 85 (8.2%) |
| $50,000 to $74,999 | 1,296 (95.5%) | 61 (4.5%) |
| $75,000 to $99,999 | 717 (89.5%) | 84 (10.5%) |
| $100,000 and over | 2,940 (95.0%) | 156 (5.0%) |
Public vs Private Health Insurance Coverage by Age in Elon
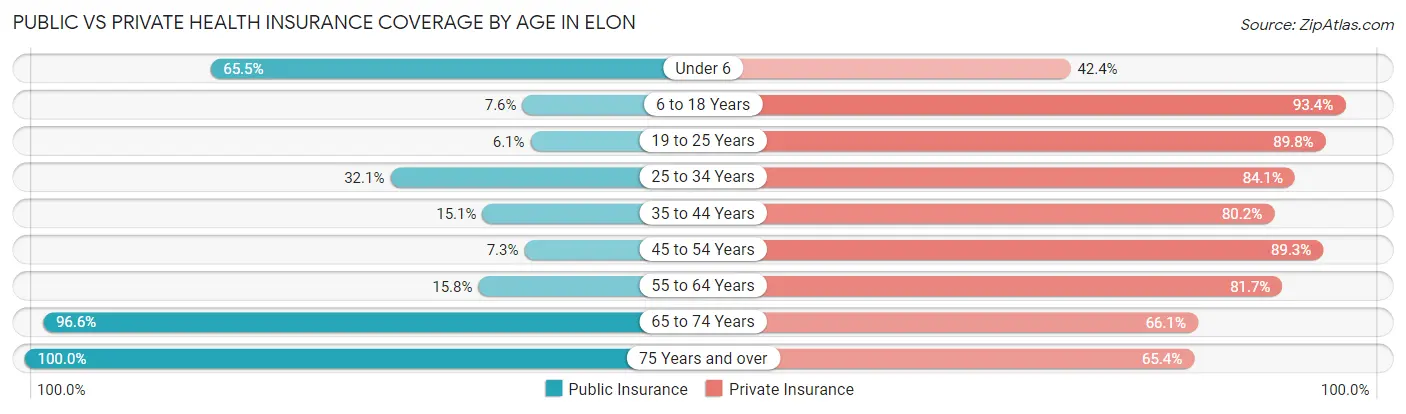
| Age Bracket | Public Insurance | Private Insurance |
| Under 6 | 247 (65.5%) | 160 (42.4%) |
| 6 to 18 Years | 150 (7.6%) | 1,842 (93.4%) |
| 19 to 25 Years | 260 (6.1%) | 3,815 (89.8%) |
| 25 to 34 Years | 107 (32.1%) | 280 (84.1%) |
| 35 to 44 Years | 146 (15.0%) | 778 (80.2%) |
| 45 to 54 Years | 51 (7.2%) | 628 (89.3%) |
| 55 to 64 Years | 160 (15.8%) | 828 (81.7%) |
| 65 to 74 Years | 481 (96.6%) | 329 (66.1%) |
| 75 Years and over | 898 (100.0%) | 587 (65.4%) |
| Total | 2,500 (22.7%) | 9,247 (84.0%) |
Disability Status by Sex by Age in Elon
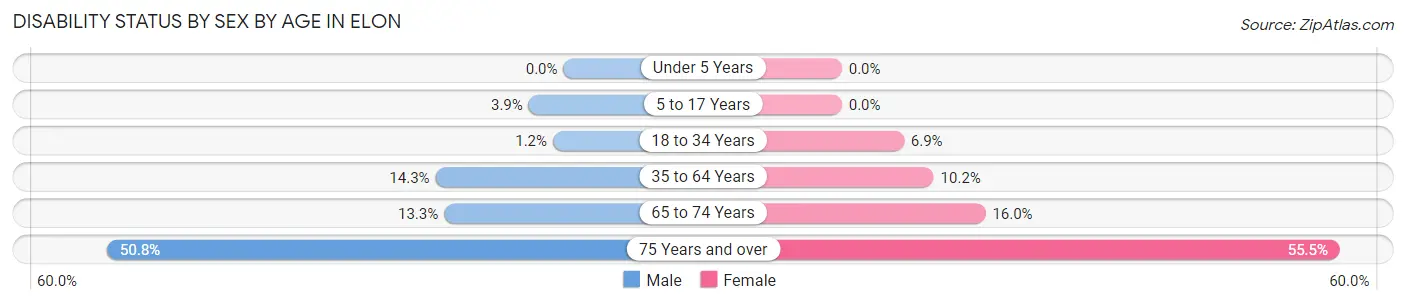
| Age Bracket | Male | Female |
| Under 5 Years | 0 (0.0%) | 0 (0.0%) |
| 5 to 17 Years | 16 (3.9%) | 0 (0.0%) |
| 18 to 34 Years | 32 (1.2%) | 203 (6.9%) |
| 35 to 64 Years | 192 (14.2%) | 137 (10.2%) |
| 65 to 74 Years | 23 (13.3%) | 52 (16.0%) |
| 75 Years and over | 154 (50.8%) | 330 (55.5%) |
Disability Class by Sex by Age in Elon
Disability Class: Hearing Difficulty
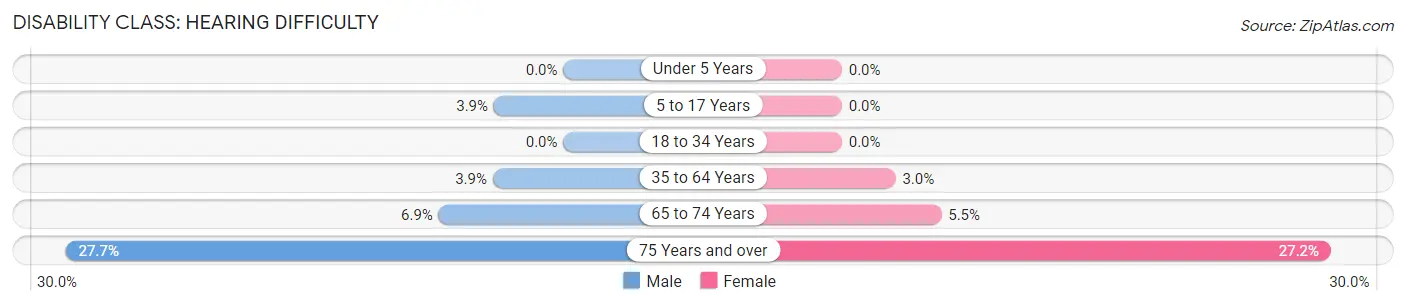
| Age Bracket | Male | Female |
| Under 5 Years | 0 (0.0%) | 0 (0.0%) |
| 5 to 17 Years | 16 (3.9%) | 0 (0.0%) |
| 18 to 34 Years | 0 (0.0%) | 0 (0.0%) |
| 35 to 64 Years | 53 (3.9%) | 40 (3.0%) |
| 65 to 74 Years | 12 (6.9%) | 18 (5.5%) |
| 75 Years and over | 84 (27.7%) | 162 (27.2%) |
Disability Class: Vision Difficulty
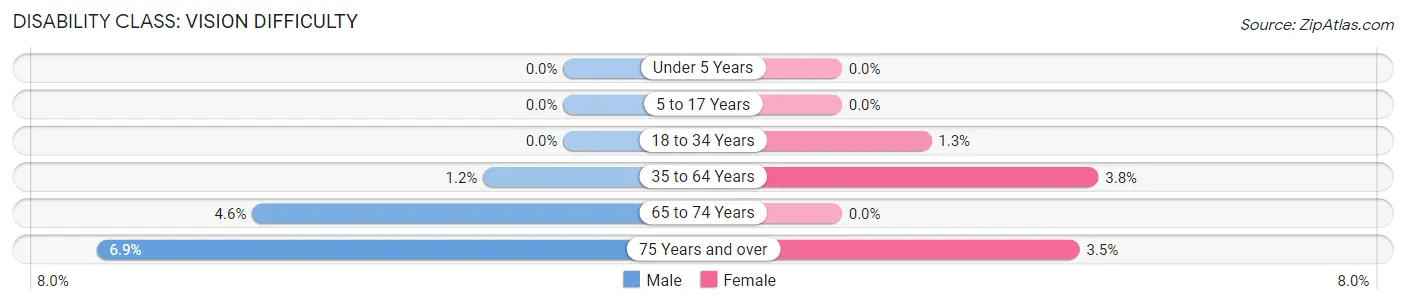
| Age Bracket | Male | Female |
| Under 5 Years | 0 (0.0%) | 0 (0.0%) |
| 5 to 17 Years | 0 (0.0%) | 0 (0.0%) |
| 18 to 34 Years | 0 (0.0%) | 39 (1.3%) |
| 35 to 64 Years | 16 (1.2%) | 51 (3.8%) |
| 65 to 74 Years | 8 (4.6%) | 0 (0.0%) |
| 75 Years and over | 21 (6.9%) | 21 (3.5%) |
Disability Class: Cognitive Difficulty
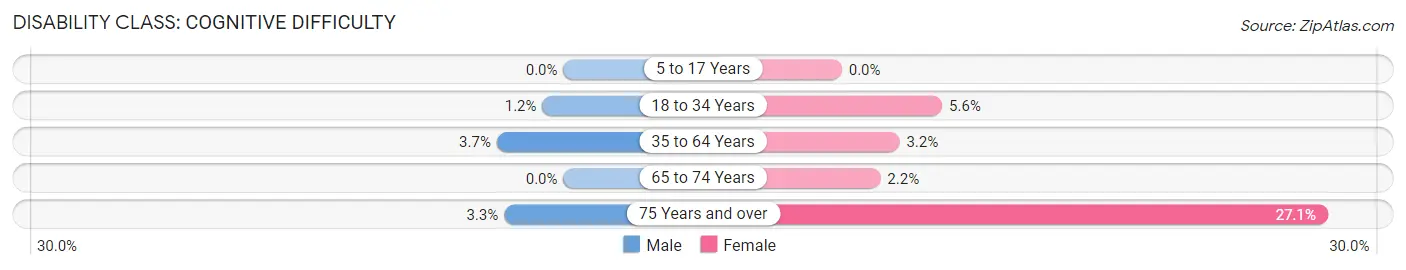
| Age Bracket | Male | Female |
| 5 to 17 Years | 0 (0.0%) | 0 (0.0%) |
| 18 to 34 Years | 32 (1.2%) | 164 (5.6%) |
| 35 to 64 Years | 50 (3.7%) | 43 (3.2%) |
| 65 to 74 Years | 0 (0.0%) | 7 (2.1%) |
| 75 Years and over | 10 (3.3%) | 161 (27.1%) |
Disability Class: Ambulatory Difficulty
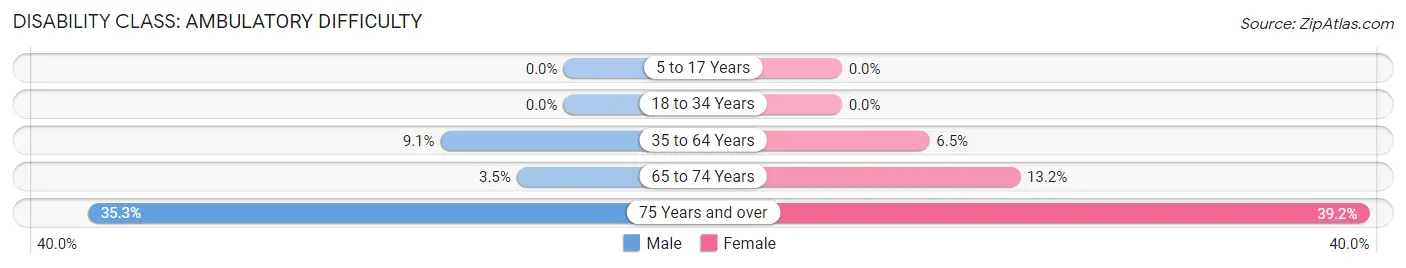
| Age Bracket | Male | Female |
| 5 to 17 Years | 0 (0.0%) | 0 (0.0%) |
| 18 to 34 Years | 0 (0.0%) | 0 (0.0%) |
| 35 to 64 Years | 123 (9.1%) | 87 (6.5%) |
| 65 to 74 Years | 6 (3.5%) | 43 (13.2%) |
| 75 Years and over | 107 (35.3%) | 233 (39.2%) |
Disability Class: Self-Care Difficulty
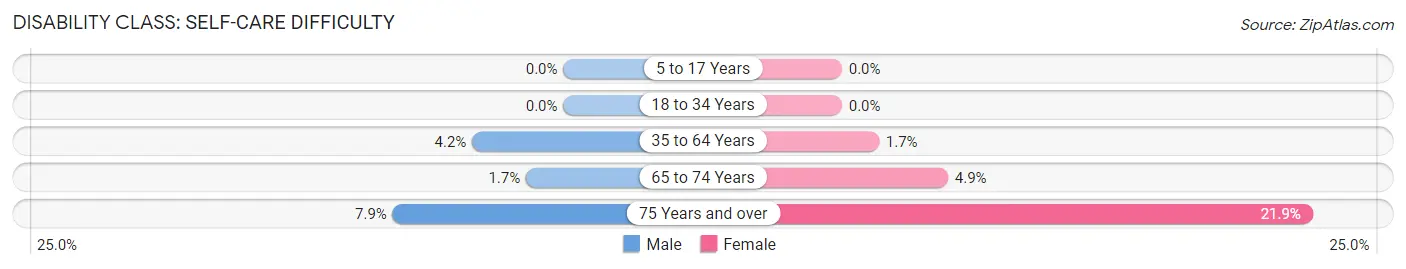
| Age Bracket | Male | Female |
| 5 to 17 Years | 0 (0.0%) | 0 (0.0%) |
| 18 to 34 Years | 0 (0.0%) | 0 (0.0%) |
| 35 to 64 Years | 57 (4.2%) | 23 (1.7%) |
| 65 to 74 Years | 3 (1.7%) | 16 (4.9%) |
| 75 Years and over | 24 (7.9%) | 130 (21.8%) |
Technology Access in Elon
Computing Device Access in Elon
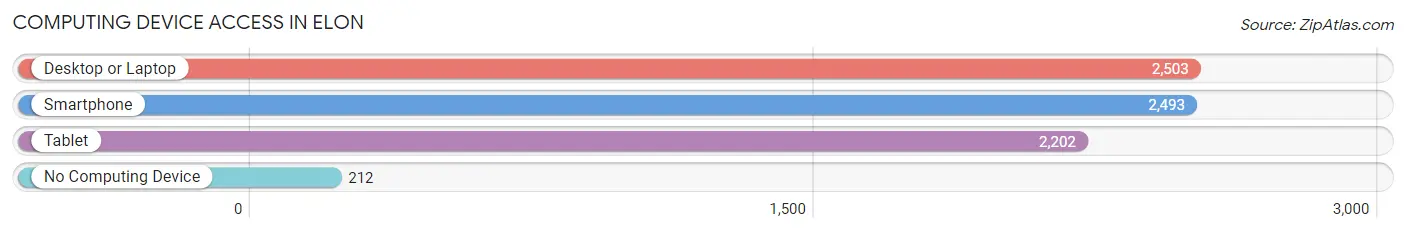
| Device Type | # Households | % Households |
| Desktop or Laptop | 2,503 | 84.9% |
| Smartphone | 2,493 | 84.5% |
| Tablet | 2,202 | 74.7% |
| No Computing Device | 212 | 7.2% |
| Total | 2,949 | 100.0% |
Internet Access in Elon
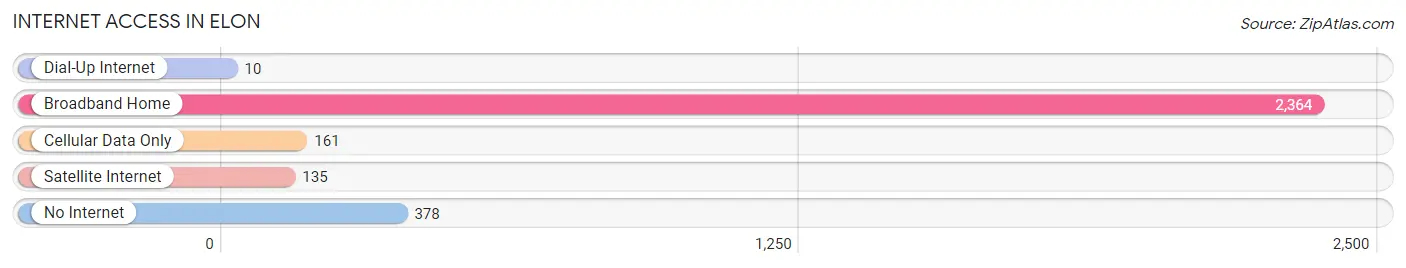
| Internet Type | # Households | % Households |
| Dial-Up Internet | 10 | 0.3% |
| Broadband Home | 2,364 | 80.2% |
| Cellular Data Only | 161 | 5.5% |
| Satellite Internet | 135 | 4.6% |
| No Internet | 378 | 12.8% |
| Total | 2,949 | 100.0% |
Elon Summary
Elon, North Carolina is a small town located in Alamance County, North Carolina. It is situated in the Piedmont region of the state, approximately halfway between Greensboro and Burlington. The town was founded in 1881 and was named after the Elon College, which was established in 1889. The town has a population of approximately 9,000 people and is home to Elon University, a private liberal arts college.
Geography
Elon is located in the Piedmont region of North Carolina, approximately halfway between Greensboro and Burlington. The town is situated on the banks of the Haw River, which flows through the town and is a major source of recreation for the area. The town is surrounded by rolling hills and is located in the foothills of the Blue Ridge Mountains. The town is located at an elevation of approximately 800 feet above sea level.
Economy
The economy of Elon is largely based on the presence of Elon University. The university is the largest employer in the town and provides jobs for many of the residents. Other major employers in the town include the Alamance Regional Medical Center, the Alamance-Burlington School System, and the Burlington Industries. The town also has a number of small businesses, including restaurants, retail stores, and professional services.
Demographics
As of the 2010 census, the population of Elon was 8,935. The racial makeup of the town was 79.3% White, 14.2% African American, 0.3% Native American, 2.7% Asian, 0.1% Pacific Islander, and 3.4% from other races. The median household income was $45,945, and the median family income was $58,958. The per capita income was $22,945.
History
Elon was founded in 1881 and was named after the Elon College, which was established in 1889. The college was founded by the Christian Church (Disciples of Christ) and was the first college in the state to be founded by the church. The college was closed in 1973 due to financial difficulties, but the town of Elon continued to grow and prosper. In the late 20th century, the town experienced a period of rapid growth due to the presence of Elon University. The university has become a major economic force in the town and has helped to attract new businesses and residents to the area.
Common Questions
What is Per Capita Income in Elon?
Per Capita income in Elon is $28,817.
What is the Median Family Income in Elon?
Median Family Income in Elon is $122,772.
What is the Median Household income in Elon?
Median Household Income in Elon is $73,597.
What is Income or Wage Gap in Elon?
Income or Wage Gap in Elon is 54.7%.
Women in Elon earn 45.3 cents for every dollar earned by a man.
What is Inequality or Gini Index in Elon?
Inequality or Gini Index in Elon is 0.49.
What is the Total Population of Elon?
Total Population of Elon is 11,161.
What is the Total Male Population of Elon?
Total Male Population of Elon is 5,107.
What is the Total Female Population of Elon?
Total Female Population of Elon is 6,054.
What is the Ratio of Males per 100 Females in Elon?
There are 84.36 Males per 100 Females in Elon.
What is the Ratio of Females per 100 Males in Elon?
There are 118.54 Females per 100 Males in Elon.
What is the Median Population Age in Elon?
Median Population Age in Elon is 22.1 Years.
What is the Average Family Size in Elon
Average Family Size in Elon is 2.9 People.
What is the Average Household Size in Elon
Average Household Size in Elon is 2.6 People.
How Large is the Labor Force in Elon?
There are 4,650 People in the Labor Forcein in Elon.
What is the Percentage of People in the Labor Force in Elon?
45.4% of People are in the Labor Force in Elon.
What is the Unemployment Rate in Elon?
Unemployment Rate in Elon is 3.9%.