High Shoals, NC Map & Demographics
High Shoals Map
High Shoals Overview
$21,706
PER CAPITA INCOME
$58,152
AVG FAMILY INCOME
$47,857
AVG HOUSEHOLD INCOME
47.0%
WAGE / INCOME GAP [ % ]
53.0¢/ $1
WAGE / INCOME GAP [ $ ]
0.45
INEQUALITY / GINI INDEX
675
TOTAL POPULATION
354
MALE POPULATION
321
FEMALE POPULATION
110.28
MALES / 100 FEMALES
90.68
FEMALES / 100 MALES
30.5
MEDIAN AGE
3.1
AVG FAMILY SIZE
2.8
AVG HOUSEHOLD SIZE
260
LABOR FORCE [ PEOPLE ]
59.0%
PERCENT IN LABOR FORCE
3.1%
UNEMPLOYMENT RATE
High Shoals Zip Codes
High Shoals Area Codes
Income in High Shoals
Income Overview in High Shoals
Per Capita Income in High Shoals is $21,706, while median incomes of families and households are $58,152 and $47,857 respectively.
| Characteristic | Number | Measure |
| Per Capita Income | 675 | $21,706 |
| Median Family Income | 198 | $58,152 |
| Mean Family Income | 198 | $61,156 |
| Median Household Income | 244 | $47,857 |
| Mean Household Income | 244 | $56,942 |
| Income Deficit | 198 | $0 |
| Wage / Income Gap (%) | 675 | 46.98% |
| Wage / Income Gap ($) | 675 | 53.02¢ per $1 |
| Gini / Inequality Index | 675 | 0.45 |
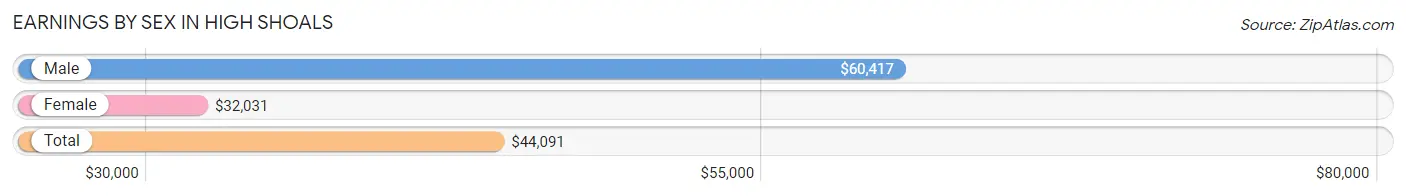
Earnings by Sex in High Shoals
Average Earnings in High Shoals are $44,091, $60,417 for men and $32,031 for women, a difference of 47.0%.
| Sex | Number | Average Earnings |
| Male | 125 (49.2%) | $60,417 |
| Female | 129 (50.8%) | $32,031 |
| Total | 254 (100.0%) | $44,091 |
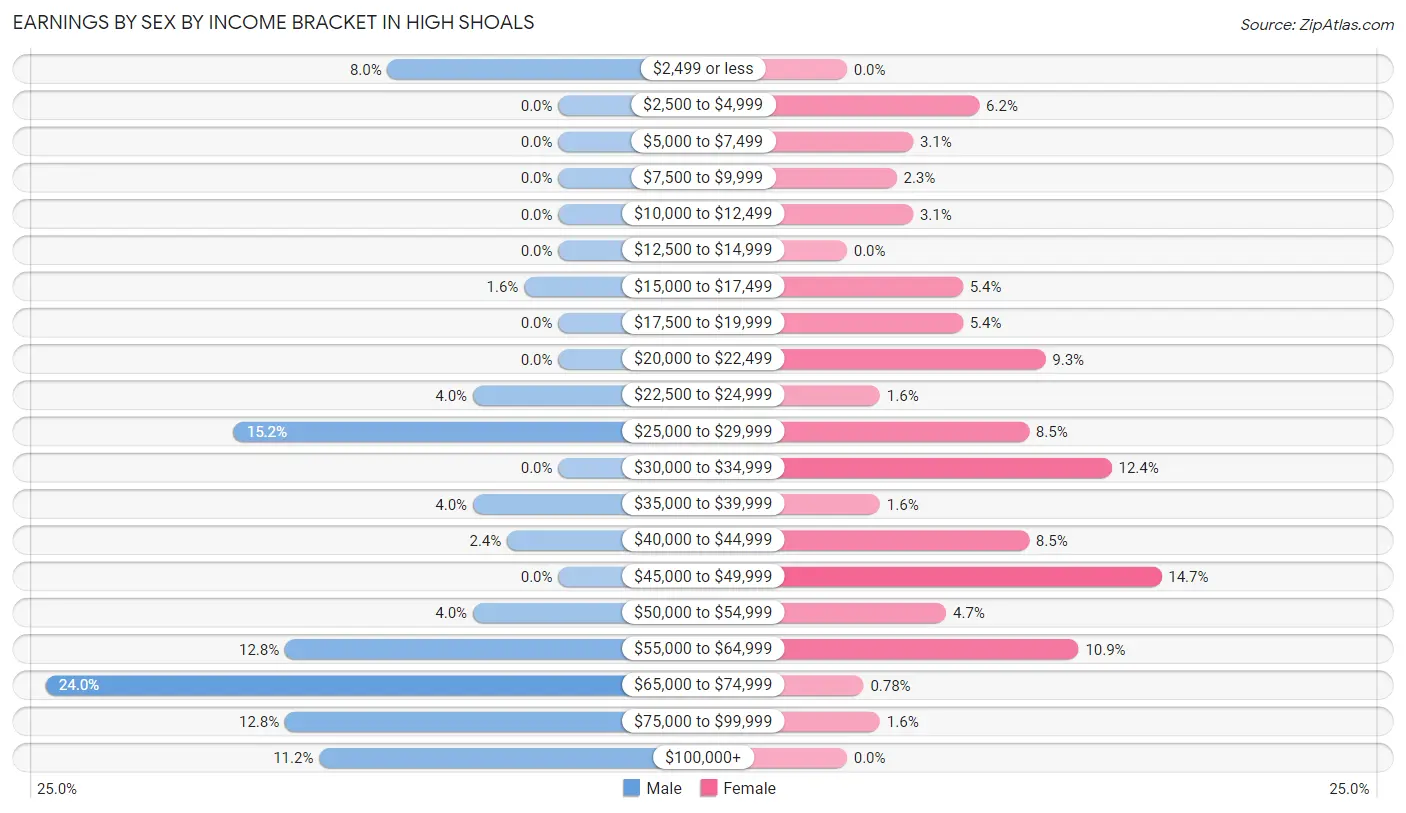
Earnings by Sex by Income Bracket in High Shoals
The most common earnings brackets in High Shoals are $65,000 to $74,999 for men (30 | 24.0%) and $45,000 to $49,999 for women (19 | 14.7%).
| Income | Male | Female |
| $2,499 or less | 10 (8.0%) | 0 (0.0%) |
| $2,500 to $4,999 | 0 (0.0%) | 8 (6.2%) |
| $5,000 to $7,499 | 0 (0.0%) | 4 (3.1%) |
| $7,500 to $9,999 | 0 (0.0%) | 3 (2.3%) |
| $10,000 to $12,499 | 0 (0.0%) | 4 (3.1%) |
| $12,500 to $14,999 | 0 (0.0%) | 0 (0.0%) |
| $15,000 to $17,499 | 2 (1.6%) | 7 (5.4%) |
| $17,500 to $19,999 | 0 (0.0%) | 7 (5.4%) |
| $20,000 to $22,499 | 0 (0.0%) | 12 (9.3%) |
| $22,500 to $24,999 | 5 (4.0%) | 2 (1.5%) |
| $25,000 to $29,999 | 19 (15.2%) | 11 (8.5%) |
| $30,000 to $34,999 | 0 (0.0%) | 16 (12.4%) |
| $35,000 to $39,999 | 5 (4.0%) | 2 (1.5%) |
| $40,000 to $44,999 | 3 (2.4%) | 11 (8.5%) |
| $45,000 to $49,999 | 0 (0.0%) | 19 (14.7%) |
| $50,000 to $54,999 | 5 (4.0%) | 6 (4.6%) |
| $55,000 to $64,999 | 16 (12.8%) | 14 (10.8%) |
| $65,000 to $74,999 | 30 (24.0%) | 1 (0.8%) |
| $75,000 to $99,999 | 16 (12.8%) | 2 (1.5%) |
| $100,000+ | 14 (11.2%) | 0 (0.0%) |
| Total | 125 (100.0%) | 129 (100.0%) |
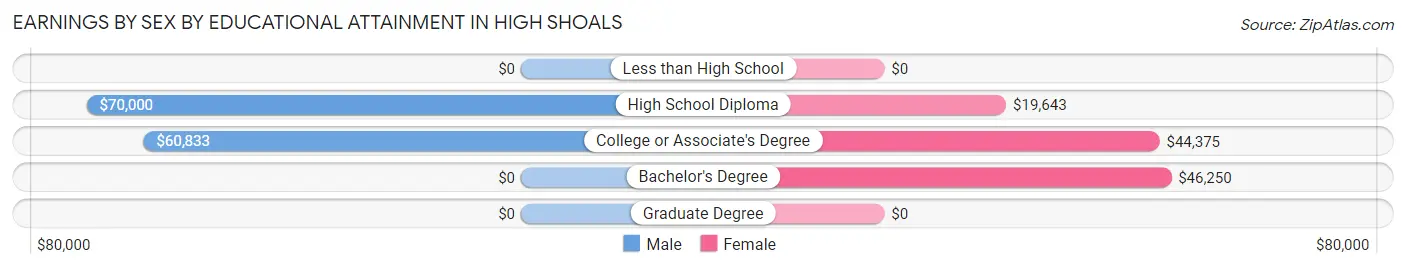
Earnings by Sex by Educational Attainment in High Shoals
Average earnings in High Shoals are $68,125 for men and $35,625 for women, a difference of 47.7%. Men with an educational attainment of high school diploma enjoy the highest average annual earnings of $70,000, while those with college or associate's degree education earn the least with $60,833. Women with an educational attainment of bachelor's degree earn the most with the average annual earnings of $46,250, while those with high school diploma education have the smallest earnings of $19,643.
| Educational Attainment | Male Income | Female Income |
| Less than High School | - | - |
| High School Diploma | $70,000 | $19,643 |
| College or Associate's Degree | $60,833 | $44,375 |
| Bachelor's Degree | - | - |
| Graduate Degree | - | - |
| Total | $68,125 | $35,625 |
Family Income in High Shoals
Family Income Brackets in High Shoals
According to the High Shoals family income data, there are 49 families falling into the $25,000 to $34,999 income range, which is the most common income bracket and makes up 24.7% of all families.
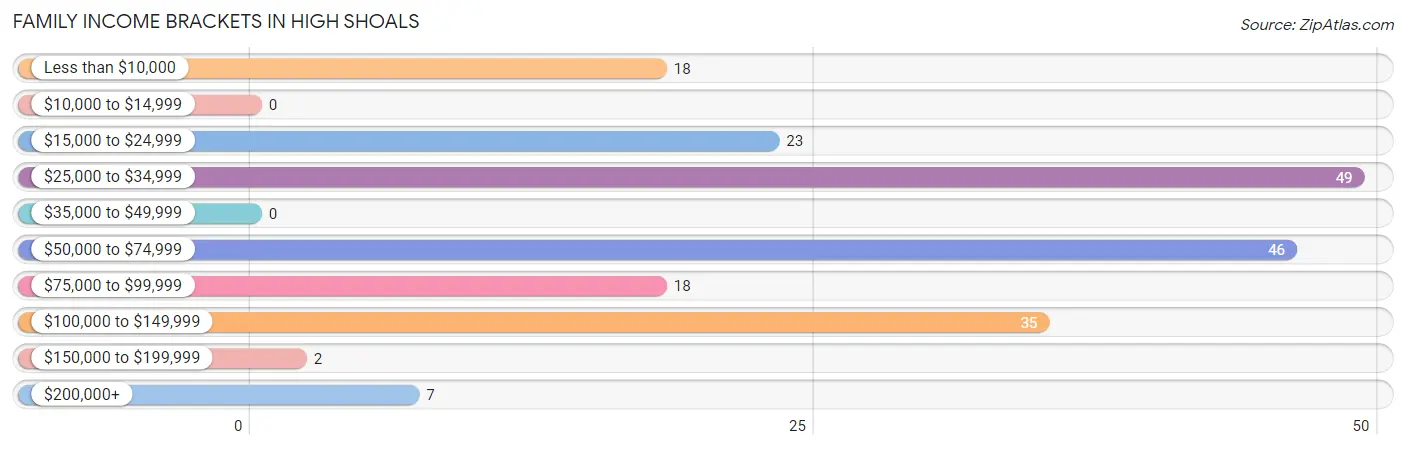
| Income Bracket | # Families | % Families |
| Less than $10,000 | 18 | 9.1% |
| $10,000 to $14,999 | 0 | 0.0% |
| $15,000 to $24,999 | 23 | 11.6% |
| $25,000 to $34,999 | 49 | 24.7% |
| $35,000 to $49,999 | 0 | 0.0% |
| $50,000 to $74,999 | 46 | 23.2% |
| $75,000 to $99,999 | 18 | 9.1% |
| $100,000 to $149,999 | 35 | 17.7% |
| $150,000 to $199,999 | 2 | 1.0% |
| $200,000+ | 7 | 3.5% |
Family Income by Famaliy Size in High Shoals
2-person families (85 | 42.9%) account for the highest median family income in High Shoals with $68,750 per family, while 2-person families (85 | 42.9%) have the highest median income of $34,375 per family member.
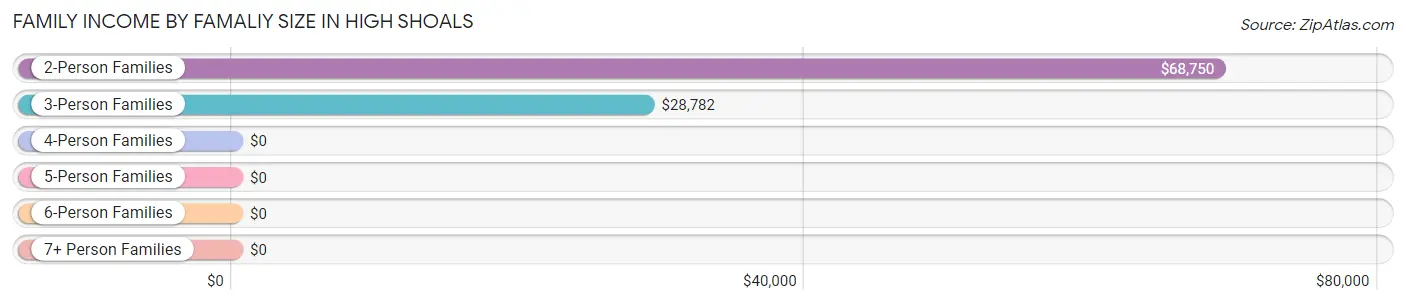
| Income Bracket | # Families | Median Income |
| 2-Person Families | 85 (42.9%) | $68,750 |
| 3-Person Families | 80 (40.4%) | $28,782 |
| 4-Person Families | 5 (2.5%) | $0 |
| 5-Person Families | 6 (3.0%) | $0 |
| 6-Person Families | 10 (5.1%) | $0 |
| 7+ Person Families | 12 (6.1%) | $0 |
| Total | 198 (100.0%) | $58,152 |
Family Income by Number of Earners in High Shoals
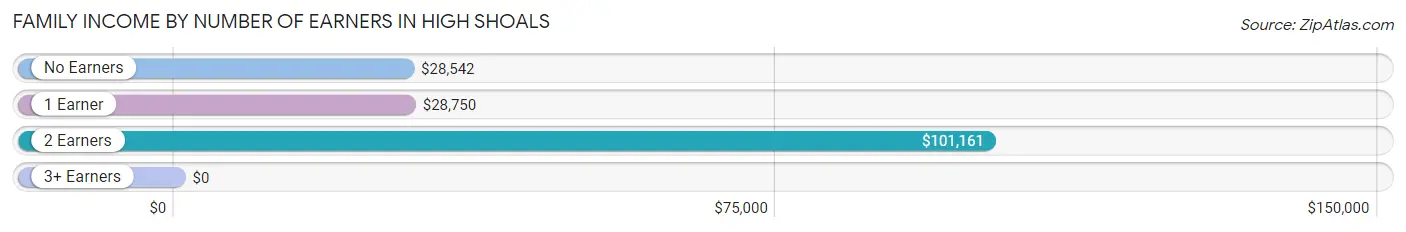
| Number of Earners | # Families | Median Income |
| No Earners | 57 (28.8%) | $28,542 |
| 1 Earner | 75 (37.9%) | $28,750 |
| 2 Earners | 63 (31.8%) | $101,161 |
| 3+ Earners | 3 (1.5%) | $0 |
| Total | 198 (100.0%) | $58,152 |
Household Income in High Shoals
Household Income Brackets in High Shoals
With 51 households falling in the category, the $25,000 to $34,999 income range is the most frequent in High Shoals, accounting for 20.9% of all households. In contrast, only 2 households (0.8%) fall into the $150,000 to $199,999 income bracket, making it the least populous group.
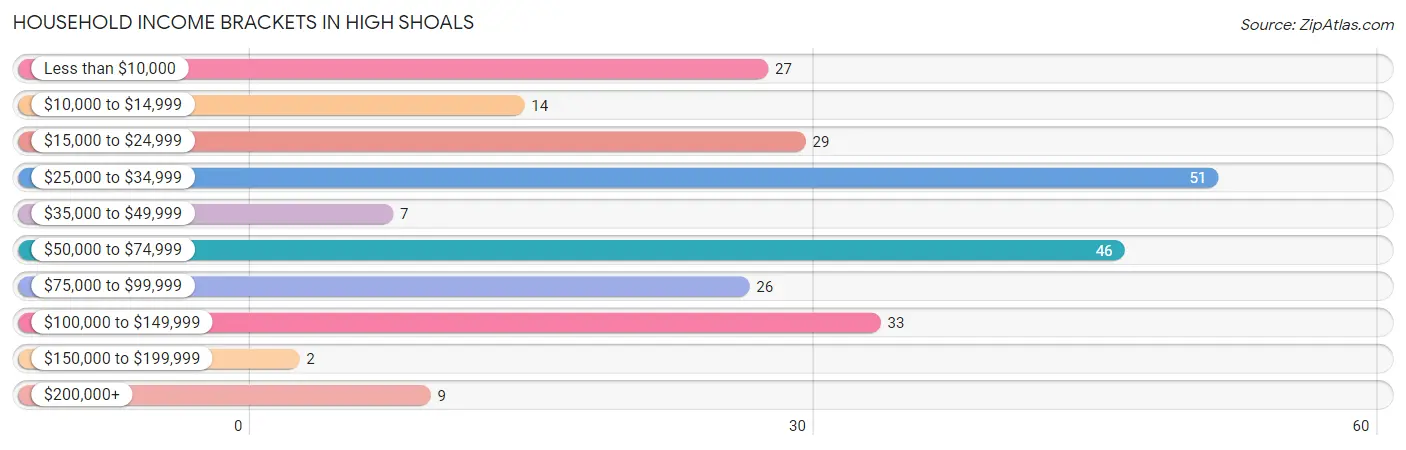
| Income Bracket | # Households | % Households |
| Less than $10,000 | 27 | 11.1% |
| $10,000 to $14,999 | 14 | 5.7% |
| $15,000 to $24,999 | 29 | 11.9% |
| $25,000 to $34,999 | 51 | 20.9% |
| $35,000 to $49,999 | 7 | 2.9% |
| $50,000 to $74,999 | 46 | 18.9% |
| $75,000 to $99,999 | 26 | 10.7% |
| $100,000 to $149,999 | 33 | 13.5% |
| $150,000 to $199,999 | 2 | 0.8% |
| $200,000+ | 9 | 3.7% |
Household Income by Householder Age in High Shoals
The median household income in High Shoals is $47,857, with the highest median household income of $69,167 found in the 45 to 64 years age bracket for the primary householder. A total of 54 households (22.1%) fall into this category. Meanwhile, the 15 to 24 years age bracket for the primary householder has the lowest median household income of $0, with 16 households (6.6%) in this group.
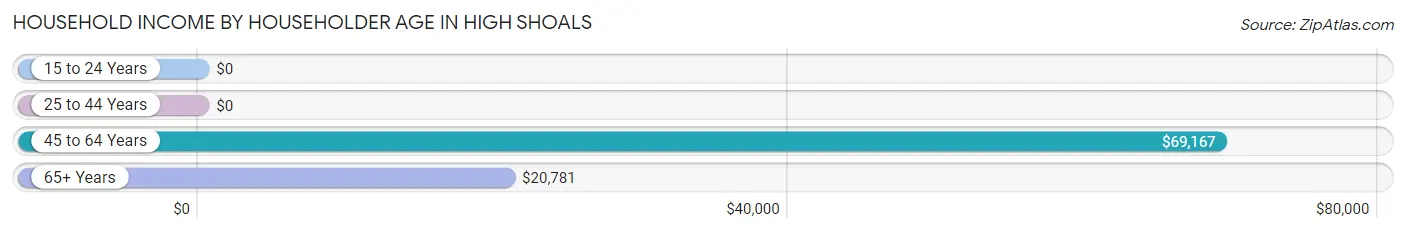
| Income Bracket | # Households | Median Income |
| 15 to 24 Years | 16 (6.6%) | $0 |
| 25 to 44 Years | 117 (47.9%) | $0 |
| 45 to 64 Years | 54 (22.1%) | $69,167 |
| 65+ Years | 57 (23.4%) | $20,781 |
| Total | 244 (100.0%) | $47,857 |
Poverty in High Shoals
Income Below Poverty by Sex and Age in High Shoals
With 21.5% poverty level for males and 25.6% for females among the residents of High Shoals, 5 year old males and 5 year old females are the most vulnerable to poverty, with 6 males (66.7%) and 2 females (100.0%) in their respective age groups living below the poverty level.
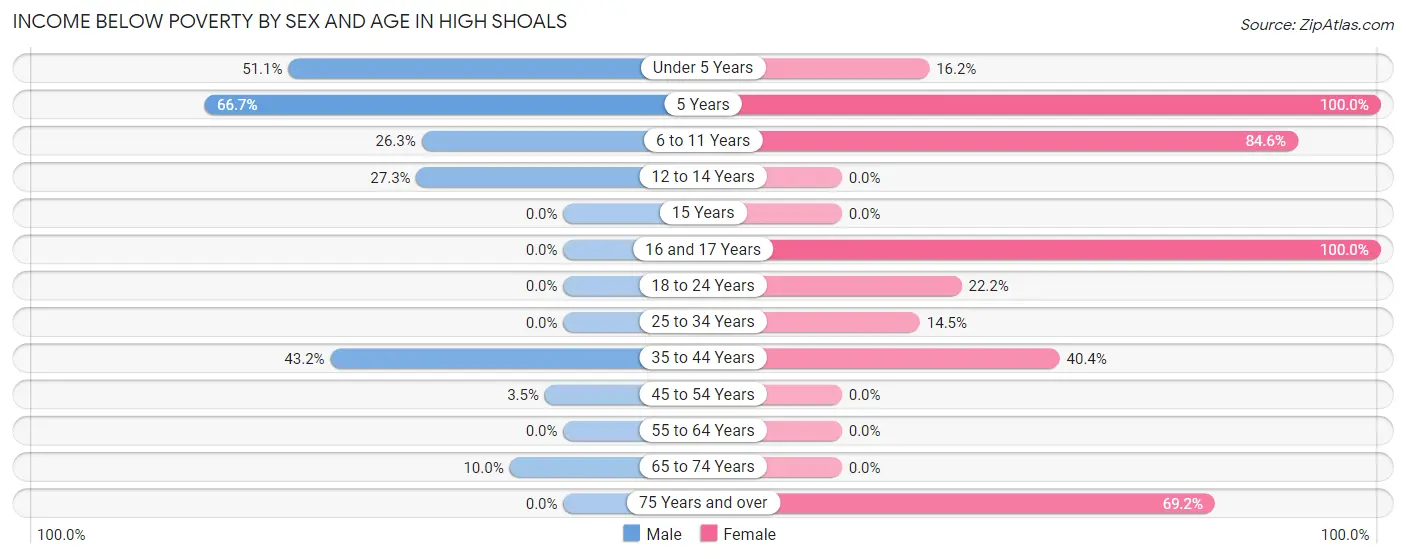
| Age Bracket | Male | Female |
| Under 5 Years | 24 (51.1%) | 6 (16.2%) |
| 5 Years | 6 (66.7%) | 2 (100.0%) |
| 6 to 11 Years | 15 (26.3%) | 11 (84.6%) |
| 12 to 14 Years | 12 (27.3%) | 0 (0.0%) |
| 15 Years | 0 (0.0%) | 0 (0.0%) |
| 16 and 17 Years | 0 (0.0%) | 8 (100.0%) |
| 18 to 24 Years | 0 (0.0%) | 8 (22.2%) |
| 25 to 34 Years | 0 (0.0%) | 10 (14.5%) |
| 35 to 44 Years | 16 (43.2%) | 19 (40.4%) |
| 45 to 54 Years | 1 (3.5%) | 0 (0.0%) |
| 55 to 64 Years | 0 (0.0%) | 0 (0.0%) |
| 65 to 74 Years | 2 (10.0%) | 0 (0.0%) |
| 75 Years and over | 0 (0.0%) | 18 (69.2%) |
| Total | 76 (21.5%) | 82 (25.6%) |
Income Above Poverty by Sex and Age in High Shoals
According to the poverty statistics in High Shoals, males aged 15 years and females aged 12 to 14 years are the age groups that are most secure financially, with 100.0% of males and 100.0% of females in these age groups living above the poverty line.
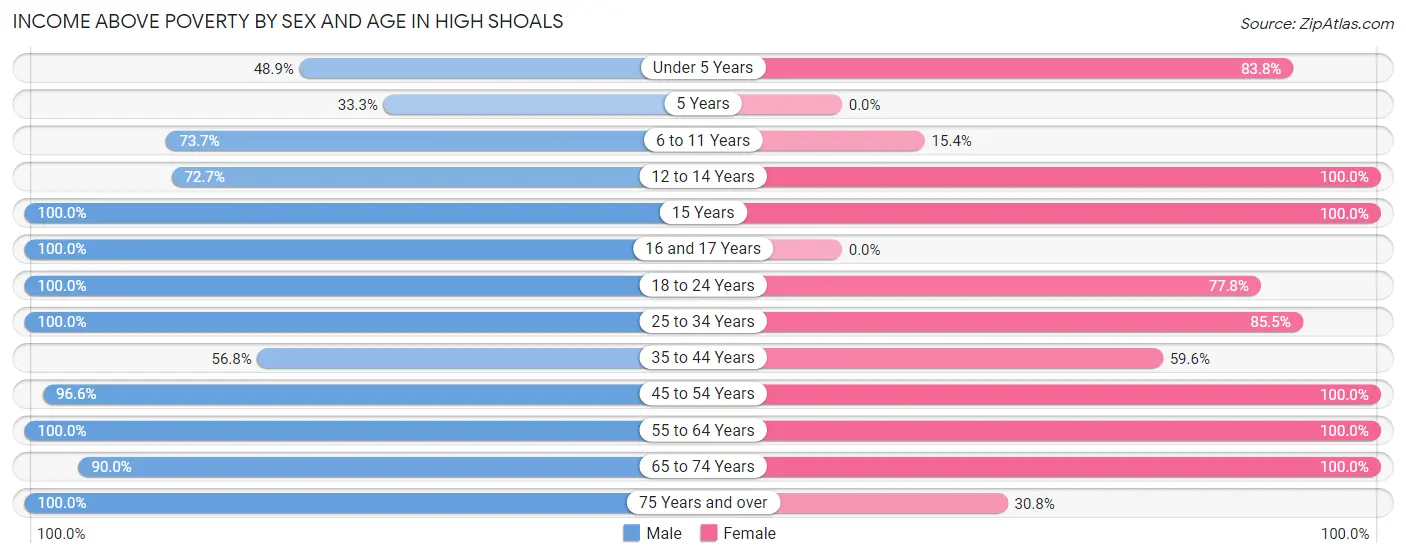
| Age Bracket | Male | Female |
| Under 5 Years | 23 (48.9%) | 31 (83.8%) |
| 5 Years | 3 (33.3%) | 0 (0.0%) |
| 6 to 11 Years | 42 (73.7%) | 2 (15.4%) |
| 12 to 14 Years | 32 (72.7%) | 3 (100.0%) |
| 15 Years | 18 (100.0%) | 4 (100.0%) |
| 16 and 17 Years | 15 (100.0%) | 0 (0.0%) |
| 18 to 24 Years | 18 (100.0%) | 28 (77.8%) |
| 25 to 34 Years | 26 (100.0%) | 59 (85.5%) |
| 35 to 44 Years | 21 (56.8%) | 28 (59.6%) |
| 45 to 54 Years | 28 (96.6%) | 25 (100.0%) |
| 55 to 64 Years | 31 (100.0%) | 28 (100.0%) |
| 65 to 74 Years | 18 (90.0%) | 23 (100.0%) |
| 75 Years and over | 3 (100.0%) | 8 (30.8%) |
| Total | 278 (78.5%) | 239 (74.5%) |
Income Below Poverty Among Married-Couple Families in High Shoals
The poverty statistics for married-couple families in High Shoals show that 8.8% or 10 of the total 114 families live below the poverty line. Families with 5 or more children have the highest poverty rate of 66.7%, comprising of 8 families. On the other hand, families with no children have the lowest poverty rate of 0.0%, which includes 0 families.
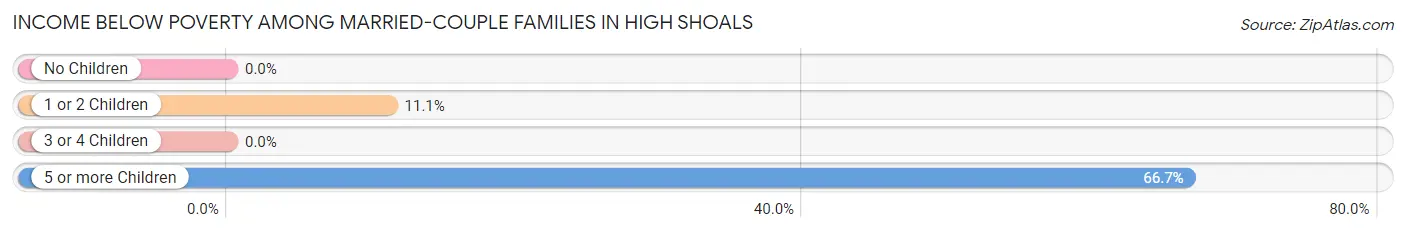
| Children | Above Poverty | Below Poverty |
| No Children | 68 (100.0%) | 0 (0.0%) |
| 1 or 2 Children | 16 (88.9%) | 2 (11.1%) |
| 3 or 4 Children | 16 (100.0%) | 0 (0.0%) |
| 5 or more Children | 4 (33.3%) | 8 (66.7%) |
| Total | 104 (91.2%) | 10 (8.8%) |
Income Below Poverty Among Single-Parent Households in High Shoals
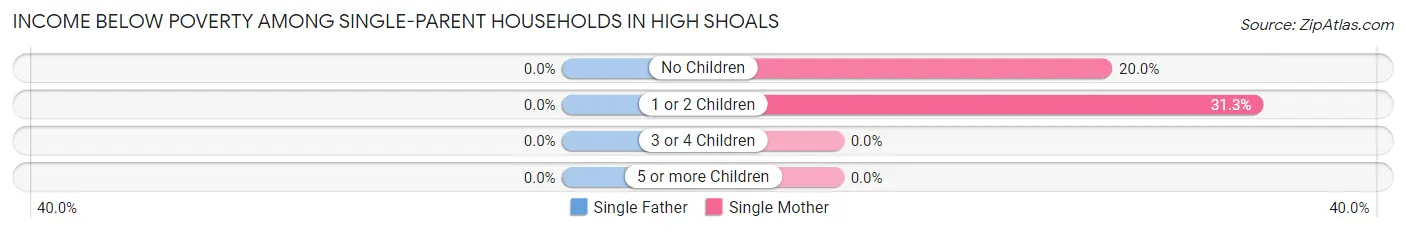
| Children | Single Father | Single Mother |
| No Children | 0 (0.0%) | 2 (20.0%) |
| 1 or 2 Children | 0 (0.0%) | 20 (31.2%) |
| 3 or 4 Children | 0 (0.0%) | 0 (0.0%) |
| 5 or more Children | 0 (0.0%) | 0 (0.0%) |
| Total | 0 (0.0%) | 22 (29.7%) |
Income Below Poverty Among Married-Couple vs Single-Parent Households in High Shoals
The poverty data for High Shoals shows that 10 of the married-couple family households (8.8%) and 22 of the single-parent households (26.2%) are living below the poverty level. Within the married-couple family households, those with 5 or more children have the highest poverty rate, with 8 households (66.7%) falling below the poverty line. Among the single-parent households, those with 1 or 2 children have the highest poverty rate, with 20 household (27.0%) living below poverty.
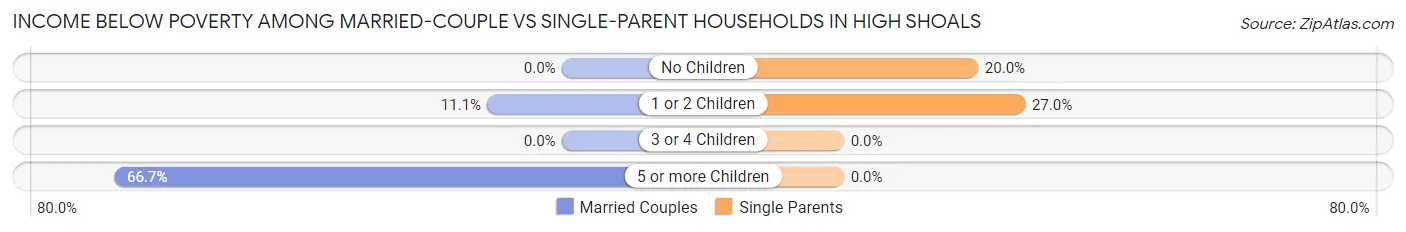
| Children | Married-Couple Families | Single-Parent Households |
| No Children | 0 (0.0%) | 2 (20.0%) |
| 1 or 2 Children | 2 (11.1%) | 20 (27.0%) |
| 3 or 4 Children | 0 (0.0%) | 0 (0.0%) |
| 5 or more Children | 8 (66.7%) | 0 (0.0%) |
| Total | 10 (8.8%) | 22 (26.2%) |
Race in High Shoals
The most populous races in High Shoals are White / Caucasian (570 | 84.4%), Black / African American (53 | 7.9%), and Asian (21 | 3.1%).
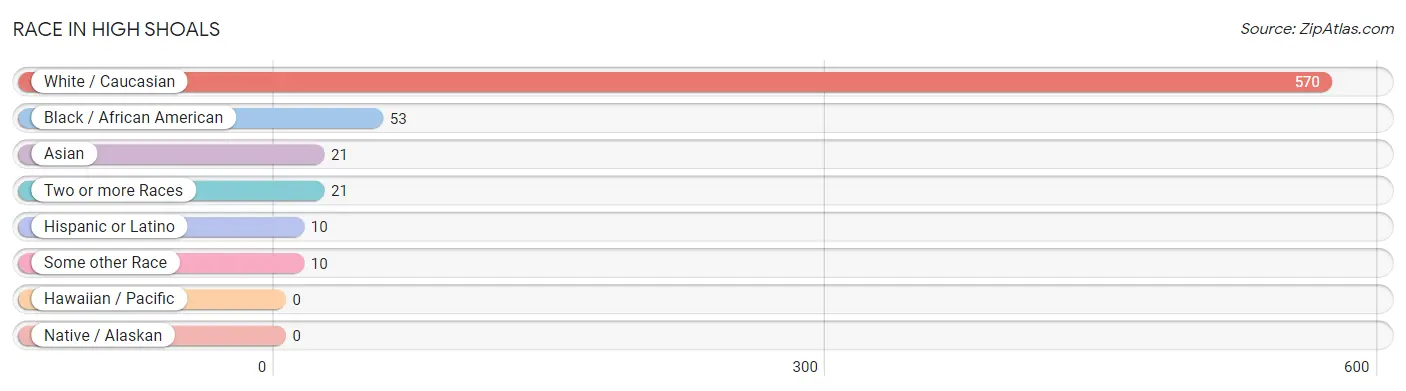
| Race | # Population | % Population |
| Asian | 21 | 3.1% |
| Black / African American | 53 | 7.9% |
| Hawaiian / Pacific | 0 | 0.0% |
| Hispanic or Latino | 10 | 1.5% |
| Native / Alaskan | 0 | 0.0% |
| White / Caucasian | 570 | 84.4% |
| Two or more Races | 21 | 3.1% |
| Some other Race | 10 | 1.5% |
| Total | 675 | 100.0% |
Ancestry in High Shoals
The most populous ancestries reported in High Shoals are Irish (134 | 19.9%), English (121 | 17.9%), German (27 | 4.0%), American (26 | 3.8%), and Scotch-Irish (24 | 3.6%), together accounting for 49.2% of all High Shoals residents.
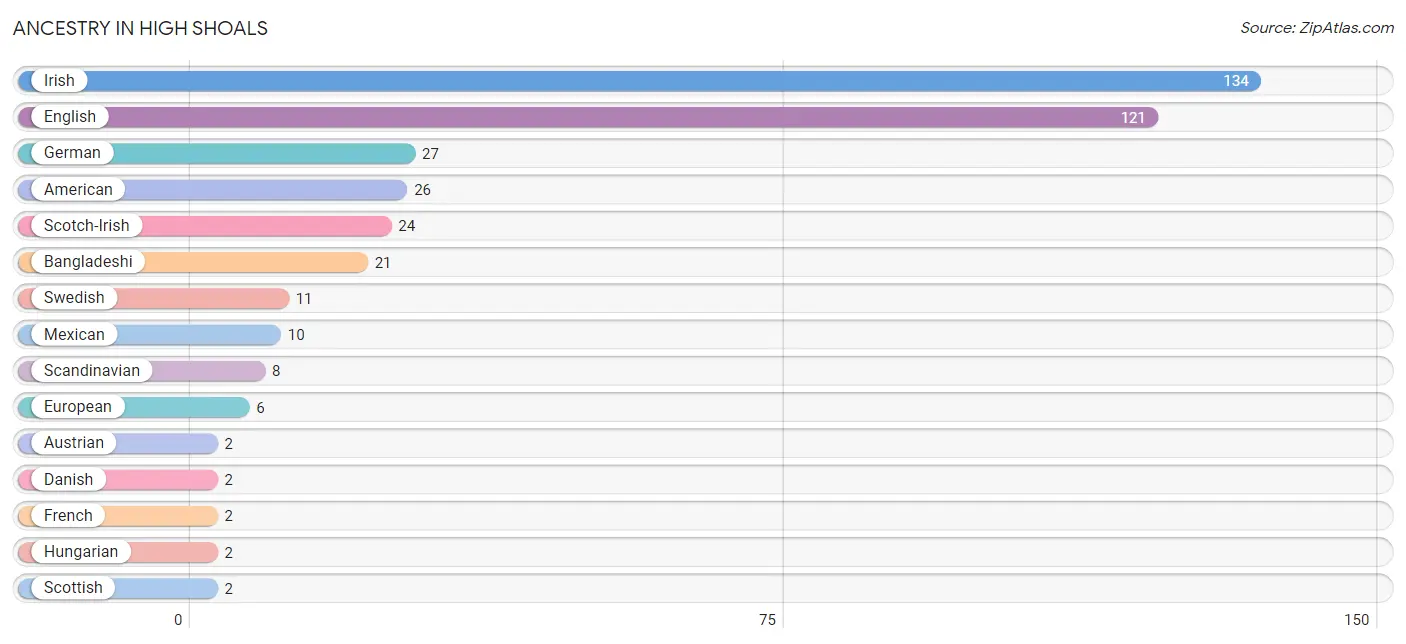
| Ancestry | # Population | % Population |
| American | 26 | 3.8% |
| Austrian | 2 | 0.3% |
| Bangladeshi | 21 | 3.1% |
| Danish | 2 | 0.3% |
| English | 121 | 17.9% |
| European | 6 | 0.9% |
| French | 2 | 0.3% |
| German | 27 | 4.0% |
| Hungarian | 2 | 0.3% |
| Irish | 134 | 19.9% |
| Mexican | 10 | 1.5% |
| Scandinavian | 8 | 1.2% |
| Scotch-Irish | 24 | 3.6% |
| Scottish | 2 | 0.3% |
| Swedish | 11 | 1.6% | View All 15 Rows |
Immigrants in High Shoals

| Immigration Origin | # Population | % Population | View All 0 Rows |
Sex and Age in High Shoals
Sex and Age in High Shoals
The most populous age groups in High Shoals are 5 to 9 Years (62 | 17.5%) for men and 30 to 34 Years (55 | 17.1%) for women.
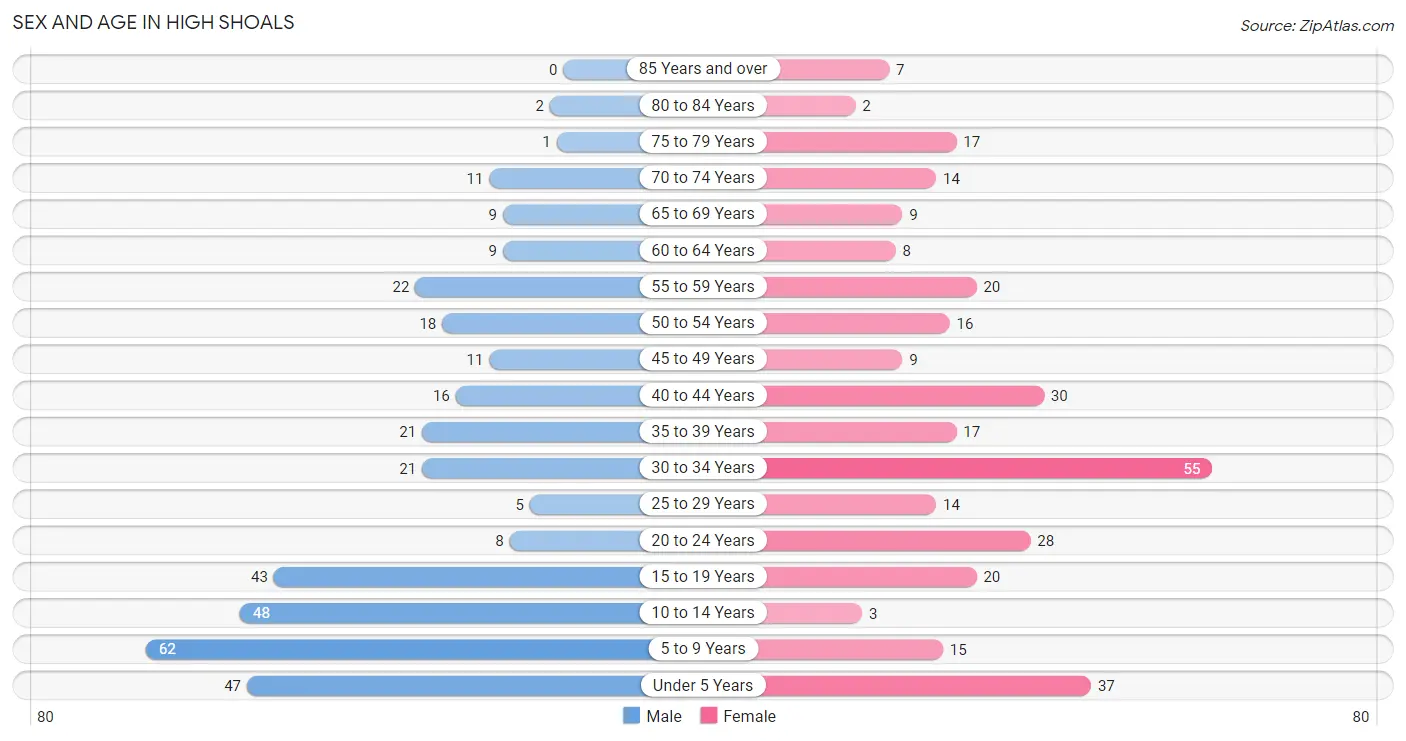
| Age Bracket | Male | Female |
| Under 5 Years | 47 (13.3%) | 37 (11.5%) |
| 5 to 9 Years | 62 (17.5%) | 15 (4.7%) |
| 10 to 14 Years | 48 (13.6%) | 3 (0.9%) |
| 15 to 19 Years | 43 (12.1%) | 20 (6.2%) |
| 20 to 24 Years | 8 (2.3%) | 28 (8.7%) |
| 25 to 29 Years | 5 (1.4%) | 14 (4.4%) |
| 30 to 34 Years | 21 (5.9%) | 55 (17.1%) |
| 35 to 39 Years | 21 (5.9%) | 17 (5.3%) |
| 40 to 44 Years | 16 (4.5%) | 30 (9.3%) |
| 45 to 49 Years | 11 (3.1%) | 9 (2.8%) |
| 50 to 54 Years | 18 (5.1%) | 16 (5.0%) |
| 55 to 59 Years | 22 (6.2%) | 20 (6.2%) |
| 60 to 64 Years | 9 (2.5%) | 8 (2.5%) |
| 65 to 69 Years | 9 (2.5%) | 9 (2.8%) |
| 70 to 74 Years | 11 (3.1%) | 14 (4.4%) |
| 75 to 79 Years | 1 (0.3%) | 17 (5.3%) |
| 80 to 84 Years | 2 (0.6%) | 2 (0.6%) |
| 85 Years and over | 0 (0.0%) | 7 (2.2%) |
| Total | 354 (100.0%) | 321 (100.0%) |
Families and Households in High Shoals
Median Family Size in High Shoals
The median family size in High Shoals is 3.10 persons per family, with married-couple families (114 | 57.6%) accounting for the largest median family size of 3.59 persons per family. On the other hand, single female/mother families (74 | 37.4%) represent the smallest median family size with 2.34 persons per family.
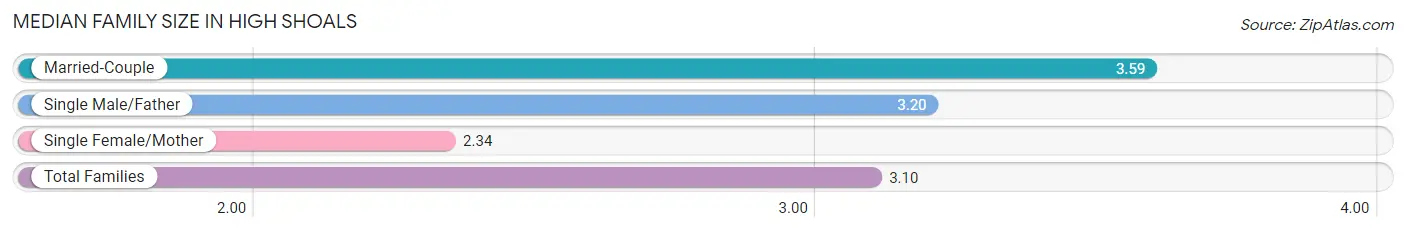
| Family Type | # Families | Family Size |
| Married-Couple | 114 (57.6%) | 3.59 |
| Single Male/Father | 10 (5.1%) | 3.20 |
| Single Female/Mother | 74 (37.4%) | 2.34 |
| Total Families | 198 (100.0%) | 3.10 |
Median Household Size in High Shoals
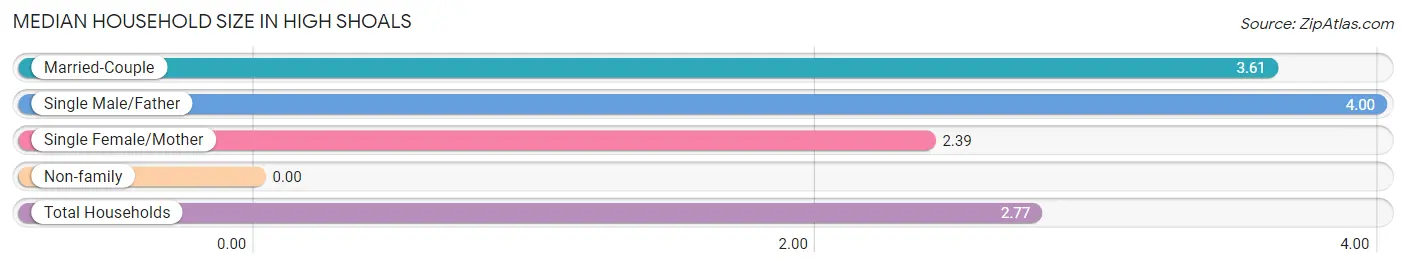
| Household Type | # Households | Household Size |
| Married-Couple | 114 (46.7%) | 3.61 |
| Single Male/Father | 10 (4.1%) | 4.00 |
| Single Female/Mother | 74 (30.3%) | 2.39 |
| Non-family | 46 (18.9%) | - |
| Total Households | 244 (100.0%) | 2.77 |
Household Size by Marriage Status in High Shoals
Out of a total of 244 households in High Shoals, 198 (81.1%) are family households, while 46 (18.9%) are nonfamily households. The most numerous type of family households are 2-person households, comprising 83, and the most common type of nonfamily households are 1-person households, comprising 46.
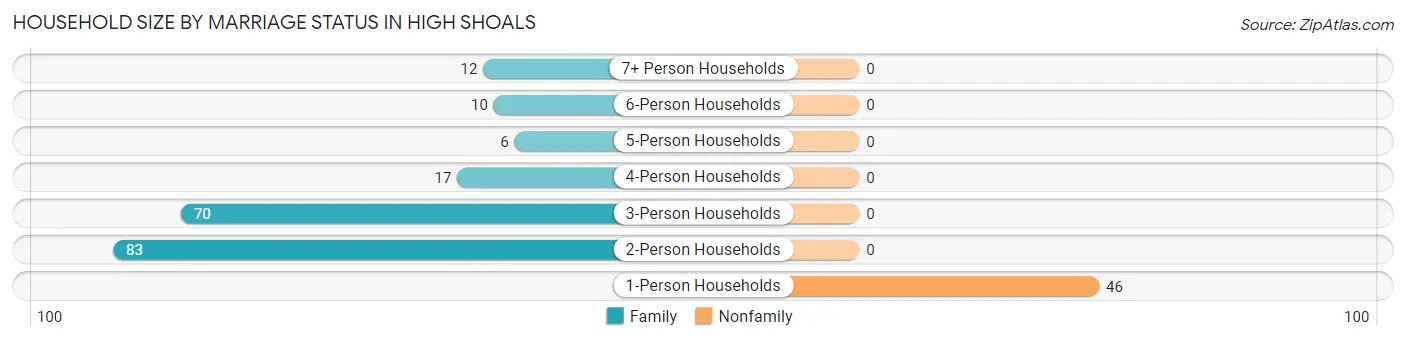
| Household Size | Family Households | Nonfamily Households |
| 1-Person Households | - | 46 (18.9%) |
| 2-Person Households | 83 (34.0%) | 0 (0.0%) |
| 3-Person Households | 70 (28.7%) | 0 (0.0%) |
| 4-Person Households | 17 (7.0%) | 0 (0.0%) |
| 5-Person Households | 6 (2.5%) | 0 (0.0%) |
| 6-Person Households | 10 (4.1%) | 0 (0.0%) |
| 7+ Person Households | 12 (4.9%) | 0 (0.0%) |
| Total | 198 (81.1%) | 46 (18.9%) |
Female Fertility in High Shoals
Fertility by Age in High Shoals
Average fertility rate in High Shoals is 22.0 births per 1,000 women. Women in the age bracket of 20 to 34 years have the highest fertility rate with 41.0 births per 1,000 women. Women in the age bracket of 20 to 34 years acount for 100.0% of all women with births.
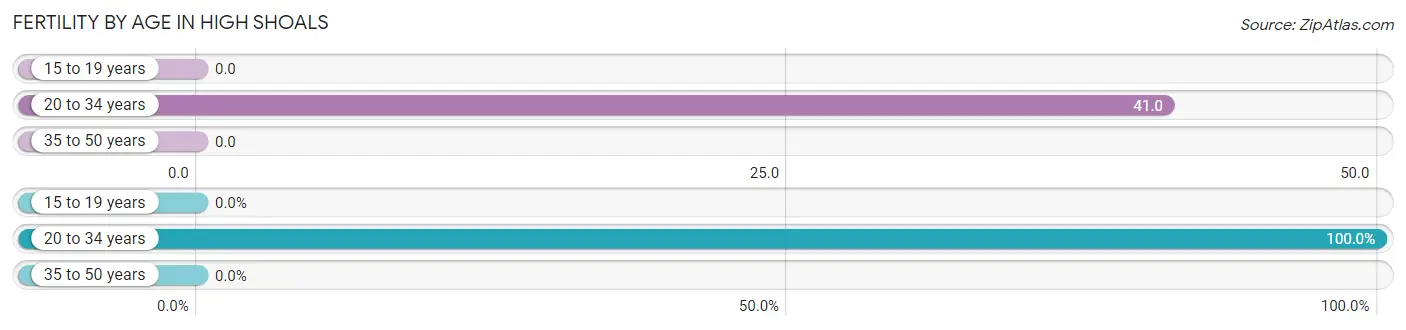
| Age Bracket | Women with Births | Births / 1,000 Women |
| 15 to 19 years | 0 (0.0%) | 0.0 |
| 20 to 34 years | 4 (100.0%) | 41.0 |
| 35 to 50 years | 0 (0.0%) | 0.0 |
| Total | 4 (100.0%) | 22.0 |
Fertility by Age by Marriage Status in High Shoals
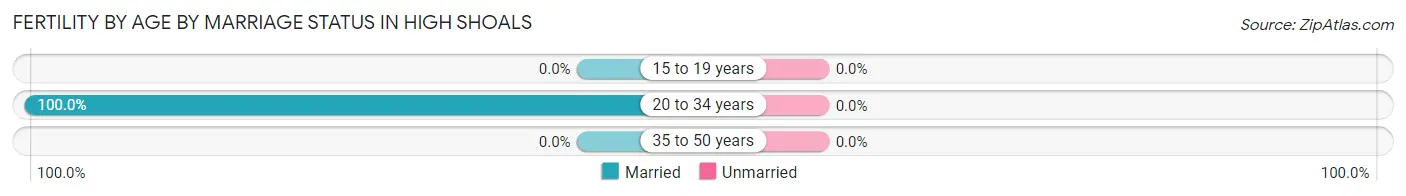
| Age Bracket | Married | Unmarried |
| 15 to 19 years | 0 (0.0%) | 0 (0.0%) |
| 20 to 34 years | 4 (100.0%) | 0 (0.0%) |
| 35 to 50 years | 0 (0.0%) | 0 (0.0%) |
| Total | 4 (100.0%) | 0 (0.0%) |
Fertility by Education in High Shoals
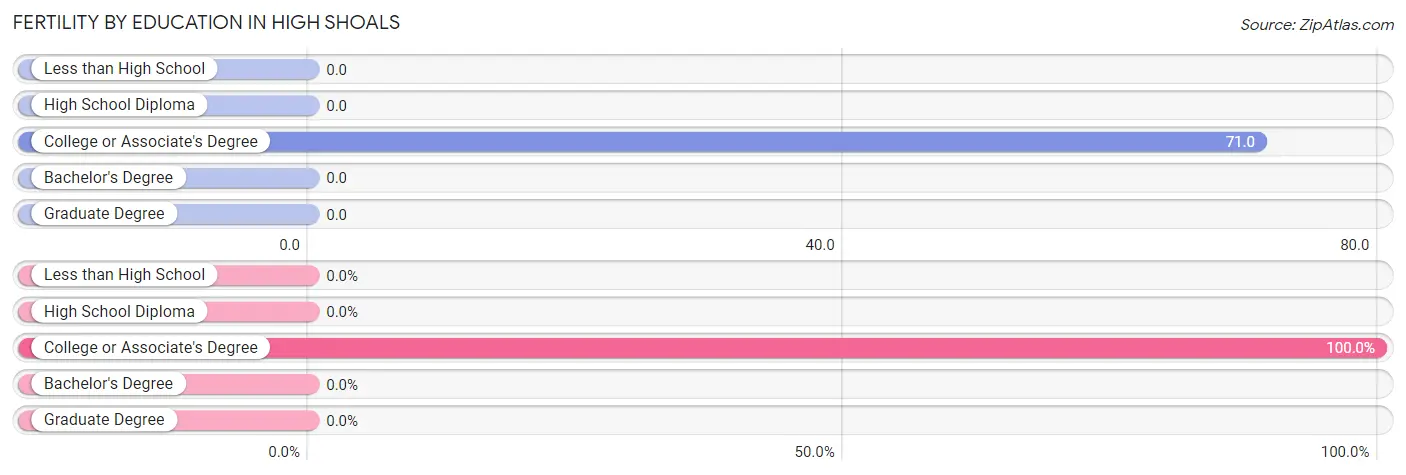
| Educational Attainment | Women with Births | Births / 1,000 Women |
| Less than High School | 0 (0.0%) | 0.0 |
| High School Diploma | 0 (0.0%) | 0.0 |
| College or Associate's Degree | 4 (100.0%) | 71.0 |
| Bachelor's Degree | 0 (0.0%) | 0.0 |
| Graduate Degree | 0 (0.0%) | 0.0 |
| Total | 4 (100.0%) | 22.0 |
Fertility by Education by Marriage Status in High Shoals
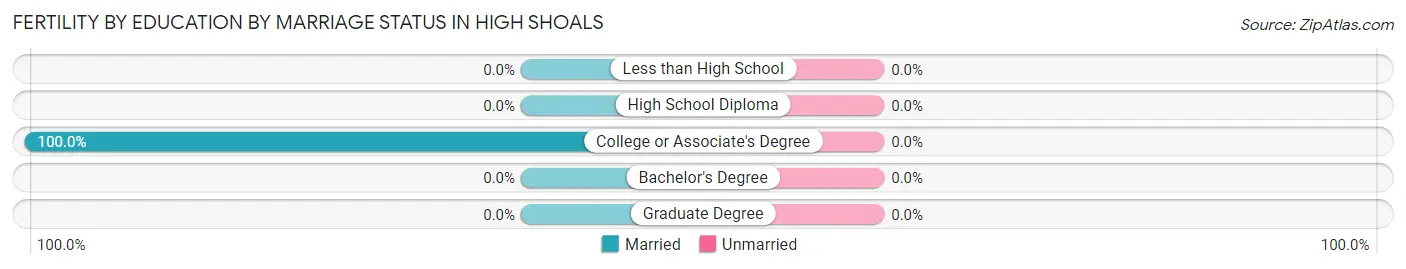
| Educational Attainment | Married | Unmarried |
| Less than High School | 0 (0.0%) | 0 (0.0%) |
| High School Diploma | 0 (0.0%) | 0 (0.0%) |
| College or Associate's Degree | 4 (100.0%) | 0 (0.0%) |
| Bachelor's Degree | 0 (0.0%) | 0 (0.0%) |
| Graduate Degree | 0 (0.0%) | 0 (0.0%) |
| Total | 4 (100.0%) | 0 (0.0%) |
Employment Characteristics in High Shoals
Employment by Class of Employer in High Shoals
Among the 252 employed individuals in High Shoals, private company employees (154 | 61.1%), local government employees (37 | 14.7%), and not-for-profit organizations (30 | 11.9%) make up the most common classes of employment.
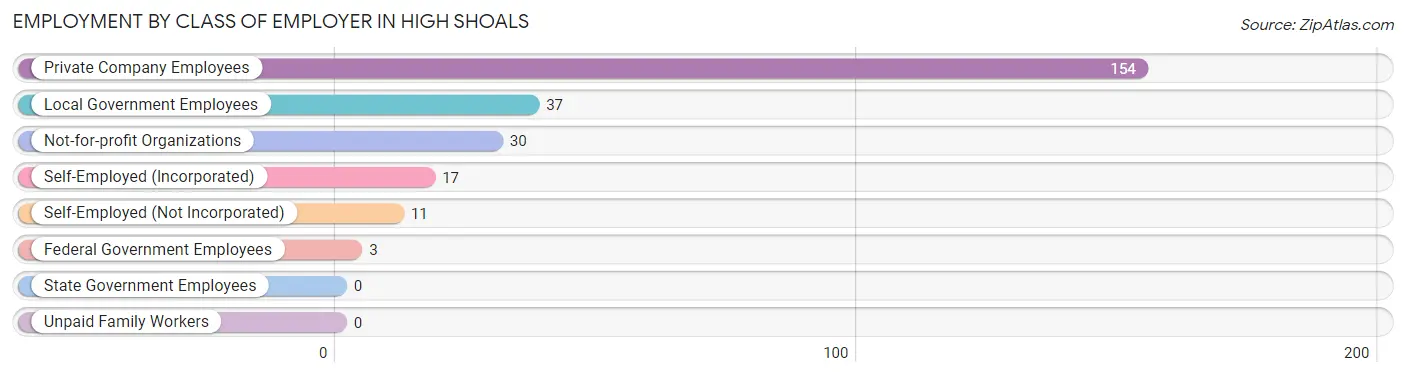
| Employer Class | # Employees | % Employees |
| Private Company Employees | 154 | 61.1% |
| Self-Employed (Incorporated) | 17 | 6.8% |
| Self-Employed (Not Incorporated) | 11 | 4.4% |
| Not-for-profit Organizations | 30 | 11.9% |
| Local Government Employees | 37 | 14.7% |
| State Government Employees | 0 | 0.0% |
| Federal Government Employees | 3 | 1.2% |
| Unpaid Family Workers | 0 | 0.0% |
| Total | 252 | 100.0% |
Employment Status by Age in High Shoals
According to the labor force statistics for High Shoals, out of the total population over 16 years of age (441), 59.0% or 260 individuals are in the labor force, with 3.1% or 8 of them unemployed. The age group with the highest labor force participation rate is 25 to 29 years, with 100.0% or 19 individuals in the labor force. Within the labor force, the 25 to 29 years age range has the highest percentage of unemployed individuals, with 10.5% or 2 of them being unemployed.
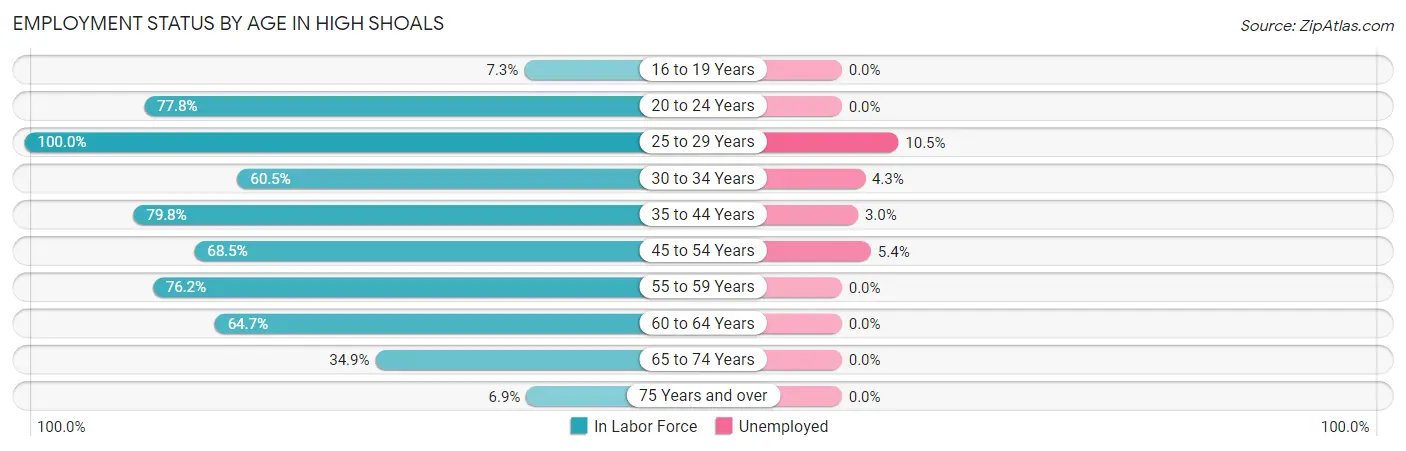
| Age Bracket | In Labor Force | Unemployed |
| 16 to 19 Years | 3 (7.3%) | 0 (0.0%) |
| 20 to 24 Years | 28 (77.8%) | 0 (0.0%) |
| 25 to 29 Years | 19 (100.0%) | 2 (10.5%) |
| 30 to 34 Years | 46 (60.5%) | 2 (4.3%) |
| 35 to 44 Years | 67 (79.8%) | 2 (3.0%) |
| 45 to 54 Years | 37 (68.5%) | 2 (5.4%) |
| 55 to 59 Years | 32 (76.2%) | 0 (0.0%) |
| 60 to 64 Years | 11 (64.7%) | 0 (0.0%) |
| 65 to 74 Years | 15 (34.9%) | 0 (0.0%) |
| 75 Years and over | 2 (6.9%) | 0 (0.0%) |
| Total | 260 (59.0%) | 8 (3.1%) |
Employment Status by Educational Attainment in High Shoals
According to labor force statistics for High Shoals, 72.6% of individuals (212) out of the total population between 25 and 64 years of age (292) are in the labor force, with 3.8% or 8 of them being unemployed. The group with the highest labor force participation rate are those with the educational attainment of bachelor's degree or higher, with 100.0% or 37 individuals in the labor force. Within the labor force, individuals with less than high school education have the highest percentage of unemployment, with 66.7% or 4 of them being unemployed.
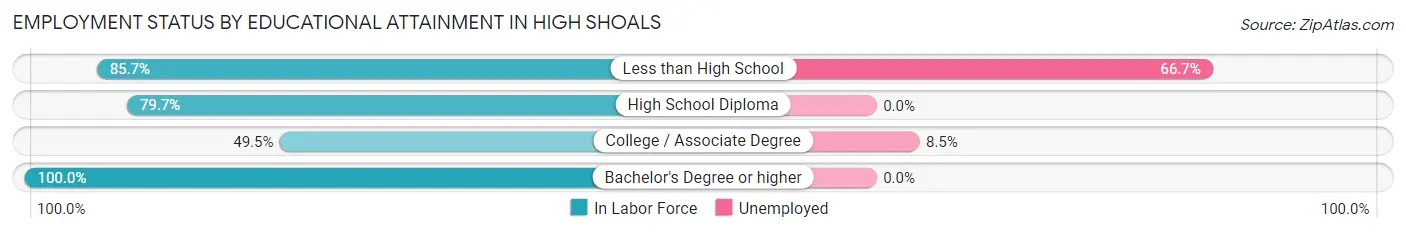
| Educational Attainment | In Labor Force | Unemployed |
| Less than High School | 6 (85.7%) | 5 (66.7%) |
| High School Diploma | 122 (79.7%) | 0 (0.0%) |
| College / Associate Degree | 47 (49.5%) | 8 (8.5%) |
| Bachelor's Degree or higher | 37 (100.0%) | 0 (0.0%) |
| Total | 212 (72.6%) | 11 (3.8%) |
Employment Occupations by Sex in High Shoals
Management, Business, Science and Arts Occupations
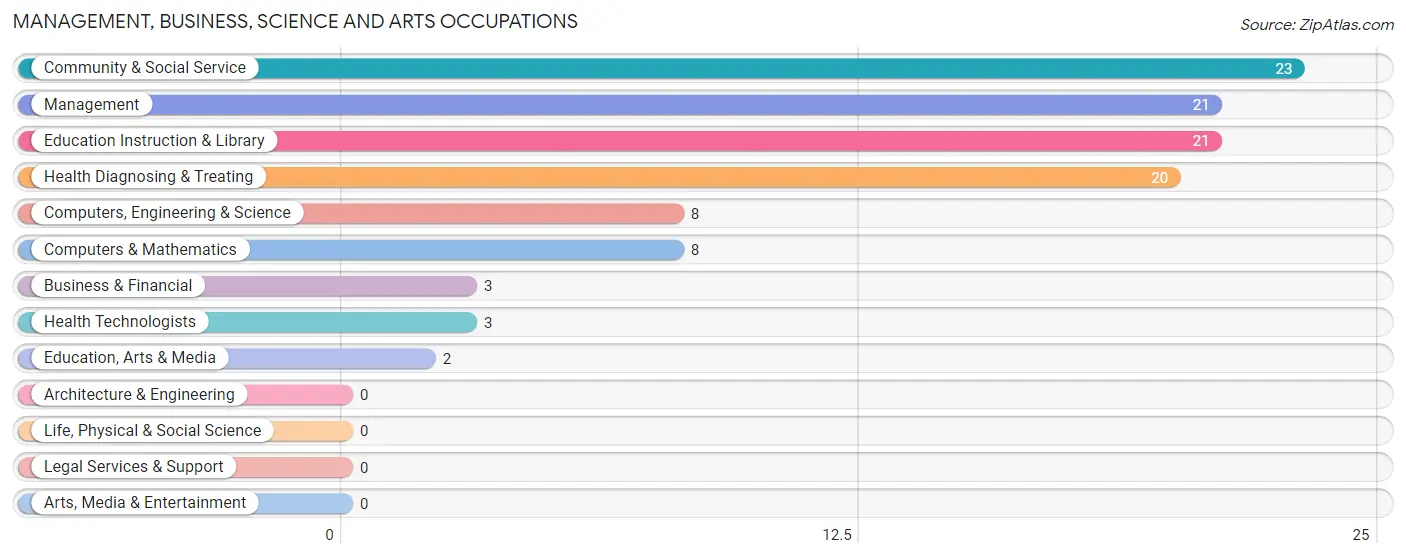
The most common Management, Business, Science and Arts occupations in High Shoals are Community & Social Service (23 | 9.1%), Management (21 | 8.3%), Education Instruction & Library (21 | 8.3%), Health Diagnosing & Treating (20 | 7.9%), and Computers, Engineering & Science (8 | 3.2%).
Management, Business, Science and Arts Occupations by Sex
Within the Management, Business, Science and Arts occupations in High Shoals, the most male-oriented occupations are Business & Financial (100.0%), Computers, Engineering & Science (100.0%), and Computers & Mathematics (100.0%), while the most female-oriented occupations are Education Instruction & Library (100.0%), Community & Social Service (91.3%), and Health Diagnosing & Treating (60.0%).
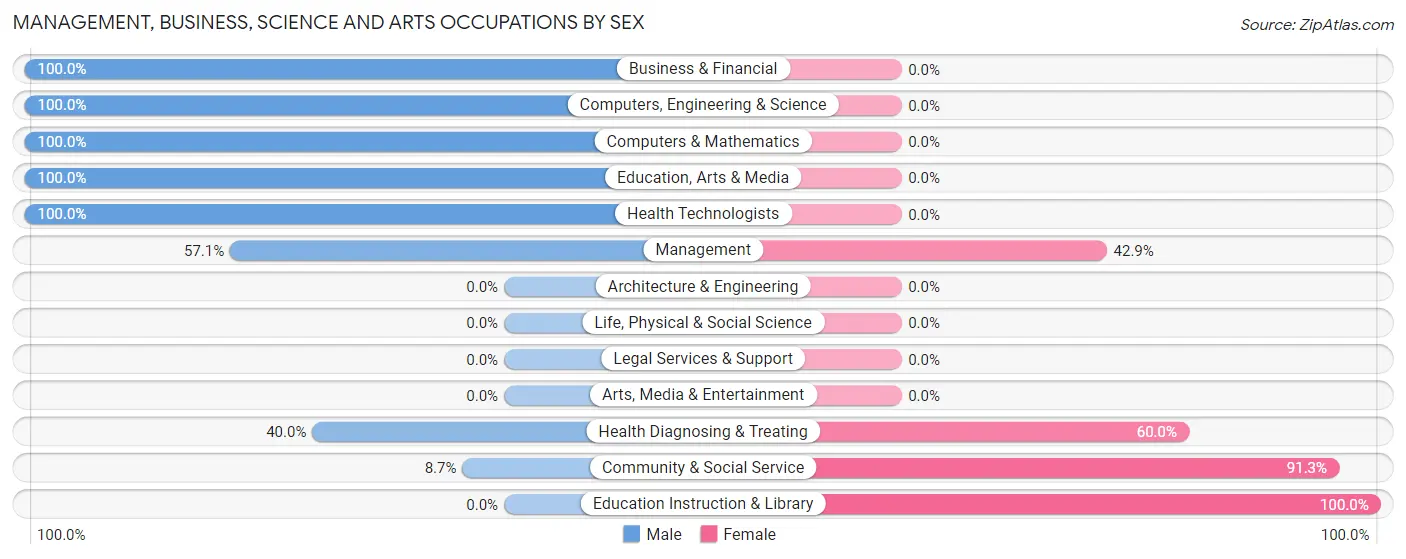
| Occupation | Male | Female |
| Management | 12 (57.1%) | 9 (42.9%) |
| Business & Financial | 3 (100.0%) | 0 (0.0%) |
| Computers, Engineering & Science | 8 (100.0%) | 0 (0.0%) |
| Computers & Mathematics | 8 (100.0%) | 0 (0.0%) |
| Architecture & Engineering | 0 (0.0%) | 0 (0.0%) |
| Life, Physical & Social Science | 0 (0.0%) | 0 (0.0%) |
| Community & Social Service | 2 (8.7%) | 21 (91.3%) |
| Education, Arts & Media | 2 (100.0%) | 0 (0.0%) |
| Legal Services & Support | 0 (0.0%) | 0 (0.0%) |
| Education Instruction & Library | 0 (0.0%) | 21 (100.0%) |
| Arts, Media & Entertainment | 0 (0.0%) | 0 (0.0%) |
| Health Diagnosing & Treating | 8 (40.0%) | 12 (60.0%) |
| Health Technologists | 3 (100.0%) | 0 (0.0%) |
| Total (Category) | 33 (44.0%) | 42 (56.0%) |
| Total (Overall) | 125 (49.6%) | 127 (50.4%) |
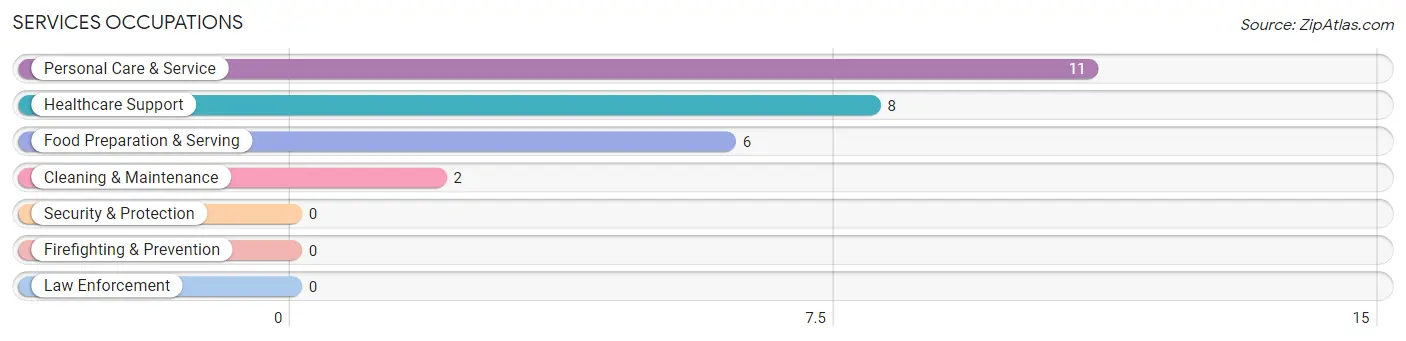
Services Occupations
The most common Services occupations in High Shoals are Personal Care & Service (11 | 4.4%), Healthcare Support (8 | 3.2%), Food Preparation & Serving (6 | 2.4%), and Cleaning & Maintenance (2 | 0.8%).
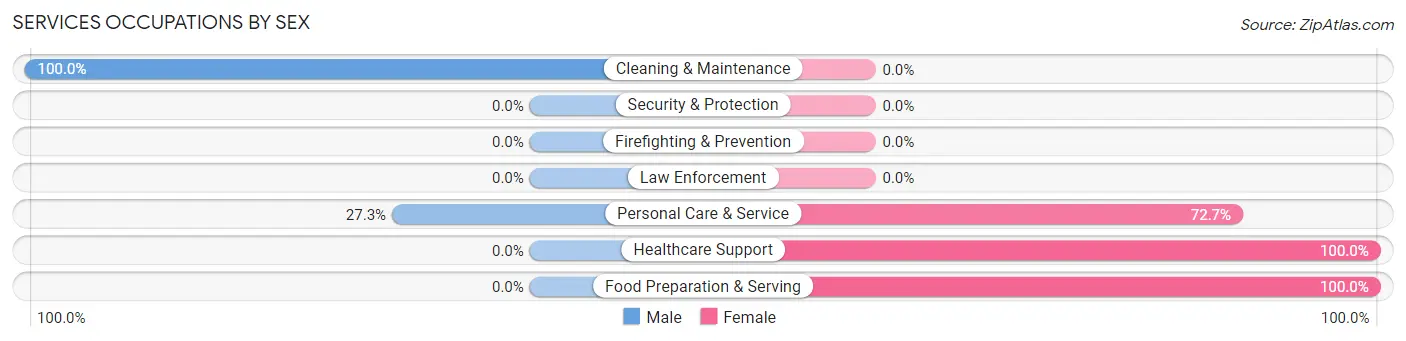
Services Occupations by Sex
Within the Services occupations in High Shoals, the most male-oriented occupations are Cleaning & Maintenance (100.0%), and Personal Care & Service (27.3%), while the most female-oriented occupations are Healthcare Support (100.0%), Food Preparation & Serving (100.0%), and Personal Care & Service (72.7%).
| Occupation | Male | Female |
| Healthcare Support | 0 (0.0%) | 8 (100.0%) |
| Security & Protection | 0 (0.0%) | 0 (0.0%) |
| Firefighting & Prevention | 0 (0.0%) | 0 (0.0%) |
| Law Enforcement | 0 (0.0%) | 0 (0.0%) |
| Food Preparation & Serving | 0 (0.0%) | 6 (100.0%) |
| Cleaning & Maintenance | 2 (100.0%) | 0 (0.0%) |
| Personal Care & Service | 3 (27.3%) | 8 (72.7%) |
| Total (Category) | 5 (18.5%) | 22 (81.5%) |
| Total (Overall) | 125 (49.6%) | 127 (50.4%) |
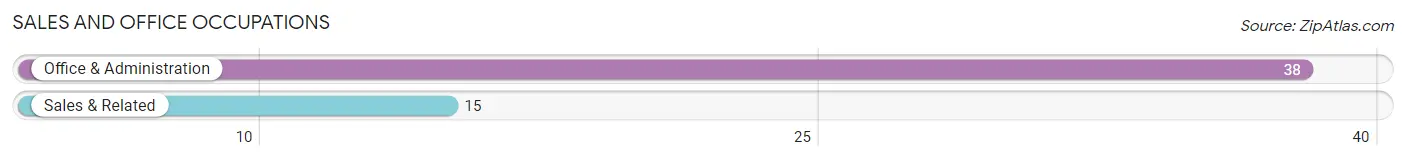
Sales and Office Occupations
The most common Sales and Office occupations in High Shoals are Office & Administration (38 | 15.1%), and Sales & Related (15 | 5.9%).
Sales and Office Occupations by Sex
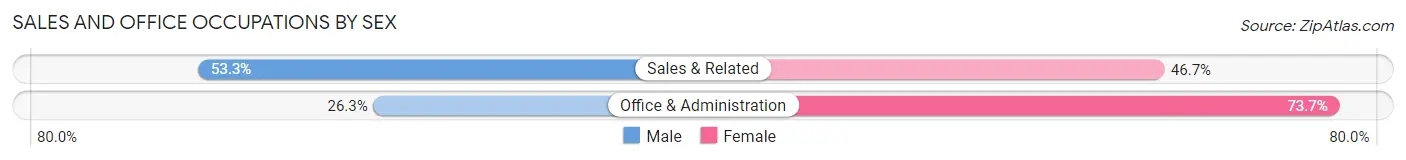
| Occupation | Male | Female |
| Sales & Related | 8 (53.3%) | 7 (46.7%) |
| Office & Administration | 10 (26.3%) | 28 (73.7%) |
| Total (Category) | 18 (34.0%) | 35 (66.0%) |
| Total (Overall) | 125 (49.6%) | 127 (50.4%) |
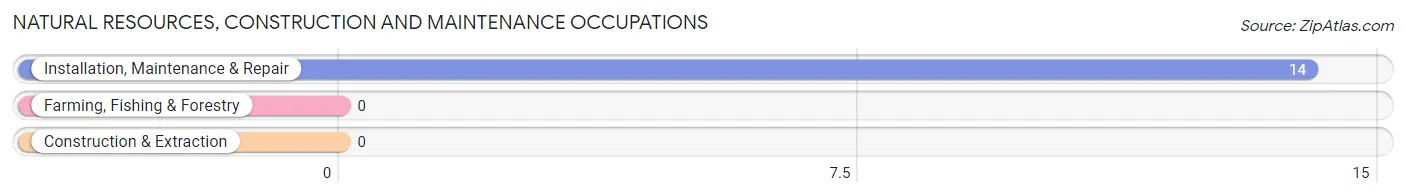
Natural Resources, Construction and Maintenance Occupations
The most common Natural Resources, Construction and Maintenance occupations in High Shoals are , and Installation, Maintenance & Repair (14 | 5.6%).
Natural Resources, Construction and Maintenance Occupations by Sex
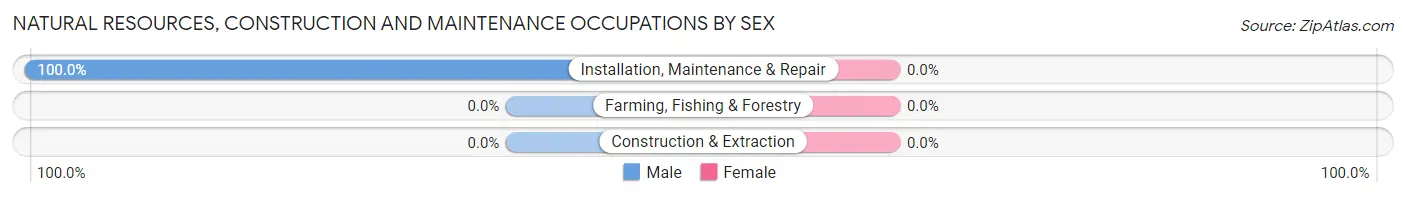
| Occupation | Male | Female |
| Farming, Fishing & Forestry | 0 (0.0%) | 0 (0.0%) |
| Construction & Extraction | 0 (0.0%) | 0 (0.0%) |
| Installation, Maintenance & Repair | 14 (100.0%) | 0 (0.0%) |
| Total (Category) | 14 (100.0%) | 0 (0.0%) |
| Total (Overall) | 125 (49.6%) | 127 (50.4%) |
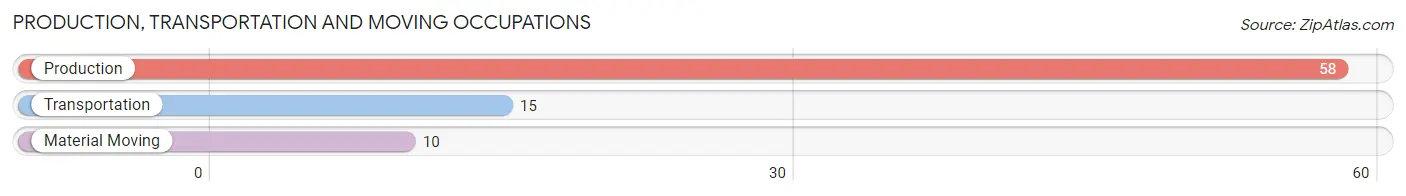
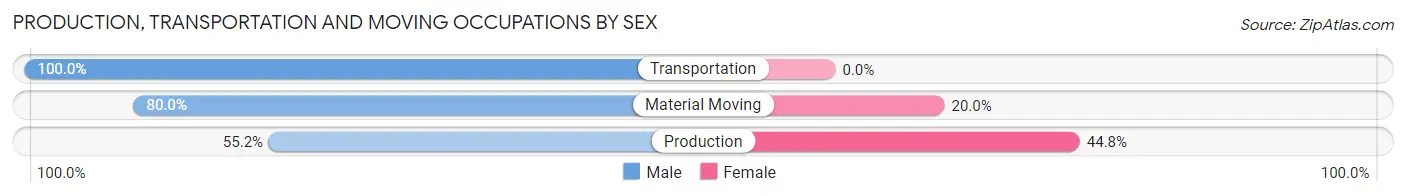
Production, Transportation and Moving Occupations
The most common Production, Transportation and Moving occupations in High Shoals are Production (58 | 23.0%), Transportation (15 | 5.9%), and Material Moving (10 | 4.0%).
Production, Transportation and Moving Occupations by Sex
| Occupation | Male | Female |
| Production | 32 (55.2%) | 26 (44.8%) |
| Transportation | 15 (100.0%) | 0 (0.0%) |
| Material Moving | 8 (80.0%) | 2 (20.0%) |
| Total (Category) | 55 (66.3%) | 28 (33.7%) |
| Total (Overall) | 125 (49.6%) | 127 (50.4%) |
Employment Industries by Sex in High Shoals
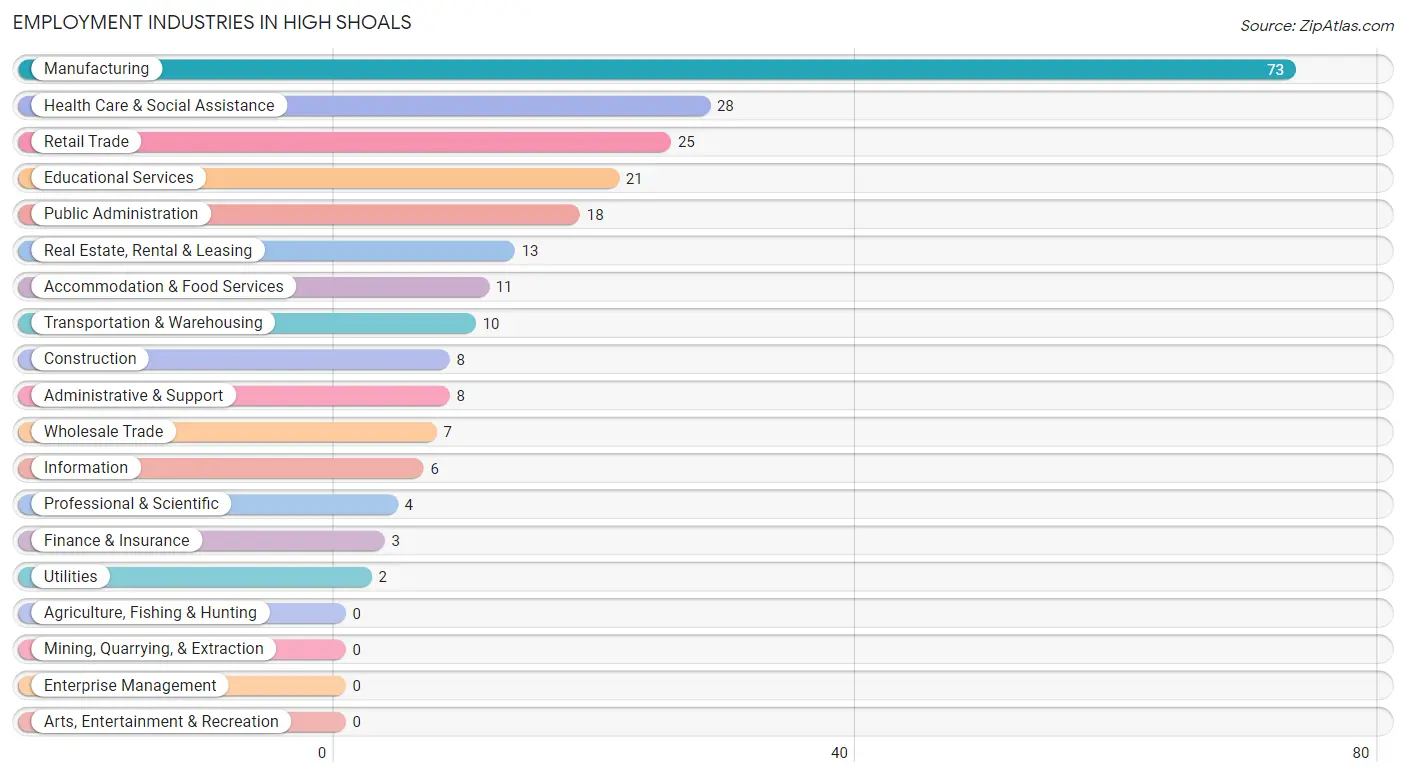
Employment Industries in High Shoals
The major employment industries in High Shoals include Manufacturing (73 | 29.0%), Health Care & Social Assistance (28 | 11.1%), Retail Trade (25 | 9.9%), Educational Services (21 | 8.3%), and Public Administration (18 | 7.1%).
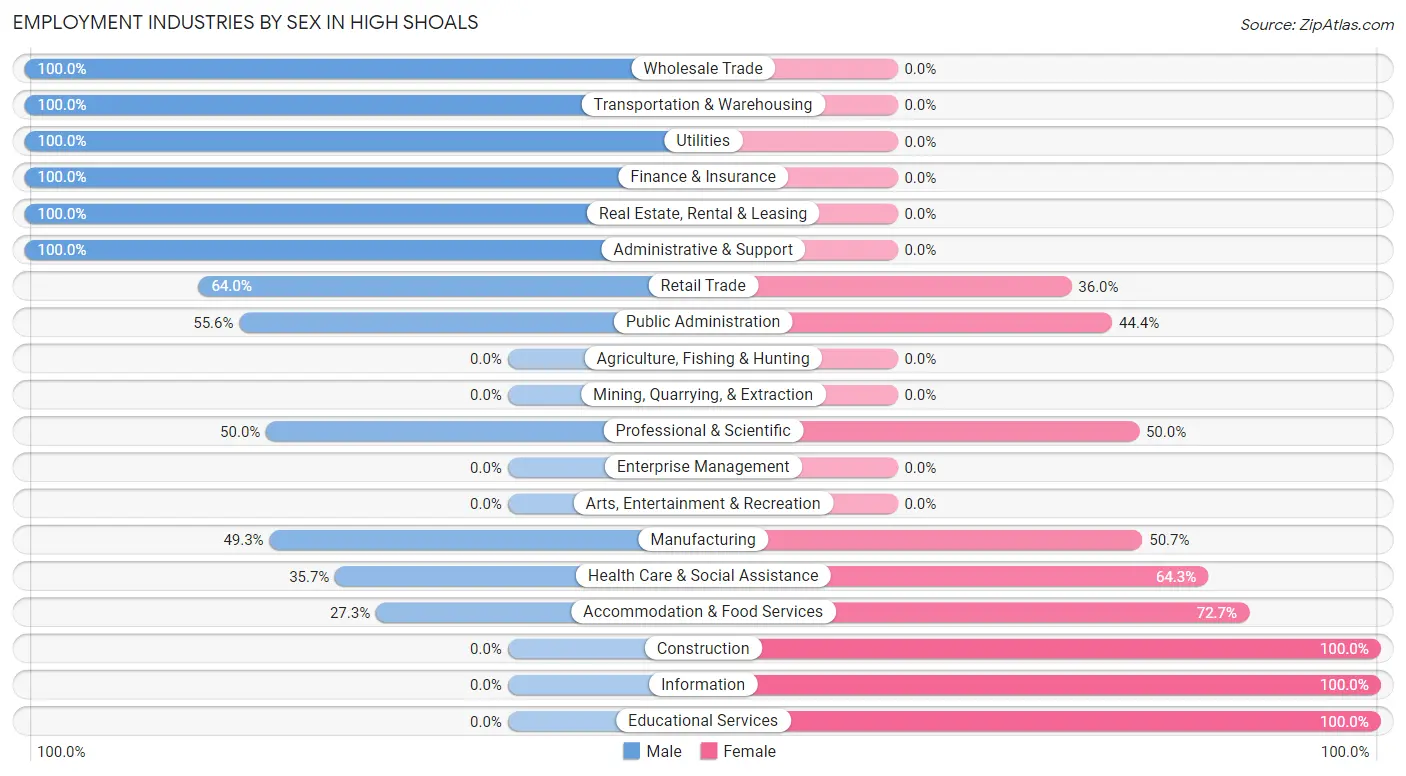
Employment Industries by Sex in High Shoals
The High Shoals industries that see more men than women are Wholesale Trade (100.0%), Transportation & Warehousing (100.0%), and Utilities (100.0%), whereas the industries that tend to have a higher number of women are Construction (100.0%), Information (100.0%), and Educational Services (100.0%).
| Industry | Male | Female |
| Agriculture, Fishing & Hunting | 0 (0.0%) | 0 (0.0%) |
| Mining, Quarrying, & Extraction | 0 (0.0%) | 0 (0.0%) |
| Construction | 0 (0.0%) | 8 (100.0%) |
| Manufacturing | 36 (49.3%) | 37 (50.7%) |
| Wholesale Trade | 7 (100.0%) | 0 (0.0%) |
| Retail Trade | 16 (64.0%) | 9 (36.0%) |
| Transportation & Warehousing | 10 (100.0%) | 0 (0.0%) |
| Utilities | 2 (100.0%) | 0 (0.0%) |
| Information | 0 (0.0%) | 6 (100.0%) |
| Finance & Insurance | 3 (100.0%) | 0 (0.0%) |
| Real Estate, Rental & Leasing | 13 (100.0%) | 0 (0.0%) |
| Professional & Scientific | 2 (50.0%) | 2 (50.0%) |
| Enterprise Management | 0 (0.0%) | 0 (0.0%) |
| Administrative & Support | 8 (100.0%) | 0 (0.0%) |
| Educational Services | 0 (0.0%) | 21 (100.0%) |
| Health Care & Social Assistance | 10 (35.7%) | 18 (64.3%) |
| Arts, Entertainment & Recreation | 0 (0.0%) | 0 (0.0%) |
| Accommodation & Food Services | 3 (27.3%) | 8 (72.7%) |
| Public Administration | 10 (55.6%) | 8 (44.4%) |
| Total | 125 (49.6%) | 127 (50.4%) |
Education in High Shoals
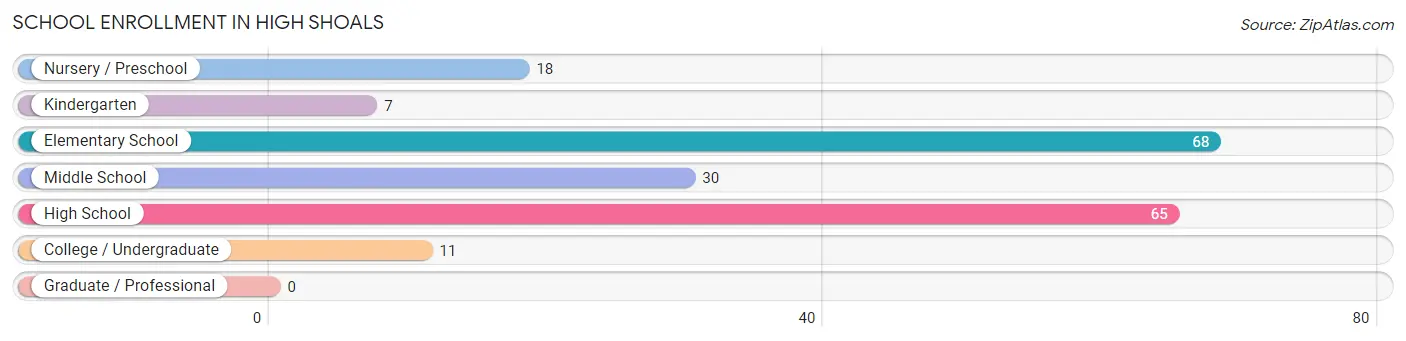
School Enrollment in High Shoals
The most common levels of schooling among the 199 students in High Shoals are elementary school (68 | 34.2%), high school (65 | 32.7%), and middle school (30 | 15.1%).
| School Level | # Students | % Students |
| Nursery / Preschool | 18 | 9.0% |
| Kindergarten | 7 | 3.5% |
| Elementary School | 68 | 34.2% |
| Middle School | 30 | 15.1% |
| High School | 65 | 32.7% |
| College / Undergraduate | 11 | 5.5% |
| Graduate / Professional | 0 | 0.0% |
| Total | 199 | 100.0% |
School Enrollment by Age by Funding Source in High Shoals
Out of a total of 199 students who are enrolled in schools in High Shoals, 62 (31.2%) attend a private institution, while the remaining 137 (68.8%) are enrolled in public schools. The age group of 10 to 14 year olds has the highest likelihood of being enrolled in private schools, with 18 (50.0% in the age bracket) enrolled. Conversely, the age group of 3 to 4 year olds has the lowest likelihood of being enrolled in a private school, with 18 (100.0% in the age bracket) attending a public institution.
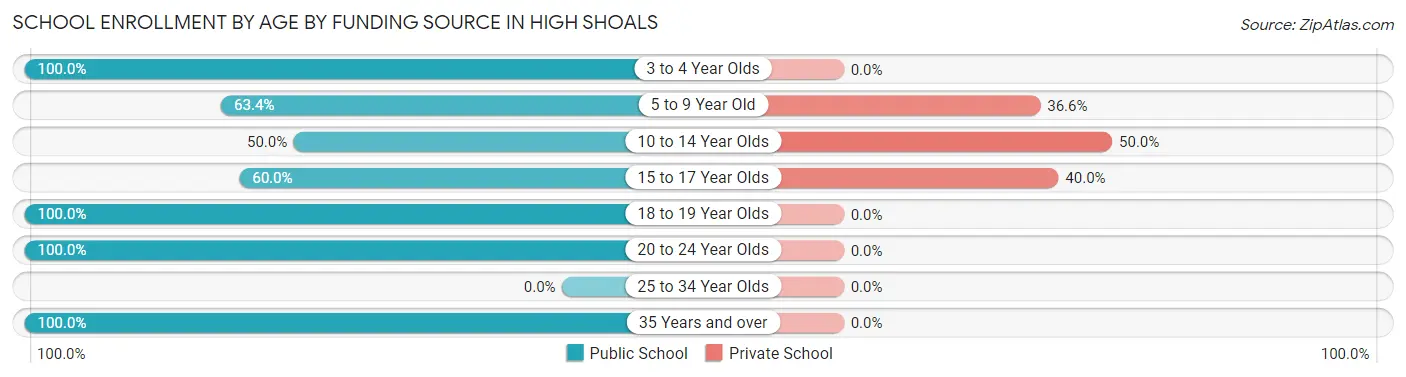
| Age Bracket | Public School | Private School |
| 3 to 4 Year Olds | 18 (100.0%) | 0 (0.0%) |
| 5 to 9 Year Old | 45 (63.4%) | 26 (36.6%) |
| 10 to 14 Year Olds | 18 (50.0%) | 18 (50.0%) |
| 15 to 17 Year Olds | 27 (60.0%) | 18 (40.0%) |
| 18 to 19 Year Olds | 18 (100.0%) | 0 (0.0%) |
| 20 to 24 Year Olds | 8 (100.0%) | 0 (0.0%) |
| 25 to 34 Year Olds | 0 (0.0%) | 0 (0.0%) |
| 35 Years and over | 3 (100.0%) | 0 (0.0%) |
| Total | 137 (68.8%) | 62 (31.2%) |
Educational Attainment by Field of Study in High Shoals
Communications (15 | 31.9%), education (14 | 29.8%), engineering (8 | 17.0%), business (4 | 8.5%), and liberal arts & history (3 | 6.4%) are the most common fields of study among 47 individuals in High Shoals who have obtained a bachelor's degree or higher.
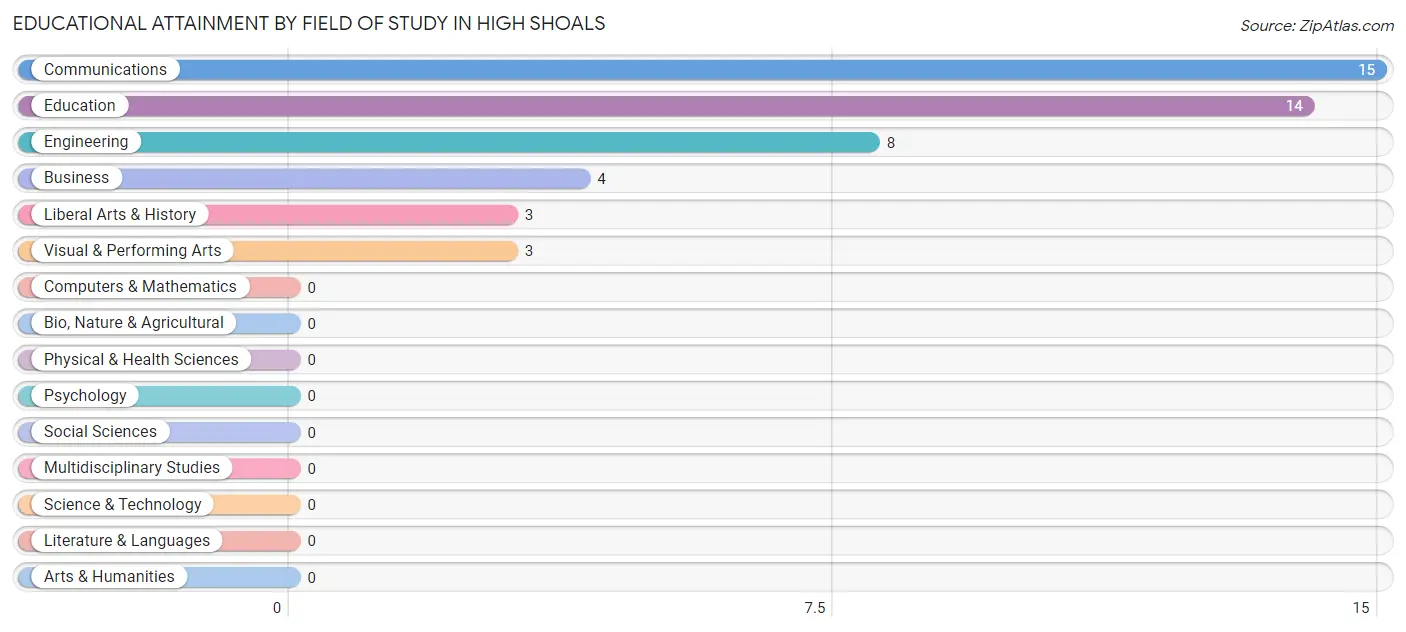
| Field of Study | # Graduates | % Graduates |
| Computers & Mathematics | 0 | 0.0% |
| Bio, Nature & Agricultural | 0 | 0.0% |
| Physical & Health Sciences | 0 | 0.0% |
| Psychology | 0 | 0.0% |
| Social Sciences | 0 | 0.0% |
| Engineering | 8 | 17.0% |
| Multidisciplinary Studies | 0 | 0.0% |
| Science & Technology | 0 | 0.0% |
| Business | 4 | 8.5% |
| Education | 14 | 29.8% |
| Literature & Languages | 0 | 0.0% |
| Liberal Arts & History | 3 | 6.4% |
| Visual & Performing Arts | 3 | 6.4% |
| Communications | 15 | 31.9% |
| Arts & Humanities | 0 | 0.0% |
| Total | 47 | 100.0% |
Transportation & Commute in High Shoals
Vehicle Availability by Sex in High Shoals
The most prevalent vehicle ownership categories in High Shoals are males with 2 vehicles (52, accounting for 41.6%) and females with 2 vehicles (49, making up 40.9%).
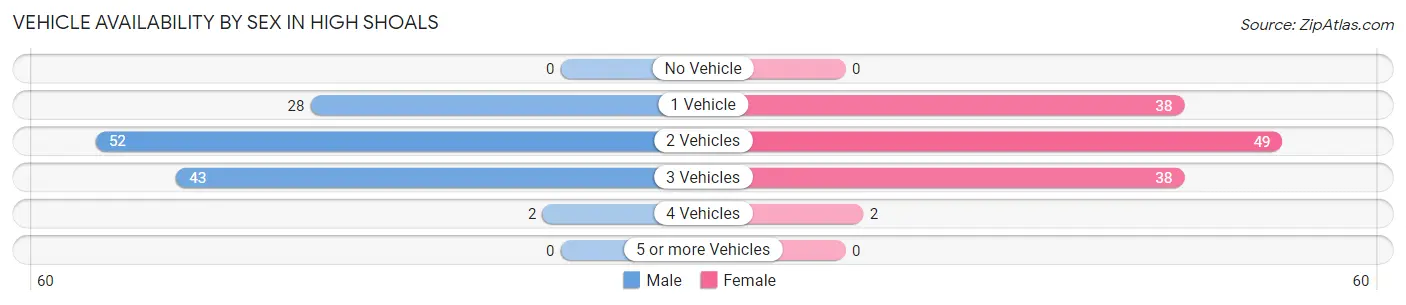
| Vehicles Available | Male | Female |
| No Vehicle | 0 (0.0%) | 0 (0.0%) |
| 1 Vehicle | 28 (22.4%) | 38 (29.9%) |
| 2 Vehicles | 52 (41.6%) | 49 (38.6%) |
| 3 Vehicles | 43 (34.4%) | 38 (29.9%) |
| 4 Vehicles | 2 (1.6%) | 2 (1.6%) |
| 5 or more Vehicles | 0 (0.0%) | 0 (0.0%) |
| Total | 125 (100.0%) | 127 (100.0%) |
Commute Time in High Shoals
The most frequently occuring commute durations in High Shoals are 15 to 19 minutes (67 commuters, 26.6%), 5 to 9 minutes (35 commuters, 13.9%), and 30 to 34 minutes (32 commuters, 12.7%).
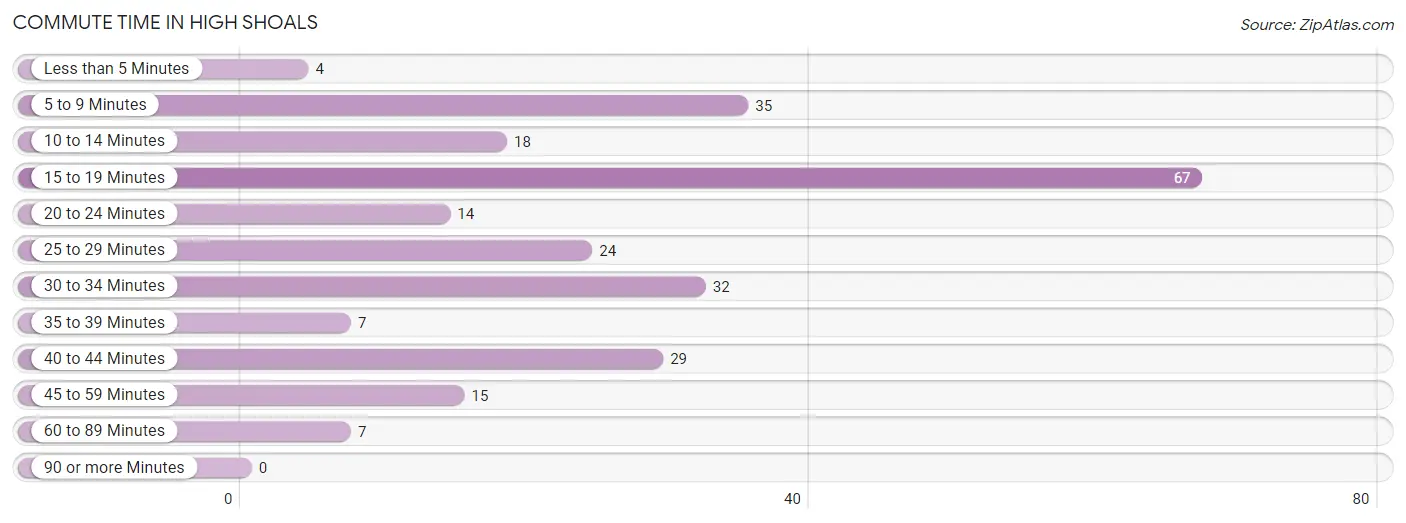
| Commute Time | # Commuters | % Commuters |
| Less than 5 Minutes | 4 | 1.6% |
| 5 to 9 Minutes | 35 | 13.9% |
| 10 to 14 Minutes | 18 | 7.1% |
| 15 to 19 Minutes | 67 | 26.6% |
| 20 to 24 Minutes | 14 | 5.6% |
| 25 to 29 Minutes | 24 | 9.5% |
| 30 to 34 Minutes | 32 | 12.7% |
| 35 to 39 Minutes | 7 | 2.8% |
| 40 to 44 Minutes | 29 | 11.5% |
| 45 to 59 Minutes | 15 | 5.9% |
| 60 to 89 Minutes | 7 | 2.8% |
| 90 or more Minutes | 0 | 0.0% |
Commute Time by Sex in High Shoals
The most common commute times in High Shoals are 5 to 9 minutes (29 commuters, 23.2%) for males and 15 to 19 minutes (54 commuters, 42.5%) for females.
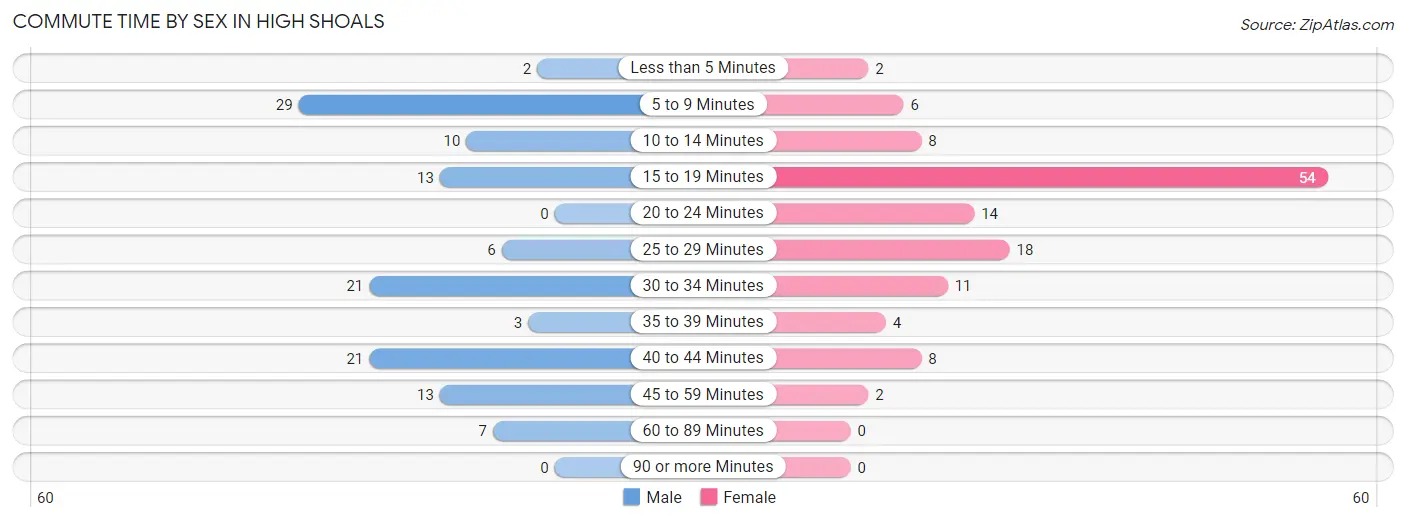
| Commute Time | Male | Female |
| Less than 5 Minutes | 2 (1.6%) | 2 (1.6%) |
| 5 to 9 Minutes | 29 (23.2%) | 6 (4.7%) |
| 10 to 14 Minutes | 10 (8.0%) | 8 (6.3%) |
| 15 to 19 Minutes | 13 (10.4%) | 54 (42.5%) |
| 20 to 24 Minutes | 0 (0.0%) | 14 (11.0%) |
| 25 to 29 Minutes | 6 (4.8%) | 18 (14.2%) |
| 30 to 34 Minutes | 21 (16.8%) | 11 (8.7%) |
| 35 to 39 Minutes | 3 (2.4%) | 4 (3.2%) |
| 40 to 44 Minutes | 21 (16.8%) | 8 (6.3%) |
| 45 to 59 Minutes | 13 (10.4%) | 2 (1.6%) |
| 60 to 89 Minutes | 7 (5.6%) | 0 (0.0%) |
| 90 or more Minutes | 0 (0.0%) | 0 (0.0%) |
Time of Departure to Work by Sex in High Shoals
The most frequent times of departure to work in High Shoals are 5:00 AM to 5:29 AM (38, 30.4%) for males and 7:30 AM to 7:59 AM (33, 26.0%) for females.
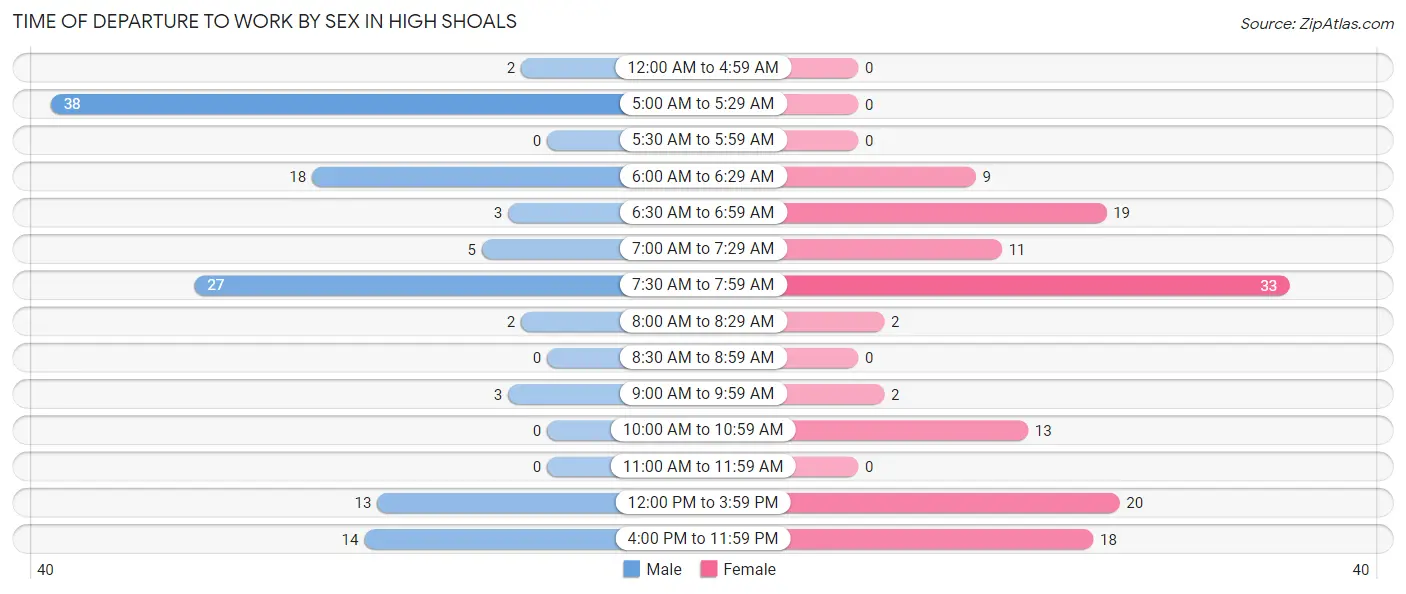
| Time of Departure | Male | Female |
| 12:00 AM to 4:59 AM | 2 (1.6%) | 0 (0.0%) |
| 5:00 AM to 5:29 AM | 38 (30.4%) | 0 (0.0%) |
| 5:30 AM to 5:59 AM | 0 (0.0%) | 0 (0.0%) |
| 6:00 AM to 6:29 AM | 18 (14.4%) | 9 (7.1%) |
| 6:30 AM to 6:59 AM | 3 (2.4%) | 19 (15.0%) |
| 7:00 AM to 7:29 AM | 5 (4.0%) | 11 (8.7%) |
| 7:30 AM to 7:59 AM | 27 (21.6%) | 33 (26.0%) |
| 8:00 AM to 8:29 AM | 2 (1.6%) | 2 (1.6%) |
| 8:30 AM to 8:59 AM | 0 (0.0%) | 0 (0.0%) |
| 9:00 AM to 9:59 AM | 3 (2.4%) | 2 (1.6%) |
| 10:00 AM to 10:59 AM | 0 (0.0%) | 13 (10.2%) |
| 11:00 AM to 11:59 AM | 0 (0.0%) | 0 (0.0%) |
| 12:00 PM to 3:59 PM | 13 (10.4%) | 20 (15.8%) |
| 4:00 PM to 11:59 PM | 14 (11.2%) | 18 (14.2%) |
| Total | 125 (100.0%) | 127 (100.0%) |
Housing Occupancy in High Shoals
Occupancy by Ownership in High Shoals
Of the total 244 dwellings in High Shoals, owner-occupied units account for 135 (55.3%), while renter-occupied units make up 109 (44.7%).
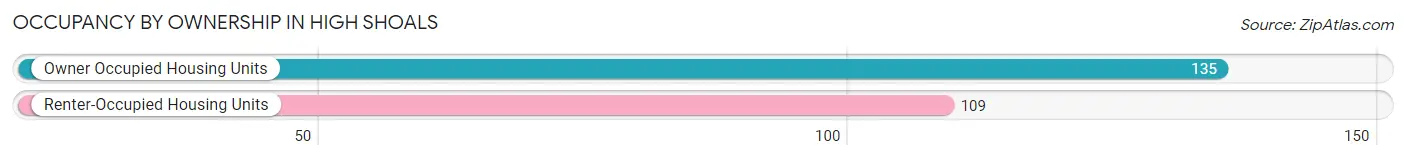
| Occupancy | # Housing Units | % Housing Units |
| Owner Occupied Housing Units | 135 | 55.3% |
| Renter-Occupied Housing Units | 109 | 44.7% |
| Total Occupied Housing Units | 244 | 100.0% |
Occupancy by Household Size in High Shoals
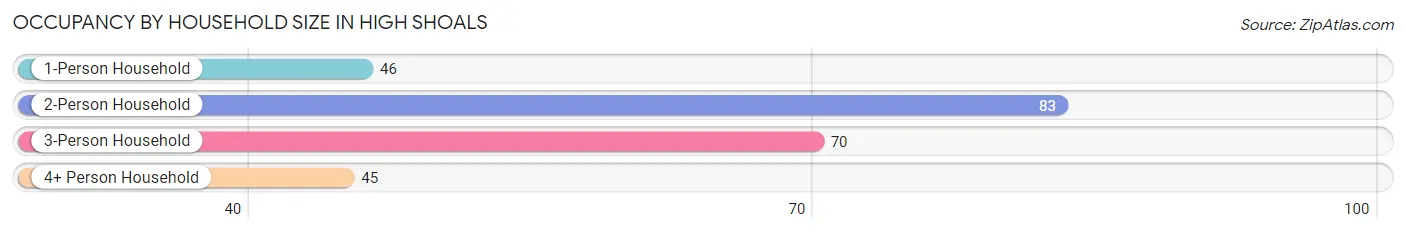
| Household Size | # Housing Units | % Housing Units |
| 1-Person Household | 46 | 18.9% |
| 2-Person Household | 83 | 34.0% |
| 3-Person Household | 70 | 28.7% |
| 4+ Person Household | 45 | 18.4% |
| Total Housing Units | 244 | 100.0% |
Occupancy by Ownership by Household Size in High Shoals
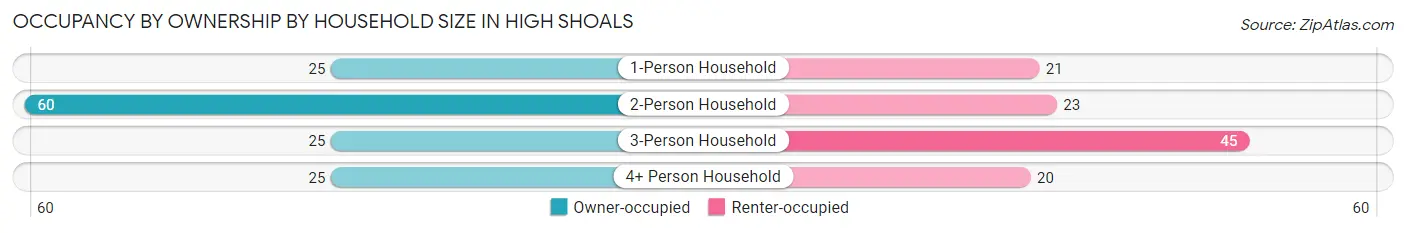
| Household Size | Owner-occupied | Renter-occupied |
| 1-Person Household | 25 (54.3%) | 21 (45.7%) |
| 2-Person Household | 60 (72.3%) | 23 (27.7%) |
| 3-Person Household | 25 (35.7%) | 45 (64.3%) |
| 4+ Person Household | 25 (55.6%) | 20 (44.4%) |
| Total Housing Units | 135 (55.3%) | 109 (44.7%) |
Occupancy by Educational Attainment in High Shoals
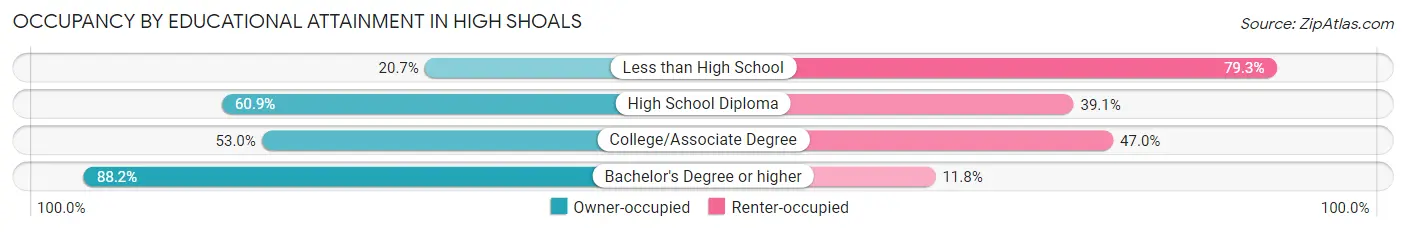
| Household Size | Owner-occupied | Renter-occupied |
| Less than High School | 6 (20.7%) | 23 (79.3%) |
| High School Diploma | 70 (60.9%) | 45 (39.1%) |
| College/Associate Degree | 44 (53.0%) | 39 (47.0%) |
| Bachelor's Degree or higher | 15 (88.2%) | 2 (11.8%) |
Occupancy by Age of Householder in High Shoals
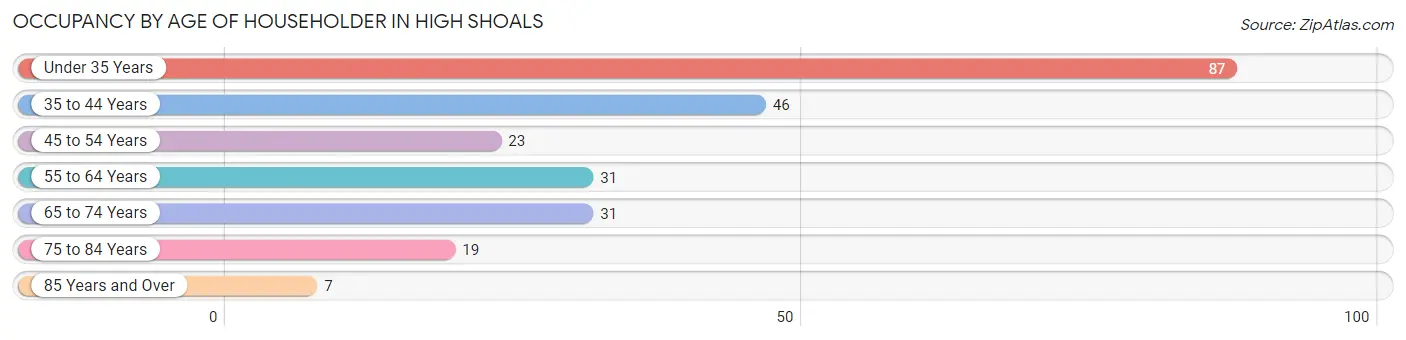
| Age Bracket | # Households | % Households |
| Under 35 Years | 87 | 35.7% |
| 35 to 44 Years | 46 | 18.9% |
| 45 to 54 Years | 23 | 9.4% |
| 55 to 64 Years | 31 | 12.7% |
| 65 to 74 Years | 31 | 12.7% |
| 75 to 84 Years | 19 | 7.8% |
| 85 Years and Over | 7 | 2.9% |
| Total | 244 | 100.0% |
Housing Finances in High Shoals
Median Income by Occupancy in High Shoals
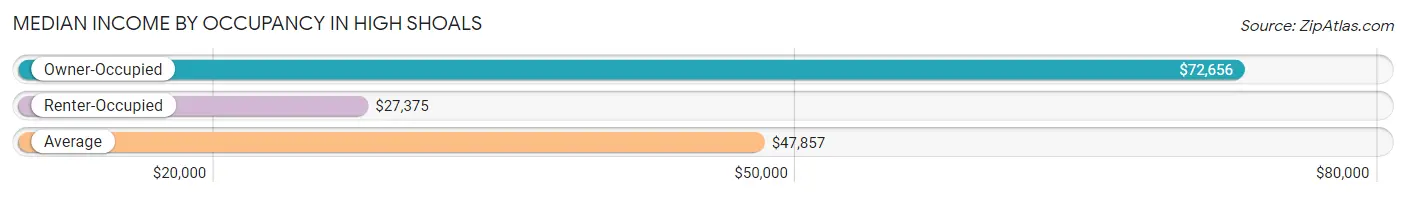
| Occupancy Type | # Households | Median Income |
| Owner-Occupied | 135 (55.3%) | $72,656 |
| Renter-Occupied | 109 (44.7%) | $27,375 |
| Average | 244 (100.0%) | $47,857 |
Occupancy by Householder Income Bracket in High Shoals
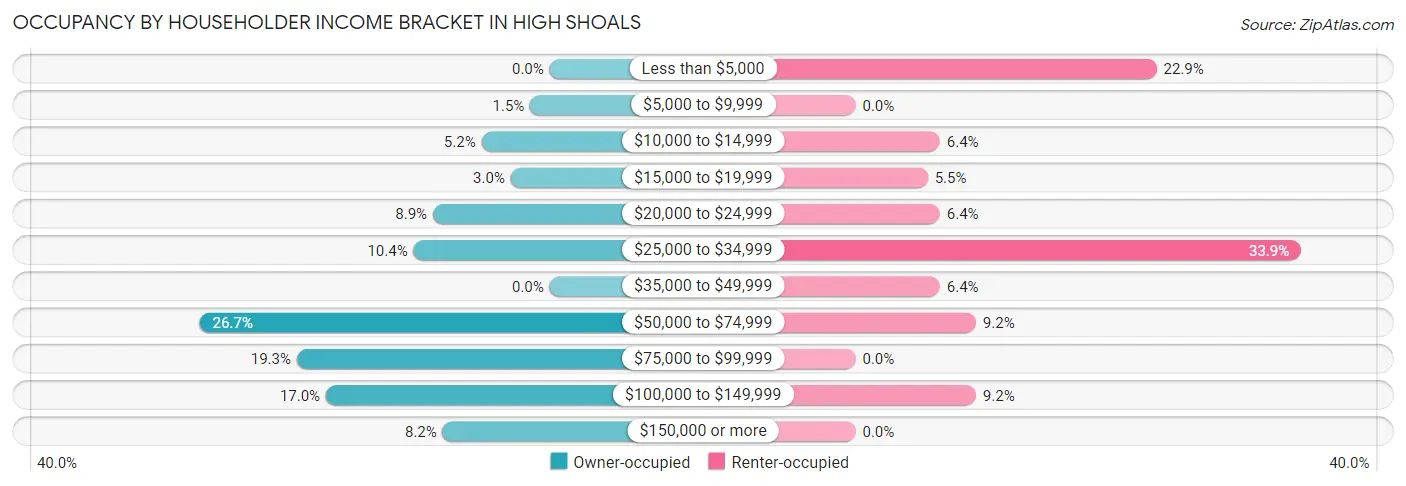
| Income Bracket | Owner-occupied | Renter-occupied |
| Less than $5,000 | 0 (0.0%) | 25 (22.9%) |
| $5,000 to $9,999 | 2 (1.5%) | 0 (0.0%) |
| $10,000 to $14,999 | 7 (5.2%) | 7 (6.4%) |
| $15,000 to $19,999 | 4 (3.0%) | 6 (5.5%) |
| $20,000 to $24,999 | 12 (8.9%) | 7 (6.4%) |
| $25,000 to $34,999 | 14 (10.4%) | 37 (33.9%) |
| $35,000 to $49,999 | 0 (0.0%) | 7 (6.4%) |
| $50,000 to $74,999 | 36 (26.7%) | 10 (9.2%) |
| $75,000 to $99,999 | 26 (19.3%) | 0 (0.0%) |
| $100,000 to $149,999 | 23 (17.0%) | 10 (9.2%) |
| $150,000 or more | 11 (8.2%) | 0 (0.0%) |
| Total | 135 (100.0%) | 109 (100.0%) |
Monthly Housing Cost Tiers in High Shoals
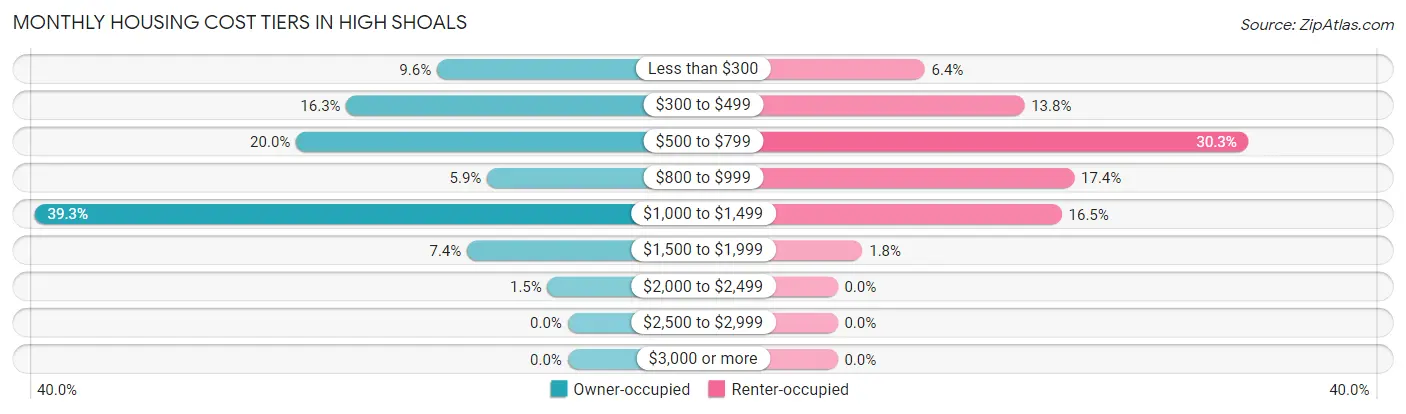
| Monthly Cost | Owner-occupied | Renter-occupied |
| Less than $300 | 13 (9.6%) | 7 (6.4%) |
| $300 to $499 | 22 (16.3%) | 15 (13.8%) |
| $500 to $799 | 27 (20.0%) | 33 (30.3%) |
| $800 to $999 | 8 (5.9%) | 19 (17.4%) |
| $1,000 to $1,499 | 53 (39.3%) | 18 (16.5%) |
| $1,500 to $1,999 | 10 (7.4%) | 2 (1.8%) |
| $2,000 to $2,499 | 2 (1.5%) | 0 (0.0%) |
| $2,500 to $2,999 | 0 (0.0%) | 0 (0.0%) |
| $3,000 or more | 0 (0.0%) | 0 (0.0%) |
| Total | 135 (100.0%) | 109 (100.0%) |
Physical Housing Characteristics in High Shoals
Housing Structures in High Shoals
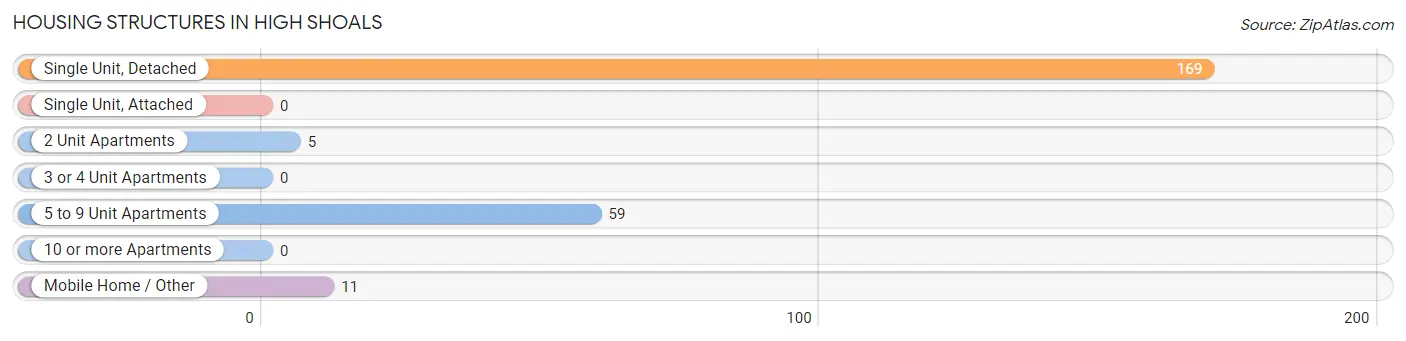
| Structure Type | # Housing Units | % Housing Units |
| Single Unit, Detached | 169 | 69.3% |
| Single Unit, Attached | 0 | 0.0% |
| 2 Unit Apartments | 5 | 2.1% |
| 3 or 4 Unit Apartments | 0 | 0.0% |
| 5 to 9 Unit Apartments | 59 | 24.2% |
| 10 or more Apartments | 0 | 0.0% |
| Mobile Home / Other | 11 | 4.5% |
| Total | 244 | 100.0% |
Housing Structures by Occupancy in High Shoals
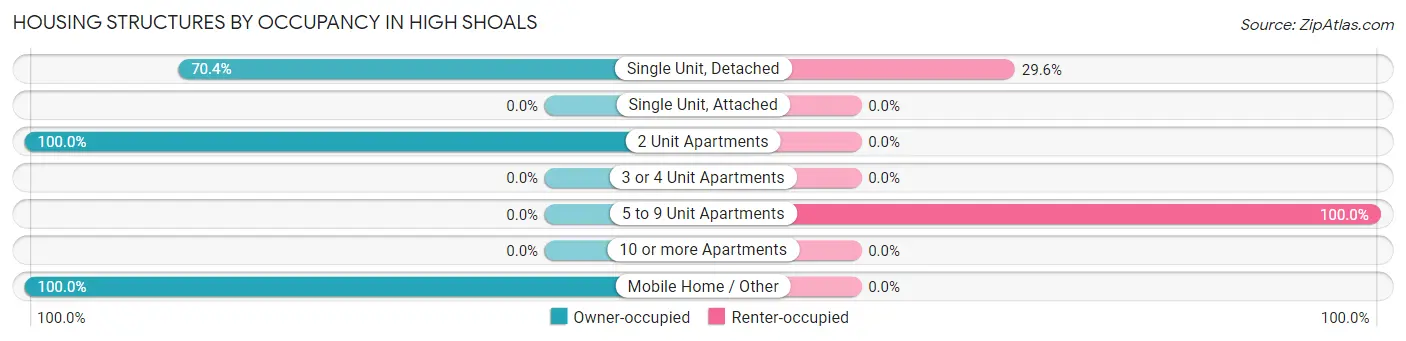
| Structure Type | Owner-occupied | Renter-occupied |
| Single Unit, Detached | 119 (70.4%) | 50 (29.6%) |
| Single Unit, Attached | 0 (0.0%) | 0 (0.0%) |
| 2 Unit Apartments | 5 (100.0%) | 0 (0.0%) |
| 3 or 4 Unit Apartments | 0 (0.0%) | 0 (0.0%) |
| 5 to 9 Unit Apartments | 0 (0.0%) | 59 (100.0%) |
| 10 or more Apartments | 0 (0.0%) | 0 (0.0%) |
| Mobile Home / Other | 11 (100.0%) | 0 (0.0%) |
| Total | 135 (55.3%) | 109 (44.7%) |
Housing Structures by Number of Rooms in High Shoals
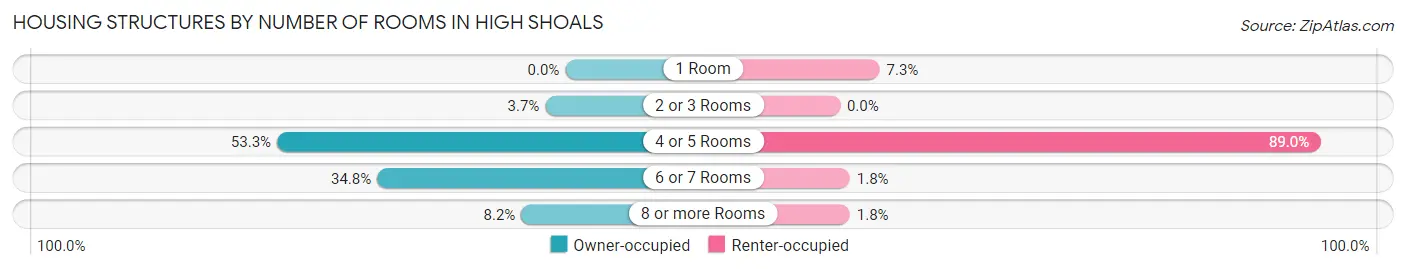
| Number of Rooms | Owner-occupied | Renter-occupied |
| 1 Room | 0 (0.0%) | 8 (7.3%) |
| 2 or 3 Rooms | 5 (3.7%) | 0 (0.0%) |
| 4 or 5 Rooms | 72 (53.3%) | 97 (89.0%) |
| 6 or 7 Rooms | 47 (34.8%) | 2 (1.8%) |
| 8 or more Rooms | 11 (8.2%) | 2 (1.8%) |
| Total | 135 (100.0%) | 109 (100.0%) |
Housing Structure by Heating Type in High Shoals
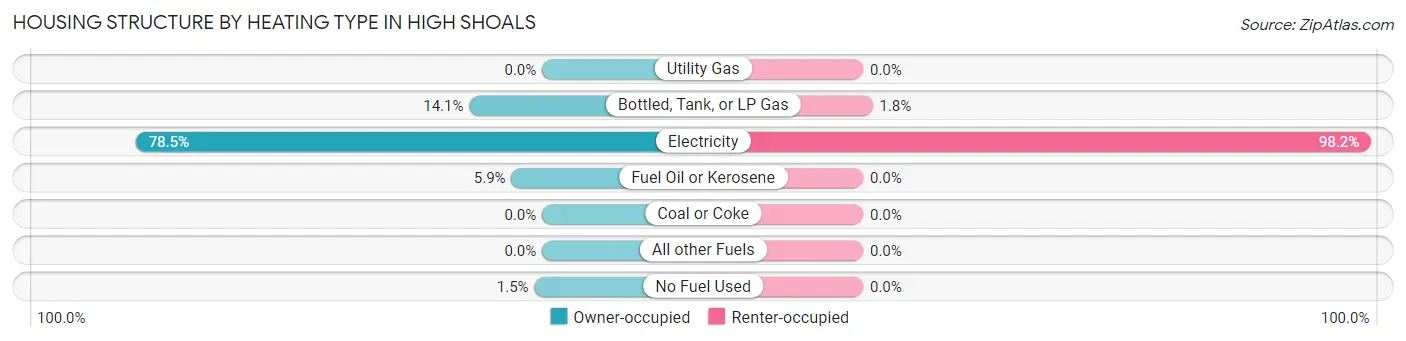
| Heating Type | Owner-occupied | Renter-occupied |
| Utility Gas | 0 (0.0%) | 0 (0.0%) |
| Bottled, Tank, or LP Gas | 19 (14.1%) | 2 (1.8%) |
| Electricity | 106 (78.5%) | 107 (98.2%) |
| Fuel Oil or Kerosene | 8 (5.9%) | 0 (0.0%) |
| Coal or Coke | 0 (0.0%) | 0 (0.0%) |
| All other Fuels | 0 (0.0%) | 0 (0.0%) |
| No Fuel Used | 2 (1.5%) | 0 (0.0%) |
| Total | 135 (100.0%) | 109 (100.0%) |
Household Vehicle Usage in High Shoals
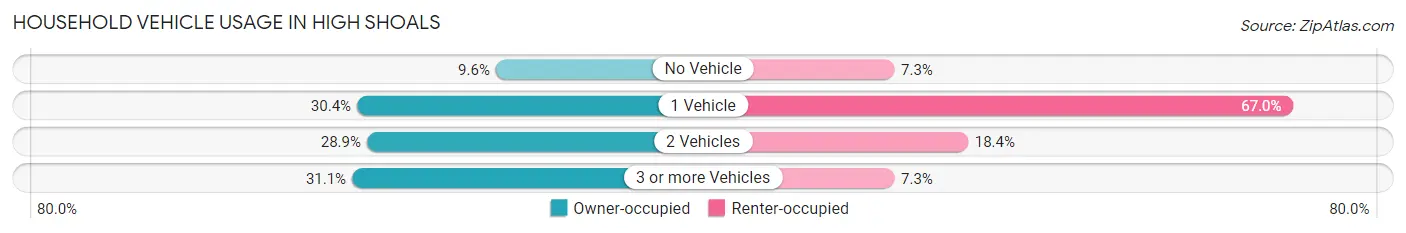
| Vehicles per Household | Owner-occupied | Renter-occupied |
| No Vehicle | 13 (9.6%) | 8 (7.3%) |
| 1 Vehicle | 41 (30.4%) | 73 (67.0%) |
| 2 Vehicles | 39 (28.9%) | 20 (18.3%) |
| 3 or more Vehicles | 42 (31.1%) | 8 (7.3%) |
| Total | 135 (100.0%) | 109 (100.0%) |
Real Estate & Mortgages in High Shoals
Real Estate and Mortgage Overview in High Shoals
| Characteristic | Without Mortgage | With Mortgage |
| Housing Units | 45 | 90 |
| Median Property Value | $102,100 | $131,000 |
| Median Household Income | - | - |
| Monthly Housing Costs | $411 | $0 |
| Real Estate Taxes | $1,327 | $5 |
Property Value by Mortgage Status in High Shoals
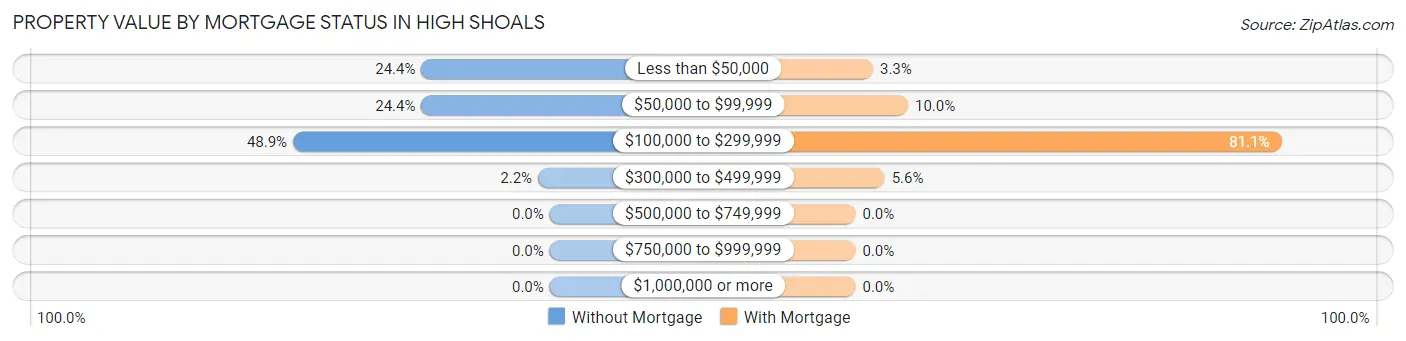
| Property Value | Without Mortgage | With Mortgage |
| Less than $50,000 | 11 (24.4%) | 3 (3.3%) |
| $50,000 to $99,999 | 11 (24.4%) | 9 (10.0%) |
| $100,000 to $299,999 | 22 (48.9%) | 73 (81.1%) |
| $300,000 to $499,999 | 1 (2.2%) | 5 (5.6%) |
| $500,000 to $749,999 | 0 (0.0%) | 0 (0.0%) |
| $750,000 to $999,999 | 0 (0.0%) | 0 (0.0%) |
| $1,000,000 or more | 0 (0.0%) | 0 (0.0%) |
| Total | 45 (100.0%) | 90 (100.0%) |
Household Income by Mortgage Status in High Shoals
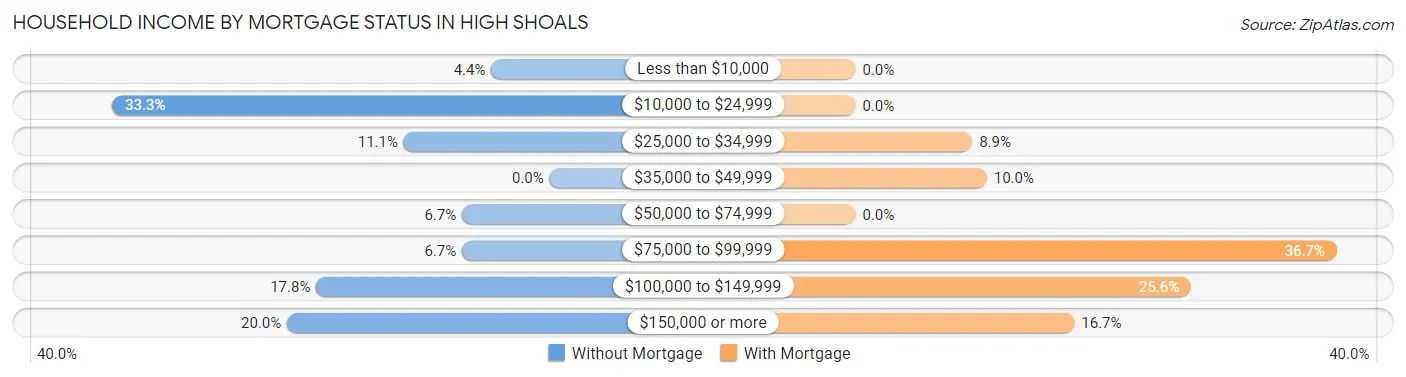
| Household Income | Without Mortgage | With Mortgage |
| Less than $10,000 | 2 (4.4%) | 0 (0.0%) |
| $10,000 to $24,999 | 15 (33.3%) | 0 (0.0%) |
| $25,000 to $34,999 | 5 (11.1%) | 8 (8.9%) |
| $35,000 to $49,999 | 0 (0.0%) | 9 (10.0%) |
| $50,000 to $74,999 | 3 (6.7%) | 0 (0.0%) |
| $75,000 to $99,999 | 3 (6.7%) | 33 (36.7%) |
| $100,000 to $149,999 | 8 (17.8%) | 23 (25.6%) |
| $150,000 or more | 9 (20.0%) | 15 (16.7%) |
| Total | 45 (100.0%) | 90 (100.0%) |
Property Value to Household Income Ratio in High Shoals
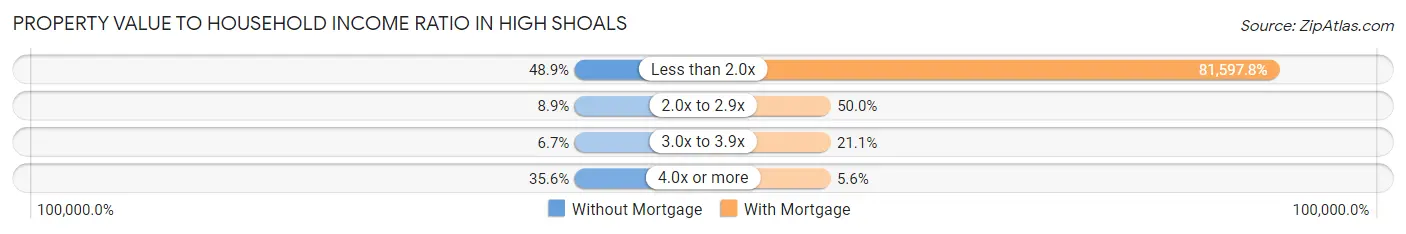
| Value-to-Income Ratio | Without Mortgage | With Mortgage |
| Less than 2.0x | 22 (48.9%) | 73,438 (81,597.8%) |
| 2.0x to 2.9x | 4 (8.9%) | 45 (50.0%) |
| 3.0x to 3.9x | 3 (6.7%) | 19 (21.1%) |
| 4.0x or more | 16 (35.6%) | 5 (5.6%) |
| Total | 45 (100.0%) | 90 (100.0%) |
Real Estate Taxes by Mortgage Status in High Shoals
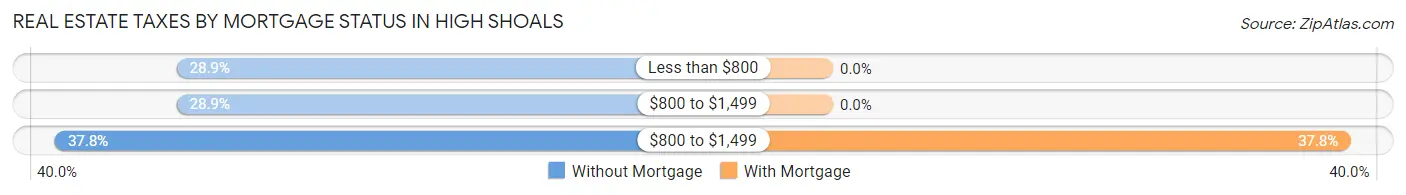
| Property Taxes | Without Mortgage | With Mortgage |
| Less than $800 | 13 (28.9%) | 0 (0.0%) |
| $800 to $1,499 | 13 (28.9%) | 0 (0.0%) |
| $800 to $1,499 | 17 (37.8%) | 34 (37.8%) |
| Total | 45 (100.0%) | 90 (100.0%) |
Health & Disability in High Shoals
Health Insurance Coverage by Age in High Shoals
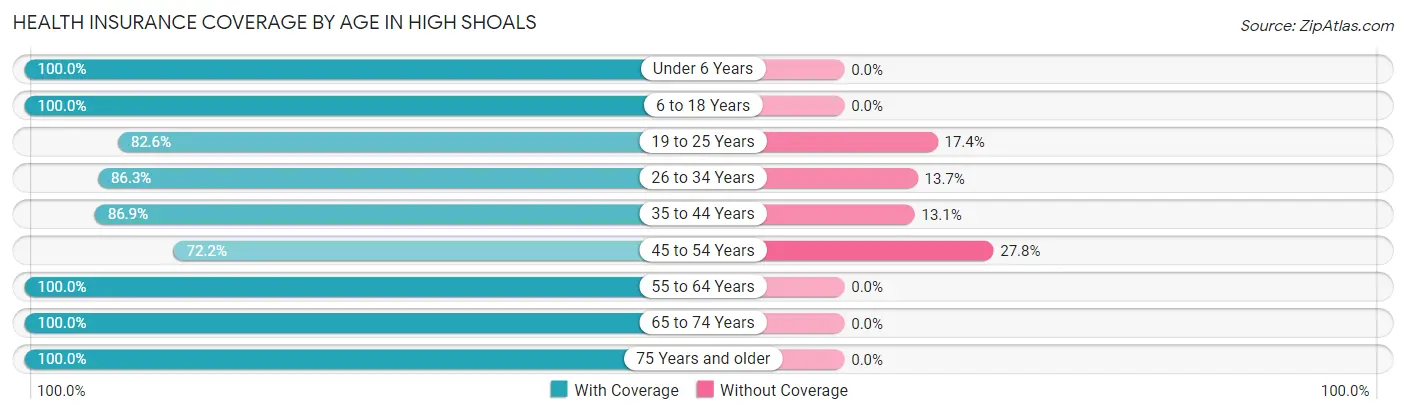
| Age Bracket | With Coverage | Without Coverage |
| Under 6 Years | 95 (100.0%) | 0 (0.0%) |
| 6 to 18 Years | 170 (100.0%) | 0 (0.0%) |
| 19 to 25 Years | 38 (82.6%) | 8 (17.4%) |
| 26 to 34 Years | 82 (86.3%) | 13 (13.7%) |
| 35 to 44 Years | 73 (86.9%) | 11 (13.1%) |
| 45 to 54 Years | 39 (72.2%) | 15 (27.8%) |
| 55 to 64 Years | 59 (100.0%) | 0 (0.0%) |
| 65 to 74 Years | 43 (100.0%) | 0 (0.0%) |
| 75 Years and older | 29 (100.0%) | 0 (0.0%) |
| Total | 628 (93.0%) | 47 (7.0%) |
Health Insurance Coverage by Citizenship Status in High Shoals
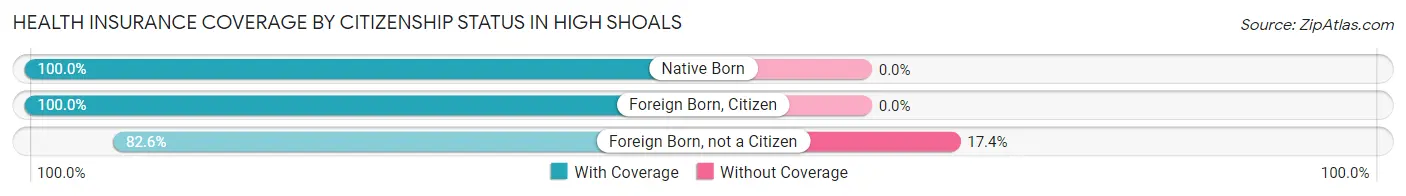
| Citizenship Status | With Coverage | Without Coverage |
| Native Born | 95 (100.0%) | 0 (0.0%) |
| Foreign Born, Citizen | 170 (100.0%) | 0 (0.0%) |
| Foreign Born, not a Citizen | 38 (82.6%) | 8 (17.4%) |
Health Insurance Coverage by Household Income in High Shoals
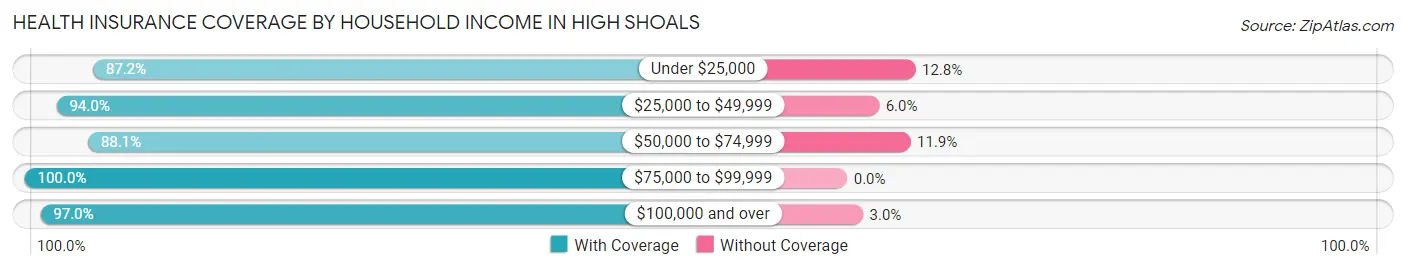
| Household Income | With Coverage | Without Coverage |
| Under $25,000 | 116 (87.2%) | 17 (12.8%) |
| $25,000 to $49,999 | 173 (94.0%) | 11 (6.0%) |
| $50,000 to $74,999 | 104 (88.1%) | 14 (11.9%) |
| $75,000 to $99,999 | 71 (100.0%) | 0 (0.0%) |
| $100,000 and over | 164 (97.0%) | 5 (3.0%) |
Public vs Private Health Insurance Coverage by Age in High Shoals
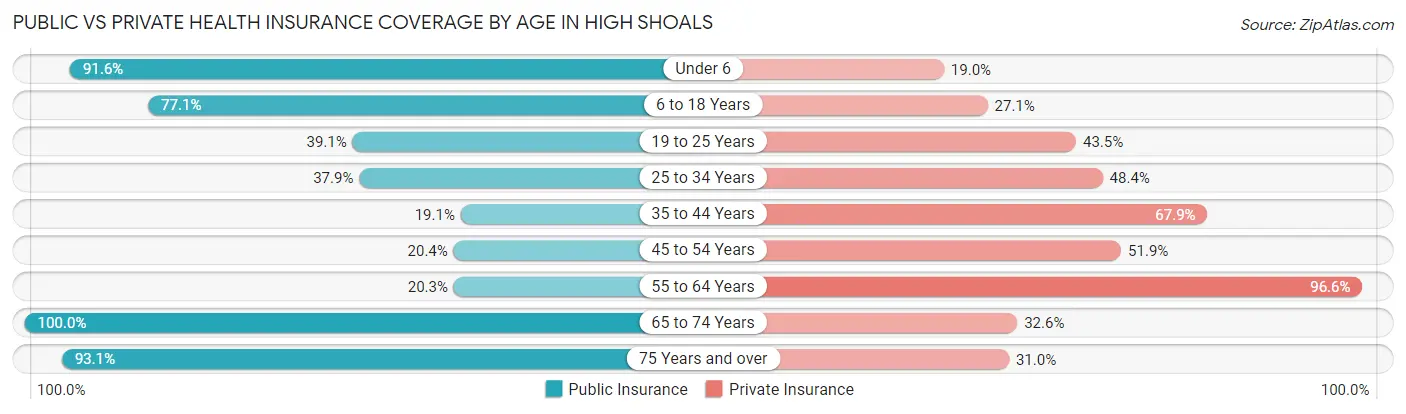
| Age Bracket | Public Insurance | Private Insurance |
| Under 6 | 87 (91.6%) | 18 (19.0%) |
| 6 to 18 Years | 131 (77.1%) | 46 (27.1%) |
| 19 to 25 Years | 18 (39.1%) | 20 (43.5%) |
| 25 to 34 Years | 36 (37.9%) | 46 (48.4%) |
| 35 to 44 Years | 16 (19.1%) | 57 (67.9%) |
| 45 to 54 Years | 11 (20.4%) | 28 (51.8%) |
| 55 to 64 Years | 12 (20.3%) | 57 (96.6%) |
| 65 to 74 Years | 43 (100.0%) | 14 (32.6%) |
| 75 Years and over | 27 (93.1%) | 9 (31.0%) |
| Total | 381 (56.4%) | 295 (43.7%) |
Disability Status by Sex by Age in High Shoals
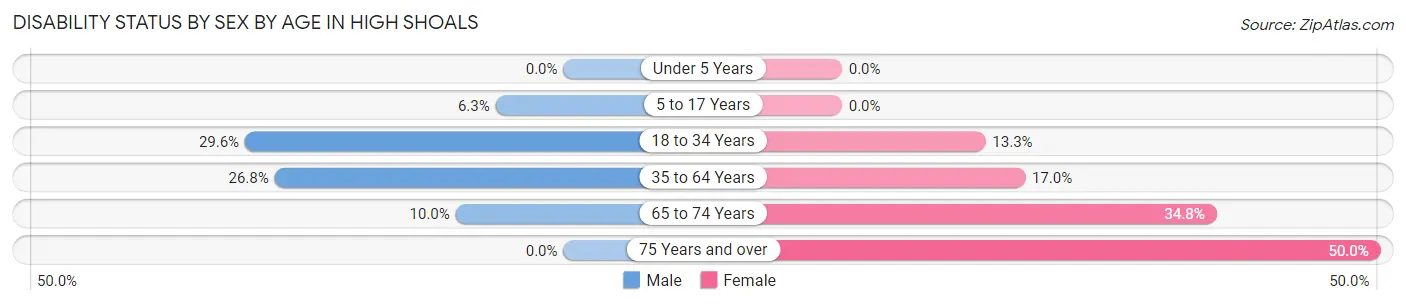
| Age Bracket | Male | Female |
| Under 5 Years | 0 (0.0%) | 0 (0.0%) |
| 5 to 17 Years | 9 (6.3%) | 0 (0.0%) |
| 18 to 34 Years | 13 (29.5%) | 14 (13.3%) |
| 35 to 64 Years | 26 (26.8%) | 17 (17.0%) |
| 65 to 74 Years | 2 (10.0%) | 8 (34.8%) |
| 75 Years and over | 0 (0.0%) | 13 (50.0%) |
Disability Class by Sex by Age in High Shoals
Disability Class: Hearing Difficulty
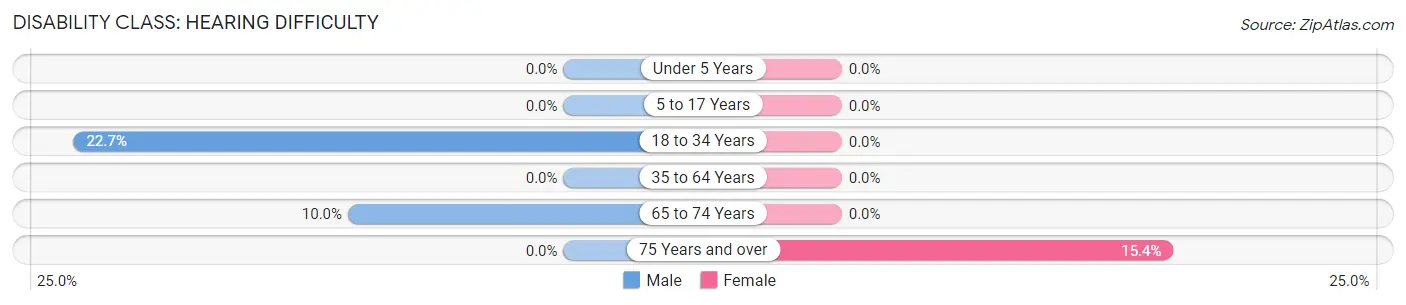
| Age Bracket | Male | Female |
| Under 5 Years | 0 (0.0%) | 0 (0.0%) |
| 5 to 17 Years | 0 (0.0%) | 0 (0.0%) |
| 18 to 34 Years | 10 (22.7%) | 0 (0.0%) |
| 35 to 64 Years | 0 (0.0%) | 0 (0.0%) |
| 65 to 74 Years | 2 (10.0%) | 0 (0.0%) |
| 75 Years and over | 0 (0.0%) | 4 (15.4%) |
Disability Class: Vision Difficulty
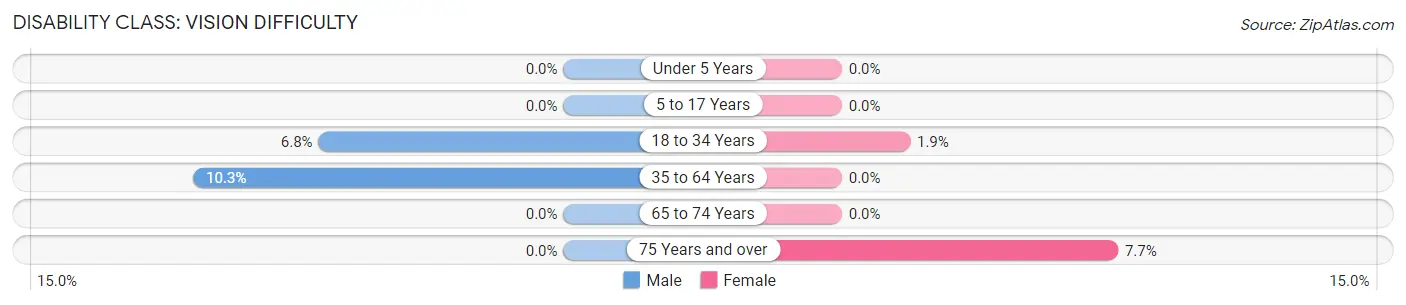
| Age Bracket | Male | Female |
| Under 5 Years | 0 (0.0%) | 0 (0.0%) |
| 5 to 17 Years | 0 (0.0%) | 0 (0.0%) |
| 18 to 34 Years | 3 (6.8%) | 2 (1.9%) |
| 35 to 64 Years | 10 (10.3%) | 0 (0.0%) |
| 65 to 74 Years | 0 (0.0%) | 0 (0.0%) |
| 75 Years and over | 0 (0.0%) | 2 (7.7%) |
Disability Class: Cognitive Difficulty
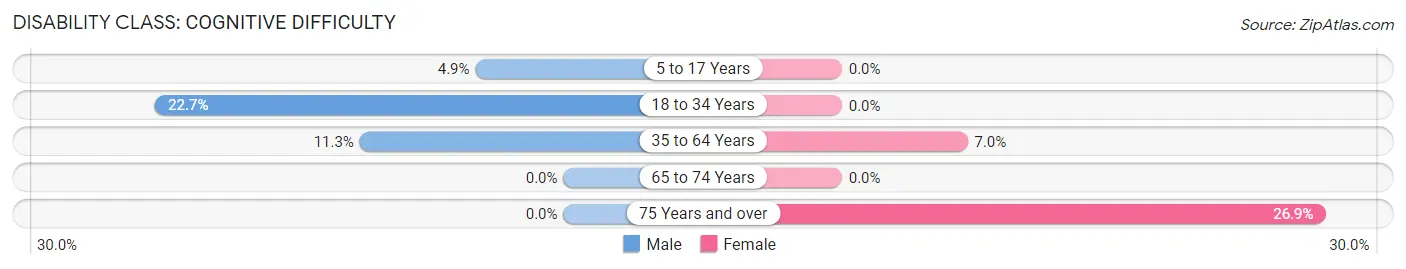
| Age Bracket | Male | Female |
| 5 to 17 Years | 7 (4.9%) | 0 (0.0%) |
| 18 to 34 Years | 10 (22.7%) | 0 (0.0%) |
| 35 to 64 Years | 11 (11.3%) | 7 (7.0%) |
| 65 to 74 Years | 0 (0.0%) | 0 (0.0%) |
| 75 Years and over | 0 (0.0%) | 7 (26.9%) |
Disability Class: Ambulatory Difficulty
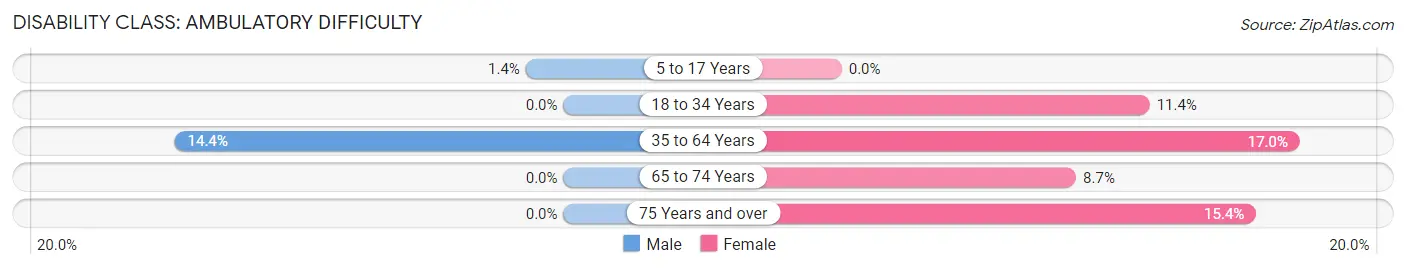
| Age Bracket | Male | Female |
| 5 to 17 Years | 2 (1.4%) | 0 (0.0%) |
| 18 to 34 Years | 0 (0.0%) | 12 (11.4%) |
| 35 to 64 Years | 14 (14.4%) | 17 (17.0%) |
| 65 to 74 Years | 0 (0.0%) | 2 (8.7%) |
| 75 Years and over | 0 (0.0%) | 4 (15.4%) |
Disability Class: Self-Care Difficulty
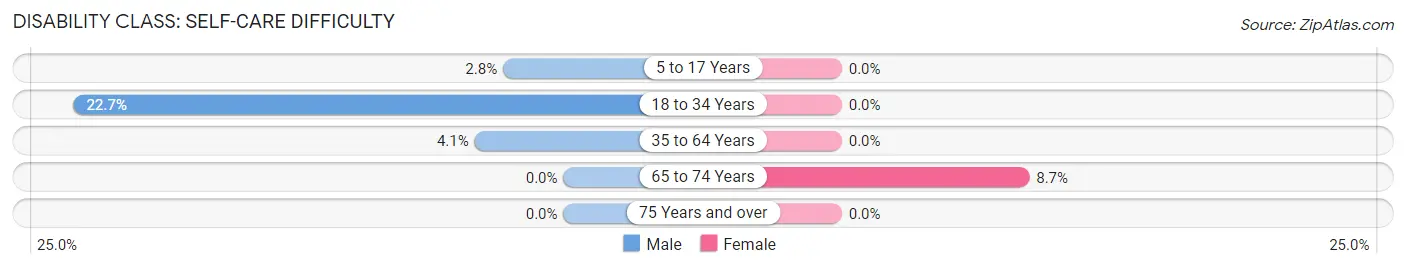
| Age Bracket | Male | Female |
| 5 to 17 Years | 4 (2.8%) | 0 (0.0%) |
| 18 to 34 Years | 10 (22.7%) | 0 (0.0%) |
| 35 to 64 Years | 4 (4.1%) | 0 (0.0%) |
| 65 to 74 Years | 0 (0.0%) | 2 (8.7%) |
| 75 Years and over | 0 (0.0%) | 0 (0.0%) |
Technology Access in High Shoals
Computing Device Access in High Shoals
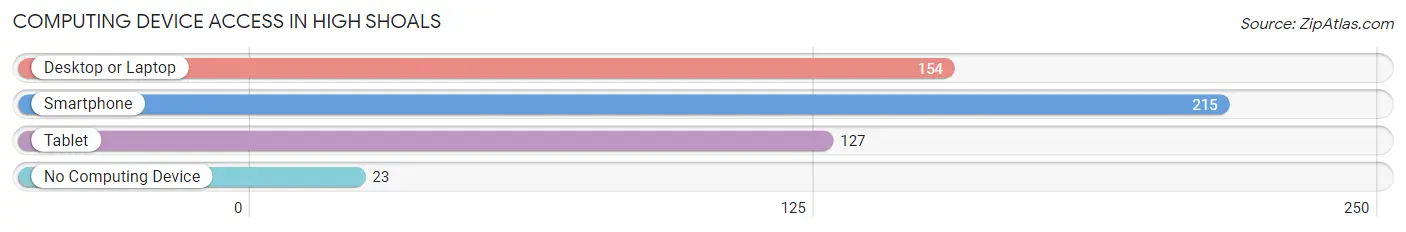
| Device Type | # Households | % Households |
| Desktop or Laptop | 154 | 63.1% |
| Smartphone | 215 | 88.1% |
| Tablet | 127 | 52.0% |
| No Computing Device | 23 | 9.4% |
| Total | 244 | 100.0% |
Internet Access in High Shoals
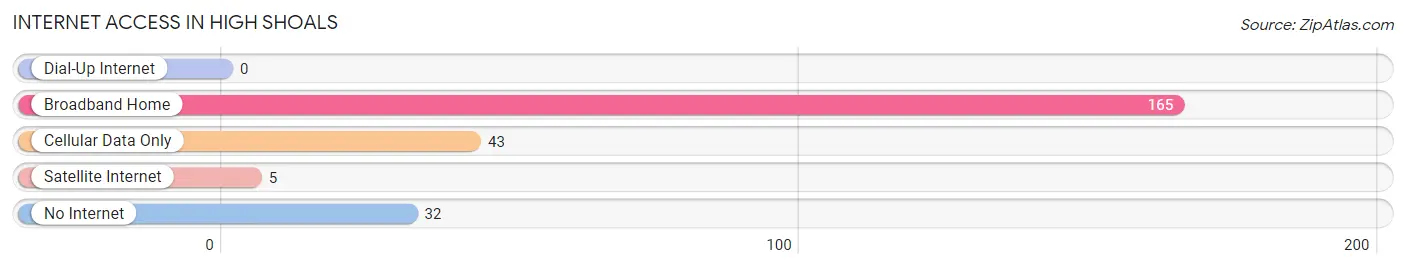
| Internet Type | # Households | % Households |
| Dial-Up Internet | 0 | 0.0% |
| Broadband Home | 165 | 67.6% |
| Cellular Data Only | 43 | 17.6% |
| Satellite Internet | 5 | 2.1% |
| No Internet | 32 | 13.1% |
| Total | 244 | 100.0% |
High Shoals Summary
History
High Shoals is a small town located in Gaston County, North Carolina. It was first settled in the late 1700s by a group of German immigrants who were looking for a place to call home. The town was originally known as “High Shoals of the Catawba” due to its location on the Catawba River. The town was officially incorporated in 1891 and has since grown to a population of around 1,000 people.
High Shoals has a rich history that is closely tied to the textile industry. The town was home to several cotton mills, which were the main source of employment for many of the town’s residents. The mills provided jobs for hundreds of people and helped to shape the town’s economy. The town also had a thriving business district, which included a variety of stores and businesses.
High Shoals was also home to a number of churches, including the High Shoals Baptist Church, which was founded in 1891. The church is still active today and is a major part of the town’s history.
Geography
High Shoals is located in the foothills of the Blue Ridge Mountains in western North Carolina. The town is situated on the Catawba River, which provides a scenic backdrop for the town. The town is surrounded by rolling hills and lush forests, making it a popular destination for outdoor activities such as hiking, camping, and fishing.
The town is located approximately 30 miles west of Charlotte and is easily accessible by car. The nearest major airport is Charlotte Douglas International Airport, which is located about an hour away.
Economy
High Shoals’ economy is largely based on the textile industry. The town is home to several cotton mills, which provide jobs for many of the town’s residents. The mills are the main source of employment for the town and have helped to shape the town’s economy.
The town also has a thriving business district, which includes a variety of stores and businesses. The town is also home to a number of churches, which provide a variety of services to the community.
Demographics
As of the 2010 census, High Shoals had a population of 1,000 people. The town is predominantly white, with a small African American population. The median household income is $35,000, and the median age is 40 years old. The town has a low unemployment rate and a high rate of homeownership.
High Shoals is a small town with a rich history and a vibrant economy. The town is home to a variety of businesses and churches, and is a popular destination for outdoor activities. The town’s economy is largely based on the textile industry, and the town has a low unemployment rate and a high rate of homeownership. High Shoals is a great place to live and work, and is a great example of a small town in North Carolina.
Common Questions
What is Per Capita Income in High Shoals?
Per Capita income in High Shoals is $21,706.
What is the Median Family Income in High Shoals?
Median Family Income in High Shoals is $58,152.
What is the Median Household income in High Shoals?
Median Household Income in High Shoals is $47,857.
What is Income or Wage Gap in High Shoals?
Income or Wage Gap in High Shoals is 47.0%.
Women in High Shoals earn 53.0 cents for every dollar earned by a man.
What is Inequality or Gini Index in High Shoals?
Inequality or Gini Index in High Shoals is 0.45.
What is the Total Population of High Shoals?
Total Population of High Shoals is 675.
What is the Total Male Population of High Shoals?
Total Male Population of High Shoals is 354.
What is the Total Female Population of High Shoals?
Total Female Population of High Shoals is 321.
What is the Ratio of Males per 100 Females in High Shoals?
There are 110.28 Males per 100 Females in High Shoals.
What is the Ratio of Females per 100 Males in High Shoals?
There are 90.68 Females per 100 Males in High Shoals.
What is the Median Population Age in High Shoals?
Median Population Age in High Shoals is 30.5 Years.
What is the Average Family Size in High Shoals
Average Family Size in High Shoals is 3.1 People.
What is the Average Household Size in High Shoals
Average Household Size in High Shoals is 2.8 People.
How Large is the Labor Force in High Shoals?
There are 260 People in the Labor Forcein in High Shoals.
What is the Percentage of People in the Labor Force in High Shoals?
59.0% of People are in the Labor Force in High Shoals.
What is the Unemployment Rate in High Shoals?
Unemployment Rate in High Shoals is 3.1%.