Cities with the Highest Percentage of Population with a Degree in Computers and Mathematics in Oklahoma
RELATED REPORTS & OPTIONS
Computers and Mathematics
Oklahoma
Compare Cities
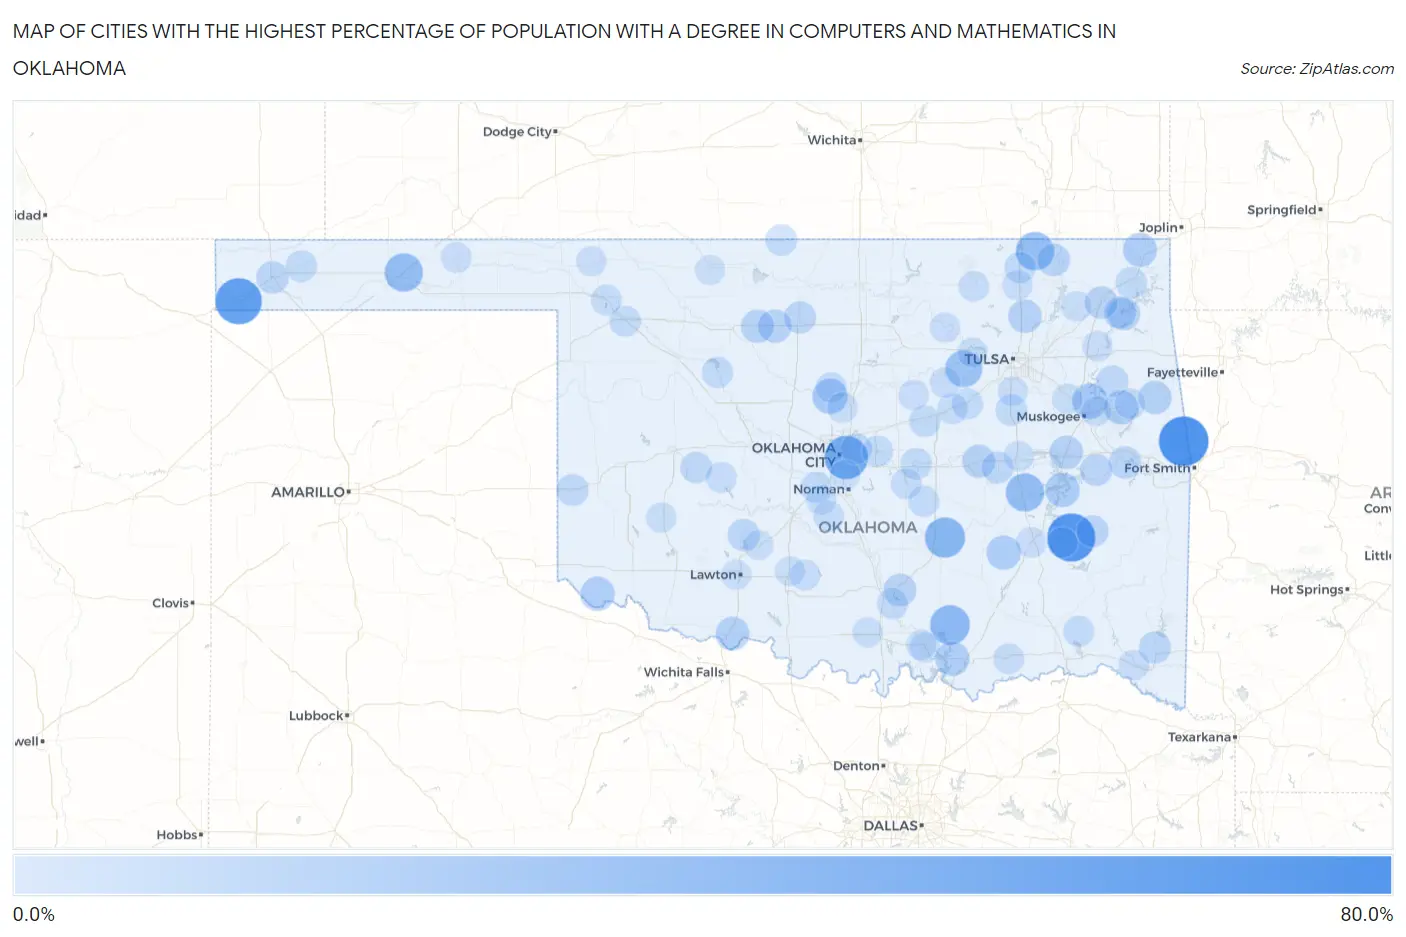
Map of Cities with the Highest Percentage of Population with a Degree in Computers and Mathematics in Oklahoma
0.0%
80.0%
Cities with the Highest Percentage of Population with a Degree in Computers and Mathematics in Oklahoma
| City | % Graduates | vs State | vs National | |
| 1. | Short | 71.4% | 3.4%(+68.0)#1 | 4.9%(+66.5)#52 |
| 2. | Gowen | 66.7% | 3.4%(+63.2)#2 | 4.9%(+61.8)#58 |
| 3. | Felt | 60.0% | 3.4%(+56.6)#3 | 4.9%(+55.1)#72 |
| 4. | Smith Village | 50.0% | 3.4%(+46.6)#4 | 4.9%(+45.1)#114 |
| 5. | Francis | 39.5% | 3.4%(+36.1)#5 | 4.9%(+34.6)#172 |
| 6. | Milburn | 37.5% | 3.4%(+34.1)#6 | 4.9%(+32.6)#192 |
| 7. | Optima | 33.3% | 3.4%(+29.9)#7 | 4.9%(+28.4)#238 |
| 8. | Wann | 33.3% | 3.4%(+29.9)#8 | 4.9%(+28.4)#247 |
| 9. | Hanna | 33.3% | 3.4%(+29.9)#9 | 4.9%(+28.4)#250 |
| 10. | Earl | 33.3% | 3.4%(+29.9)#10 | 4.9%(+28.4)#251 |
| 11. | Little Ponderosa | 30.0% | 3.4%(+26.6)#11 | 4.9%(+25.1)#289 |
| 12. | Lawrence Creek | 28.6% | 3.4%(+25.1)#12 | 4.9%(+23.7)#316 |
| 13. | Caney Ridge | 27.3% | 3.4%(+23.8)#13 | 4.9%(+22.4)#354 |
| 14. | Okay | 23.1% | 3.4%(+19.6)#14 | 4.9%(+18.2)#475 |
| 15. | Cimarron City | 23.1% | 3.4%(+19.6)#15 | 4.9%(+18.2)#480 |
| 16. | Ashland | 20.0% | 3.4%(+16.6)#16 | 4.9%(+15.1)#623 |
| 17. | Carlton Landing | 20.0% | 3.4%(+16.6)#17 | 4.9%(+15.1)#625 |
| 18. | Eldorado | 19.2% | 3.4%(+15.8)#18 | 4.9%(+14.3)#661 |
| 19. | Zeb | 19.1% | 3.4%(+15.7)#19 | 4.9%(+14.2)#667 |
| 20. | Pickett | 18.8% | 3.4%(+15.3)#20 | 4.9%(+13.9)#684 |
| 21. | Mead | 18.8% | 3.4%(+15.3)#21 | 4.9%(+13.9)#686 |
| 22. | North Miami | 18.8% | 3.4%(+15.3)#22 | 4.9%(+13.9)#688 |
| 23. | Randlett | 17.9% | 3.4%(+14.4)#23 | 4.9%(+13.0)#762 |
| 24. | Checotah | 17.2% | 3.4%(+13.7)#24 | 4.9%(+12.3)#811 |
| 25. | Vera | 16.9% | 3.4%(+13.4)#25 | 4.9%(+12.0)#846 |
| 26. | Titanic | 16.7% | 3.4%(+13.2)#26 | 4.9%(+11.8)#858 |
| 27. | Lahoma | 16.2% | 3.4%(+12.7)#27 | 4.9%(+11.3)#908 |
| 28. | Ringwood | 16.1% | 3.4%(+12.7)#28 | 4.9%(+11.2)#913 |
| 29. | Okemah | 15.8% | 3.4%(+12.4)#29 | 4.9%(+11.0)#947 |
| 30. | Disney | 15.0% | 3.4%(+11.6)#30 | 4.9%(+10.1)#1,047 |
| 31. | Sulphur | 14.6% | 3.4%(+11.2)#31 | 4.9%(+9.73)#1,075 |
| 32. | Lenapah | 14.3% | 3.4%(+10.8)#32 | 4.9%(+9.39)#1,126 |
| 33. | Big Cabin | 14.3% | 3.4%(+10.8)#33 | 4.9%(+9.39)#1,132 |
| 34. | Tamaha | 13.6% | 3.4%(+10.2)#34 | 4.9%(+8.74)#1,218 |
| 35. | Langley | 13.3% | 3.4%(+9.89)#35 | 4.9%(+8.44)#1,263 |
| 36. | Boise City | 13.3% | 3.4%(+9.83)#36 | 4.9%(+8.38)#1,284 |
| 37. | Porum | 13.0% | 3.4%(+9.60)#37 | 4.9%(+8.15)#1,328 |
| 38. | Broken Bow | 13.0% | 3.4%(+9.52)#38 | 4.9%(+8.08)#1,342 |
| 39. | North Enid | 12.8% | 3.4%(+9.37)#39 | 4.9%(+7.93)#1,367 |
| 40. | Apache | 12.5% | 3.4%(+9.05)#40 | 4.9%(+7.61)#1,424 |
| 41. | Wilburton | 12.2% | 3.4%(+8.79)#41 | 4.9%(+7.34)#1,483 |
| 42. | Weleetka | 12.0% | 3.4%(+8.55)#42 | 4.9%(+7.11)#1,522 |
| 43. | Erick | 12.0% | 3.4%(+8.55)#43 | 4.9%(+7.11)#1,525 |
| 44. | Lost City | 11.5% | 3.4%(+8.06)#44 | 4.9%(+6.62)#1,648 |
| 45. | Corn | 11.1% | 3.4%(+7.66)#45 | 4.9%(+6.22)#1,738 |
| 46. | Beggs | 10.6% | 3.4%(+7.19)#46 | 4.9%(+5.74)#1,896 |
| 47. | Keyes | 10.5% | 3.4%(+7.08)#47 | 4.9%(+5.63)#1,948 |
| 48. | Manchester | 10.5% | 3.4%(+7.08)#48 | 4.9%(+5.63)#1,950 |
| 49. | Bridge Creek | 10.4% | 3.4%(+6.97)#49 | 4.9%(+5.52)#1,976 |
| 50. | Dewey | 10.3% | 3.4%(+6.80)#50 | 4.9%(+5.36)#2,041 |
| 51. | Johnson | 10.2% | 3.4%(+6.76)#51 | 4.9%(+5.31)#2,052 |
| 52. | Davenport | 10.2% | 3.4%(+6.76)#52 | 4.9%(+5.31)#2,053 |
| 53. | Canton | 10.2% | 3.4%(+6.72)#53 | 4.9%(+5.28)#2,072 |
| 54. | Afton | 10.0% | 3.4%(+6.55)#54 | 4.9%(+5.11)#2,132 |
| 55. | White Eagle | 10.0% | 3.4%(+6.55)#55 | 4.9%(+5.11)#2,142 |
| 56. | Barber | 9.7% | 3.4%(+6.23)#56 | 4.9%(+4.78)#2,283 |
| 57. | Bristow | 9.5% | 3.4%(+6.02)#57 | 4.9%(+4.57)#2,390 |
| 58. | Spencer | 9.4% | 3.4%(+5.92)#58 | 4.9%(+4.48)#2,442 |
| 59. | Harrah | 9.1% | 3.4%(+5.70)#59 | 4.9%(+4.26)#2,538 |
| 60. | Maud | 9.1% | 3.4%(+5.64)#60 | 4.9%(+4.20)#2,568 |
| 61. | Rattan | 9.1% | 3.4%(+5.64)#61 | 4.9%(+4.20)#2,579 |
| 62. | Dougherty | 9.1% | 3.4%(+5.64)#62 | 4.9%(+4.20)#2,584 |
| 63. | Woodward | 9.0% | 3.4%(+5.55)#63 | 4.9%(+4.11)#2,624 |
| 64. | Bray | 8.8% | 3.4%(+5.33)#64 | 4.9%(+3.88)#2,746 |
| 65. | Bennington | 8.7% | 3.4%(+5.25)#65 | 4.9%(+3.80)#2,791 |
| 66. | Tecumseh | 8.3% | 3.4%(+4.90)#66 | 4.9%(+3.45)#2,965 |
| 67. | Eakly | 8.3% | 3.4%(+4.89)#67 | 4.9%(+3.44)#2,991 |
| 68. | Depew | 8.3% | 3.4%(+4.89)#68 | 4.9%(+3.44)#2,994 |
| 69. | Crescent | 8.3% | 3.4%(+4.82)#69 | 4.9%(+3.37)#3,053 |
| 70. | Fort Supply | 8.2% | 3.4%(+4.75)#70 | 4.9%(+3.30)#3,088 |
| 71. | Dibble | 8.0% | 3.4%(+4.52)#71 | 4.9%(+3.07)#3,241 |
| 72. | Park Hill | 8.0% | 3.4%(+4.51)#72 | 4.9%(+3.07)#3,246 |
| 73. | Pawhuska | 7.8% | 3.4%(+4.32)#73 | 4.9%(+2.87)#3,400 |
| 74. | Savanna | 7.7% | 3.4%(+4.25)#74 | 4.9%(+2.80)#3,448 |
| 75. | Turpin | 7.7% | 3.4%(+4.25)#75 | 4.9%(+2.80)#3,457 |
| 76. | Garvin | 7.7% | 3.4%(+4.25)#76 | 4.9%(+2.80)#3,470 |
| 77. | Guthrie | 7.7% | 3.4%(+4.23)#77 | 4.9%(+2.78)#3,482 |
| 78. | Hartshorne | 7.6% | 3.4%(+4.12)#78 | 4.9%(+2.67)#3,557 |
| 79. | Sportsmen Acres | 7.4% | 3.4%(+3.96)#79 | 4.9%(+2.51)#3,666 |
| 80. | Drumright | 7.4% | 3.4%(+3.94)#80 | 4.9%(+2.49)#3,687 |
| 81. | Buffalo | 7.2% | 3.4%(+3.77)#81 | 4.9%(+2.32)#3,816 |
| 82. | Madill | 7.1% | 3.4%(+3.70)#82 | 4.9%(+2.25)#3,855 |
| 83. | Agra | 7.1% | 3.4%(+3.70)#83 | 4.9%(+2.25)#3,875 |
| 84. | Lone Grove | 7.1% | 3.4%(+3.62)#84 | 4.9%(+2.17)#3,968 |
| 85. | Bartlesville | 7.0% | 3.4%(+3.58)#85 | 4.9%(+2.13)#4,000 |
| 86. | Chelsea | 6.9% | 3.4%(+3.48)#86 | 4.9%(+2.03)#4,104 |
| 87. | Hobart | 6.9% | 3.4%(+3.44)#87 | 4.9%(+1.99)#4,144 |
| 88. | Westport | 6.7% | 3.4%(+3.29)#88 | 4.9%(+1.85)#4,275 |
| 89. | Dewar | 6.7% | 3.4%(+3.22)#89 | 4.9%(+1.77)#4,349 |
| 90. | Porter | 6.7% | 3.4%(+3.22)#90 | 4.9%(+1.77)#4,356 |
| 91. | Blackburn | 6.7% | 3.4%(+3.22)#91 | 4.9%(+1.77)#4,383 |
| 92. | Lawton | 6.6% | 3.4%(+3.12)#92 | 4.9%(+1.68)#4,465 |
| 93. | Moore | 6.5% | 3.4%(+3.10)#93 | 4.9%(+1.65)#4,500 |
| 94. | Oakland | 6.5% | 3.4%(+3.07)#94 | 4.9%(+1.63)#4,528 |
| 95. | Fort Gibson | 6.5% | 3.4%(+3.07)#95 | 4.9%(+1.62)#4,542 |
| 96. | Glenpool | 6.2% | 3.4%(+2.75)#96 | 4.9%(+1.31)#4,897 |
| 97. | Alva | 6.2% | 3.4%(+2.72)#97 | 4.9%(+1.27)#4,933 |
| 98. | Fletcher | 6.1% | 3.4%(+2.68)#98 | 4.9%(+1.23)#4,986 |
| 99. | Blanchard | 6.1% | 3.4%(+2.65)#99 | 4.9%(+1.20)#5,024 |
| 100. | Marlow | 6.1% | 3.4%(+2.64)#100 | 4.9%(+1.19)#5,031 |
Common Questions
What are the Top 10 Cities with the Highest Percentage of Population with a Degree in Computers and Mathematics in Oklahoma?
Top 10 Cities with the Highest Percentage of Population with a Degree in Computers and Mathematics in Oklahoma are:
#1
71.4%
#2
66.7%
#3
60.0%
#4
50.0%
#5
39.5%
#6
37.5%
#7
33.3%
#8
33.3%
#9
33.3%
#10
28.6%
What city has the Highest Percentage of Population with a Degree in Computers and Mathematics in Oklahoma?
Short has the Highest Percentage of Population with a Degree in Computers and Mathematics in Oklahoma with 71.4%.
What is the Percentage of Population with a Degree in Computers and Mathematics in the State of Oklahoma?
Percentage of Population with a Degree in Computers and Mathematics in Oklahoma is 3.4%.
What is the Percentage of Population with a Degree in Computers and Mathematics in the United States?
Percentage of Population with a Degree in Computers and Mathematics in the United States is 4.9%.