Cities with the Highest Percentage of Self-Employed / Incorporated in Illinois
RELATED REPORTS & OPTIONS
Self-Employed / Incorporated
Illinois
Compare Cities
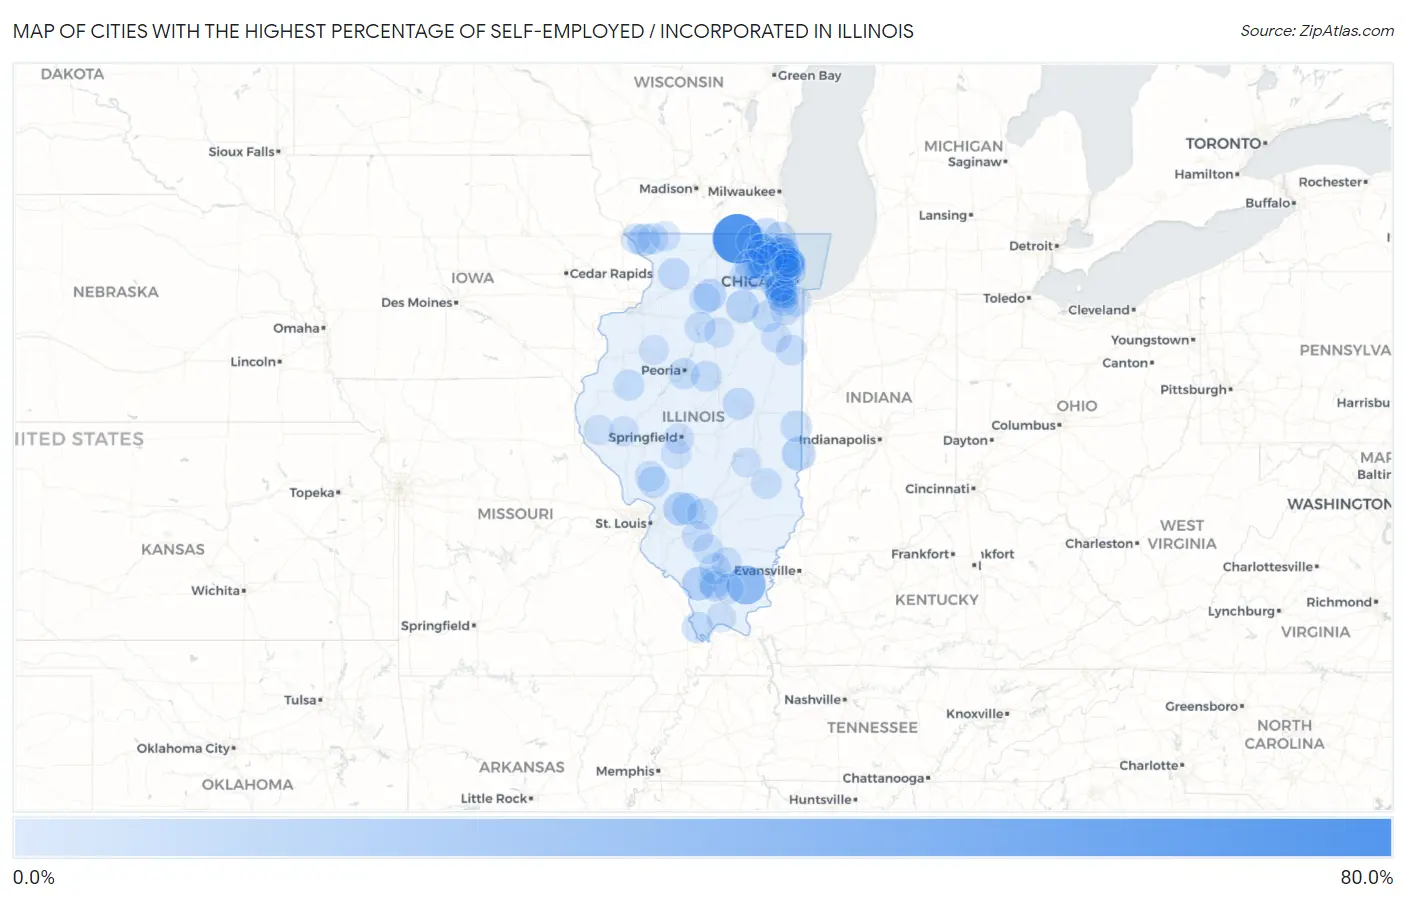
Map of Cities with the Highest Percentage of Self-Employed / Incorporated in Illinois
0.0%
80.0%
Cities with the Highest Percentage of Self-Employed / Incorporated in Illinois
| City | % Self-Employed / Incorporated | vs State | vs National | |
| 1. | Chemung | 75.0% | 4.0%(+71.0)#1 | 3.8%(+71.2)#36 |
| 2. | Muddy | 38.1% | 4.0%(+34.0)#2 | 3.8%(+34.3)#172 |
| 3. | Galt | 27.3% | 4.0%(+23.2)#3 | 3.8%(+23.5)#317 |
| 4. | Nachusa | 25.7% | 4.0%(+21.7)#4 | 3.8%(+21.9)#358 |
| 5. | Ridgefield | 23.3% | 4.0%(+19.3)#5 | 3.8%(+19.5)#434 |
| 6. | Inverness | 22.9% | 4.0%(+18.9)#6 | 3.8%(+19.1)#450 |
| 7. | Barrington Hills | 21.2% | 4.0%(+17.2)#7 | 3.8%(+17.4)#533 |
| 8. | Vermilion | 20.6% | 4.0%(+16.6)#8 | 3.8%(+16.8)#570 |
| 9. | South Barrington | 20.5% | 4.0%(+16.5)#9 | 3.8%(+16.7)#581 |
| 10. | Grantfork | 20.3% | 4.0%(+16.3)#10 | 3.8%(+16.5)#594 |
| 11. | Harrison | 20.0% | 4.0%(+16.0)#11 | 3.8%(+16.2)#610 |
| 12. | Burtons Bridge | 20.0% | 4.0%(+16.0)#12 | 3.8%(+16.2)#615 |
| 13. | Oak Brook | 20.0% | 4.0%(+15.9)#13 | 3.8%(+16.2)#629 |
| 14. | Lawrence | 19.2% | 4.0%(+15.1)#14 | 3.8%(+15.3)#680 |
| 15. | Indian Creek | 18.5% | 4.0%(+14.5)#15 | 3.8%(+14.7)#742 |
| 16. | Newark | 18.2% | 4.0%(+14.1)#16 | 3.8%(+14.3)#779 |
| 17. | North Barrington | 17.7% | 4.0%(+13.7)#17 | 3.8%(+13.9)#798 |
| 18. | Riverwoods | 17.7% | 4.0%(+13.7)#18 | 3.8%(+13.9)#799 |
| 19. | West Brooklyn | 16.7% | 4.0%(+12.6)#19 | 3.8%(+12.8)#883 |
| 20. | Greenwood | 16.5% | 4.0%(+12.5)#20 | 3.8%(+12.7)#902 |
| 21. | Lake Barrington | 16.0% | 4.0%(+12.0)#21 | 3.8%(+12.2)#942 |
| 22. | Golf | 16.0% | 4.0%(+11.9)#22 | 3.8%(+12.2)#950 |
| 23. | Burr Ridge | 15.5% | 4.0%(+11.4)#23 | 3.8%(+11.7)#1,009 |
| 24. | Prairie Grove | 15.2% | 4.0%(+11.2)#24 | 3.8%(+11.4)#1,040 |
| 25. | Northfield | 15.2% | 4.0%(+11.2)#25 | 3.8%(+11.4)#1,046 |
| 26. | Indian Head Park | 15.1% | 4.0%(+11.1)#26 | 3.8%(+11.3)#1,054 |
| 27. | The Galena Territory | 15.1% | 4.0%(+11.1)#27 | 3.8%(+11.3)#1,059 |
| 28. | Lincolnwood | 14.7% | 4.0%(+10.6)#28 | 3.8%(+10.9)#1,124 |
| 29. | Lake Carroll | 14.5% | 4.0%(+10.4)#29 | 3.8%(+10.7)#1,149 |
| 30. | Farmer City | 14.4% | 4.0%(+10.4)#30 | 3.8%(+10.6)#1,155 |
| 31. | Forest Lake | 14.1% | 4.0%(+10.1)#31 | 3.8%(+10.3)#1,212 |
| 32. | Northbrook | 14.1% | 4.0%(+10.1)#32 | 3.8%(+10.3)#1,218 |
| 33. | Channel Lake | 13.7% | 4.0%(+9.62)#33 | 3.8%(+9.85)#1,292 |
| 34. | Wadsworth | 13.6% | 4.0%(+9.58)#34 | 3.8%(+9.81)#1,301 |
| 35. | Mettawa | 13.6% | 4.0%(+9.52)#35 | 3.8%(+9.75)#1,310 |
| 36. | Milledgeville | 13.5% | 4.0%(+9.48)#36 | 3.8%(+9.71)#1,319 |
| 37. | Olivet | 13.5% | 4.0%(+9.47)#37 | 3.8%(+9.70)#1,323 |
| 38. | Colp | 13.4% | 4.0%(+9.39)#38 | 3.8%(+9.62)#1,338 |
| 39. | Pocahontas | 13.3% | 4.0%(+9.27)#39 | 3.8%(+9.50)#1,360 |
| 40. | North City | 13.3% | 4.0%(+9.26)#40 | 3.8%(+9.49)#1,361 |
| 41. | Medora | 13.3% | 4.0%(+9.24)#41 | 3.8%(+9.47)#1,365 |
| 42. | Elwood | 13.2% | 4.0%(+9.12)#42 | 3.8%(+9.35)#1,397 |
| 43. | Palos Park | 12.6% | 4.0%(+8.59)#43 | 3.8%(+8.82)#1,503 |
| 44. | Willow Springs | 12.5% | 4.0%(+8.47)#44 | 3.8%(+8.70)#1,522 |
| 45. | Olive Branch | 12.4% | 4.0%(+8.40)#45 | 3.8%(+8.63)#1,546 |
| 46. | Glencoe | 12.4% | 4.0%(+8.31)#46 | 3.8%(+8.54)#1,565 |
| 47. | Creve Coeur | 12.4% | 4.0%(+8.31)#47 | 3.8%(+8.54)#1,567 |
| 48. | Long Grove | 12.3% | 4.0%(+8.23)#48 | 3.8%(+8.46)#1,582 |
| 49. | Sublette | 12.2% | 4.0%(+8.20)#49 | 3.8%(+8.43)#1,590 |
| 50. | Bardolph | 12.2% | 4.0%(+8.15)#50 | 3.8%(+8.38)#1,601 |
| 51. | Apple Canyon Lake | 11.9% | 4.0%(+7.90)#51 | 3.8%(+8.13)#1,667 |
| 52. | Trout Valley | 11.8% | 4.0%(+7.80)#52 | 3.8%(+8.03)#1,702 |
| 53. | Congerville | 11.7% | 4.0%(+7.67)#53 | 3.8%(+7.89)#1,740 |
| 54. | Keyesport | 11.7% | 4.0%(+7.66)#54 | 3.8%(+7.88)#1,741 |
| 55. | Kenilworth | 11.6% | 4.0%(+7.51)#55 | 3.8%(+7.74)#1,780 |
| 56. | New Minden | 11.5% | 4.0%(+7.43)#56 | 3.8%(+7.66)#1,800 |
| 57. | Hennepin | 11.5% | 4.0%(+7.42)#57 | 3.8%(+7.65)#1,804 |
| 58. | Crainville | 11.3% | 4.0%(+7.24)#58 | 3.8%(+7.47)#1,853 |
| 59. | Green Oaks | 11.2% | 4.0%(+7.11)#59 | 3.8%(+7.34)#1,883 |
| 60. | Phoenix | 10.8% | 4.0%(+6.80)#60 | 3.8%(+7.03)#1,985 |
| 61. | Hidalgo | 10.8% | 4.0%(+6.76)#61 | 3.8%(+6.99)#1,996 |
| 62. | Papineau | 10.7% | 4.0%(+6.67)#62 | 3.8%(+6.90)#2,021 |
| 63. | Hinsdale | 10.7% | 4.0%(+6.65)#63 | 3.8%(+6.88)#2,032 |
| 64. | Frankfort | 10.5% | 4.0%(+6.43)#64 | 3.8%(+6.66)#2,113 |
| 65. | Virgil | 10.4% | 4.0%(+6.36)#65 | 3.8%(+6.59)#2,141 |
| 66. | Galena | 10.4% | 4.0%(+6.36)#66 | 3.8%(+6.59)#2,142 |
| 67. | Ewing | 10.4% | 4.0%(+6.32)#67 | 3.8%(+6.55)#2,155 |
| 68. | Wilmette | 10.3% | 4.0%(+6.26)#68 | 3.8%(+6.49)#2,165 |
| 69. | Highland Park | 10.3% | 4.0%(+6.23)#69 | 3.8%(+6.46)#2,173 |
| 70. | Lake Bluff | 10.2% | 4.0%(+6.18)#70 | 3.8%(+6.41)#2,190 |
| 71. | Rockbridge | 10.2% | 4.0%(+6.16)#71 | 3.8%(+6.39)#2,199 |
| 72. | Western Springs | 10.1% | 4.0%(+6.05)#72 | 3.8%(+6.28)#2,229 |
| 73. | Wayne | 10.0% | 4.0%(+5.98)#73 | 3.8%(+6.21)#2,265 |
| 74. | Lake Forest | 10.0% | 4.0%(+5.91)#74 | 3.8%(+6.14)#2,314 |
| 75. | Deerfield | 9.9% | 4.0%(+5.90)#75 | 3.8%(+6.13)#2,315 |
| 76. | Leland Grove | 9.9% | 4.0%(+5.87)#76 | 3.8%(+6.10)#2,331 |
| 77. | Kildeer | 9.5% | 4.0%(+5.48)#77 | 3.8%(+5.71)#2,469 |
| 78. | Palos Hills | 9.5% | 4.0%(+5.42)#78 | 3.8%(+5.65)#2,494 |
| 79. | Harwood Heights | 9.4% | 4.0%(+5.35)#79 | 3.8%(+5.58)#2,517 |
| 80. | Sleepy Hollow | 9.4% | 4.0%(+5.33)#80 | 3.8%(+5.56)#2,524 |
| 81. | Winnetka | 9.4% | 4.0%(+5.31)#81 | 3.8%(+5.54)#2,537 |
| 82. | Limestone | 9.3% | 4.0%(+5.25)#82 | 3.8%(+5.48)#2,562 |
| 83. | Lily Lake | 9.3% | 4.0%(+5.25)#83 | 3.8%(+5.48)#2,563 |
| 84. | Barrington | 9.0% | 4.0%(+4.99)#84 | 3.8%(+5.22)#2,690 |
| 85. | Auburn | 9.0% | 4.0%(+4.97)#85 | 3.8%(+5.19)#2,701 |
| 86. | Radom | 9.0% | 4.0%(+4.91)#86 | 3.8%(+5.14)#2,739 |
| 87. | Pingree Grove | 8.9% | 4.0%(+4.85)#87 | 3.8%(+5.08)#2,769 |
| 88. | Holiday Hills | 8.9% | 4.0%(+4.85)#88 | 3.8%(+5.08)#2,770 |
| 89. | Liberty | 8.9% | 4.0%(+4.82)#89 | 3.8%(+5.05)#2,785 |
| 90. | Belknap | 8.8% | 4.0%(+4.78)#90 | 3.8%(+5.01)#2,808 |
| 91. | Leonore | 8.8% | 4.0%(+4.78)#91 | 3.8%(+5.01)#2,809 |
| 92. | Crab Orchard | 8.8% | 4.0%(+4.76)#92 | 3.8%(+4.99)#2,823 |
| 93. | Morton Grove | 8.8% | 4.0%(+4.73)#93 | 3.8%(+4.96)#2,833 |
| 94. | Nora | 8.8% | 4.0%(+4.73)#94 | 3.8%(+4.95)#2,835 |
| 95. | Versailles | 8.7% | 4.0%(+4.68)#95 | 3.8%(+4.91)#2,864 |
| 96. | Oak Run | 8.7% | 4.0%(+4.64)#96 | 3.8%(+4.86)#2,884 |
| 97. | Dundas | 8.6% | 4.0%(+4.53)#97 | 3.8%(+4.75)#2,938 |
| 98. | Orland Park | 8.6% | 4.0%(+4.51)#98 | 3.8%(+4.74)#2,955 |
| 99. | Glenview | 8.5% | 4.0%(+4.49)#99 | 3.8%(+4.72)#2,962 |
| 100. | Gays | 8.5% | 4.0%(+4.49)#100 | 3.8%(+4.72)#2,967 |
Common Questions
What are the Top 10 Cities with the Highest Percentage of Self-Employed / Incorporated in Illinois?
Top 10 Cities with the Highest Percentage of Self-Employed / Incorporated in Illinois are:
#1
75.0%
#2
38.1%
#3
22.9%
#4
21.2%
#5
20.6%
#6
20.5%
#7
20.3%
#8
20.0%
#9
20.0%
#10
18.5%
What city has the Highest Percentage of Self-Employed / Incorporated in Illinois?
Chemung has the Highest Percentage of Self-Employed / Incorporated in Illinois with 75.0%.
What is the Percentage of Self-Employed / Incorporated in the State of Illinois?
Percentage of Self-Employed / Incorporated in Illinois is 4.0%.
What is the Percentage of Self-Employed / Incorporated in the United States?
Percentage of Self-Employed / Incorporated in the United States is 3.8%.