Zip Codes with the Highest Percentage of Self-Employed / Incorporated in Illinois
RELATED REPORTS & OPTIONS
Self-Employed / Incorporated
Illinois
Compare Zip Codes
Map of Zip Codes with the Highest Percentage of Self-Employed / Incorporated in Illinois
0.0%
50.0%
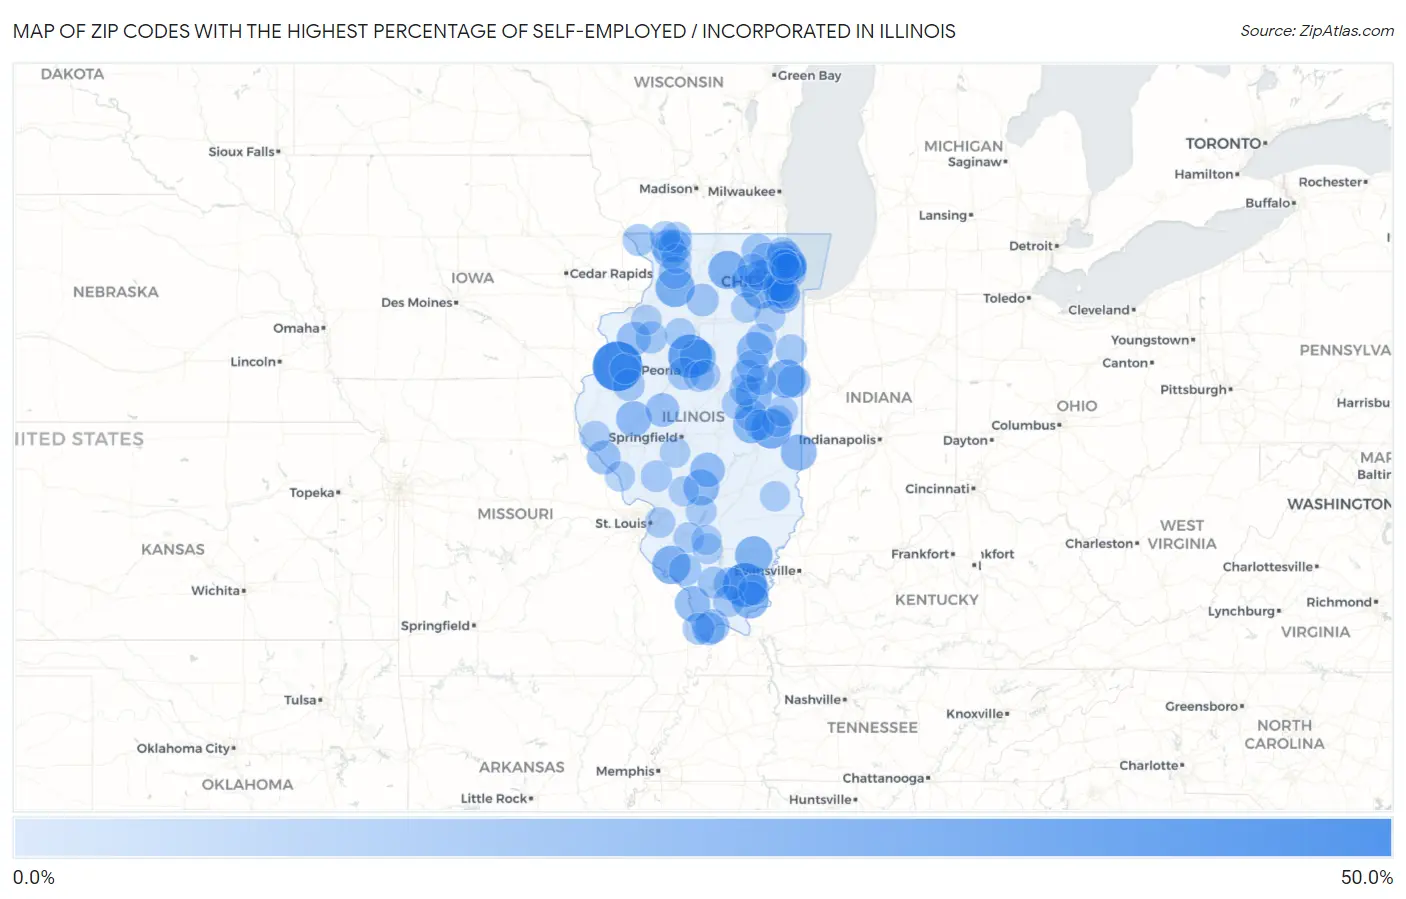
Zip Codes with the Highest Percentage of Self-Employed / Incorporated in Illinois
| Zip Code | % Self-Employed / Incorporated | vs State | vs National | |
| 1. | 61478 | 50.0% | 4.0% (+46.0)#1 | 3.8% (+46.2)#78 |
| 2. | 62965 | 38.1% | 4.0% (+34.0)#2 | 3.8% (+34.3)#141 |
| 3. | 61562 | 37.0% | 4.0% (+33.0)#3 | 3.8% (+33.2)#150 |
| 4. | 61852 | 28.7% | 4.0% (+24.7)#4 | 3.8% (+24.9)#236 |
| 5. | 60519 | 28.6% | 4.0% (+24.5)#5 | 3.8% (+24.8)#239 |
| 6. | 61037 | 27.3% | 4.0% (+23.2)#6 | 3.8% (+23.5)#265 |
| 7. | 60926 | 26.0% | 4.0% (+22.0)#7 | 3.8% (+22.2)#290 |
| 8. | 60111 | 25.9% | 4.0% (+21.8)#8 | 3.8% (+22.1)#293 |
| 9. | 62297 | 25.5% | 4.0% (+21.4)#9 | 3.8% (+21.7)#300 |
| 10. | 62887 | 23.7% | 4.0% (+19.7)#10 | 3.8% (+19.9)#349 |
| 11. | 62947 | 23.0% | 4.0% (+19.0)#11 | 3.8% (+19.2)#372 |
| 12. | 61851 | 22.0% | 4.0% (+17.9)#12 | 3.8% (+18.1)#407 |
| 13. | 61545 | 21.6% | 4.0% (+17.6)#13 | 3.8% (+17.8)#428 |
| 14. | 61845 | 21.4% | 4.0% (+17.4)#14 | 3.8% (+17.6)#431 |
| 15. | 60934 | 20.9% | 4.0% (+16.9)#15 | 3.8% (+17.1)#455 |
| 16. | 61955 | 20.6% | 4.0% (+16.6)#16 | 3.8% (+16.8)#473 |
| 17. | 62032 | 20.3% | 4.0% (+16.2)#17 | 3.8% (+16.4)#492 |
| 18. | 60157 | 20.2% | 4.0% (+16.2)#18 | 3.8% (+16.4)#493 |
| 19. | 62639 | 19.3% | 4.0% (+15.3)#19 | 3.8% (+15.5)#539 |
| 20. | 62998 | 19.2% | 4.0% (+15.2)#20 | 3.8% (+15.4)#545 |
| 21. | 60523 | 18.3% | 4.0% (+14.3)#21 | 3.8% (+14.5)#601 |
| 22. | 62083 | 17.9% | 4.0% (+13.8)#22 | 3.8% (+14.0)#635 |
| 23. | 60464 | 17.8% | 4.0% (+13.8)#23 | 3.8% (+14.0)#638 |
| 24. | 61062 | 16.7% | 4.0% (+12.6)#24 | 3.8% (+12.8)#734 |
| 25. | 62970 | 16.5% | 4.0% (+12.5)#25 | 3.8% (+12.7)#758 |
| 26. | 61466 | 16.4% | 4.0% (+12.4)#26 | 3.8% (+12.6)#767 |
| 27. | 60029 | 16.0% | 4.0% (+11.9)#27 | 3.8% (+12.2)#825 |
| 28. | 62655 | 15.8% | 4.0% (+11.8)#28 | 3.8% (+12.0)#842 |
| 29. | 62370 | 15.8% | 4.0% (+11.8)#29 | 3.8% (+12.0)#844 |
| 30. | 61044 | 15.0% | 4.0% (+11.0)#30 | 3.8% (+11.2)#944 |
| 31. | 61027 | 14.8% | 4.0% (+10.8)#31 | 3.8% (+11.0)#990 |
| 32. | 60712 | 14.7% | 4.0% (+10.6)#32 | 3.8% (+10.9)#1,011 |
| 33. | 62996 | 14.6% | 4.0% (+10.5)#33 | 3.8% (+10.8)#1,032 |
| 34. | 60973 | 14.4% | 4.0% (+10.3)#34 | 3.8% (+10.6)#1,057 |
| 35. | 61731 | 14.3% | 4.0% (+10.2)#35 | 3.8% (+10.5)#1,078 |
| 36. | 60119 | 14.2% | 4.0% (+10.2)#36 | 3.8% (+10.4)#1,092 |
| 37. | 61051 | 14.0% | 4.0% (+9.96)#37 | 3.8% (+10.2)#1,125 |
| 38. | 61741 | 14.0% | 4.0% (+9.91)#38 | 3.8% (+10.1)#1,138 |
| 39. | 62974 | 13.7% | 4.0% (+9.62)#39 | 3.8% (+9.85)#1,208 |
| 40. | 61367 | 13.6% | 4.0% (+9.59)#40 | 3.8% (+9.82)#1,212 |
| 41. | 60062 | 13.1% | 4.0% (+9.01)#41 | 3.8% (+9.24)#1,309 |
| 42. | 62997 | 13.0% | 4.0% (+8.94)#42 | 3.8% (+9.17)#1,324 |
| 43. | 61875 | 12.9% | 4.0% (+8.87)#43 | 3.8% (+9.10)#1,331 |
| 44. | 60480 | 12.9% | 4.0% (+8.86)#44 | 3.8% (+9.09)#1,332 |
| 45. | 60012 | 12.6% | 4.0% (+8.59)#45 | 3.8% (+8.82)#1,407 |
| 46. | 60010 | 12.6% | 4.0% (+8.58)#46 | 3.8% (+8.81)#1,408 |
| 47. | 61610 | 12.4% | 4.0% (+8.31)#47 | 3.8% (+8.54)#1,484 |
| 48. | 61416 | 12.2% | 4.0% (+8.15)#48 | 3.8% (+8.38)#1,520 |
| 49. | 62969 | 12.2% | 4.0% (+8.14)#49 | 3.8% (+8.37)#1,523 |
| 50. | 61414 | 12.1% | 4.0% (+8.07)#50 | 3.8% (+8.30)#1,541 |
| 51. | 61036 | 12.1% | 4.0% (+8.01)#51 | 3.8% (+8.24)#1,552 |
| 52. | 60022 | 11.9% | 4.0% (+7.84)#52 | 3.8% (+8.07)#1,586 |
| 53. | 62921 | 11.8% | 4.0% (+7.80)#53 | 3.8% (+8.02)#1,599 |
| 54. | 61849 | 11.6% | 4.0% (+7.56)#54 | 3.8% (+7.79)#1,689 |
| 55. | 60043 | 11.6% | 4.0% (+7.51)#55 | 3.8% (+7.74)#1,705 |
| 56. | 62630 | 11.6% | 4.0% (+7.50)#56 | 3.8% (+7.73)#1,710 |
| 57. | 60527 | 11.1% | 4.0% (+7.08)#57 | 3.8% (+7.31)#1,832 |
| 58. | 61842 | 11.1% | 4.0% (+7.02)#58 | 3.8% (+7.25)#1,861 |
| 59. | 60093 | 11.1% | 4.0% (+7.02)#59 | 3.8% (+7.25)#1,864 |
| 60. | 61770 | 10.8% | 4.0% (+6.78)#60 | 3.8% (+7.01)#1,965 |
| 61. | 62972 | 10.7% | 4.0% (+6.67)#61 | 3.8% (+6.90)#2,005 |
| 62. | 60956 | 10.7% | 4.0% (+6.67)#62 | 3.8% (+6.90)#2,010 |
| 63. | 61880 | 10.4% | 4.0% (+6.39)#63 | 3.8% (+6.62)#2,116 |
| 64. | 61421 | 10.4% | 4.0% (+6.33)#64 | 3.8% (+6.56)#2,142 |
| 65. | 60521 | 10.4% | 4.0% (+6.32)#65 | 3.8% (+6.55)#2,145 |
| 66. | 60035 | 10.3% | 4.0% (+6.23)#66 | 3.8% (+6.46)#2,186 |
| 67. | 60091 | 10.3% | 4.0% (+6.22)#67 | 3.8% (+6.45)#2,192 |
| 68. | 61050 | 10.2% | 4.0% (+6.19)#68 | 3.8% (+6.42)#2,210 |
| 69. | 60015 | 10.2% | 4.0% (+6.13)#69 | 3.8% (+6.36)#2,229 |
| 70. | 60558 | 10.1% | 4.0% (+6.05)#70 | 3.8% (+6.28)#2,269 |
| 71. | 60184 | 10.1% | 4.0% (+6.02)#71 | 3.8% (+6.25)#2,285 |
| 72. | 60045 | 10.0% | 4.0% (+6.00)#72 | 3.8% (+6.23)#2,294 |
| 73. | 61733 | 10.0% | 4.0% (+5.95)#73 | 3.8% (+6.18)#2,312 |
| 74. | 62934 | 10.0% | 4.0% (+5.93)#74 | 3.8% (+6.15)#2,336 |
| 75. | 60421 | 10.0% | 4.0% (+5.91)#75 | 3.8% (+6.14)#2,349 |
| 76. | 62253 | 10.0% | 4.0% (+5.91)#76 | 3.8% (+6.14)#2,352 |
| 77. | 62365 | 9.9% | 4.0% (+5.86)#77 | 3.8% (+6.09)#2,376 |
| 78. | 61473 | 9.7% | 4.0% (+5.64)#78 | 3.8% (+5.87)#2,469 |
| 79. | 60203 | 9.6% | 4.0% (+5.57)#79 | 3.8% (+5.80)#2,514 |
| 80. | 60124 | 9.6% | 4.0% (+5.53)#80 | 3.8% (+5.76)#2,548 |
| 81. | 61844 | 9.6% | 4.0% (+5.53)#81 | 3.8% (+5.76)#2,550 |
| 82. | 61729 | 9.5% | 4.0% (+5.44)#82 | 3.8% (+5.67)#2,594 |
| 83. | 60465 | 9.5% | 4.0% (+5.42)#83 | 3.8% (+5.65)#2,606 |
| 84. | 60961 | 9.4% | 4.0% (+5.36)#84 | 3.8% (+5.58)#2,640 |
| 85. | 60025 | 9.3% | 4.0% (+5.26)#85 | 3.8% (+5.49)#2,689 |
| 86. | 62271 | 9.3% | 4.0% (+5.25)#86 | 3.8% (+5.48)#2,695 |
| 87. | 62232 | 9.3% | 4.0% (+5.22)#87 | 3.8% (+5.45)#2,718 |
| 88. | 61078 | 9.2% | 4.0% (+5.14)#88 | 3.8% (+5.37)#2,764 |
| 89. | 60026 | 9.0% | 4.0% (+4.99)#89 | 3.8% (+5.22)#2,862 |
| 90. | 61274 | 9.0% | 4.0% (+4.98)#90 | 3.8% (+5.21)#2,866 |
| 91. | 62615 | 9.0% | 4.0% (+4.96)#91 | 3.8% (+5.19)#2,877 |
| 92. | 62045 | 9.0% | 4.0% (+4.95)#92 | 3.8% (+5.18)#2,883 |
| 93. | 62091 | 9.0% | 4.0% (+4.91)#93 | 3.8% (+5.14)#2,906 |
| 94. | 62876 | 9.0% | 4.0% (+4.91)#94 | 3.8% (+5.14)#2,908 |
| 95. | 62877 | 8.8% | 4.0% (+4.76)#95 | 3.8% (+4.99)#3,008 |
| 96. | 60541 | 8.8% | 4.0% (+4.75)#96 | 3.8% (+4.98)#3,012 |
| 97. | 62480 | 8.8% | 4.0% (+4.73)#97 | 3.8% (+4.96)#3,024 |
| 98. | 60053 | 8.8% | 4.0% (+4.73)#98 | 3.8% (+4.96)#3,027 |
| 99. | 61059 | 8.8% | 4.0% (+4.73)#99 | 3.8% (+4.95)#3,032 |
| 100. | 60952 | 8.8% | 4.0% (+4.72)#100 | 3.8% (+4.95)#3,034 |
Common Questions
What are the Top 10 Zip Codes with the Highest Percentage of Self-Employed / Incorporated in Illinois?
Top 10 Zip Codes with the Highest Percentage of Self-Employed / Incorporated in Illinois are:
What zip code has the Highest Percentage of Self-Employed / Incorporated in Illinois?
61478 has the Highest Percentage of Self-Employed / Incorporated in Illinois with 50.0%.
What is the Percentage of Self-Employed / Incorporated in the State of Illinois?
Percentage of Self-Employed / Incorporated in Illinois is 4.0%.
What is the Percentage of Self-Employed / Incorporated in the United States?
Percentage of Self-Employed / Incorporated in the United States is 3.8%.