Auburn, IL Map & Demographics
Auburn Map
Auburn Overview
$36,807
PER CAPITA INCOME
$113,692
AVG FAMILY INCOME
$84,750
AVG HOUSEHOLD INCOME
50.4%
WAGE / INCOME GAP [ % ]
49.6¢/ $1
WAGE / INCOME GAP [ $ ]
0.35
INEQUALITY / GINI INDEX
4,535
TOTAL POPULATION
2,146
MALE POPULATION
2,389
FEMALE POPULATION
89.83
MALES / 100 FEMALES
111.32
FEMALES / 100 MALES
35.7
MEDIAN AGE
3.4
AVG FAMILY SIZE
2.9
AVG HOUSEHOLD SIZE
2,202
LABOR FORCE [ PEOPLE ]
62.8%
PERCENT IN LABOR FORCE
0.8%
UNEMPLOYMENT RATE
Auburn Zip Codes
Auburn Area Codes
Income in Auburn
Income Overview in Auburn
Per Capita Income in Auburn is $36,807, while median incomes of families and households are $113,692 and $84,750 respectively.
| Characteristic | Number | Measure |
| Per Capita Income | 4,535 | $36,807 |
| Median Family Income | 1,092 | $113,692 |
| Mean Family Income | 1,092 | $122,429 |
| Median Household Income | 1,571 | $84,750 |
| Mean Household Income | 1,571 | $101,253 |
| Income Deficit | 1,092 | $0 |
| Wage / Income Gap (%) | 4,535 | 50.39% |
| Wage / Income Gap ($) | 4,535 | 49.61¢ per $1 |
| Gini / Inequality Index | 4,535 | 0.35 |
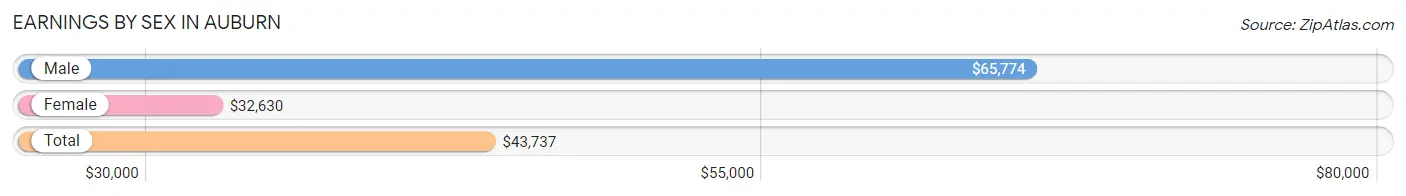
Earnings by Sex in Auburn
Average Earnings in Auburn are $43,737, $65,774 for men and $32,630 for women, a difference of 50.4%.
| Sex | Number | Average Earnings |
| Male | 1,187 (49.7%) | $65,774 |
| Female | 1,199 (50.2%) | $32,630 |
| Total | 2,386 (100.0%) | $43,737 |
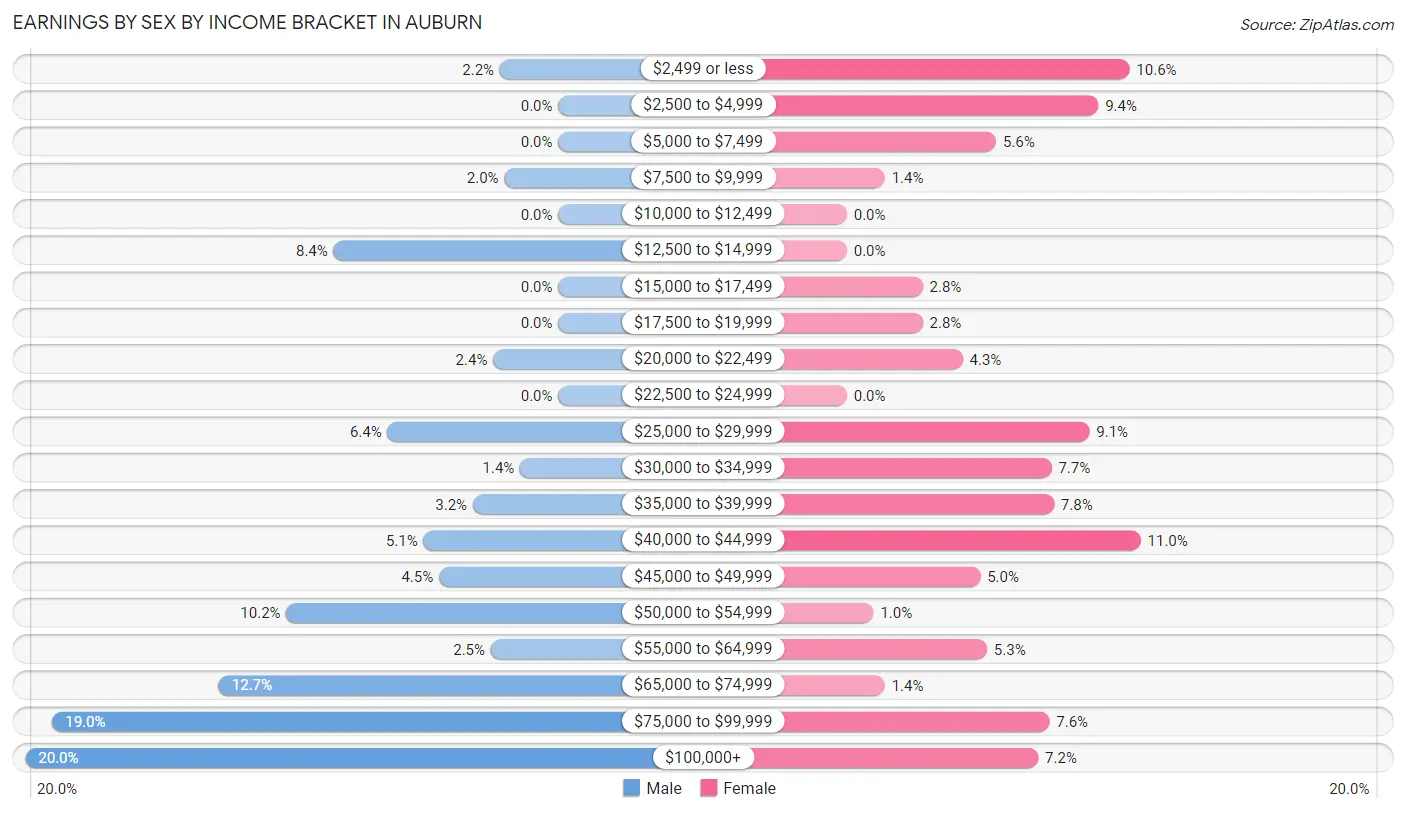
Earnings by Sex by Income Bracket in Auburn
The most common earnings brackets in Auburn are $100,000+ for men (237 | 20.0%) and $40,000 to $44,999 for women (132 | 11.0%).
| Income | Male | Female |
| $2,499 or less | 26 (2.2%) | 127 (10.6%) |
| $2,500 to $4,999 | 0 (0.0%) | 113 (9.4%) |
| $5,000 to $7,499 | 0 (0.0%) | 67 (5.6%) |
| $7,500 to $9,999 | 24 (2.0%) | 17 (1.4%) |
| $10,000 to $12,499 | 0 (0.0%) | 0 (0.0%) |
| $12,500 to $14,999 | 100 (8.4%) | 0 (0.0%) |
| $15,000 to $17,499 | 0 (0.0%) | 34 (2.8%) |
| $17,500 to $19,999 | 0 (0.0%) | 34 (2.8%) |
| $20,000 to $22,499 | 29 (2.4%) | 52 (4.3%) |
| $22,500 to $24,999 | 0 (0.0%) | 0 (0.0%) |
| $25,000 to $29,999 | 76 (6.4%) | 109 (9.1%) |
| $30,000 to $34,999 | 17 (1.4%) | 92 (7.7%) |
| $35,000 to $39,999 | 38 (3.2%) | 93 (7.8%) |
| $40,000 to $44,999 | 60 (5.1%) | 132 (11.0%) |
| $45,000 to $49,999 | 53 (4.5%) | 60 (5.0%) |
| $50,000 to $54,999 | 121 (10.2%) | 12 (1.0%) |
| $55,000 to $64,999 | 30 (2.5%) | 63 (5.2%) |
| $65,000 to $74,999 | 151 (12.7%) | 17 (1.4%) |
| $75,000 to $99,999 | 225 (19.0%) | 91 (7.6%) |
| $100,000+ | 237 (20.0%) | 86 (7.2%) |
| Total | 1,187 (100.0%) | 1,199 (100.0%) |
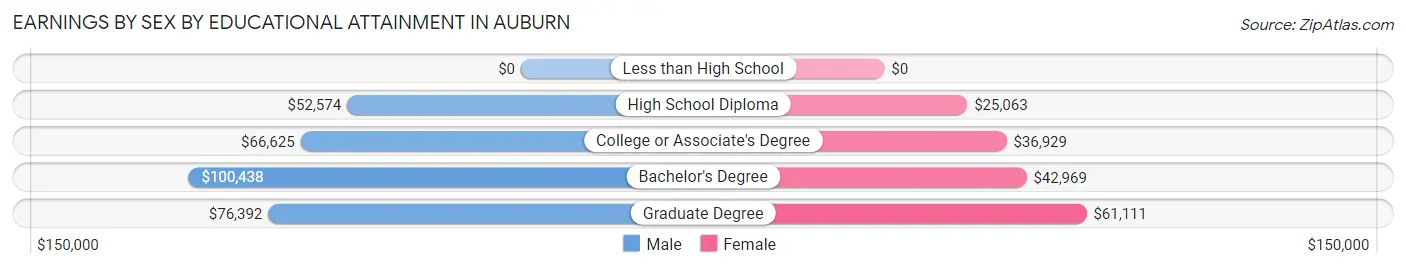
Earnings by Sex by Educational Attainment in Auburn
Average earnings in Auburn are $70,221 for men and $40,125 for women, a difference of 42.9%. Men with an educational attainment of bachelor's degree enjoy the highest average annual earnings of $100,438, while those with high school diploma education earn the least with $52,574. Women with an educational attainment of graduate degree earn the most with the average annual earnings of $61,111, while those with high school diploma education have the smallest earnings of $25,063.
| Educational Attainment | Male Income | Female Income |
| Less than High School | - | - |
| High School Diploma | $52,574 | $25,063 |
| College or Associate's Degree | $66,625 | $36,929 |
| Bachelor's Degree | $100,438 | $42,969 |
| Graduate Degree | $76,392 | $61,111 |
| Total | $70,221 | $40,125 |
Family Income in Auburn
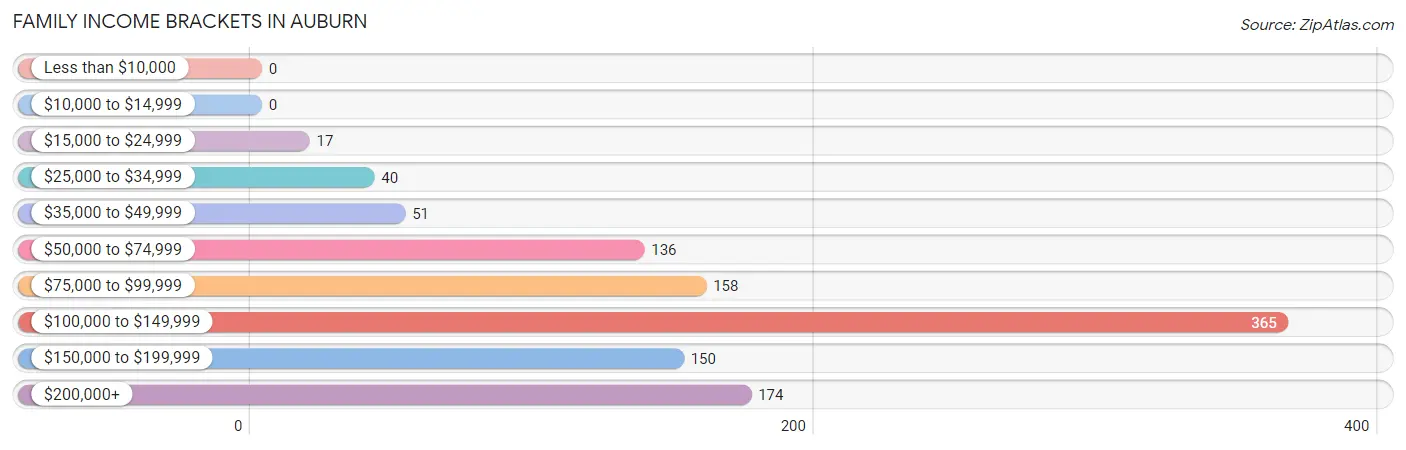
Family Income Brackets in Auburn
According to the Auburn family income data, there are 365 families falling into the $100,000 to $149,999 income range, which is the most common income bracket and makes up 33.4% of all families.
| Income Bracket | # Families | % Families |
| Less than $10,000 | 0 | 0.0% |
| $10,000 to $14,999 | 0 | 0.0% |
| $15,000 to $24,999 | 17 | 1.6% |
| $25,000 to $34,999 | 40 | 3.7% |
| $35,000 to $49,999 | 51 | 4.7% |
| $50,000 to $74,999 | 136 | 12.5% |
| $75,000 to $99,999 | 158 | 14.5% |
| $100,000 to $149,999 | 365 | 33.4% |
| $150,000 to $199,999 | 150 | 13.7% |
| $200,000+ | 174 | 15.9% |
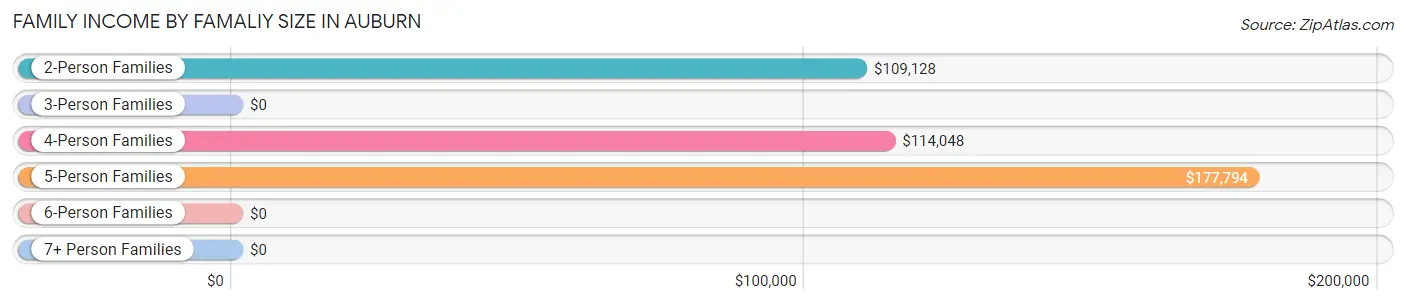
Family Income by Famaliy Size in Auburn
5-person families (104 | 9.5%) account for the highest median family income in Auburn with $177,794 per family, while 2-person families (442 | 40.5%) have the highest median income of $54,564 per family member.
| Income Bracket | # Families | Median Income |
| 2-Person Families | 442 (40.5%) | $109,128 |
| 3-Person Families | 264 (24.2%) | $0 |
| 4-Person Families | 204 (18.7%) | $114,048 |
| 5-Person Families | 104 (9.5%) | $177,794 |
| 6-Person Families | 78 (7.1%) | $0 |
| 7+ Person Families | 0 (0.0%) | $0 |
| Total | 1,092 (100.0%) | $113,692 |
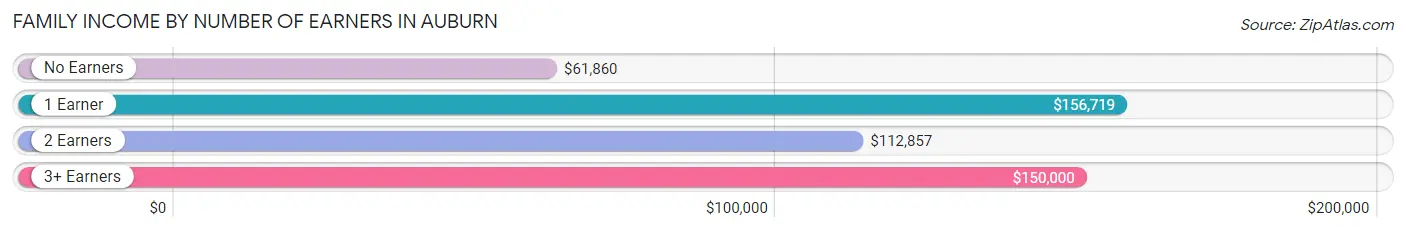
Family Income by Number of Earners in Auburn
The median family income in Auburn is $113,692, with families comprising 1 earner (254) having the highest median family income of $156,719, while families with no earners (126) have the lowest median family income of $61,860, accounting for 23.3% and 11.5% of families, respectively.
| Number of Earners | # Families | Median Income |
| No Earners | 126 (11.5%) | $61,860 |
| 1 Earner | 254 (23.3%) | $156,719 |
| 2 Earners | 550 (50.4%) | $112,857 |
| 3+ Earners | 162 (14.8%) | $150,000 |
| Total | 1,092 (100.0%) | $113,692 |
Household Income in Auburn
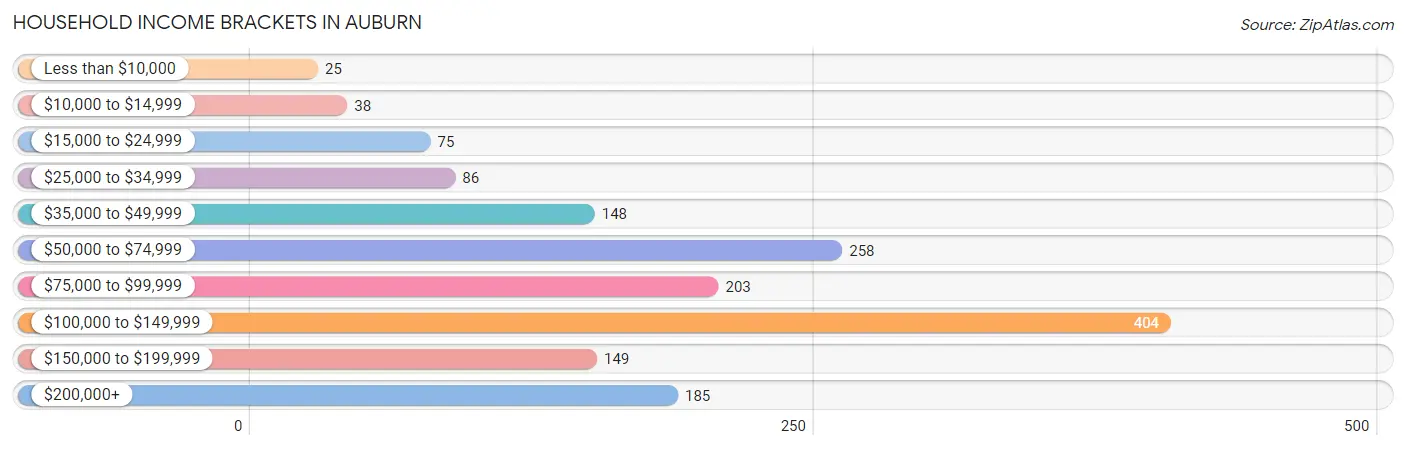
Household Income Brackets in Auburn
With 404 households falling in the category, the $100,000 to $149,999 income range is the most frequent in Auburn, accounting for 25.7% of all households. In contrast, only 25 households (1.6%) fall into the less than $10,000 income bracket, making it the least populous group.
| Income Bracket | # Households | % Households |
| Less than $10,000 | 25 | 1.6% |
| $10,000 to $14,999 | 38 | 2.4% |
| $15,000 to $24,999 | 75 | 4.8% |
| $25,000 to $34,999 | 86 | 5.5% |
| $35,000 to $49,999 | 148 | 9.4% |
| $50,000 to $74,999 | 258 | 16.4% |
| $75,000 to $99,999 | 203 | 12.9% |
| $100,000 to $149,999 | 404 | 25.7% |
| $150,000 to $199,999 | 149 | 9.5% |
| $200,000+ | 185 | 11.8% |
Household Income by Householder Age in Auburn
The median household income in Auburn is $84,750, with the highest median household income of $125,417 found in the 45 to 64 years age bracket for the primary householder. A total of 497 households (31.6%) fall into this category. Meanwhile, the 15 to 24 years age bracket for the primary householder has the lowest median household income of $0, with 39 households (2.5%) in this group.
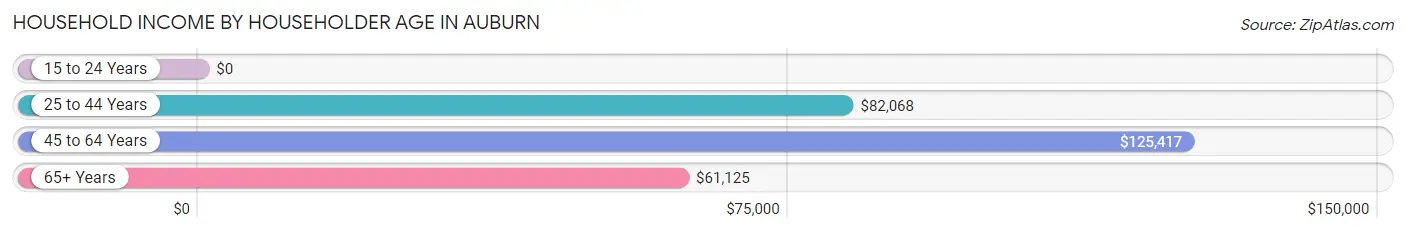
| Income Bracket | # Households | Median Income |
| 15 to 24 Years | 39 (2.5%) | $0 |
| 25 to 44 Years | 617 (39.3%) | $82,068 |
| 45 to 64 Years | 497 (31.6%) | $125,417 |
| 65+ Years | 418 (26.6%) | $61,125 |
| Total | 1,571 (100.0%) | $84,750 |
Poverty in Auburn
Income Below Poverty by Sex and Age in Auburn
With 2.7% poverty level for males and 7.4% for females among the residents of Auburn, 65 to 74 year old males and 35 to 44 year old females are the most vulnerable to poverty, with 17 males (28.8%) and 54 females (17.6%) in their respective age groups living below the poverty level.
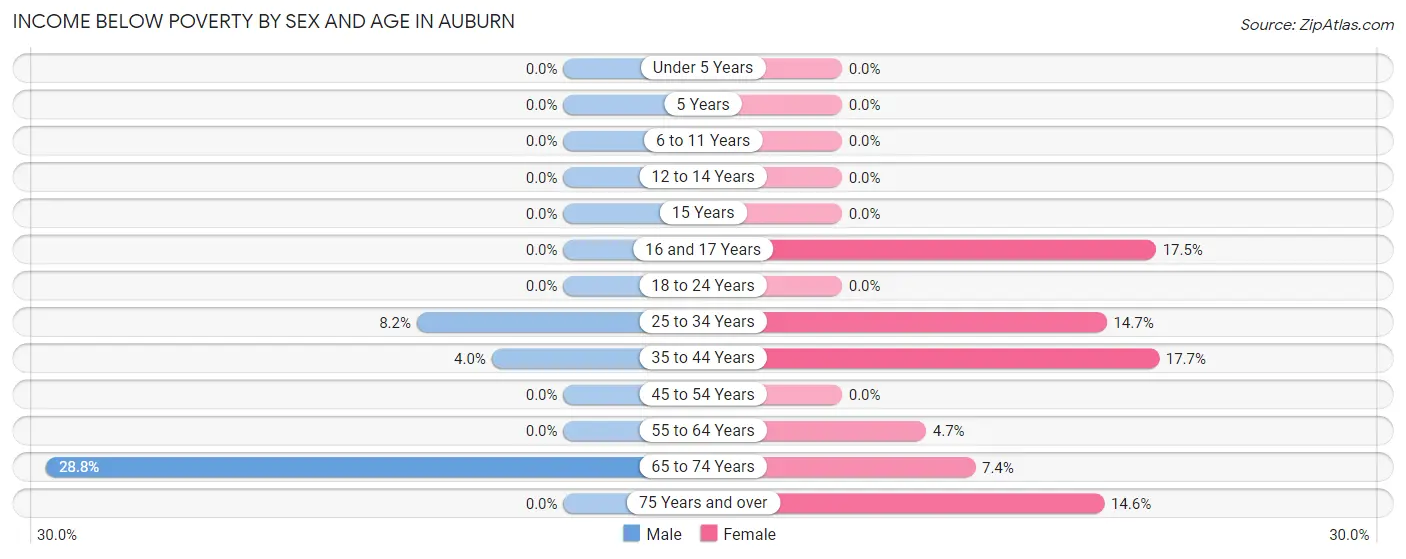
| Age Bracket | Male | Female |
| Under 5 Years | 0 (0.0%) | 0 (0.0%) |
| 5 Years | 0 (0.0%) | 0 (0.0%) |
| 6 to 11 Years | 0 (0.0%) | 0 (0.0%) |
| 12 to 14 Years | 0 (0.0%) | 0 (0.0%) |
| 15 Years | 0 (0.0%) | 0 (0.0%) |
| 16 and 17 Years | 0 (0.0%) | 18 (17.5%) |
| 18 to 24 Years | 0 (0.0%) | 0 (0.0%) |
| 25 to 34 Years | 24 (8.2%) | 46 (14.7%) |
| 35 to 44 Years | 16 (4.0%) | 54 (17.6%) |
| 45 to 54 Years | 0 (0.0%) | 0 (0.0%) |
| 55 to 64 Years | 0 (0.0%) | 16 (4.7%) |
| 65 to 74 Years | 17 (28.8%) | 17 (7.4%) |
| 75 Years and over | 0 (0.0%) | 20 (14.6%) |
| Total | 57 (2.7%) | 171 (7.4%) |
Income Above Poverty by Sex and Age in Auburn
According to the poverty statistics in Auburn, males aged under 5 years and females aged under 5 years are the age groups that are most secure financially, with 100.0% of males and 100.0% of females in these age groups living above the poverty line.
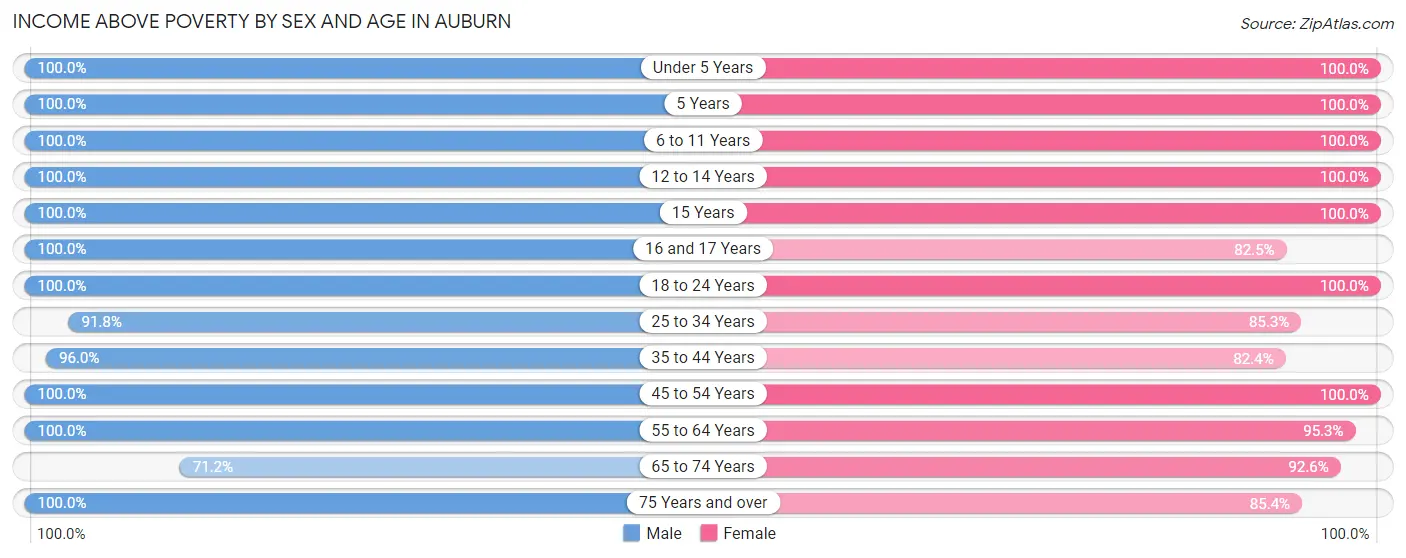
| Age Bracket | Male | Female |
| Under 5 Years | 223 (100.0%) | 66 (100.0%) |
| 5 Years | 18 (100.0%) | 57 (100.0%) |
| 6 to 11 Years | 106 (100.0%) | 202 (100.0%) |
| 12 to 14 Years | 144 (100.0%) | 61 (100.0%) |
| 15 Years | 17 (100.0%) | 88 (100.0%) |
| 16 and 17 Years | 47 (100.0%) | 85 (82.5%) |
| 18 to 24 Years | 154 (100.0%) | 222 (100.0%) |
| 25 to 34 Years | 270 (91.8%) | 266 (85.3%) |
| 35 to 44 Years | 385 (96.0%) | 252 (82.4%) |
| 45 to 54 Years | 231 (100.0%) | 193 (100.0%) |
| 55 to 64 Years | 258 (100.0%) | 326 (95.3%) |
| 65 to 74 Years | 42 (71.2%) | 212 (92.6%) |
| 75 Years and over | 156 (100.0%) | 117 (85.4%) |
| Total | 2,051 (97.3%) | 2,147 (92.6%) |
Income Below Poverty Among Married-Couple Families in Auburn
The poverty statistics for married-couple families in Auburn show that 2.2% or 17 of the total 777 families live below the poverty line. Families with no children have the highest poverty rate of 3.7%, comprising of 17 families. On the other hand, families with 1 or 2 children have the lowest poverty rate of 0.0%, which includes 0 families.
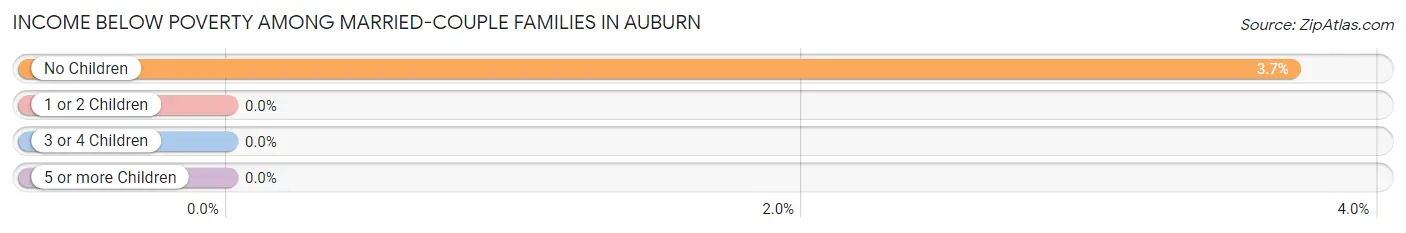
| Children | Above Poverty | Below Poverty |
| No Children | 443 (96.3%) | 17 (3.7%) |
| 1 or 2 Children | 259 (100.0%) | 0 (0.0%) |
| 3 or 4 Children | 58 (100.0%) | 0 (0.0%) |
| 5 or more Children | 0 (0.0%) | 0 (0.0%) |
| Total | 760 (97.8%) | 17 (2.2%) |
Income Below Poverty Among Single-Parent Households in Auburn
| Children | Single Father | Single Mother |
| No Children | 0 (0.0%) | 0 (0.0%) |
| 1 or 2 Children | 0 (0.0%) | 0 (0.0%) |
| 3 or 4 Children | 0 (0.0%) | 0 (0.0%) |
| 5 or more Children | 0 (0.0%) | 0 (0.0%) |
| Total | 0 (0.0%) | 0 (0.0%) |
Income Below Poverty Among Married-Couple vs Single-Parent Households in Auburn
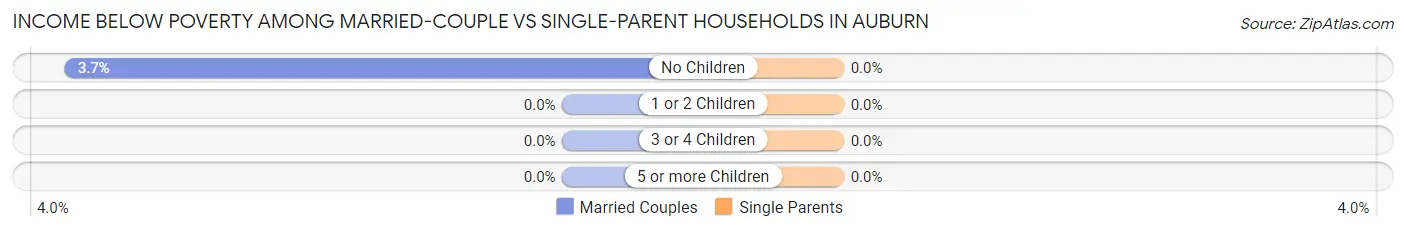
| Children | Married-Couple Families | Single-Parent Households |
| No Children | 17 (3.7%) | 0 (0.0%) |
| 1 or 2 Children | 0 (0.0%) | 0 (0.0%) |
| 3 or 4 Children | 0 (0.0%) | 0 (0.0%) |
| 5 or more Children | 0 (0.0%) | 0 (0.0%) |
| Total | 17 (2.2%) | 0 (0.0%) |
Race in Auburn
The most populous races in Auburn are White / Caucasian (4,427 | 97.6%), Hispanic or Latino (284 | 6.3%), and Two or more Races (108 | 2.4%).
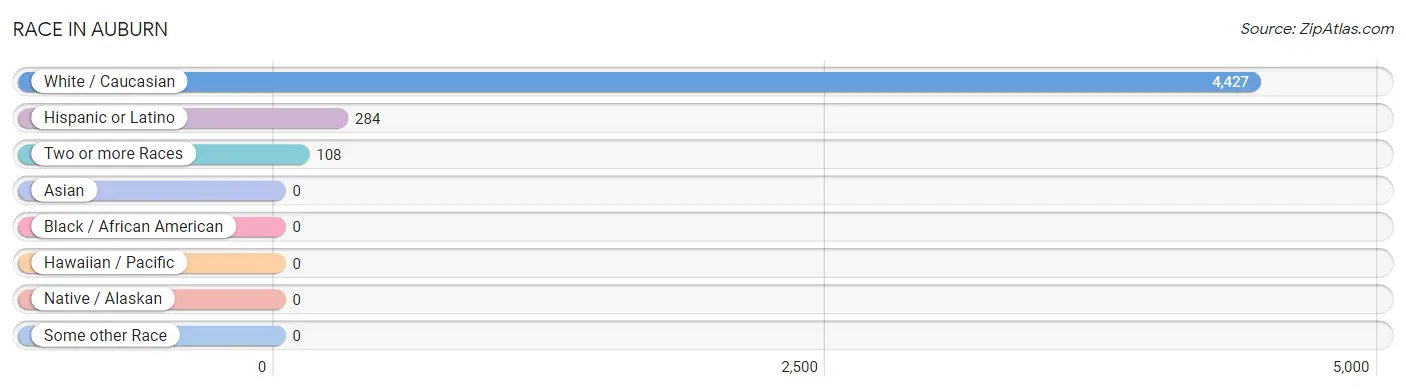
| Race | # Population | % Population |
| Asian | 0 | 0.0% |
| Black / African American | 0 | 0.0% |
| Hawaiian / Pacific | 0 | 0.0% |
| Hispanic or Latino | 284 | 6.3% |
| Native / Alaskan | 0 | 0.0% |
| White / Caucasian | 4,427 | 97.6% |
| Two or more Races | 108 | 2.4% |
| Some other Race | 0 | 0.0% |
| Total | 4,535 | 100.0% |
Ancestry in Auburn
The most populous ancestries reported in Auburn are German (1,063 | 23.4%), Irish (494 | 10.9%), English (447 | 9.9%), Italian (318 | 7.0%), and Mexican (208 | 4.6%), together accounting for 55.8% of all Auburn residents.
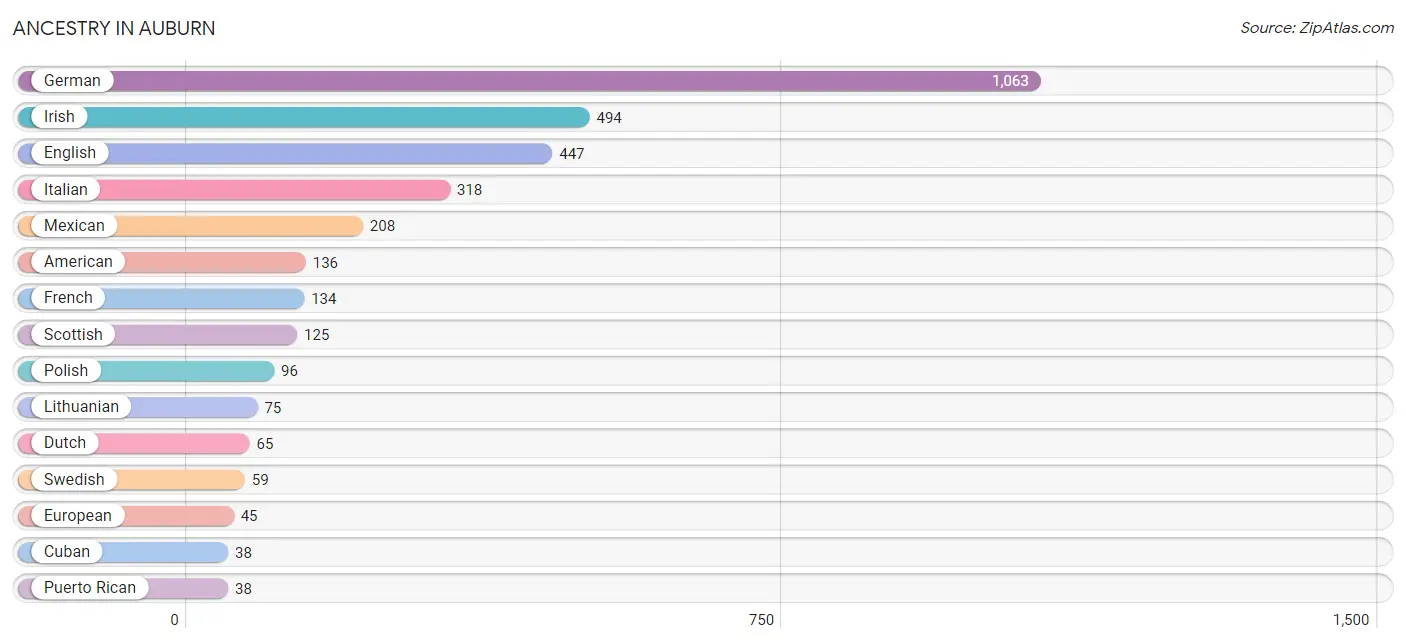
| Ancestry | # Population | % Population |
| American | 136 | 3.0% |
| British | 16 | 0.4% |
| Cuban | 38 | 0.8% |
| Czechoslovakian | 15 | 0.3% |
| Dutch | 65 | 1.4% |
| English | 447 | 9.9% |
| European | 45 | 1.0% |
| French | 134 | 2.9% |
| French American Indian | 10 | 0.2% |
| German | 1,063 | 23.4% |
| Irish | 494 | 10.9% |
| Italian | 318 | 7.0% |
| Lithuanian | 75 | 1.7% |
| Mexican | 208 | 4.6% |
| Norwegian | 36 | 0.8% |
| Polish | 96 | 2.1% |
| Puerto Rican | 38 | 0.8% |
| Scotch-Irish | 16 | 0.4% |
| Scottish | 125 | 2.8% |
| Slovak | 30 | 0.7% |
| Slovene | 17 | 0.4% |
| Swedish | 59 | 1.3% | View All 22 Rows |
Immigrants in Auburn

| Immigration Origin | # Population | % Population | View All 0 Rows |
Sex and Age in Auburn
Sex and Age in Auburn
The most populous age groups in Auburn are 40 to 44 Years (259 | 12.1%) for men and 15 to 19 Years (285 | 11.9%) for women.
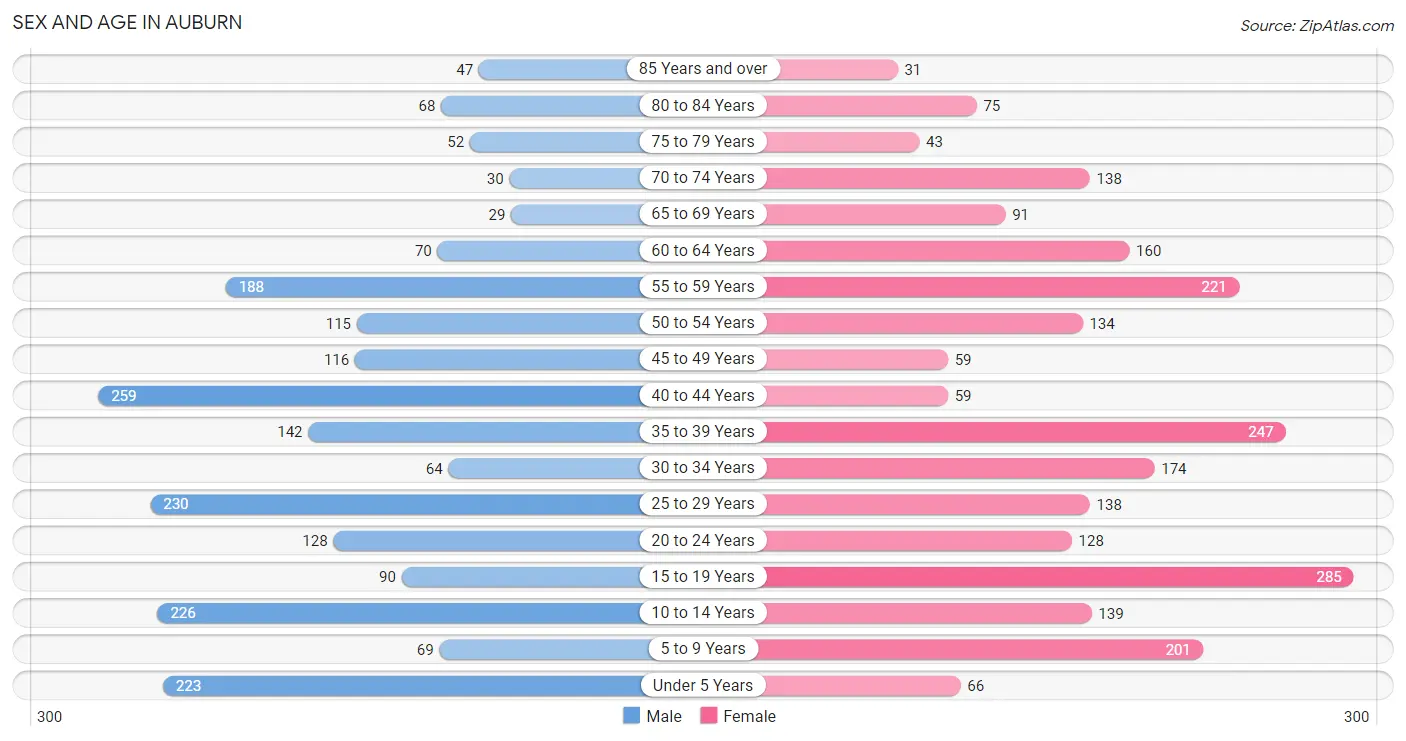
| Age Bracket | Male | Female |
| Under 5 Years | 223 (10.4%) | 66 (2.8%) |
| 5 to 9 Years | 69 (3.2%) | 201 (8.4%) |
| 10 to 14 Years | 226 (10.5%) | 139 (5.8%) |
| 15 to 19 Years | 90 (4.2%) | 285 (11.9%) |
| 20 to 24 Years | 128 (6.0%) | 128 (5.4%) |
| 25 to 29 Years | 230 (10.7%) | 138 (5.8%) |
| 30 to 34 Years | 64 (3.0%) | 174 (7.3%) |
| 35 to 39 Years | 142 (6.6%) | 247 (10.3%) |
| 40 to 44 Years | 259 (12.1%) | 59 (2.5%) |
| 45 to 49 Years | 116 (5.4%) | 59 (2.5%) |
| 50 to 54 Years | 115 (5.4%) | 134 (5.6%) |
| 55 to 59 Years | 188 (8.8%) | 221 (9.2%) |
| 60 to 64 Years | 70 (3.3%) | 160 (6.7%) |
| 65 to 69 Years | 29 (1.3%) | 91 (3.8%) |
| 70 to 74 Years | 30 (1.4%) | 138 (5.8%) |
| 75 to 79 Years | 52 (2.4%) | 43 (1.8%) |
| 80 to 84 Years | 68 (3.2%) | 75 (3.1%) |
| 85 Years and over | 47 (2.2%) | 31 (1.3%) |
| Total | 2,146 (100.0%) | 2,389 (100.0%) |
Families and Households in Auburn
Median Family Size in Auburn
The median family size in Auburn is 3.43 persons per family, with single male/father families (75 | 6.9%) accounting for the largest median family size of 6.04 persons per family. On the other hand, single female/mother families (240 | 22.0%) represent the smallest median family size with 3.15 persons per family.
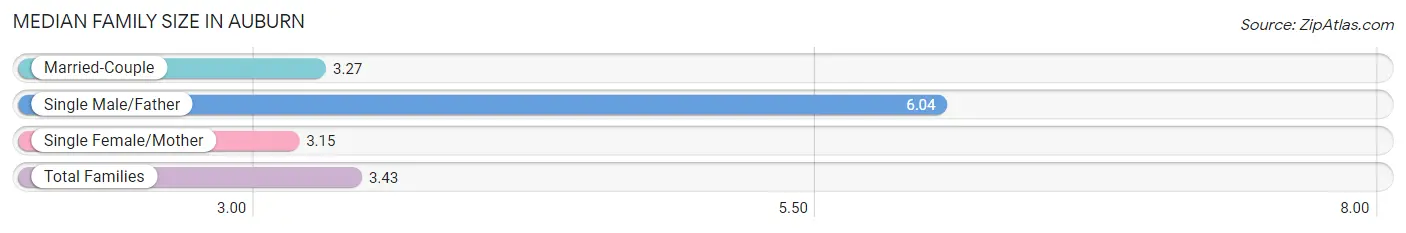
| Family Type | # Families | Family Size |
| Married-Couple | 777 (71.2%) | 3.27 |
| Single Male/Father | 75 (6.9%) | 6.04 |
| Single Female/Mother | 240 (22.0%) | 3.15 |
| Total Families | 1,092 (100.0%) | 3.43 |
Median Household Size in Auburn
The median household size in Auburn is 2.85 persons per household, with single male/father households (75 | 4.8%) accounting for the largest median household size of 7.04 persons per household. non-family households (479 | 30.5%) represent the smallest median household size with 1.22 persons per household.
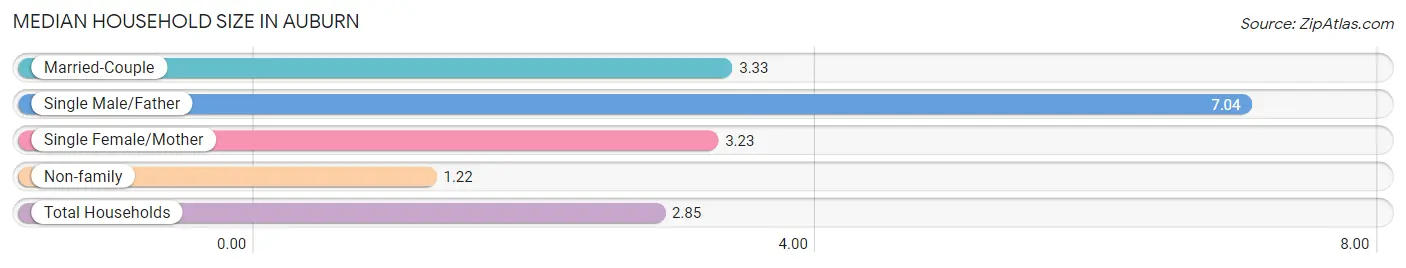
| Household Type | # Households | Household Size |
| Married-Couple | 777 (49.5%) | 3.33 |
| Single Male/Father | 75 (4.8%) | 7.04 |
| Single Female/Mother | 240 (15.3%) | 3.23 |
| Non-family | 479 (30.5%) | 1.22 |
| Total Households | 1,571 (100.0%) | 2.85 |
Household Size by Marriage Status in Auburn
Out of a total of 1,571 households in Auburn, 1,092 (69.5%) are family households, while 479 (30.5%) are nonfamily households. The most numerous type of family households are 2-person households, comprising 422, and the most common type of nonfamily households are 1-person households, comprising 394.
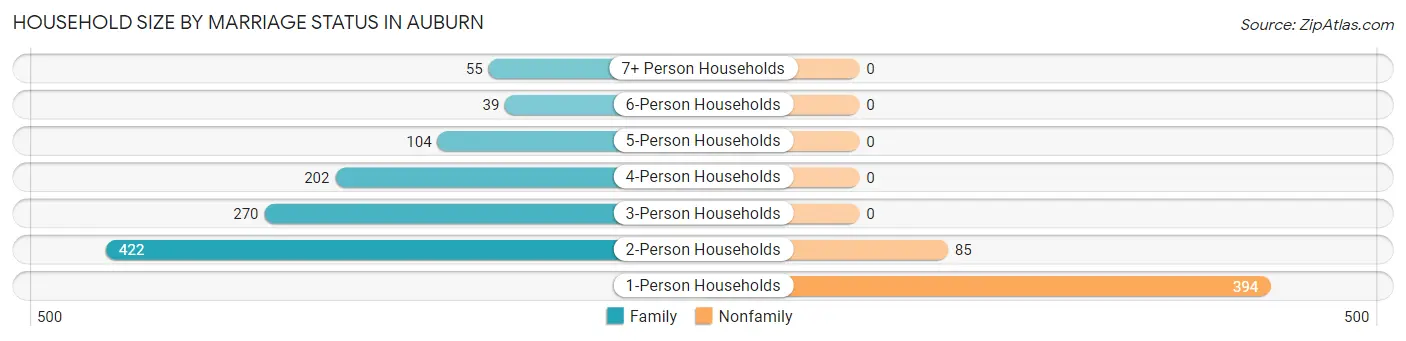
| Household Size | Family Households | Nonfamily Households |
| 1-Person Households | - | 394 (25.1%) |
| 2-Person Households | 422 (26.9%) | 85 (5.4%) |
| 3-Person Households | 270 (17.2%) | 0 (0.0%) |
| 4-Person Households | 202 (12.9%) | 0 (0.0%) |
| 5-Person Households | 104 (6.6%) | 0 (0.0%) |
| 6-Person Households | 39 (2.5%) | 0 (0.0%) |
| 7+ Person Households | 55 (3.5%) | 0 (0.0%) |
| Total | 1,092 (69.5%) | 479 (30.5%) |
Female Fertility in Auburn
Fertility by Age in Auburn
Average fertility rate in Auburn is 13.0 births per 1,000 women. Women in the age bracket of 35 to 50 years have the highest fertility rate with 38.0 births per 1,000 women. Women in the age bracket of 35 to 50 years acount for 100.0% of all women with births.
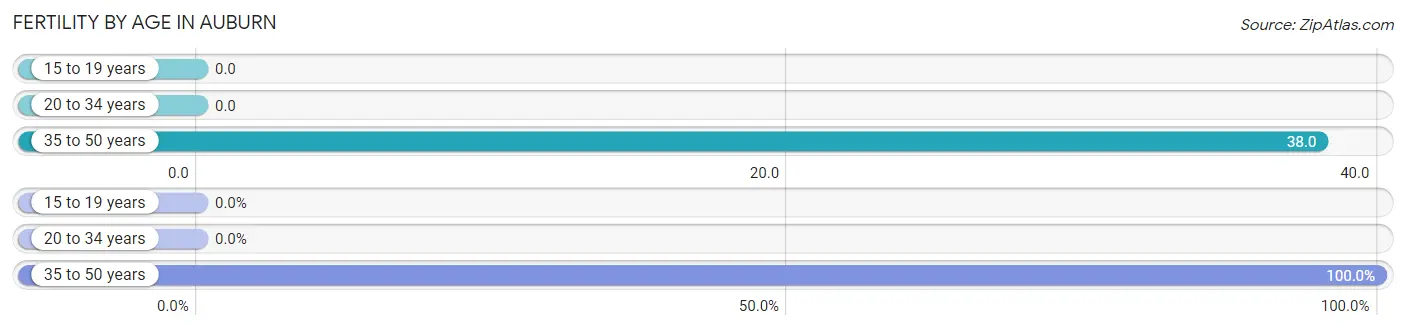
| Age Bracket | Women with Births | Births / 1,000 Women |
| 15 to 19 years | 0 (0.0%) | 0.0 |
| 20 to 34 years | 0 (0.0%) | 0.0 |
| 35 to 50 years | 14 (100.0%) | 38.0 |
| Total | 14 (100.0%) | 13.0 |
Fertility by Age by Marriage Status in Auburn
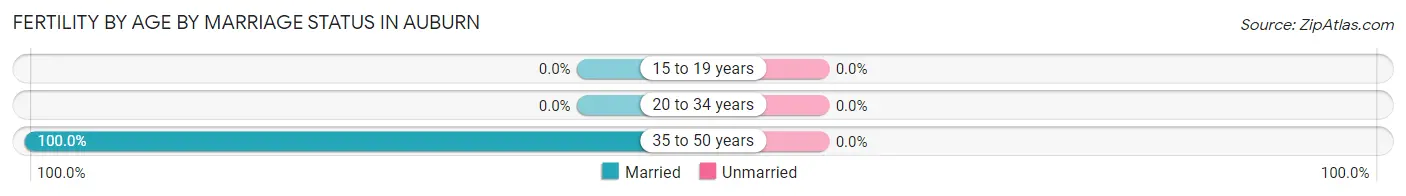
| Age Bracket | Married | Unmarried |
| 15 to 19 years | 0 (0.0%) | 0 (0.0%) |
| 20 to 34 years | 0 (0.0%) | 0 (0.0%) |
| 35 to 50 years | 14 (100.0%) | 0 (0.0%) |
| Total | 14 (100.0%) | 0 (0.0%) |
Fertility by Education in Auburn
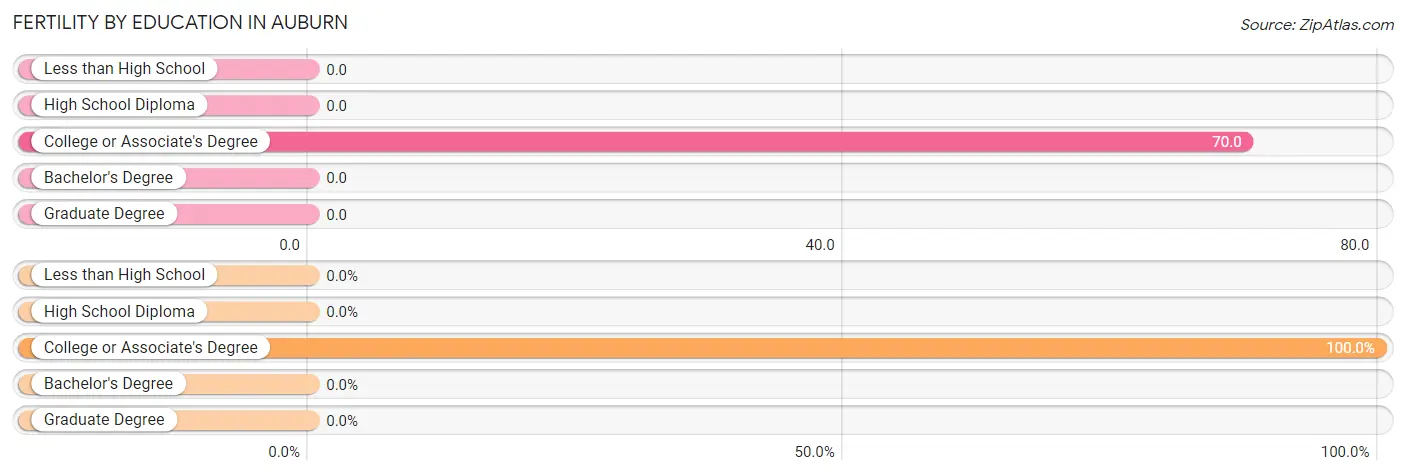
| Educational Attainment | Women with Births | Births / 1,000 Women |
| Less than High School | 0 (0.0%) | 0.0 |
| High School Diploma | 0 (0.0%) | 0.0 |
| College or Associate's Degree | 14 (100.0%) | 70.0 |
| Bachelor's Degree | 0 (0.0%) | 0.0 |
| Graduate Degree | 0 (0.0%) | 0.0 |
| Total | 14 (100.0%) | 13.0 |
Fertility by Education by Marriage Status in Auburn
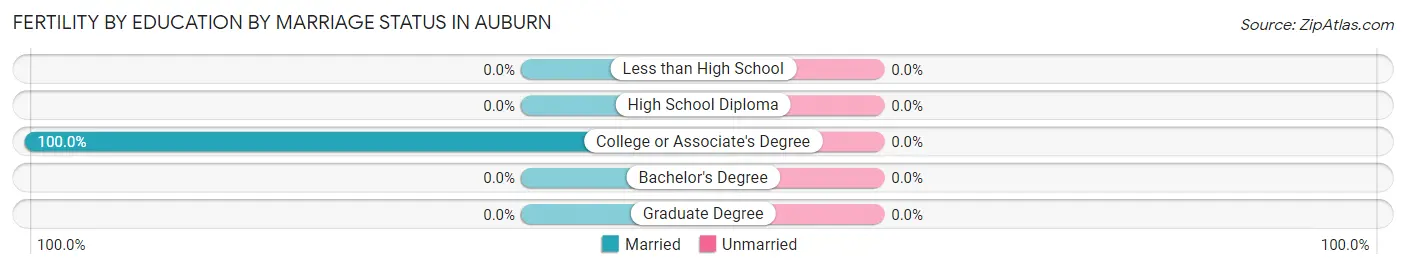
| Educational Attainment | Married | Unmarried |
| Less than High School | 0 (0.0%) | 0 (0.0%) |
| High School Diploma | 0 (0.0%) | 0 (0.0%) |
| College or Associate's Degree | 14 (100.0%) | 0 (0.0%) |
| Bachelor's Degree | 0 (0.0%) | 0 (0.0%) |
| Graduate Degree | 0 (0.0%) | 0 (0.0%) |
| Total | 14 (100.0%) | 0 (0.0%) |
Employment Characteristics in Auburn
Employment by Class of Employer in Auburn
Among the 2,186 employed individuals in Auburn, private company employees (901 | 41.2%), not-for-profit organizations (360 | 16.5%), and local government employees (331 | 15.1%) make up the most common classes of employment.
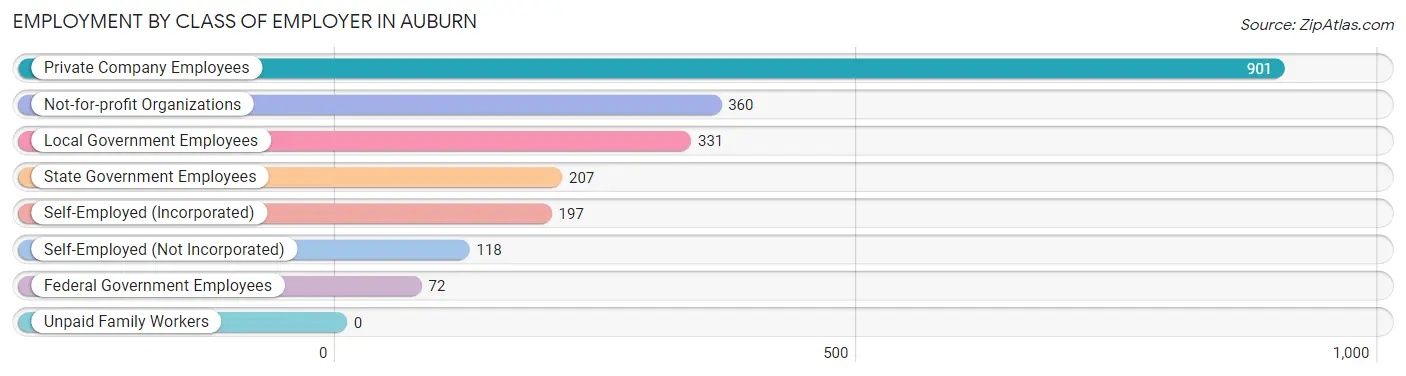
| Employer Class | # Employees | % Employees |
| Private Company Employees | 901 | 41.2% |
| Self-Employed (Incorporated) | 197 | 9.0% |
| Self-Employed (Not Incorporated) | 118 | 5.4% |
| Not-for-profit Organizations | 360 | 16.5% |
| Local Government Employees | 331 | 15.1% |
| State Government Employees | 207 | 9.5% |
| Federal Government Employees | 72 | 3.3% |
| Unpaid Family Workers | 0 | 0.0% |
| Total | 2,186 | 100.0% |
Employment Status by Age in Auburn
According to the labor force statistics for Auburn, out of the total population over 16 years of age (3,506), 62.8% or 2,202 individuals are in the labor force, with 0.8% or 18 of them unemployed. The age group with the highest labor force participation rate is 20 to 24 years, with 89.8% or 230 individuals in the labor force. Within the labor force, the 65 to 74 years age range has the highest percentage of unemployed individuals, with 100.0% or 17 of them being unemployed.
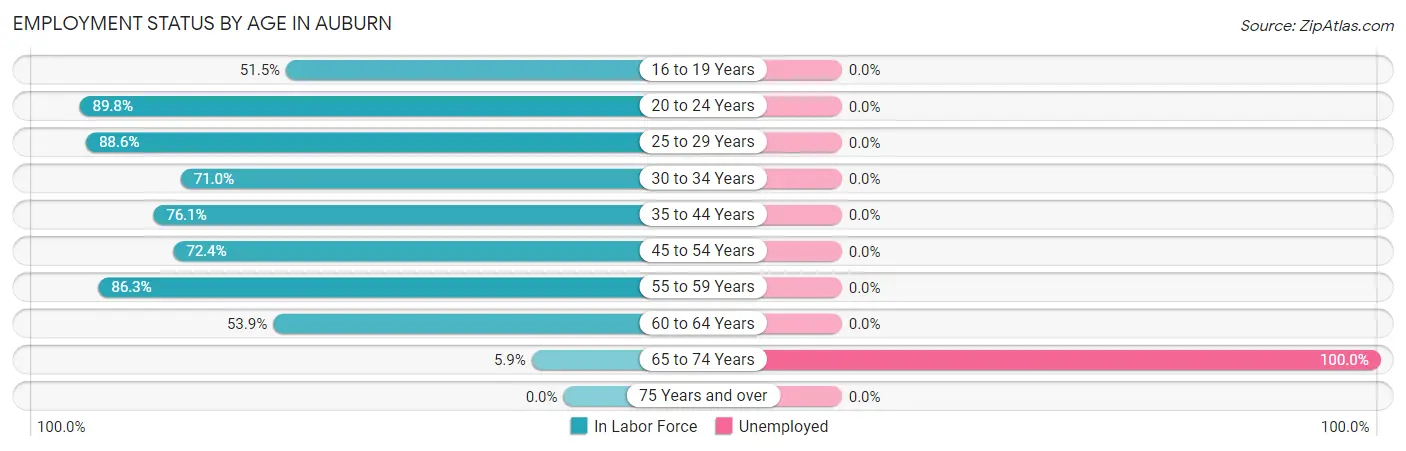
| Age Bracket | In Labor Force | Unemployed |
| 16 to 19 Years | 139 (51.5%) | 0 (0.0%) |
| 20 to 24 Years | 230 (89.8%) | 0 (0.0%) |
| 25 to 29 Years | 326 (88.6%) | 0 (0.0%) |
| 30 to 34 Years | 169 (71.0%) | 0 (0.0%) |
| 35 to 44 Years | 538 (76.1%) | 0 (0.0%) |
| 45 to 54 Years | 307 (72.4%) | 0 (0.0%) |
| 55 to 59 Years | 353 (86.3%) | 0 (0.0%) |
| 60 to 64 Years | 124 (53.9%) | 0 (0.0%) |
| 65 to 74 Years | 17 (5.9%) | 17 (100.0%) |
| 75 Years and over | 0 (0.0%) | 0 (0.0%) |
| Total | 2,202 (62.8%) | 18 (0.8%) |
Employment Status by Educational Attainment in Auburn
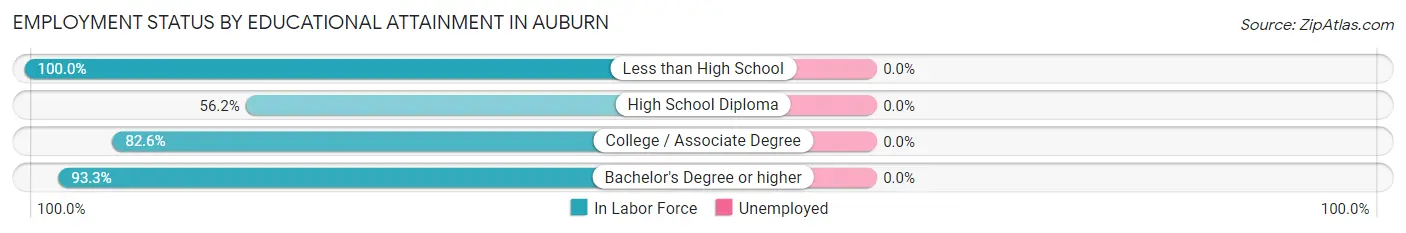
| Educational Attainment | In Labor Force | Unemployed |
| Less than High School | 26 (100.0%) | 0 (0.0%) |
| High School Diploma | 493 (56.2%) | 0 (0.0%) |
| College / Associate Degree | 587 (82.6%) | 0 (0.0%) |
| Bachelor's Degree or higher | 711 (93.3%) | 0 (0.0%) |
| Total | 1,818 (76.5%) | 0 (0.0%) |
Employment Occupations by Sex in Auburn
Management, Business, Science and Arts Occupations
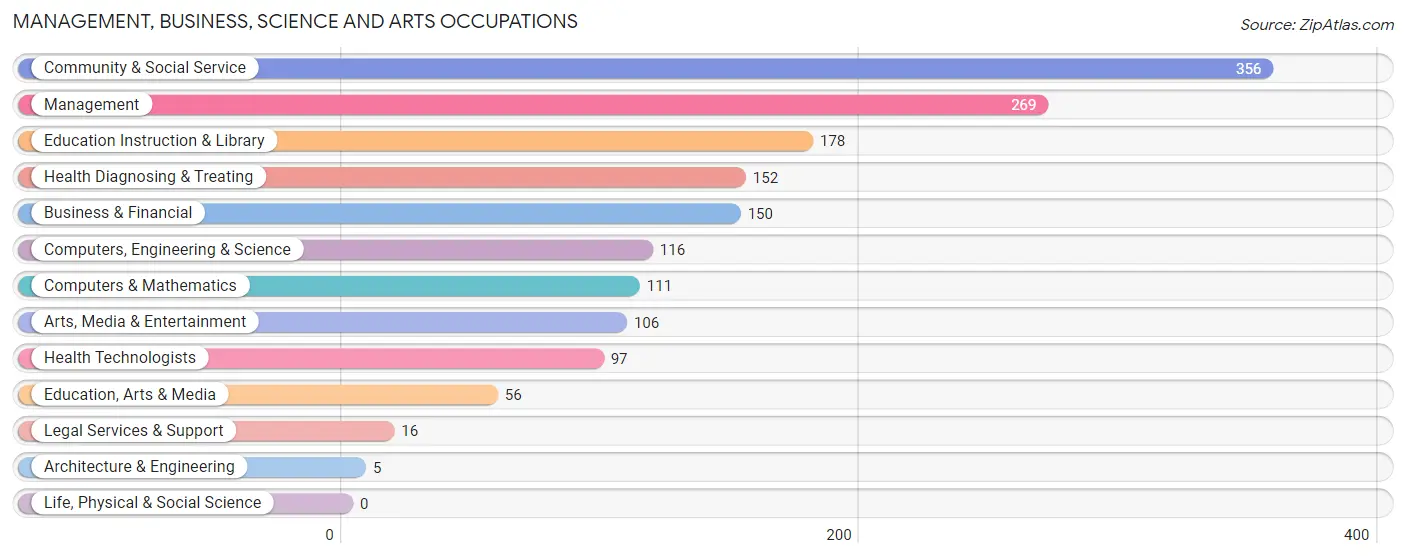
The most common Management, Business, Science and Arts occupations in Auburn are Community & Social Service (356 | 16.3%), Management (269 | 12.3%), Education Instruction & Library (178 | 8.1%), Health Diagnosing & Treating (152 | 7.0%), and Business & Financial (150 | 6.9%).
Management, Business, Science and Arts Occupations by Sex
Within the Management, Business, Science and Arts occupations in Auburn, the most male-oriented occupations are Architecture & Engineering (100.0%), Management (74.7%), and Business & Financial (69.3%), while the most female-oriented occupations are Legal Services & Support (100.0%), Health Diagnosing & Treating (100.0%), and Health Technologists (100.0%).
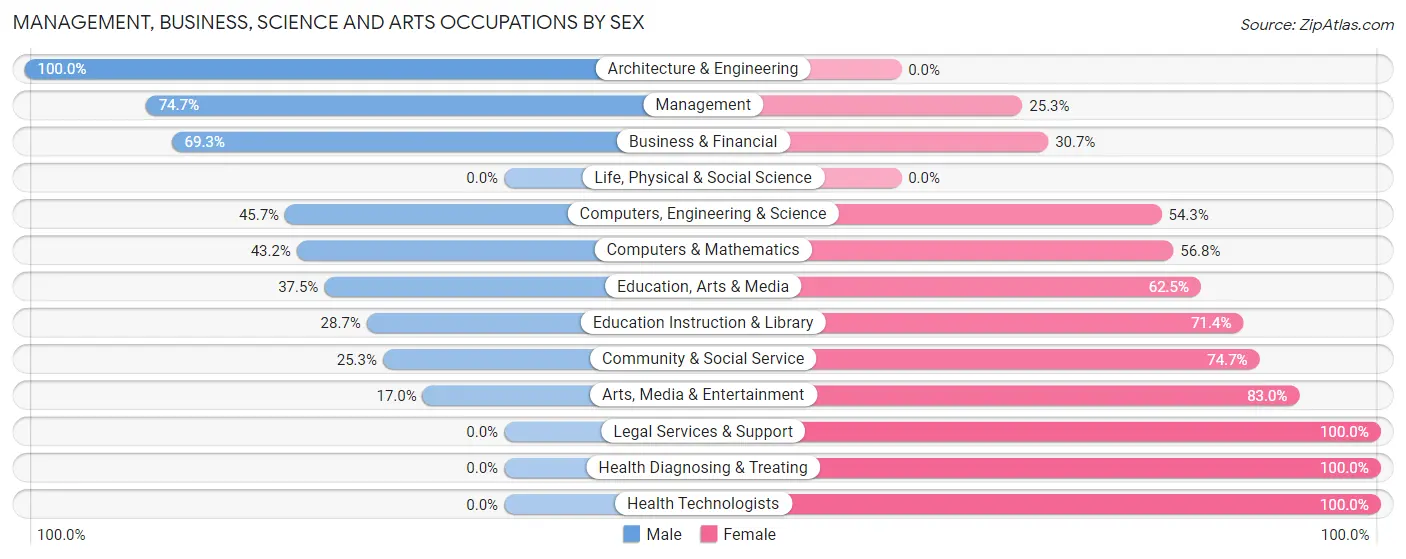
| Occupation | Male | Female |
| Management | 201 (74.7%) | 68 (25.3%) |
| Business & Financial | 104 (69.3%) | 46 (30.7%) |
| Computers, Engineering & Science | 53 (45.7%) | 63 (54.3%) |
| Computers & Mathematics | 48 (43.2%) | 63 (56.8%) |
| Architecture & Engineering | 5 (100.0%) | 0 (0.0%) |
| Life, Physical & Social Science | 0 (0.0%) | 0 (0.0%) |
| Community & Social Service | 90 (25.3%) | 266 (74.7%) |
| Education, Arts & Media | 21 (37.5%) | 35 (62.5%) |
| Legal Services & Support | 0 (0.0%) | 16 (100.0%) |
| Education Instruction & Library | 51 (28.6%) | 127 (71.4%) |
| Arts, Media & Entertainment | 18 (17.0%) | 88 (83.0%) |
| Health Diagnosing & Treating | 0 (0.0%) | 152 (100.0%) |
| Health Technologists | 0 (0.0%) | 97 (100.0%) |
| Total (Category) | 448 (42.9%) | 595 (57.1%) |
| Total (Overall) | 1,050 (48.0%) | 1,136 (52.0%) |
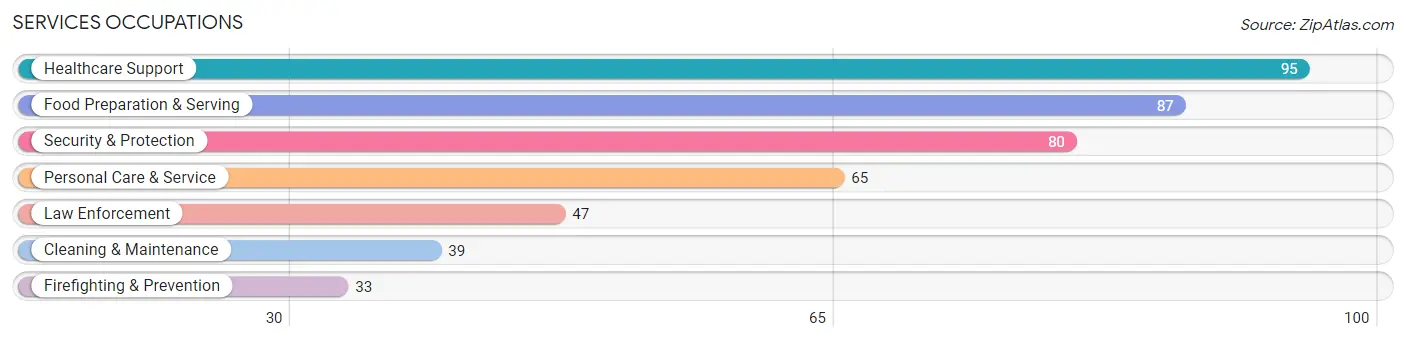
Services Occupations
The most common Services occupations in Auburn are Healthcare Support (95 | 4.3%), Food Preparation & Serving (87 | 4.0%), Security & Protection (80 | 3.7%), Personal Care & Service (65 | 3.0%), and Law Enforcement (47 | 2.1%).
Services Occupations by Sex
Within the Services occupations in Auburn, the most male-oriented occupations are Security & Protection (100.0%), Firefighting & Prevention (100.0%), and Law Enforcement (100.0%), while the most female-oriented occupations are Food Preparation & Serving (100.0%), Personal Care & Service (100.0%), and Healthcare Support (56.8%).
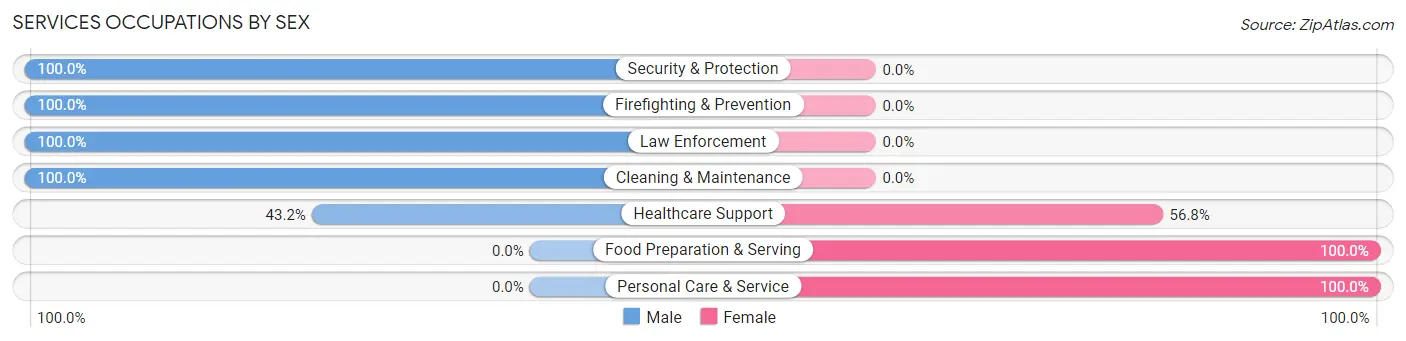
| Occupation | Male | Female |
| Healthcare Support | 41 (43.2%) | 54 (56.8%) |
| Security & Protection | 80 (100.0%) | 0 (0.0%) |
| Firefighting & Prevention | 33 (100.0%) | 0 (0.0%) |
| Law Enforcement | 47 (100.0%) | 0 (0.0%) |
| Food Preparation & Serving | 0 (0.0%) | 87 (100.0%) |
| Cleaning & Maintenance | 39 (100.0%) | 0 (0.0%) |
| Personal Care & Service | 0 (0.0%) | 65 (100.0%) |
| Total (Category) | 160 (43.7%) | 206 (56.3%) |
| Total (Overall) | 1,050 (48.0%) | 1,136 (52.0%) |
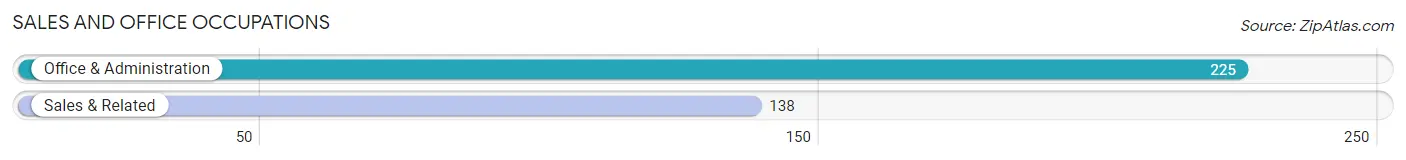
Sales and Office Occupations
The most common Sales and Office occupations in Auburn are Office & Administration (225 | 10.3%), and Sales & Related (138 | 6.3%).
Sales and Office Occupations by Sex
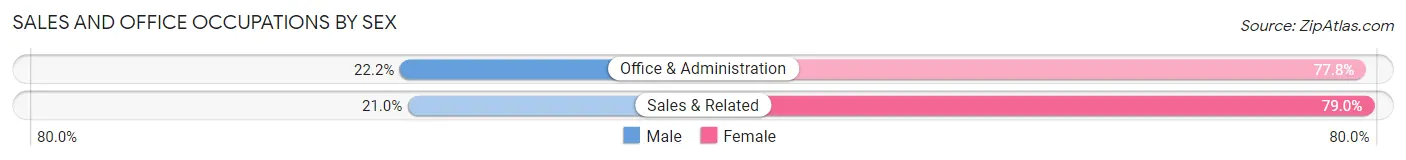
| Occupation | Male | Female |
| Sales & Related | 29 (21.0%) | 109 (79.0%) |
| Office & Administration | 50 (22.2%) | 175 (77.8%) |
| Total (Category) | 79 (21.8%) | 284 (78.2%) |
| Total (Overall) | 1,050 (48.0%) | 1,136 (52.0%) |
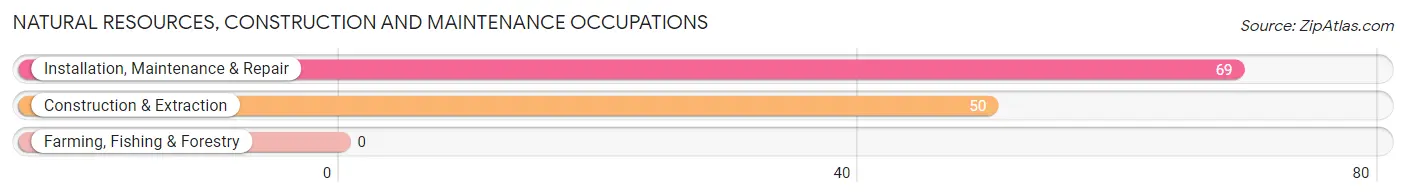
Natural Resources, Construction and Maintenance Occupations
The most common Natural Resources, Construction and Maintenance occupations in Auburn are Installation, Maintenance & Repair (69 | 3.2%), and Construction & Extraction (50 | 2.3%).
Natural Resources, Construction and Maintenance Occupations by Sex
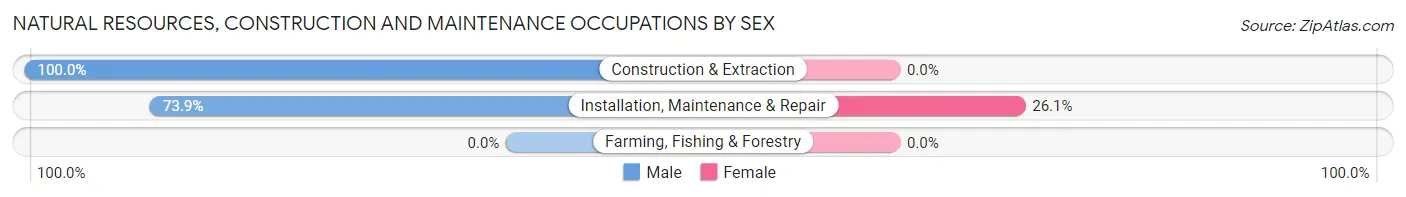
| Occupation | Male | Female |
| Farming, Fishing & Forestry | 0 (0.0%) | 0 (0.0%) |
| Construction & Extraction | 50 (100.0%) | 0 (0.0%) |
| Installation, Maintenance & Repair | 51 (73.9%) | 18 (26.1%) |
| Total (Category) | 101 (84.9%) | 18 (15.1%) |
| Total (Overall) | 1,050 (48.0%) | 1,136 (52.0%) |
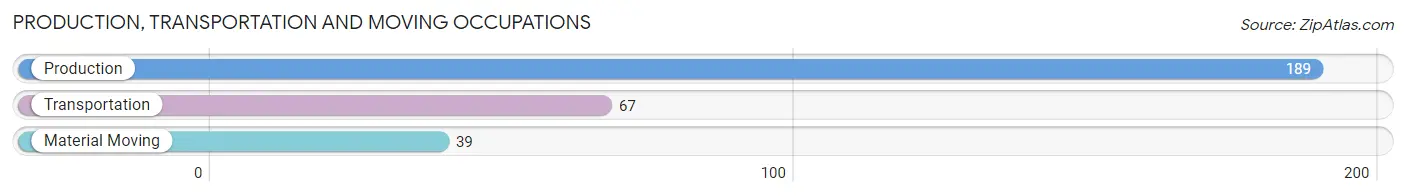
Production, Transportation and Moving Occupations
The most common Production, Transportation and Moving occupations in Auburn are Production (189 | 8.6%), Transportation (67 | 3.1%), and Material Moving (39 | 1.8%).
Production, Transportation and Moving Occupations by Sex
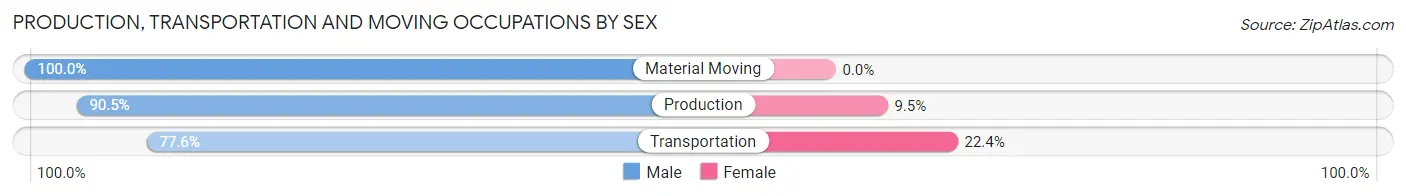
| Occupation | Male | Female |
| Production | 171 (90.5%) | 18 (9.5%) |
| Transportation | 52 (77.6%) | 15 (22.4%) |
| Material Moving | 39 (100.0%) | 0 (0.0%) |
| Total (Category) | 262 (88.8%) | 33 (11.2%) |
| Total (Overall) | 1,050 (48.0%) | 1,136 (52.0%) |
Employment Industries by Sex in Auburn
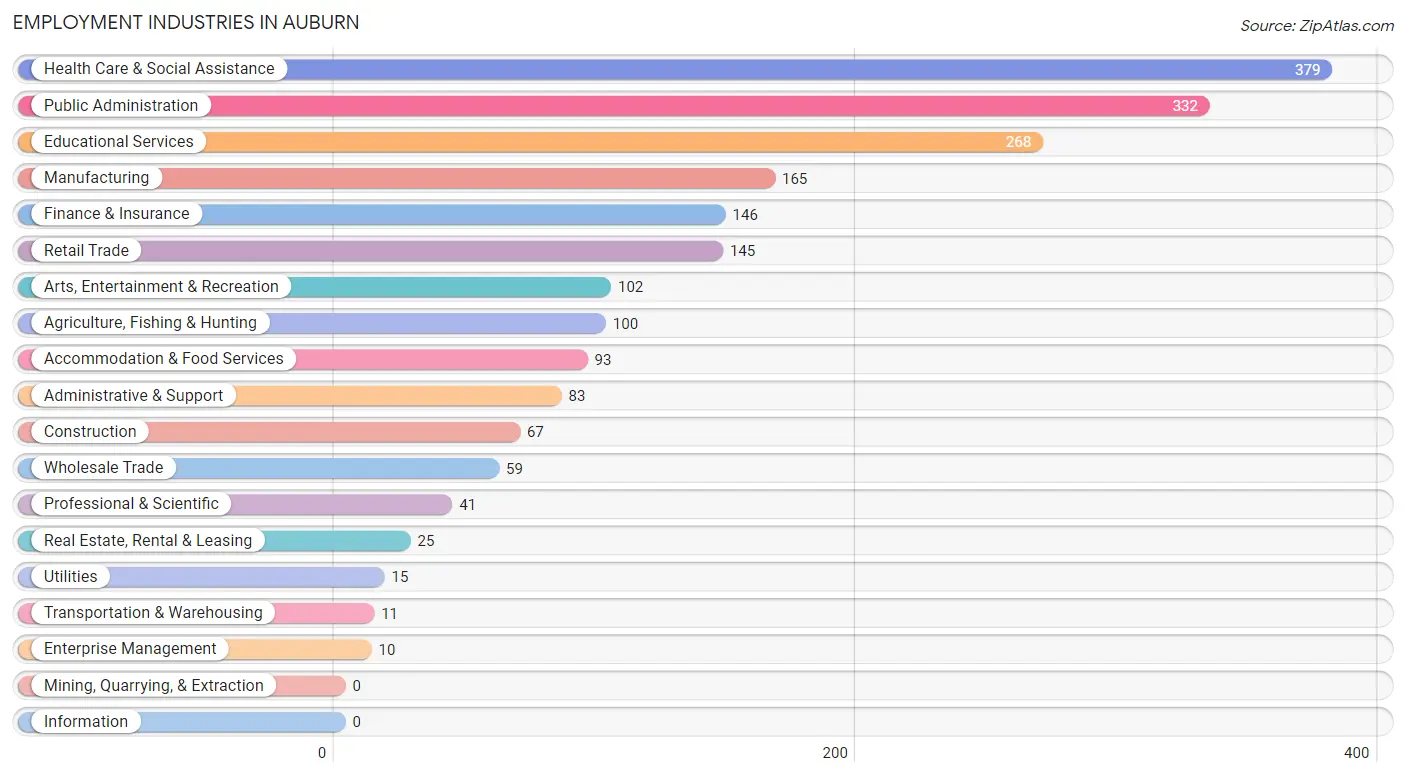
Employment Industries in Auburn
The major employment industries in Auburn include Health Care & Social Assistance (379 | 17.3%), Public Administration (332 | 15.2%), Educational Services (268 | 12.3%), Manufacturing (165 | 7.5%), and Finance & Insurance (146 | 6.7%).
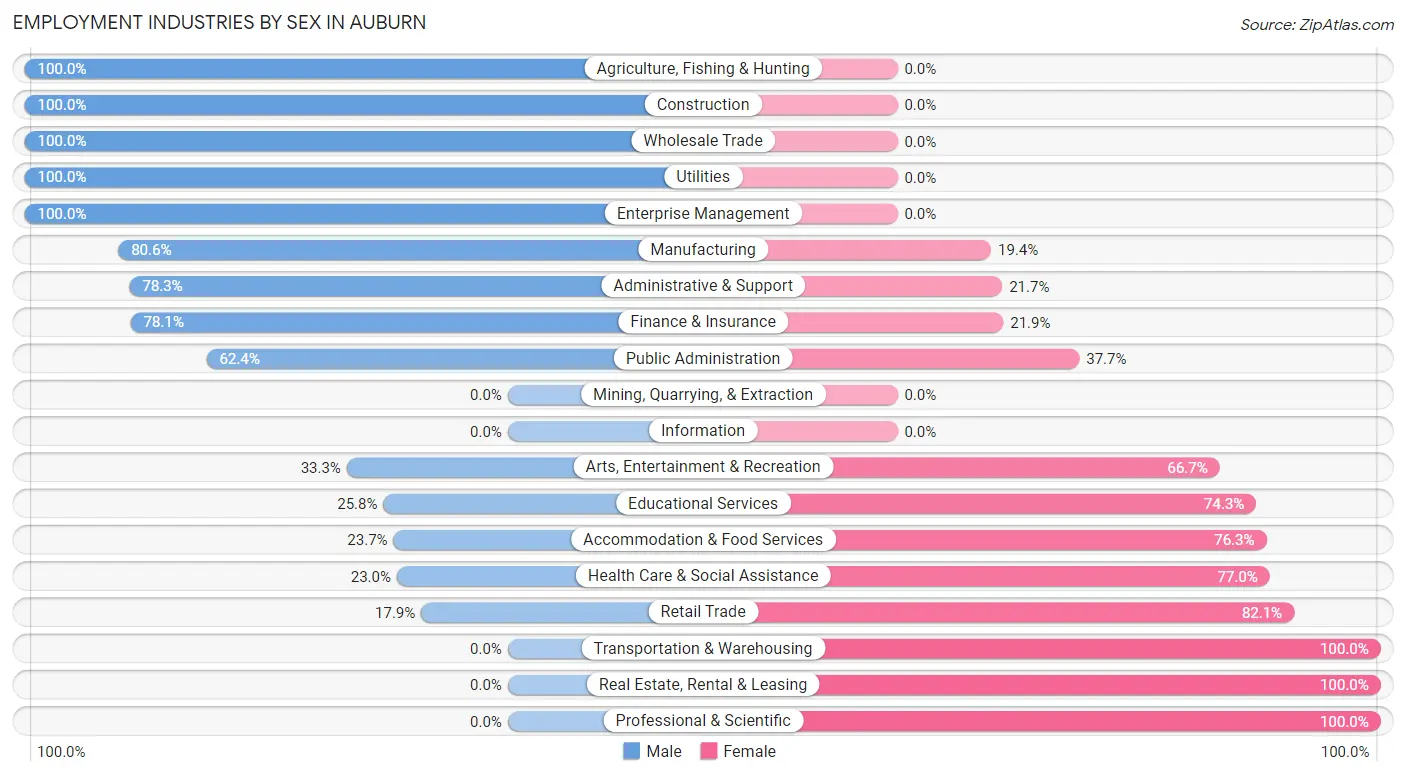
Employment Industries by Sex in Auburn
The Auburn industries that see more men than women are Agriculture, Fishing & Hunting (100.0%), Construction (100.0%), and Wholesale Trade (100.0%), whereas the industries that tend to have a higher number of women are Transportation & Warehousing (100.0%), Real Estate, Rental & Leasing (100.0%), and Professional & Scientific (100.0%).
| Industry | Male | Female |
| Agriculture, Fishing & Hunting | 100 (100.0%) | 0 (0.0%) |
| Mining, Quarrying, & Extraction | 0 (0.0%) | 0 (0.0%) |
| Construction | 67 (100.0%) | 0 (0.0%) |
| Manufacturing | 133 (80.6%) | 32 (19.4%) |
| Wholesale Trade | 59 (100.0%) | 0 (0.0%) |
| Retail Trade | 26 (17.9%) | 119 (82.1%) |
| Transportation & Warehousing | 0 (0.0%) | 11 (100.0%) |
| Utilities | 15 (100.0%) | 0 (0.0%) |
| Information | 0 (0.0%) | 0 (0.0%) |
| Finance & Insurance | 114 (78.1%) | 32 (21.9%) |
| Real Estate, Rental & Leasing | 0 (0.0%) | 25 (100.0%) |
| Professional & Scientific | 0 (0.0%) | 41 (100.0%) |
| Enterprise Management | 10 (100.0%) | 0 (0.0%) |
| Administrative & Support | 65 (78.3%) | 18 (21.7%) |
| Educational Services | 69 (25.8%) | 199 (74.3%) |
| Health Care & Social Assistance | 87 (23.0%) | 292 (77.0%) |
| Arts, Entertainment & Recreation | 34 (33.3%) | 68 (66.7%) |
| Accommodation & Food Services | 22 (23.7%) | 71 (76.3%) |
| Public Administration | 207 (62.4%) | 125 (37.7%) |
| Total | 1,050 (48.0%) | 1,136 (52.0%) |
Education in Auburn
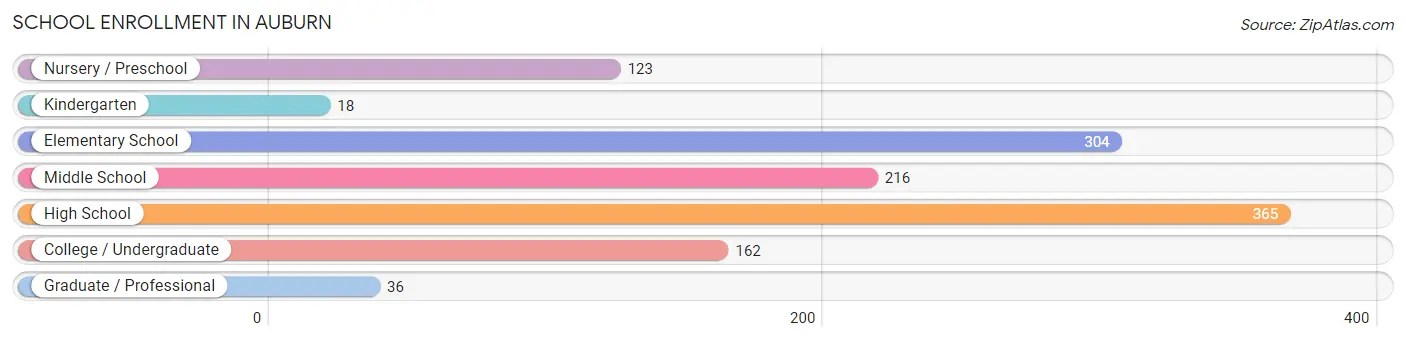
School Enrollment in Auburn
The most common levels of schooling among the 1,224 students in Auburn are high school (365 | 29.8%), elementary school (304 | 24.8%), and middle school (216 | 17.6%).
| School Level | # Students | % Students |
| Nursery / Preschool | 123 | 10.1% |
| Kindergarten | 18 | 1.5% |
| Elementary School | 304 | 24.8% |
| Middle School | 216 | 17.6% |
| High School | 365 | 29.8% |
| College / Undergraduate | 162 | 13.2% |
| Graduate / Professional | 36 | 2.9% |
| Total | 1,224 | 100.0% |
School Enrollment by Age by Funding Source in Auburn
Out of a total of 1,224 students who are enrolled in schools in Auburn, 188 (15.4%) attend a private institution, while the remaining 1,036 (84.6%) are enrolled in public schools. The age group of 3 to 4 year olds has the highest likelihood of being enrolled in private schools, with 23 (43.4% in the age bracket) enrolled. Conversely, the age group of 15 to 17 year olds has the lowest likelihood of being enrolled in a private school, with 255 (100.0% in the age bracket) attending a public institution.
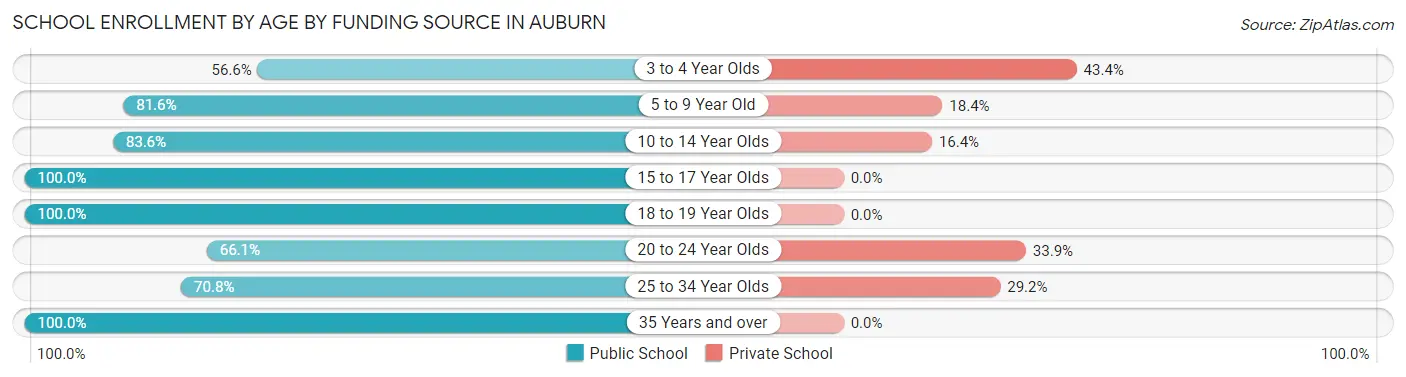
| Age Bracket | Public School | Private School |
| 3 to 4 Year Olds | 30 (56.6%) | 23 (43.4%) |
| 5 to 9 Year Old | 213 (81.6%) | 48 (18.4%) |
| 10 to 14 Year Olds | 305 (83.6%) | 60 (16.4%) |
| 15 to 17 Year Olds | 255 (100.0%) | 0 (0.0%) |
| 18 to 19 Year Olds | 94 (100.0%) | 0 (0.0%) |
| 20 to 24 Year Olds | 72 (66.1%) | 37 (33.9%) |
| 25 to 34 Year Olds | 51 (70.8%) | 21 (29.2%) |
| 35 Years and over | 15 (100.0%) | 0 (0.0%) |
| Total | 1,036 (84.6%) | 188 (15.4%) |
Educational Attainment by Field of Study in Auburn
Education (215 | 21.6%), business (199 | 20.0%), arts & humanities (159 | 16.0%), science & technology (98 | 9.8%), and psychology (70 | 7.0%) are the most common fields of study among 996 individuals in Auburn who have obtained a bachelor's degree or higher.
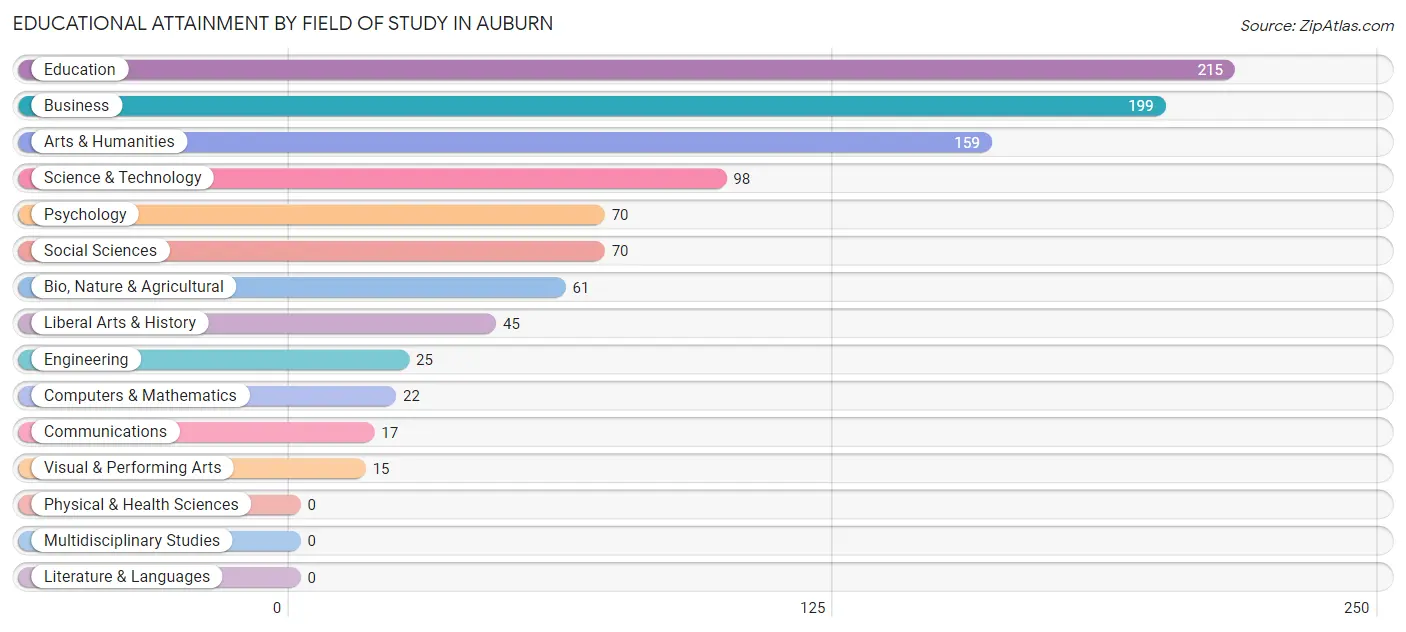
| Field of Study | # Graduates | % Graduates |
| Computers & Mathematics | 22 | 2.2% |
| Bio, Nature & Agricultural | 61 | 6.1% |
| Physical & Health Sciences | 0 | 0.0% |
| Psychology | 70 | 7.0% |
| Social Sciences | 70 | 7.0% |
| Engineering | 25 | 2.5% |
| Multidisciplinary Studies | 0 | 0.0% |
| Science & Technology | 98 | 9.8% |
| Business | 199 | 20.0% |
| Education | 215 | 21.6% |
| Literature & Languages | 0 | 0.0% |
| Liberal Arts & History | 45 | 4.5% |
| Visual & Performing Arts | 15 | 1.5% |
| Communications | 17 | 1.7% |
| Arts & Humanities | 159 | 16.0% |
| Total | 996 | 100.0% |
Transportation & Commute in Auburn
Vehicle Availability by Sex in Auburn
The most prevalent vehicle ownership categories in Auburn are males with 2 vehicles (480, accounting for 45.7%) and females with 2 vehicles (468, making up 42.2%).
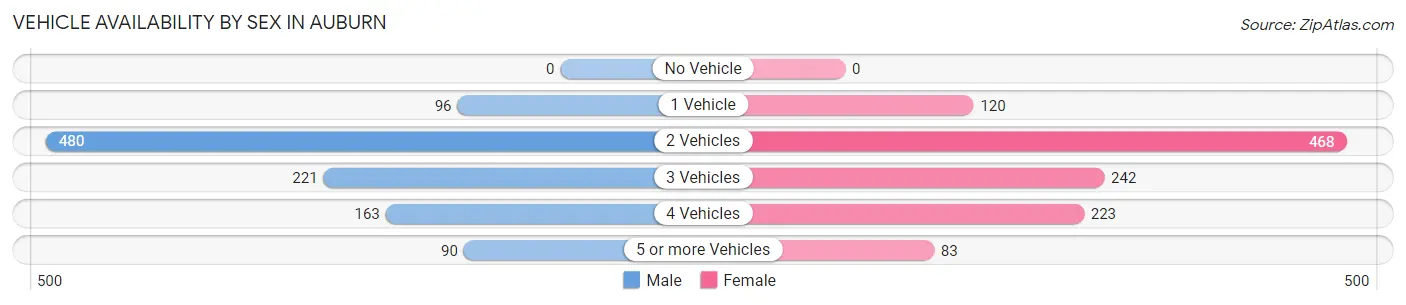
| Vehicles Available | Male | Female |
| No Vehicle | 0 (0.0%) | 0 (0.0%) |
| 1 Vehicle | 96 (9.1%) | 120 (10.6%) |
| 2 Vehicles | 480 (45.7%) | 468 (41.2%) |
| 3 Vehicles | 221 (21.0%) | 242 (21.3%) |
| 4 Vehicles | 163 (15.5%) | 223 (19.6%) |
| 5 or more Vehicles | 90 (8.6%) | 83 (7.3%) |
| Total | 1,050 (100.0%) | 1,136 (100.0%) |
Commute Time in Auburn
The most frequently occuring commute durations in Auburn are 30 to 34 minutes (692 commuters, 32.9%), 25 to 29 minutes (324 commuters, 15.4%), and 20 to 24 minutes (188 commuters, 8.9%).
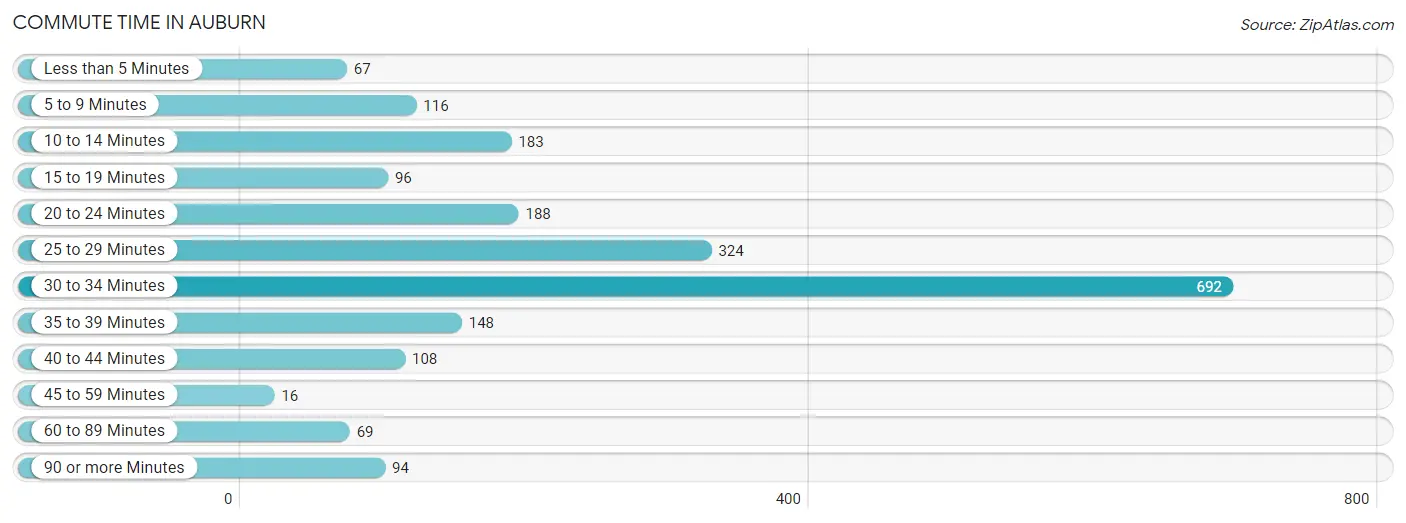
| Commute Time | # Commuters | % Commuters |
| Less than 5 Minutes | 67 | 3.2% |
| 5 to 9 Minutes | 116 | 5.5% |
| 10 to 14 Minutes | 183 | 8.7% |
| 15 to 19 Minutes | 96 | 4.6% |
| 20 to 24 Minutes | 188 | 8.9% |
| 25 to 29 Minutes | 324 | 15.4% |
| 30 to 34 Minutes | 692 | 32.9% |
| 35 to 39 Minutes | 148 | 7.0% |
| 40 to 44 Minutes | 108 | 5.1% |
| 45 to 59 Minutes | 16 | 0.8% |
| 60 to 89 Minutes | 69 | 3.3% |
| 90 or more Minutes | 94 | 4.5% |
Commute Time by Sex in Auburn
The most common commute times in Auburn are 30 to 34 minutes (258 commuters, 25.9%) for males and 30 to 34 minutes (434 commuters, 39.3%) for females.
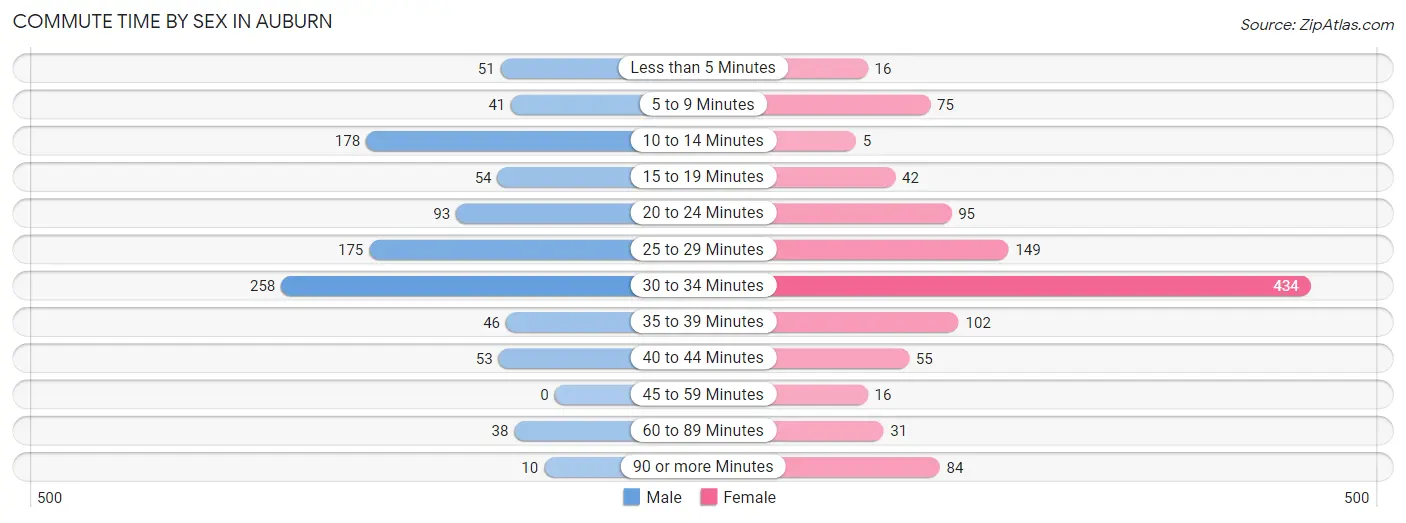
| Commute Time | Male | Female |
| Less than 5 Minutes | 51 (5.1%) | 16 (1.5%) |
| 5 to 9 Minutes | 41 (4.1%) | 75 (6.8%) |
| 10 to 14 Minutes | 178 (17.8%) | 5 (0.4%) |
| 15 to 19 Minutes | 54 (5.4%) | 42 (3.8%) |
| 20 to 24 Minutes | 93 (9.3%) | 95 (8.6%) |
| 25 to 29 Minutes | 175 (17.5%) | 149 (13.5%) |
| 30 to 34 Minutes | 258 (25.9%) | 434 (39.3%) |
| 35 to 39 Minutes | 46 (4.6%) | 102 (9.2%) |
| 40 to 44 Minutes | 53 (5.3%) | 55 (5.0%) |
| 45 to 59 Minutes | 0 (0.0%) | 16 (1.5%) |
| 60 to 89 Minutes | 38 (3.8%) | 31 (2.8%) |
| 90 or more Minutes | 10 (1.0%) | 84 (7.6%) |
Time of Departure to Work by Sex in Auburn
The most frequent times of departure to work in Auburn are 6:00 AM to 6:29 AM (201, 20.2%) for males and 7:30 AM to 7:59 AM (257, 23.3%) for females.
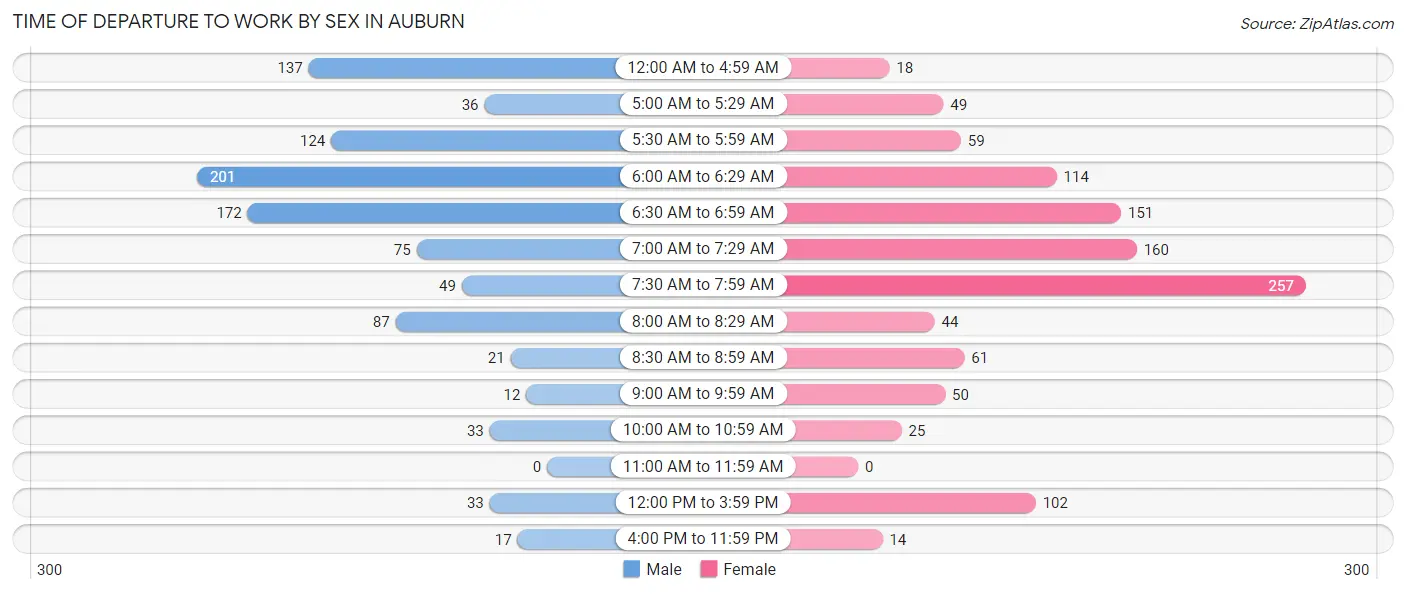
| Time of Departure | Male | Female |
| 12:00 AM to 4:59 AM | 137 (13.7%) | 18 (1.6%) |
| 5:00 AM to 5:29 AM | 36 (3.6%) | 49 (4.4%) |
| 5:30 AM to 5:59 AM | 124 (12.4%) | 59 (5.3%) |
| 6:00 AM to 6:29 AM | 201 (20.2%) | 114 (10.3%) |
| 6:30 AM to 6:59 AM | 172 (17.2%) | 151 (13.7%) |
| 7:00 AM to 7:29 AM | 75 (7.5%) | 160 (14.5%) |
| 7:30 AM to 7:59 AM | 49 (4.9%) | 257 (23.3%) |
| 8:00 AM to 8:29 AM | 87 (8.7%) | 44 (4.0%) |
| 8:30 AM to 8:59 AM | 21 (2.1%) | 61 (5.5%) |
| 9:00 AM to 9:59 AM | 12 (1.2%) | 50 (4.5%) |
| 10:00 AM to 10:59 AM | 33 (3.3%) | 25 (2.3%) |
| 11:00 AM to 11:59 AM | 0 (0.0%) | 0 (0.0%) |
| 12:00 PM to 3:59 PM | 33 (3.3%) | 102 (9.2%) |
| 4:00 PM to 11:59 PM | 17 (1.7%) | 14 (1.3%) |
| Total | 997 (100.0%) | 1,104 (100.0%) |
Housing Occupancy in Auburn
Occupancy by Ownership in Auburn
Of the total 1,571 dwellings in Auburn, owner-occupied units account for 1,410 (89.7%), while renter-occupied units make up 161 (10.2%).
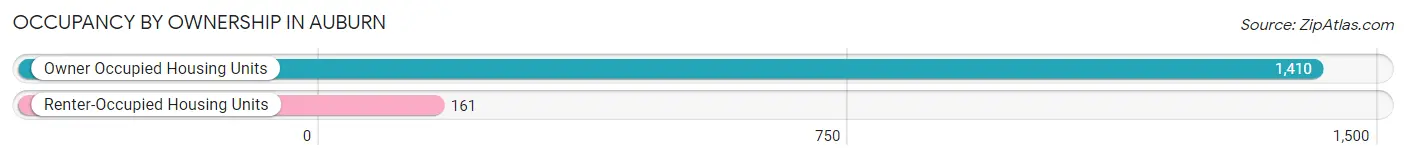
| Occupancy | # Housing Units | % Housing Units |
| Owner Occupied Housing Units | 1,410 | 89.7% |
| Renter-Occupied Housing Units | 161 | 10.2% |
| Total Occupied Housing Units | 1,571 | 100.0% |
Occupancy by Household Size in Auburn
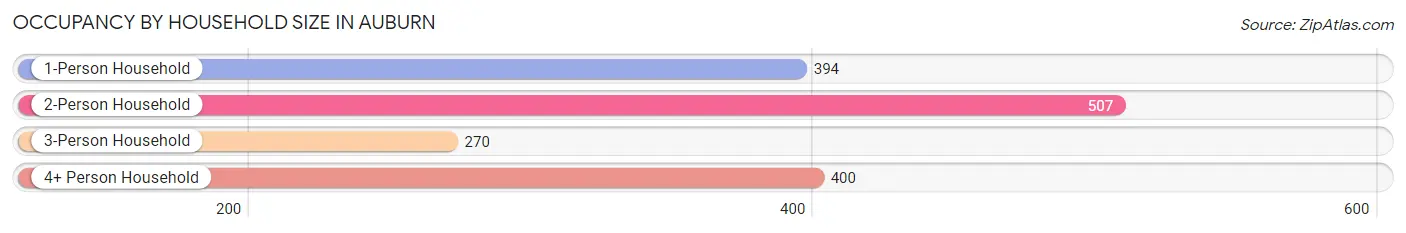
| Household Size | # Housing Units | % Housing Units |
| 1-Person Household | 394 | 25.1% |
| 2-Person Household | 507 | 32.3% |
| 3-Person Household | 270 | 17.2% |
| 4+ Person Household | 400 | 25.5% |
| Total Housing Units | 1,571 | 100.0% |
Occupancy by Ownership by Household Size in Auburn
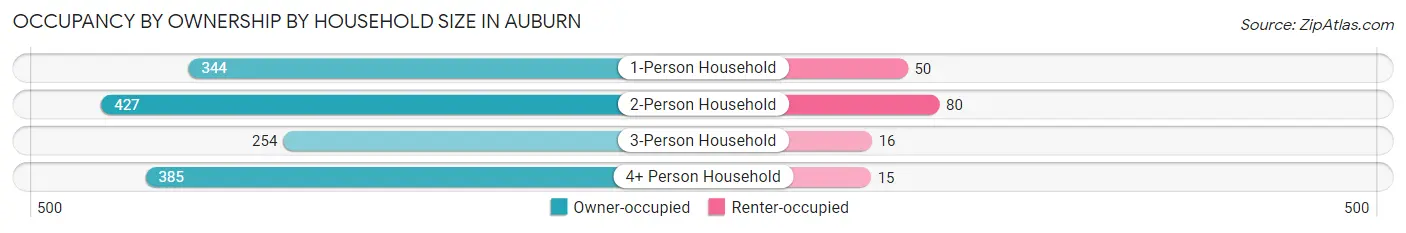
| Household Size | Owner-occupied | Renter-occupied |
| 1-Person Household | 344 (87.3%) | 50 (12.7%) |
| 2-Person Household | 427 (84.2%) | 80 (15.8%) |
| 3-Person Household | 254 (94.1%) | 16 (5.9%) |
| 4+ Person Household | 385 (96.3%) | 15 (3.7%) |
| Total Housing Units | 1,410 (89.7%) | 161 (10.2%) |
Occupancy by Educational Attainment in Auburn
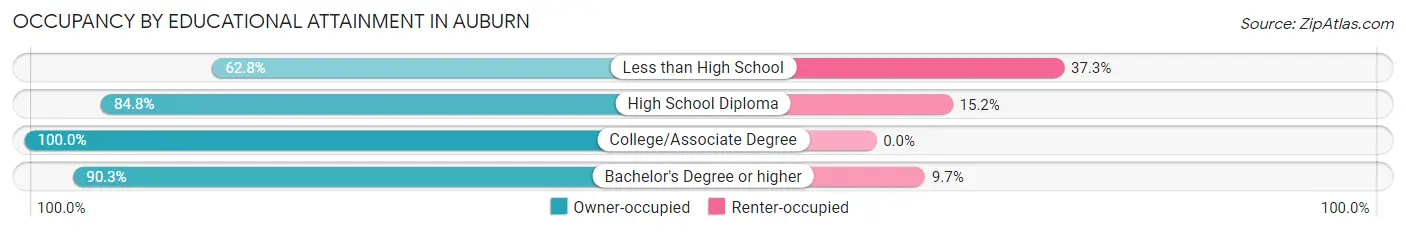
| Household Size | Owner-occupied | Renter-occupied |
| Less than High School | 32 (62.7%) | 19 (37.2%) |
| High School Diploma | 526 (84.8%) | 94 (15.2%) |
| College/Associate Degree | 403 (100.0%) | 0 (0.0%) |
| Bachelor's Degree or higher | 449 (90.3%) | 48 (9.7%) |
Occupancy by Age of Householder in Auburn
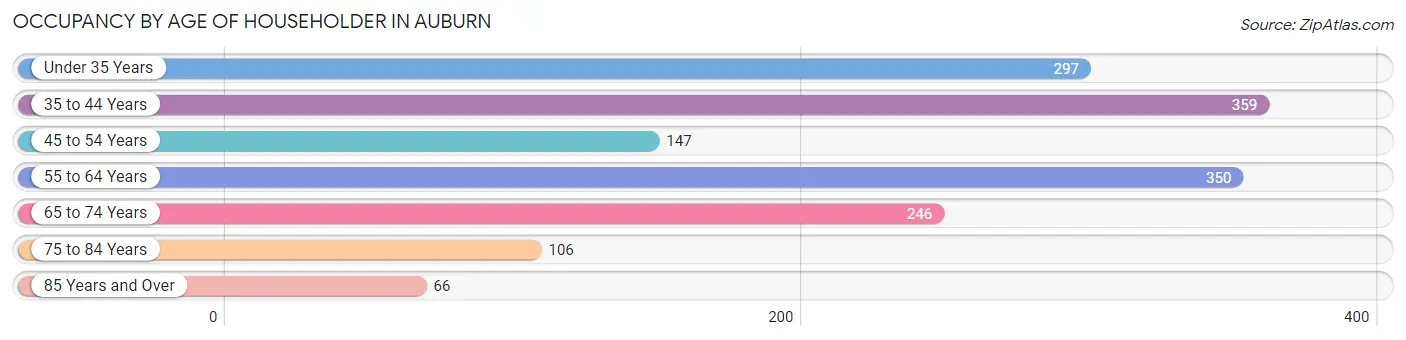
| Age Bracket | # Households | % Households |
| Under 35 Years | 297 | 18.9% |
| 35 to 44 Years | 359 | 22.9% |
| 45 to 54 Years | 147 | 9.4% |
| 55 to 64 Years | 350 | 22.3% |
| 65 to 74 Years | 246 | 15.7% |
| 75 to 84 Years | 106 | 6.8% |
| 85 Years and Over | 66 | 4.2% |
| Total | 1,571 | 100.0% |
Housing Finances in Auburn
Median Income by Occupancy in Auburn
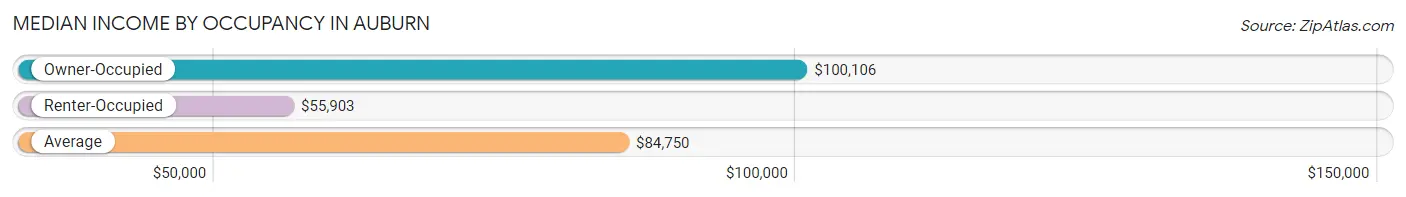
| Occupancy Type | # Households | Median Income |
| Owner-Occupied | 1,410 (89.7%) | $100,106 |
| Renter-Occupied | 161 (10.2%) | $55,903 |
| Average | 1,571 (100.0%) | $84,750 |
Occupancy by Householder Income Bracket in Auburn

| Income Bracket | Owner-occupied | Renter-occupied |
| Less than $5,000 | 0 (0.0%) | 0 (0.0%) |
| $5,000 to $9,999 | 0 (0.0%) | 25 (15.5%) |
| $10,000 to $14,999 | 37 (2.6%) | 0 (0.0%) |
| $15,000 to $19,999 | 17 (1.2%) | 0 (0.0%) |
| $20,000 to $24,999 | 40 (2.8%) | 19 (11.8%) |
| $25,000 to $34,999 | 87 (6.2%) | 0 (0.0%) |
| $35,000 to $49,999 | 117 (8.3%) | 30 (18.6%) |
| $50,000 to $74,999 | 222 (15.7%) | 35 (21.7%) |
| $75,000 to $99,999 | 183 (13.0%) | 20 (12.4%) |
| $100,000 to $149,999 | 387 (27.5%) | 17 (10.6%) |
| $150,000 or more | 320 (22.7%) | 15 (9.3%) |
| Total | 1,410 (100.0%) | 161 (100.0%) |
Monthly Housing Cost Tiers in Auburn
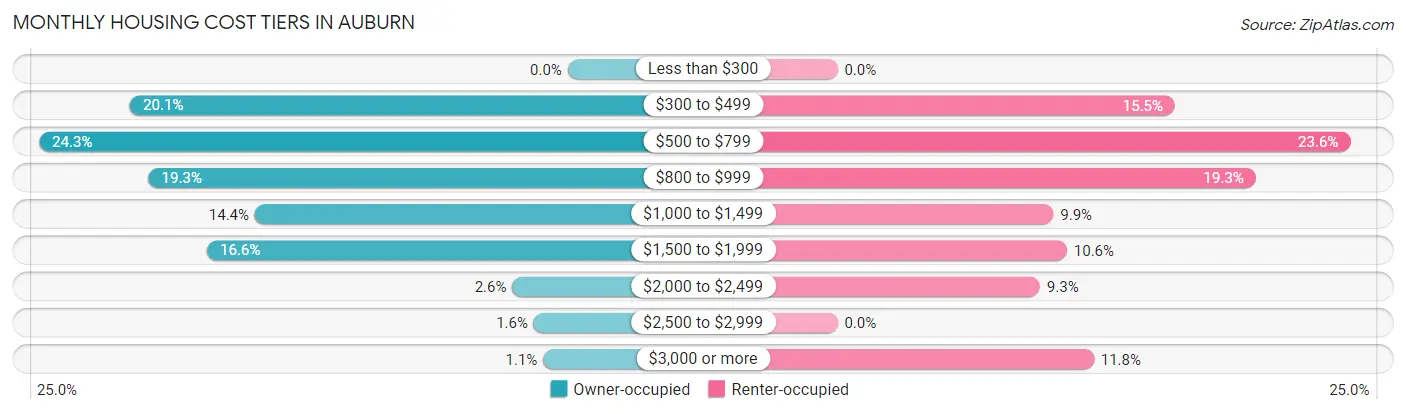
| Monthly Cost | Owner-occupied | Renter-occupied |
| Less than $300 | 0 (0.0%) | 0 (0.0%) |
| $300 to $499 | 284 (20.1%) | 25 (15.5%) |
| $500 to $799 | 343 (24.3%) | 38 (23.6%) |
| $800 to $999 | 272 (19.3%) | 31 (19.3%) |
| $1,000 to $1,499 | 203 (14.4%) | 16 (9.9%) |
| $1,500 to $1,999 | 234 (16.6%) | 17 (10.6%) |
| $2,000 to $2,499 | 36 (2.5%) | 15 (9.3%) |
| $2,500 to $2,999 | 22 (1.6%) | 0 (0.0%) |
| $3,000 or more | 16 (1.1%) | 19 (11.8%) |
| Total | 1,410 (100.0%) | 161 (100.0%) |
Physical Housing Characteristics in Auburn
Housing Structures in Auburn
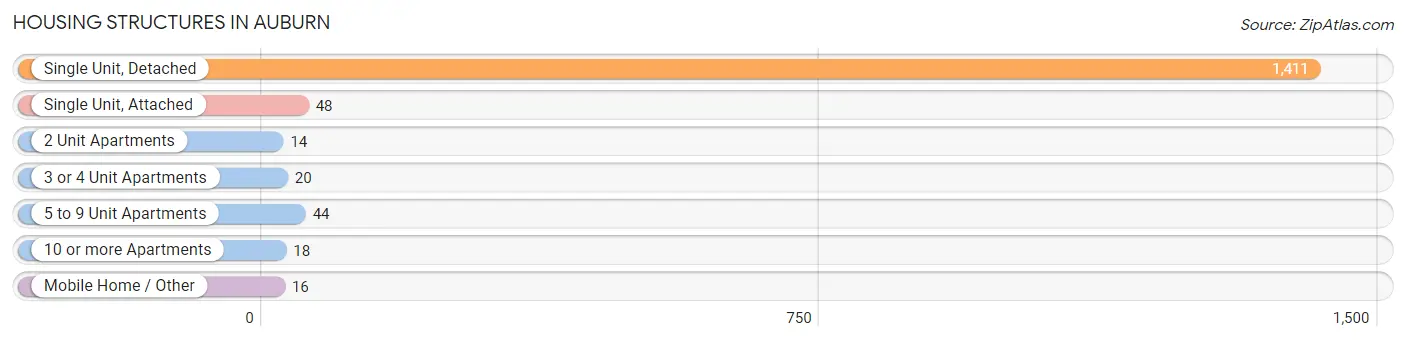
| Structure Type | # Housing Units | % Housing Units |
| Single Unit, Detached | 1,411 | 89.8% |
| Single Unit, Attached | 48 | 3.1% |
| 2 Unit Apartments | 14 | 0.9% |
| 3 or 4 Unit Apartments | 20 | 1.3% |
| 5 to 9 Unit Apartments | 44 | 2.8% |
| 10 or more Apartments | 18 | 1.1% |
| Mobile Home / Other | 16 | 1.0% |
| Total | 1,571 | 100.0% |
Housing Structures by Occupancy in Auburn
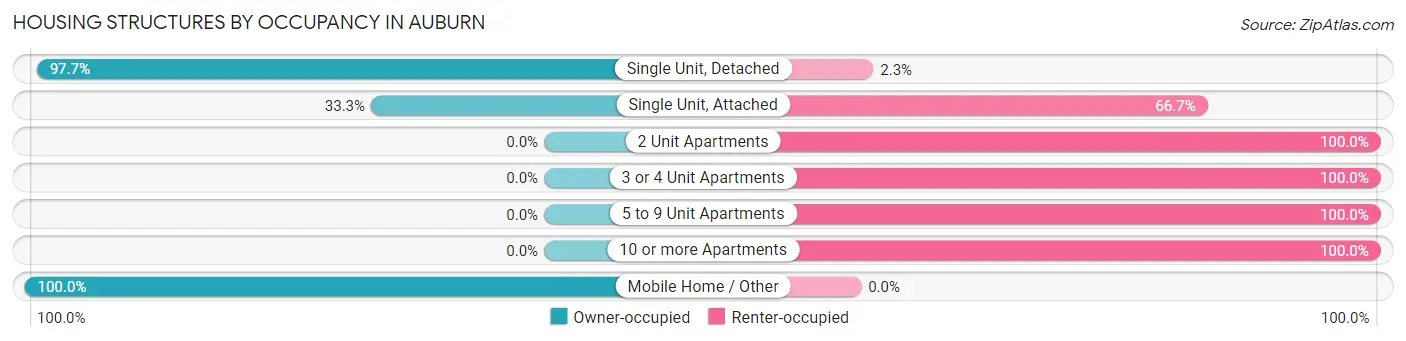
| Structure Type | Owner-occupied | Renter-occupied |
| Single Unit, Detached | 1,378 (97.7%) | 33 (2.3%) |
| Single Unit, Attached | 16 (33.3%) | 32 (66.7%) |
| 2 Unit Apartments | 0 (0.0%) | 14 (100.0%) |
| 3 or 4 Unit Apartments | 0 (0.0%) | 20 (100.0%) |
| 5 to 9 Unit Apartments | 0 (0.0%) | 44 (100.0%) |
| 10 or more Apartments | 0 (0.0%) | 18 (100.0%) |
| Mobile Home / Other | 16 (100.0%) | 0 (0.0%) |
| Total | 1,410 (89.7%) | 161 (10.2%) |
Housing Structures by Number of Rooms in Auburn
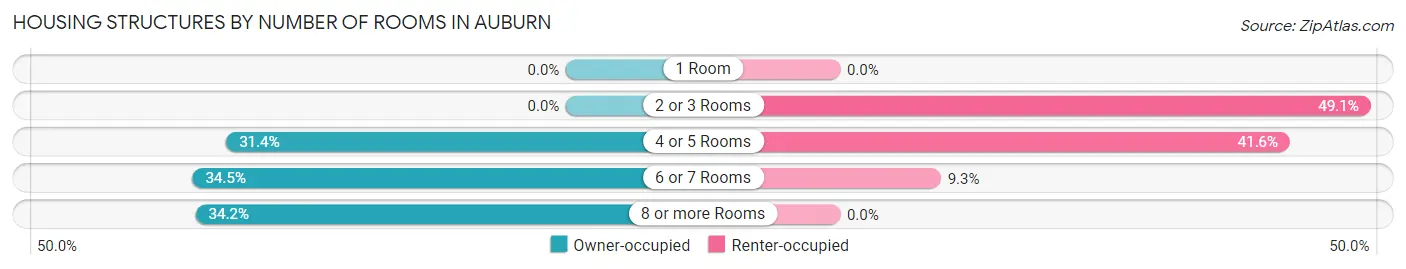
| Number of Rooms | Owner-occupied | Renter-occupied |
| 1 Room | 0 (0.0%) | 0 (0.0%) |
| 2 or 3 Rooms | 0 (0.0%) | 79 (49.1%) |
| 4 or 5 Rooms | 442 (31.4%) | 67 (41.6%) |
| 6 or 7 Rooms | 486 (34.5%) | 15 (9.3%) |
| 8 or more Rooms | 482 (34.2%) | 0 (0.0%) |
| Total | 1,410 (100.0%) | 161 (100.0%) |
Housing Structure by Heating Type in Auburn
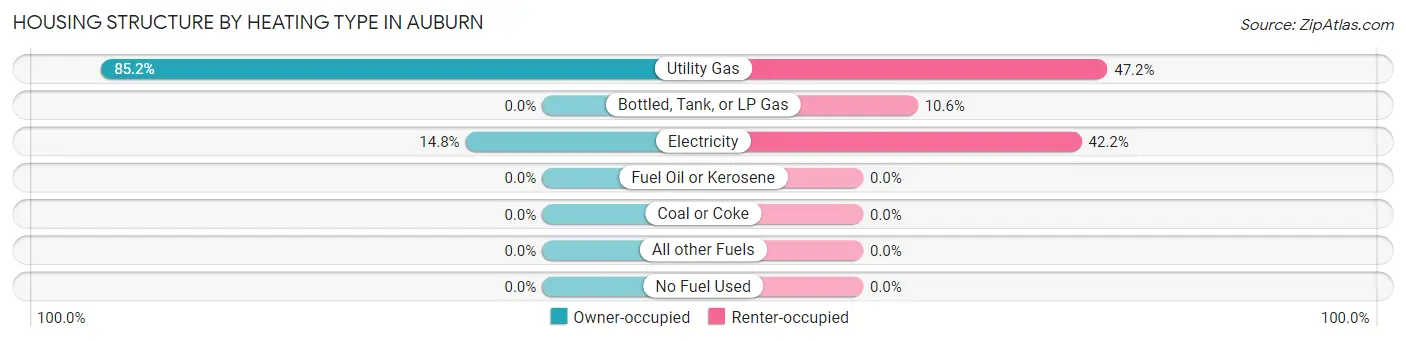
| Heating Type | Owner-occupied | Renter-occupied |
| Utility Gas | 1,201 (85.2%) | 76 (47.2%) |
| Bottled, Tank, or LP Gas | 0 (0.0%) | 17 (10.6%) |
| Electricity | 209 (14.8%) | 68 (42.2%) |
| Fuel Oil or Kerosene | 0 (0.0%) | 0 (0.0%) |
| Coal or Coke | 0 (0.0%) | 0 (0.0%) |
| All other Fuels | 0 (0.0%) | 0 (0.0%) |
| No Fuel Used | 0 (0.0%) | 0 (0.0%) |
| Total | 1,410 (100.0%) | 161 (100.0%) |
Household Vehicle Usage in Auburn
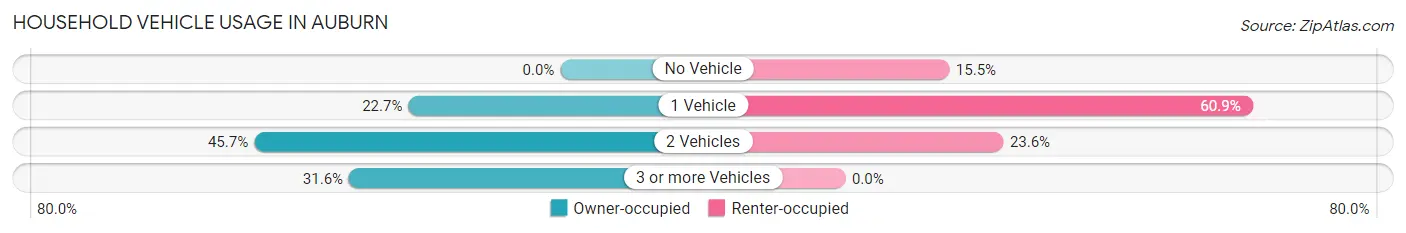
| Vehicles per Household | Owner-occupied | Renter-occupied |
| No Vehicle | 0 (0.0%) | 25 (15.5%) |
| 1 Vehicle | 320 (22.7%) | 98 (60.9%) |
| 2 Vehicles | 645 (45.7%) | 38 (23.6%) |
| 3 or more Vehicles | 445 (31.6%) | 0 (0.0%) |
| Total | 1,410 (100.0%) | 161 (100.0%) |
Real Estate & Mortgages in Auburn
Real Estate and Mortgage Overview in Auburn
| Characteristic | Without Mortgage | With Mortgage |
| Housing Units | 454 | 956 |
| Median Property Value | $153,300 | $137,700 |
| Median Household Income | $93,958 | $169 |
| Monthly Housing Costs | $461 | $16 |
| Real Estate Taxes | $2,233 | $0 |
Property Value by Mortgage Status in Auburn
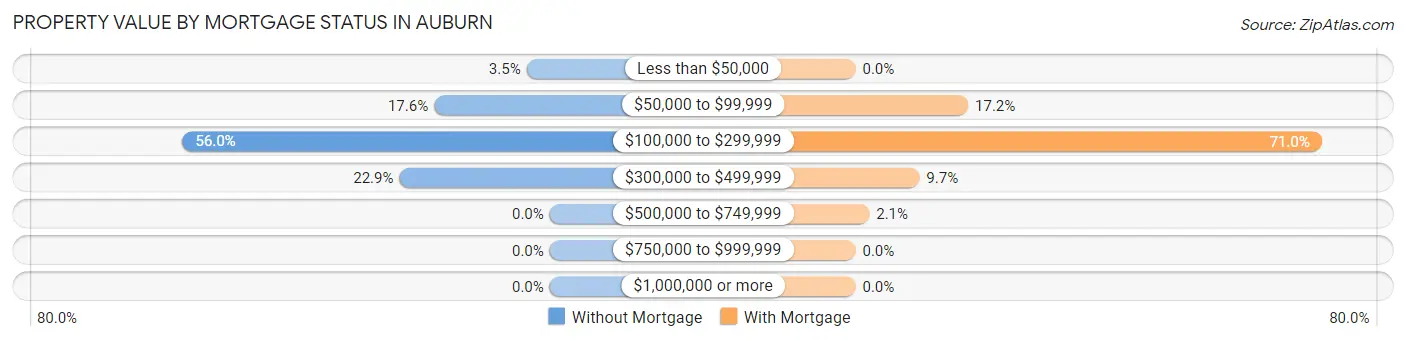
| Property Value | Without Mortgage | With Mortgage |
| Less than $50,000 | 16 (3.5%) | 0 (0.0%) |
| $50,000 to $99,999 | 80 (17.6%) | 164 (17.2%) |
| $100,000 to $299,999 | 254 (55.9%) | 679 (71.0%) |
| $300,000 to $499,999 | 104 (22.9%) | 93 (9.7%) |
| $500,000 to $749,999 | 0 (0.0%) | 20 (2.1%) |
| $750,000 to $999,999 | 0 (0.0%) | 0 (0.0%) |
| $1,000,000 or more | 0 (0.0%) | 0 (0.0%) |
| Total | 454 (100.0%) | 956 (100.0%) |
Household Income by Mortgage Status in Auburn
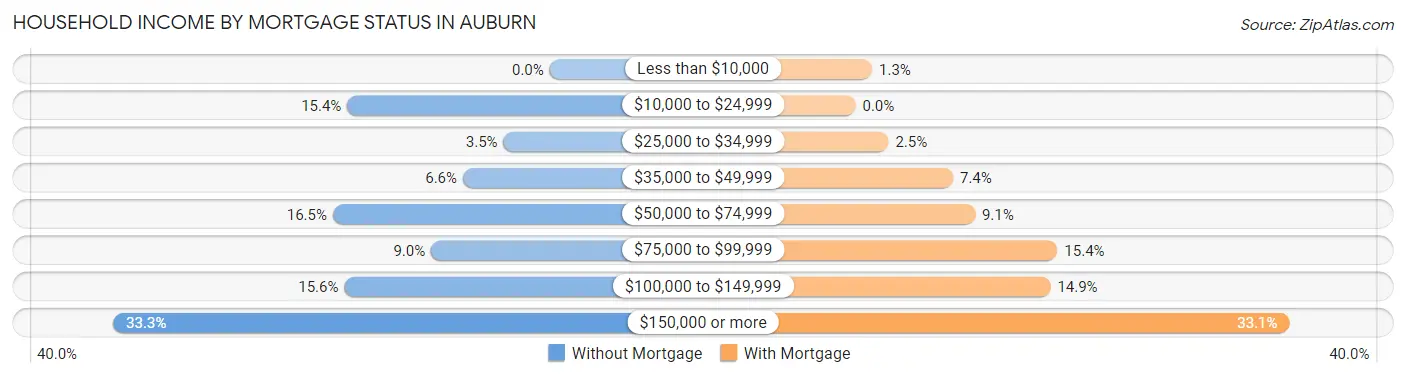
| Household Income | Without Mortgage | With Mortgage |
| Less than $10,000 | 0 (0.0%) | 12 (1.3%) |
| $10,000 to $24,999 | 70 (15.4%) | 0 (0.0%) |
| $25,000 to $34,999 | 16 (3.5%) | 24 (2.5%) |
| $35,000 to $49,999 | 30 (6.6%) | 71 (7.4%) |
| $50,000 to $74,999 | 75 (16.5%) | 87 (9.1%) |
| $75,000 to $99,999 | 41 (9.0%) | 147 (15.4%) |
| $100,000 to $149,999 | 71 (15.6%) | 142 (14.8%) |
| $150,000 or more | 151 (33.3%) | 316 (33.1%) |
| Total | 454 (100.0%) | 956 (100.0%) |
Property Value to Household Income Ratio in Auburn

| Value-to-Income Ratio | Without Mortgage | With Mortgage |
| Less than 2.0x | 286 (63.0%) | 100,530 (10,515.7%) |
| 2.0x to 2.9x | 29 (6.4%) | 657 (68.7%) |
| 3.0x to 3.9x | 69 (15.2%) | 126 (13.2%) |
| 4.0x or more | 70 (15.4%) | 79 (8.3%) |
| Total | 454 (100.0%) | 956 (100.0%) |
Real Estate Taxes by Mortgage Status in Auburn
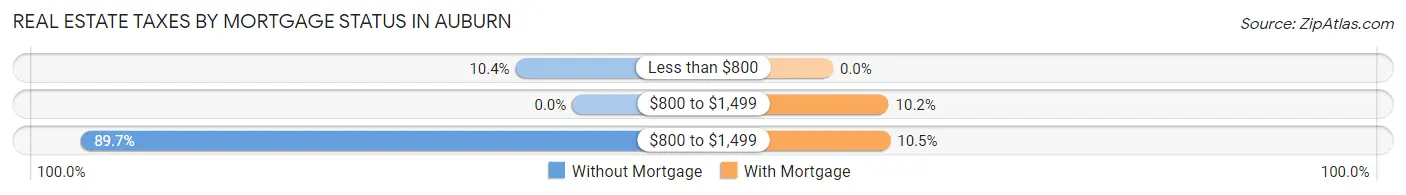
| Property Taxes | Without Mortgage | With Mortgage |
| Less than $800 | 47 (10.3%) | 0 (0.0%) |
| $800 to $1,499 | 0 (0.0%) | 97 (10.2%) |
| $800 to $1,499 | 407 (89.6%) | 100 (10.5%) |
| Total | 454 (100.0%) | 956 (100.0%) |
Health & Disability in Auburn
Health Insurance Coverage by Age in Auburn
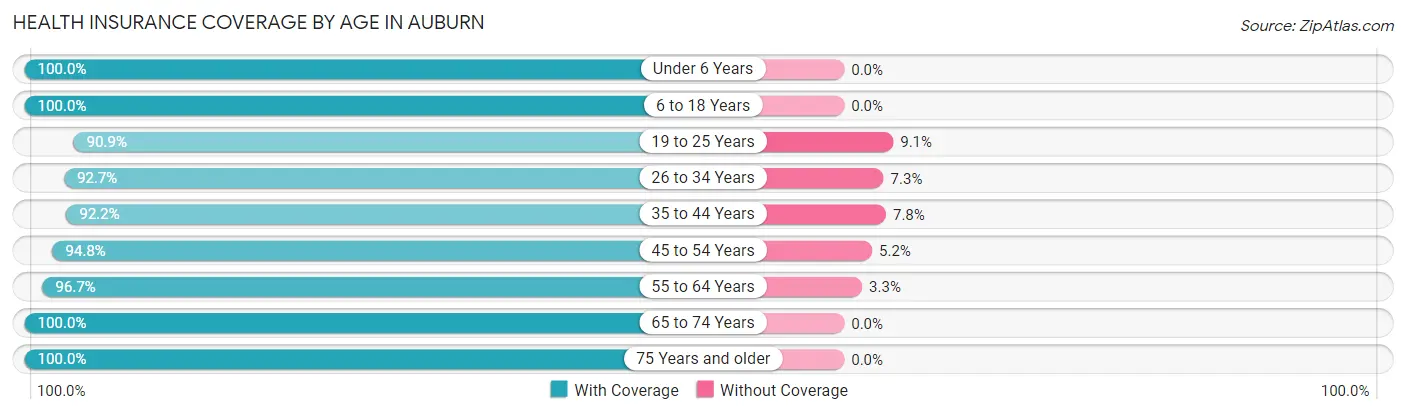
| Age Bracket | With Coverage | Without Coverage |
| Under 6 Years | 364 (100.0%) | 0 (0.0%) |
| 6 to 18 Years | 875 (100.0%) | 0 (0.0%) |
| 19 to 25 Years | 318 (90.9%) | 32 (9.1%) |
| 26 to 34 Years | 530 (92.7%) | 42 (7.3%) |
| 35 to 44 Years | 652 (92.2%) | 55 (7.8%) |
| 45 to 54 Years | 402 (94.8%) | 22 (5.2%) |
| 55 to 64 Years | 580 (96.7%) | 20 (3.3%) |
| 65 to 74 Years | 288 (100.0%) | 0 (0.0%) |
| 75 Years and older | 293 (100.0%) | 0 (0.0%) |
| Total | 4,302 (96.2%) | 171 (3.8%) |
Health Insurance Coverage by Citizenship Status in Auburn
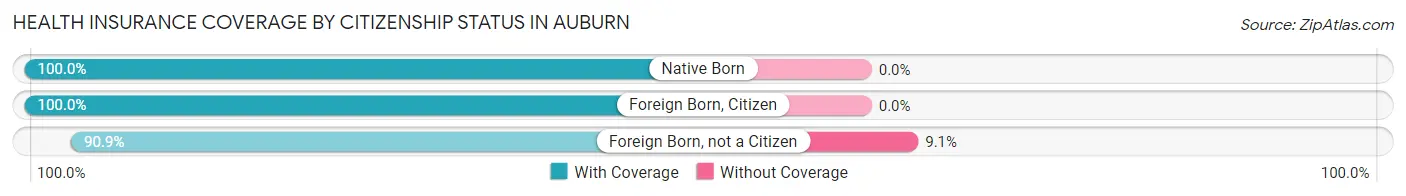
| Citizenship Status | With Coverage | Without Coverage |
| Native Born | 364 (100.0%) | 0 (0.0%) |
| Foreign Born, Citizen | 875 (100.0%) | 0 (0.0%) |
| Foreign Born, not a Citizen | 318 (90.9%) | 32 (9.1%) |
Health Insurance Coverage by Household Income in Auburn
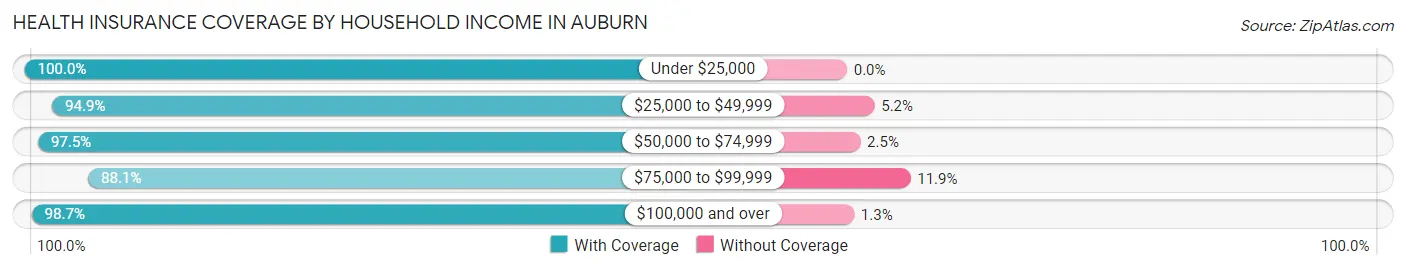
| Household Income | With Coverage | Without Coverage |
| Under $25,000 | 178 (100.0%) | 0 (0.0%) |
| $25,000 to $49,999 | 405 (94.9%) | 22 (5.1%) |
| $50,000 to $74,999 | 585 (97.5%) | 15 (2.5%) |
| $75,000 to $99,999 | 755 (88.1%) | 102 (11.9%) |
| $100,000 and over | 2,379 (98.7%) | 32 (1.3%) |
Public vs Private Health Insurance Coverage by Age in Auburn
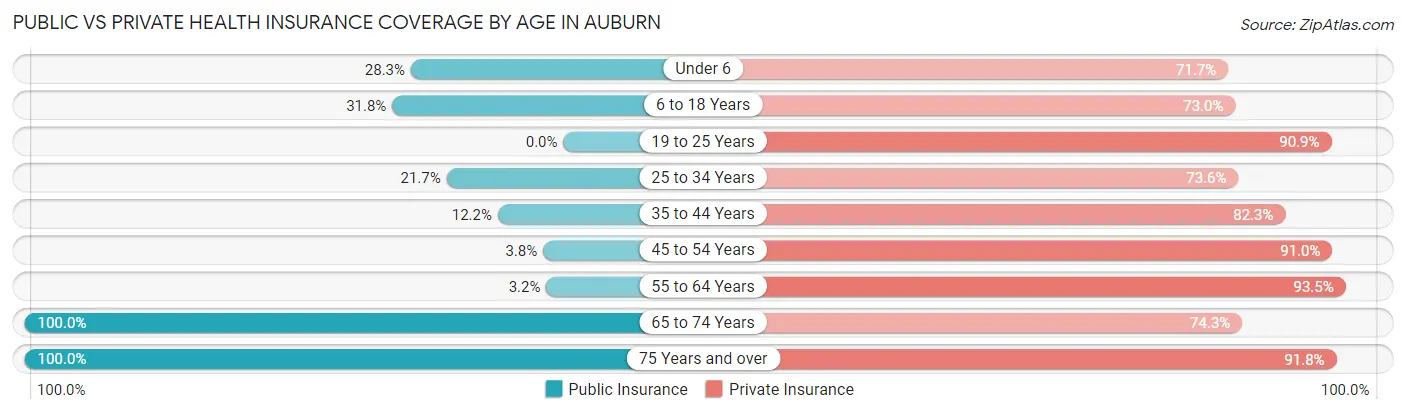
| Age Bracket | Public Insurance | Private Insurance |
| Under 6 | 103 (28.3%) | 261 (71.7%) |
| 6 to 18 Years | 278 (31.8%) | 639 (73.0%) |
| 19 to 25 Years | 0 (0.0%) | 318 (90.9%) |
| 25 to 34 Years | 124 (21.7%) | 421 (73.6%) |
| 35 to 44 Years | 86 (12.2%) | 582 (82.3%) |
| 45 to 54 Years | 16 (3.8%) | 386 (91.0%) |
| 55 to 64 Years | 19 (3.2%) | 561 (93.5%) |
| 65 to 74 Years | 288 (100.0%) | 214 (74.3%) |
| 75 Years and over | 293 (100.0%) | 269 (91.8%) |
| Total | 1,207 (27.0%) | 3,651 (81.6%) |
Disability Status by Sex by Age in Auburn
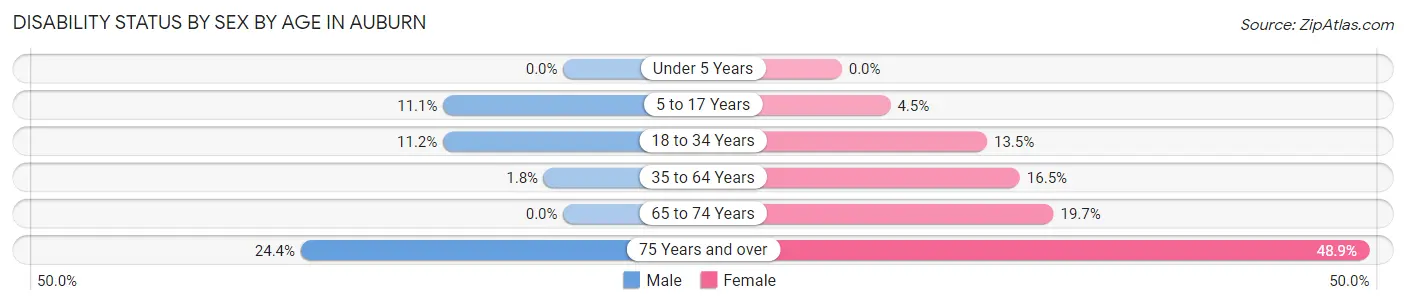
| Age Bracket | Male | Female |
| Under 5 Years | 0 (0.0%) | 0 (0.0%) |
| 5 to 17 Years | 40 (11.1%) | 24 (4.5%) |
| 18 to 34 Years | 50 (11.2%) | 72 (13.5%) |
| 35 to 64 Years | 16 (1.8%) | 139 (16.5%) |
| 65 to 74 Years | 0 (0.0%) | 45 (19.7%) |
| 75 Years and over | 38 (24.4%) | 67 (48.9%) |
Disability Class by Sex by Age in Auburn
Disability Class: Hearing Difficulty
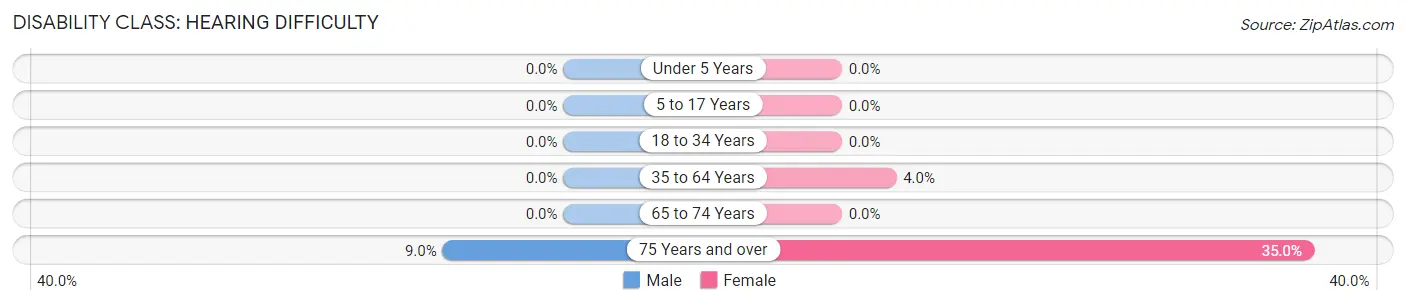
| Age Bracket | Male | Female |
| Under 5 Years | 0 (0.0%) | 0 (0.0%) |
| 5 to 17 Years | 0 (0.0%) | 0 (0.0%) |
| 18 to 34 Years | 0 (0.0%) | 0 (0.0%) |
| 35 to 64 Years | 0 (0.0%) | 34 (4.0%) |
| 65 to 74 Years | 0 (0.0%) | 0 (0.0%) |
| 75 Years and over | 14 (9.0%) | 48 (35.0%) |
Disability Class: Vision Difficulty
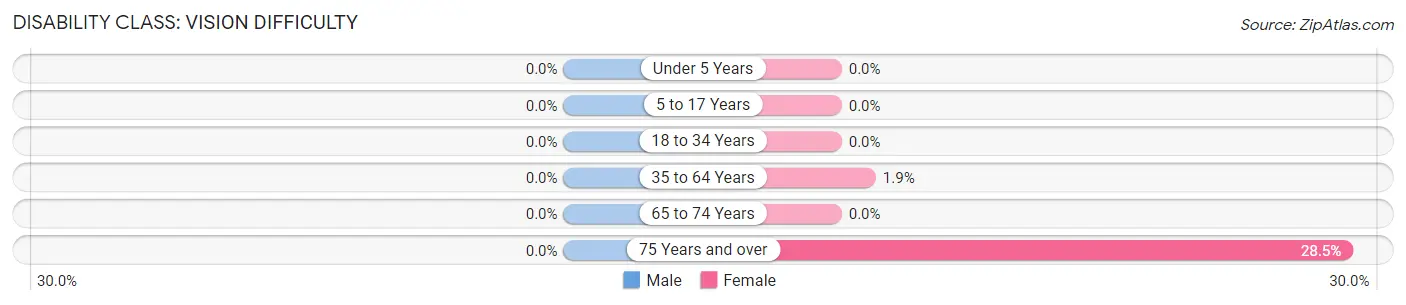
| Age Bracket | Male | Female |
| Under 5 Years | 0 (0.0%) | 0 (0.0%) |
| 5 to 17 Years | 0 (0.0%) | 0 (0.0%) |
| 18 to 34 Years | 0 (0.0%) | 0 (0.0%) |
| 35 to 64 Years | 0 (0.0%) | 16 (1.9%) |
| 65 to 74 Years | 0 (0.0%) | 0 (0.0%) |
| 75 Years and over | 0 (0.0%) | 39 (28.5%) |
Disability Class: Cognitive Difficulty
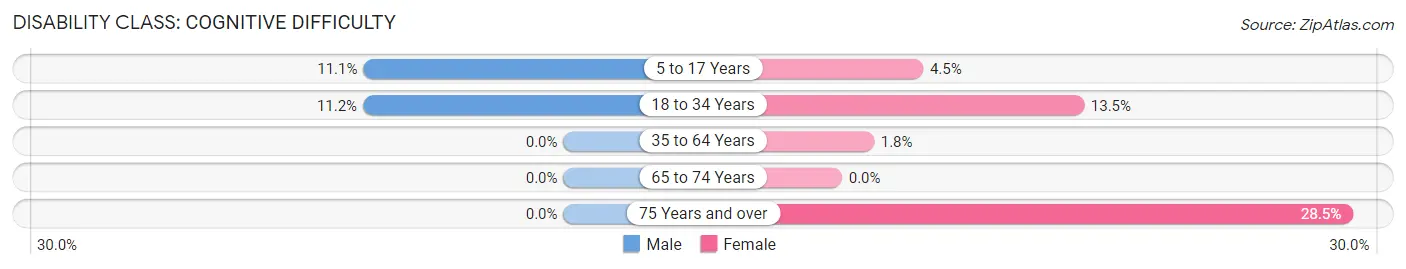
| Age Bracket | Male | Female |
| 5 to 17 Years | 40 (11.1%) | 24 (4.5%) |
| 18 to 34 Years | 50 (11.2%) | 72 (13.5%) |
| 35 to 64 Years | 0 (0.0%) | 15 (1.8%) |
| 65 to 74 Years | 0 (0.0%) | 0 (0.0%) |
| 75 Years and over | 0 (0.0%) | 39 (28.5%) |
Disability Class: Ambulatory Difficulty
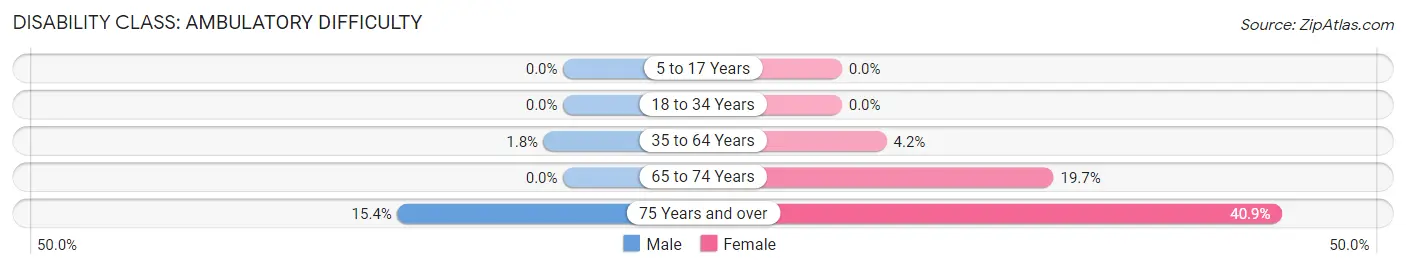
| Age Bracket | Male | Female |
| 5 to 17 Years | 0 (0.0%) | 0 (0.0%) |
| 18 to 34 Years | 0 (0.0%) | 0 (0.0%) |
| 35 to 64 Years | 16 (1.8%) | 35 (4.2%) |
| 65 to 74 Years | 0 (0.0%) | 45 (19.7%) |
| 75 Years and over | 24 (15.4%) | 56 (40.9%) |
Disability Class: Self-Care Difficulty
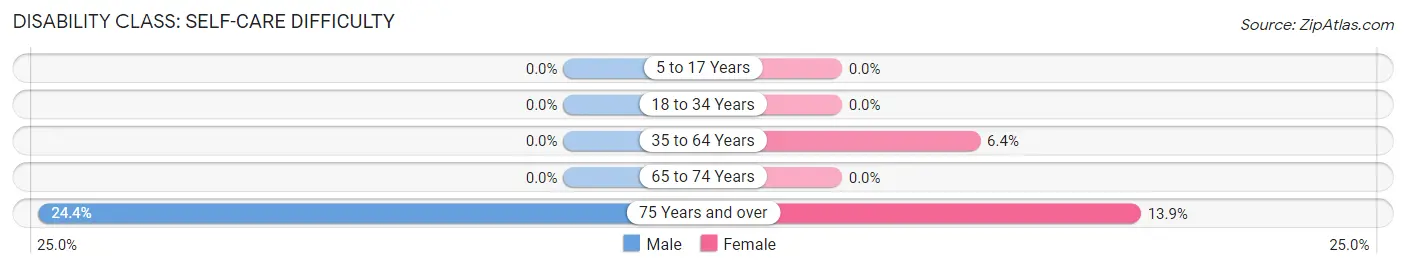
| Age Bracket | Male | Female |
| 5 to 17 Years | 0 (0.0%) | 0 (0.0%) |
| 18 to 34 Years | 0 (0.0%) | 0 (0.0%) |
| 35 to 64 Years | 0 (0.0%) | 54 (6.4%) |
| 65 to 74 Years | 0 (0.0%) | 0 (0.0%) |
| 75 Years and over | 38 (24.4%) | 19 (13.9%) |
Technology Access in Auburn
Computing Device Access in Auburn
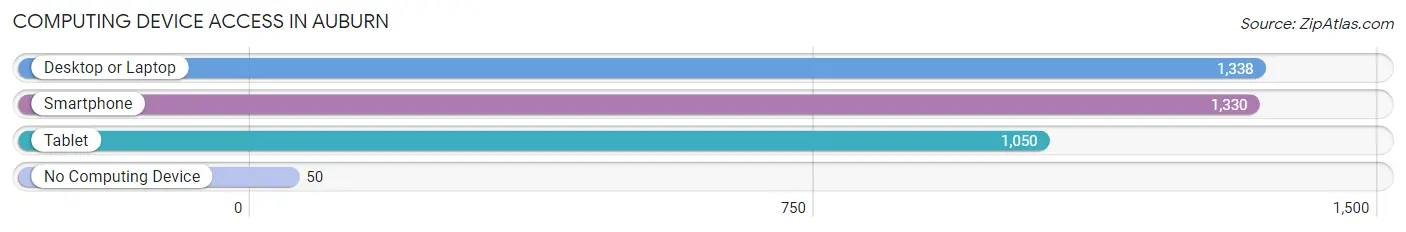
| Device Type | # Households | % Households |
| Desktop or Laptop | 1,338 | 85.2% |
| Smartphone | 1,330 | 84.7% |
| Tablet | 1,050 | 66.8% |
| No Computing Device | 50 | 3.2% |
| Total | 1,571 | 100.0% |
Internet Access in Auburn
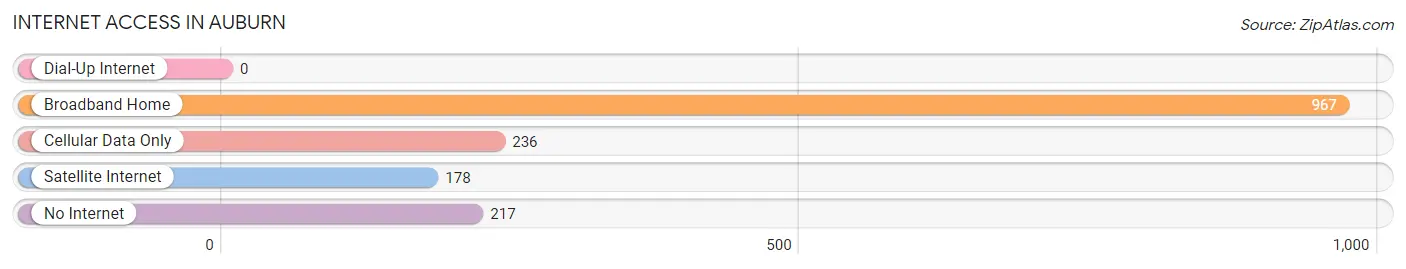
| Internet Type | # Households | % Households |
| Dial-Up Internet | 0 | 0.0% |
| Broadband Home | 967 | 61.6% |
| Cellular Data Only | 236 | 15.0% |
| Satellite Internet | 178 | 11.3% |
| No Internet | 217 | 13.8% |
| Total | 1,571 | 100.0% |
Auburn Summary
Auburn, Illinois is a small city located in Sangamon County, Illinois. It is situated on the banks of the Sangamon River, approximately 20 miles northwest of Springfield, the state capital. The city has a population of approximately 2,000 people and is part of the Springfield Metropolitan Statistical Area.
History
Auburn was founded in 1836 by a group of settlers from New England. The town was named after Auburn, New York, the hometown of one of the settlers. The town was originally a farming community, but it soon developed into a small industrial center. The first industry in Auburn was a sawmill, which was built in 1837. The sawmill was followed by a gristmill, a woolen mill, and a tannery.
In 1854, the Chicago and Alton Railroad was built through Auburn, connecting the town to the larger cities of Chicago and St. Louis. This allowed Auburn to become a major shipping center for the surrounding area. The railroad also brought new businesses and industries to the town, including a brickyard, a furniture factory, and a canning factory.
In the late 19th century, Auburn was a popular tourist destination. The town was known for its mineral springs, which were believed to have healing properties. The mineral springs attracted visitors from all over the country, and the town became known as the “Saratoga of the West.”
Geography
Auburn is located in central Illinois, approximately 20 miles northwest of Springfield. The city is situated on the banks of the Sangamon River, which flows through the city. The city is surrounded by rolling hills and farmland. The climate in Auburn is typical of the Midwest, with hot summers and cold winters.
Economy
Auburn’s economy is largely based on agriculture and manufacturing. The city is home to several large farms, which produce corn, soybeans, and other crops. The city is also home to several manufacturing companies, including a furniture factory, a canning factory, and a brickyard.
Demographics
As of the 2010 census, Auburn had a population of 2,000 people. The racial makeup of the city was 95.5% White, 1.2% African American, 0.7% Native American, 0.5% Asian, 0.2% Pacific Islander, and 1.9% from other races. The median household income in Auburn was $41,250, and the median family income was $50,000. The per capita income in Auburn was $20,000.
Conclusion
Auburn, Illinois is a small city located in Sangamon County, Illinois. It is situated on the banks of the Sangamon River, approximately 20 miles northwest of Springfield, the state capital. The city has a population of approximately 2,000 people and is part of the Springfield Metropolitan Statistical Area. Auburn’s economy is largely based on agriculture and manufacturing, and the city is home to several large farms and manufacturing companies. The racial makeup of the city is predominantly White, with a small percentage of African American, Native American, Asian, and Pacific Islander residents. The median household income in Auburn is $41,250, and the median family income is $50,000.
Common Questions
What is Per Capita Income in Auburn?
Per Capita income in Auburn is $36,807.
What is the Median Family Income in Auburn?
Median Family Income in Auburn is $113,692.
What is the Median Household income in Auburn?
Median Household Income in Auburn is $84,750.
What is Income or Wage Gap in Auburn?
Income or Wage Gap in Auburn is 50.4%.
Women in Auburn earn 49.6 cents for every dollar earned by a man.
What is Inequality or Gini Index in Auburn?
Inequality or Gini Index in Auburn is 0.35.
What is the Total Population of Auburn?
Total Population of Auburn is 4,535.
What is the Total Male Population of Auburn?
Total Male Population of Auburn is 2,146.
What is the Total Female Population of Auburn?
Total Female Population of Auburn is 2,389.
What is the Ratio of Males per 100 Females in Auburn?
There are 89.83 Males per 100 Females in Auburn.
What is the Ratio of Females per 100 Males in Auburn?
There are 111.32 Females per 100 Males in Auburn.
What is the Median Population Age in Auburn?
Median Population Age in Auburn is 35.7 Years.
What is the Average Family Size in Auburn
Average Family Size in Auburn is 3.4 People.
What is the Average Household Size in Auburn
Average Household Size in Auburn is 2.9 People.
How Large is the Labor Force in Auburn?
There are 2,202 People in the Labor Forcein in Auburn.
What is the Percentage of People in the Labor Force in Auburn?
62.8% of People are in the Labor Force in Auburn.
What is the Unemployment Rate in Auburn?
Unemployment Rate in Auburn is 0.8%.