Galena, IL Map & Demographics
Galena Map
Galena Overview
$38,387
PER CAPITA INCOME
$79,231
AVG FAMILY INCOME
$52,734
AVG HOUSEHOLD INCOME
25.2%
WAGE / INCOME GAP [ % ]
74.8¢/ $1
WAGE / INCOME GAP [ $ ]
0.41
INEQUALITY / GINI INDEX
2,992
TOTAL POPULATION
1,303
MALE POPULATION
1,689
FEMALE POPULATION
77.15
MALES / 100 FEMALES
129.62
FEMALES / 100 MALES
59.7
MEDIAN AGE
2.4
AVG FAMILY SIZE
1.8
AVG HOUSEHOLD SIZE
1,462
LABOR FORCE [ PEOPLE ]
55.3%
PERCENT IN LABOR FORCE
Galena Zip Codes
Income in Galena
Income Overview in Galena
Per Capita Income in Galena is $38,387, while median incomes of families and households are $79,231 and $52,734 respectively.
| Characteristic | Number | Measure |
| Per Capita Income | 2,992 | $38,387 |
| Median Family Income | 802 | $79,231 |
| Mean Family Income | 802 | $90,197 |
| Median Household Income | 1,661 | $52,734 |
| Mean Household Income | 1,661 | $68,220 |
| Income Deficit | 802 | $0 |
| Wage / Income Gap (%) | 2,992 | 25.18% |
| Wage / Income Gap ($) | 2,992 | 74.82¢ per $1 |
| Gini / Inequality Index | 2,992 | 0.41 |
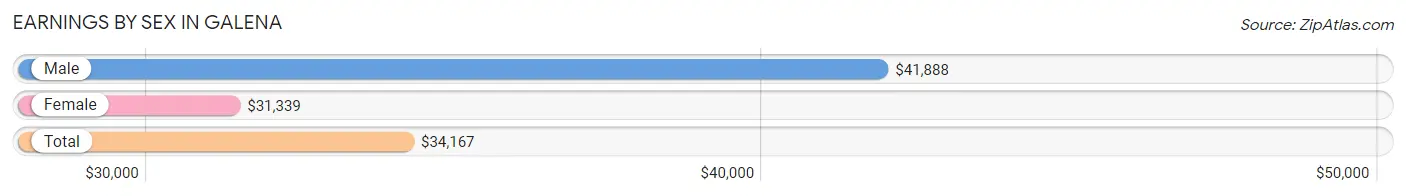
Earnings by Sex in Galena
Average Earnings in Galena are $34,167, $41,888 for men and $31,339 for women, a difference of 25.2%.
| Sex | Number | Average Earnings |
| Male | 772 (46.7%) | $41,888 |
| Female | 880 (53.3%) | $31,339 |
| Total | 1,652 (100.0%) | $34,167 |
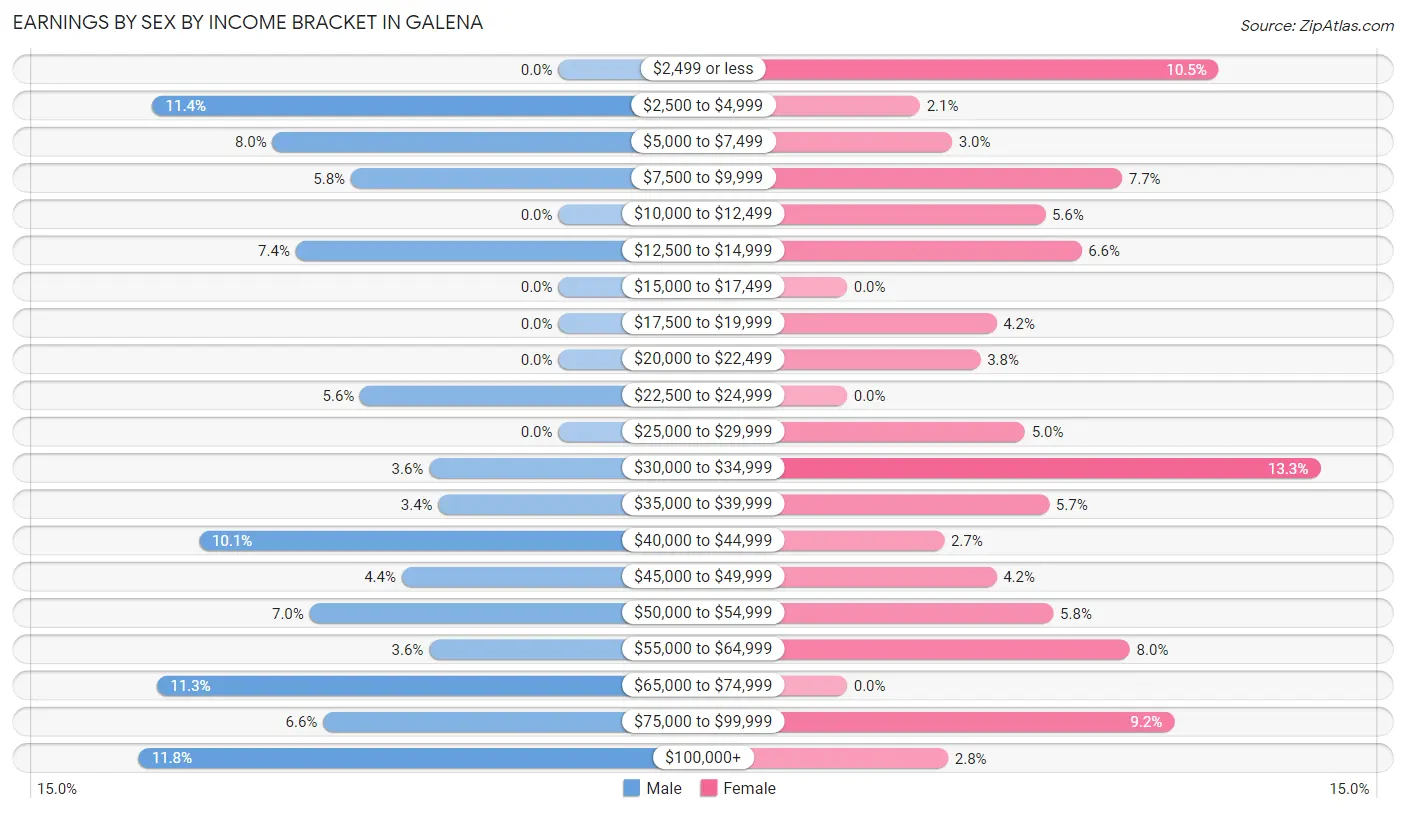
Earnings by Sex by Income Bracket in Galena
The most common earnings brackets in Galena are $100,000+ for men (91 | 11.8%) and $30,000 to $34,999 for women (117 | 13.3%).
| Income | Male | Female |
| $2,499 or less | 0 (0.0%) | 92 (10.4%) |
| $2,500 to $4,999 | 88 (11.4%) | 18 (2.1%) |
| $5,000 to $7,499 | 62 (8.0%) | 26 (2.9%) |
| $7,500 to $9,999 | 45 (5.8%) | 68 (7.7%) |
| $10,000 to $12,499 | 0 (0.0%) | 49 (5.6%) |
| $12,500 to $14,999 | 57 (7.4%) | 58 (6.6%) |
| $15,000 to $17,499 | 0 (0.0%) | 0 (0.0%) |
| $17,500 to $19,999 | 0 (0.0%) | 37 (4.2%) |
| $20,000 to $22,499 | 0 (0.0%) | 33 (3.7%) |
| $22,500 to $24,999 | 43 (5.6%) | 0 (0.0%) |
| $25,000 to $29,999 | 0 (0.0%) | 44 (5.0%) |
| $30,000 to $34,999 | 28 (3.6%) | 117 (13.3%) |
| $35,000 to $39,999 | 26 (3.4%) | 50 (5.7%) |
| $40,000 to $44,999 | 78 (10.1%) | 24 (2.7%) |
| $45,000 to $49,999 | 34 (4.4%) | 37 (4.2%) |
| $50,000 to $54,999 | 54 (7.0%) | 51 (5.8%) |
| $55,000 to $64,999 | 28 (3.6%) | 70 (8.0%) |
| $65,000 to $74,999 | 87 (11.3%) | 0 (0.0%) |
| $75,000 to $99,999 | 51 (6.6%) | 81 (9.2%) |
| $100,000+ | 91 (11.8%) | 25 (2.8%) |
| Total | 772 (100.0%) | 880 (100.0%) |
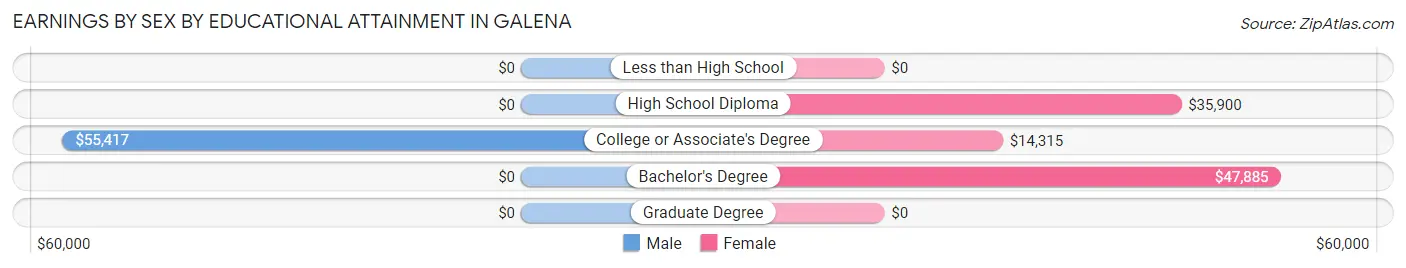
Earnings by Sex by Educational Attainment in Galena
Average earnings in Galena are $41,556 for men and $25,040 for women, a difference of 39.7%. Men with an educational attainment of college or associate's degree enjoy the highest average annual earnings of $55,417, while those with college or associate's degree education earn the least with $55,417. Women with an educational attainment of bachelor's degree earn the most with the average annual earnings of $47,885, while those with college or associate's degree education have the smallest earnings of $14,315.
| Educational Attainment | Male Income | Female Income |
| Less than High School | - | - |
| High School Diploma | - | - |
| College or Associate's Degree | $55,417 | $14,315 |
| Bachelor's Degree | - | - |
| Graduate Degree | - | - |
| Total | $41,556 | $25,040 |
Family Income in Galena
Family Income Brackets in Galena
According to the Galena family income data, there are 189 families falling into the $75,000 to $99,999 income range, which is the most common income bracket and makes up 23.6% of all families.
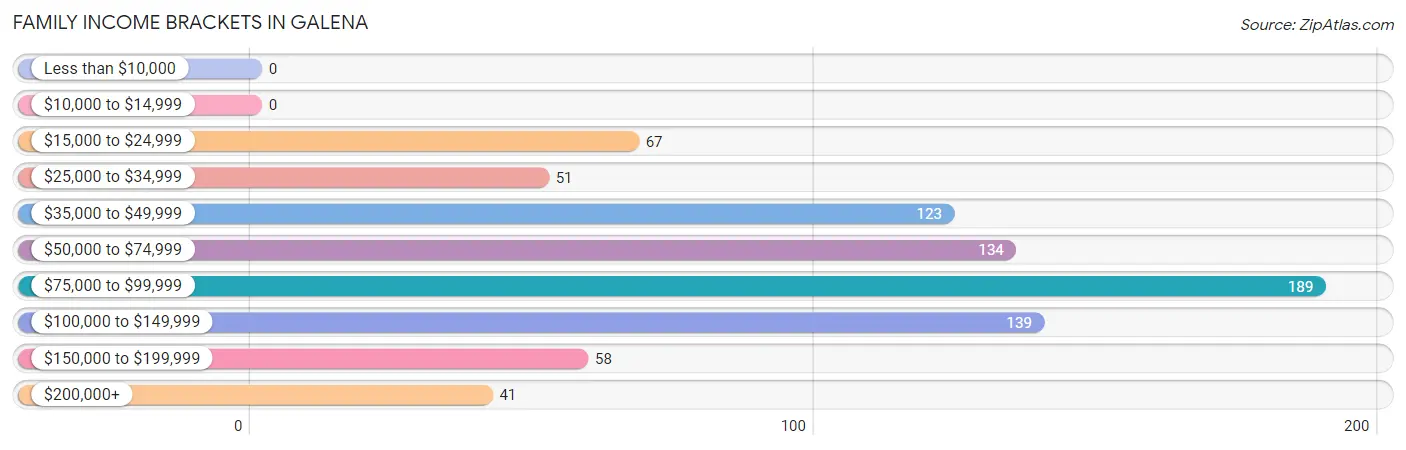
| Income Bracket | # Families | % Families |
| Less than $10,000 | 0 | 0.0% |
| $10,000 to $14,999 | 0 | 0.0% |
| $15,000 to $24,999 | 67 | 8.4% |
| $25,000 to $34,999 | 51 | 6.4% |
| $35,000 to $49,999 | 123 | 15.3% |
| $50,000 to $74,999 | 134 | 16.7% |
| $75,000 to $99,999 | 189 | 23.6% |
| $100,000 to $149,999 | 139 | 17.3% |
| $150,000 to $199,999 | 58 | 7.2% |
| $200,000+ | 41 | 5.1% |
Family Income by Famaliy Size in Galena
3-person families (106 | 13.2%) account for the highest median family income in Galena with $140,806 per family, while 3-person families (106 | 13.2%) have the highest median income of $46,935 per family member.
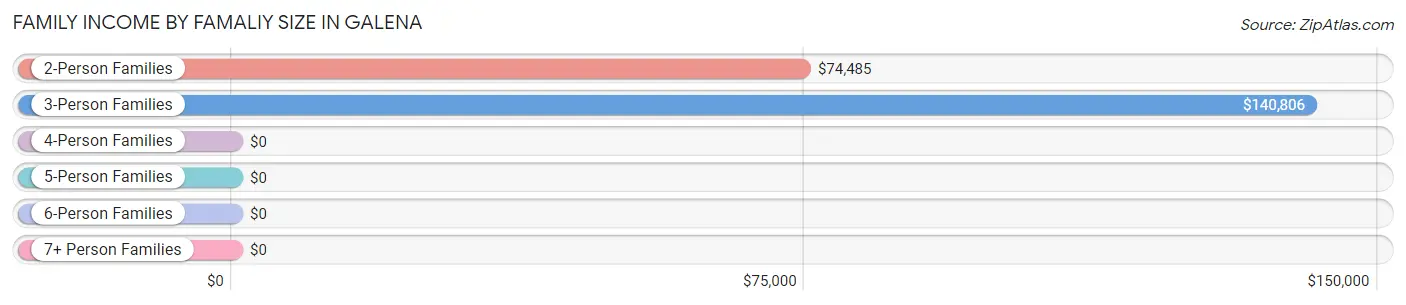
| Income Bracket | # Families | Median Income |
| 2-Person Families | 649 (80.9%) | $74,485 |
| 3-Person Families | 106 (13.2%) | $140,806 |
| 4-Person Families | 19 (2.4%) | $0 |
| 5-Person Families | 0 (0.0%) | $0 |
| 6-Person Families | 0 (0.0%) | $0 |
| 7+ Person Families | 28 (3.5%) | $0 |
| Total | 802 (100.0%) | $79,231 |
Family Income by Number of Earners in Galena
The median family income in Galena is $79,231, with families comprising 3+ earners (59) having the highest median family income of $138,795, while families with 1 earner (218) have the lowest median family income of $46,202, accounting for 7.4% and 27.2% of families, respectively.
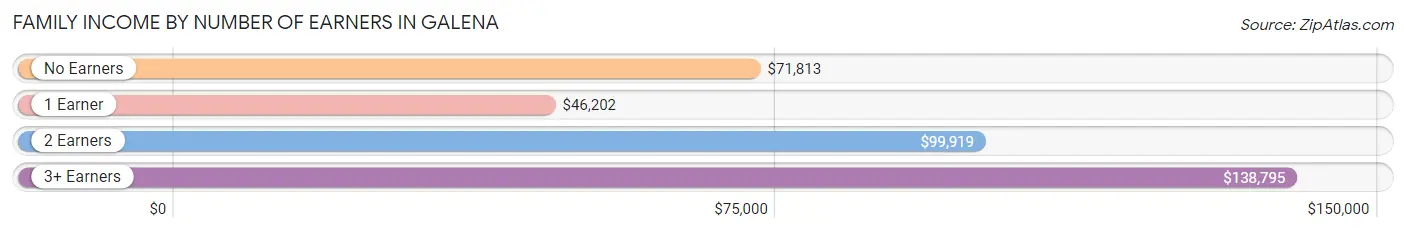
| Number of Earners | # Families | Median Income |
| No Earners | 195 (24.3%) | $71,813 |
| 1 Earner | 218 (27.2%) | $46,202 |
| 2 Earners | 330 (41.1%) | $99,919 |
| 3+ Earners | 59 (7.4%) | $138,795 |
| Total | 802 (100.0%) | $79,231 |
Household Income in Galena
Household Income Brackets in Galena
With 296 households falling in the category, the $75,000 to $99,999 income range is the most frequent in Galena, accounting for 17.8% of all households. In contrast, only 58 households (3.5%) fall into the $150,000 to $199,999 income bracket, making it the least populous group.
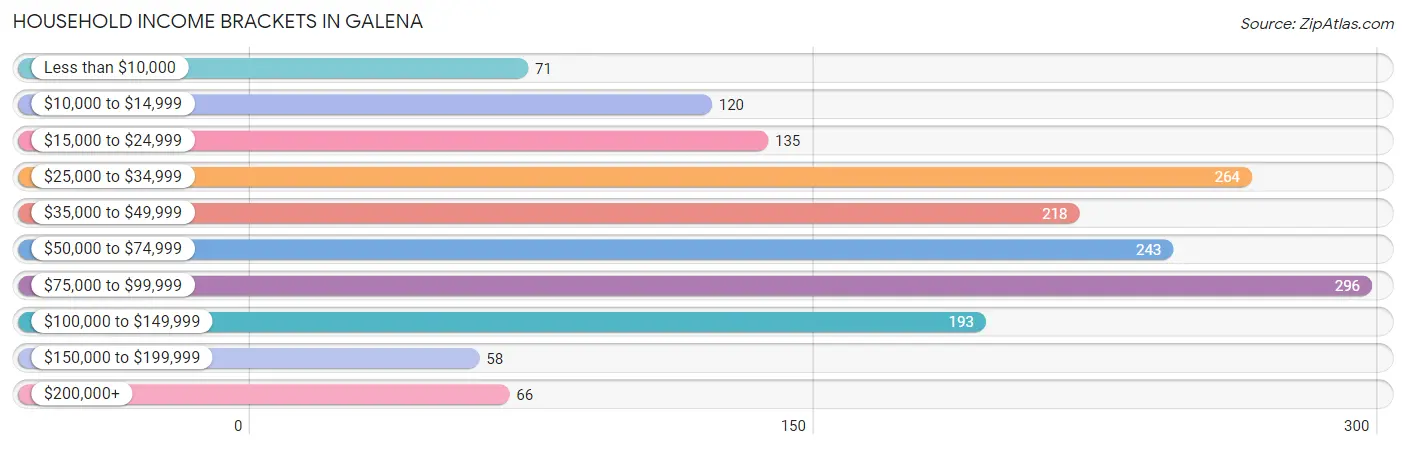
| Income Bracket | # Households | % Households |
| Less than $10,000 | 71 | 4.3% |
| $10,000 to $14,999 | 120 | 7.2% |
| $15,000 to $24,999 | 135 | 8.1% |
| $25,000 to $34,999 | 264 | 15.9% |
| $35,000 to $49,999 | 218 | 13.1% |
| $50,000 to $74,999 | 243 | 14.6% |
| $75,000 to $99,999 | 296 | 17.8% |
| $100,000 to $149,999 | 193 | 11.6% |
| $150,000 to $199,999 | 58 | 3.5% |
| $200,000+ | 66 | 4.0% |
Household Income by Householder Age in Galena
The median household income in Galena is $52,734, with the highest median household income of $76,140 found in the 45 to 64 years age bracket for the primary householder. A total of 408 households (24.6%) fall into this category. Meanwhile, the 15 to 24 years age bracket for the primary householder has the lowest median household income of $33,750, with 145 households (8.7%) in this group.
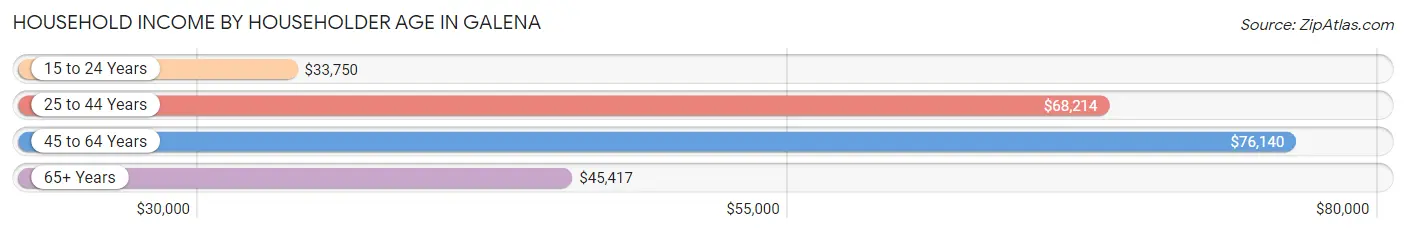
| Income Bracket | # Households | Median Income |
| 15 to 24 Years | 145 (8.7%) | $33,750 |
| 25 to 44 Years | 244 (14.7%) | $68,214 |
| 45 to 64 Years | 408 (24.6%) | $76,140 |
| 65+ Years | 864 (52.0%) | $45,417 |
| Total | 1,661 (100.0%) | $52,734 |
Poverty in Galena
Income Below Poverty by Sex and Age in Galena
With 12.2% poverty level for males and 8.2% for females among the residents of Galena, 35 to 44 year old males and 25 to 34 year old females are the most vulnerable to poverty, with 68 males (31.0%) and 27 females (24.8%) in their respective age groups living below the poverty level.
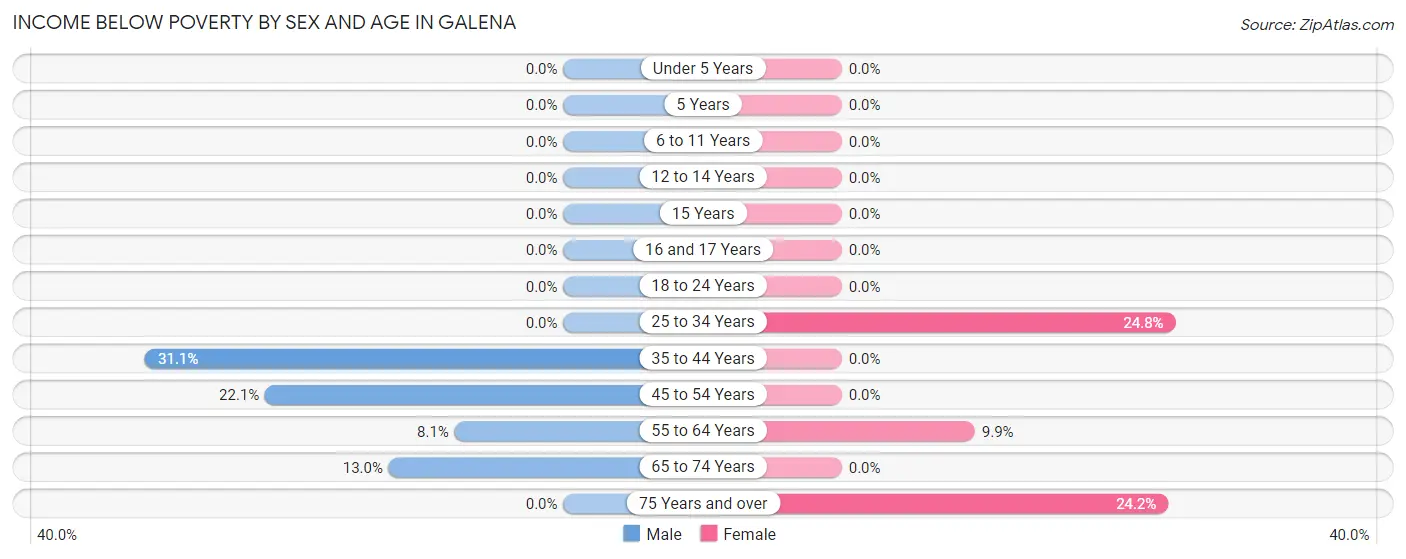
| Age Bracket | Male | Female |
| Under 5 Years | 0 (0.0%) | 0 (0.0%) |
| 5 Years | 0 (0.0%) | 0 (0.0%) |
| 6 to 11 Years | 0 (0.0%) | 0 (0.0%) |
| 12 to 14 Years | 0 (0.0%) | 0 (0.0%) |
| 15 Years | 0 (0.0%) | 0 (0.0%) |
| 16 and 17 Years | 0 (0.0%) | 0 (0.0%) |
| 18 to 24 Years | 0 (0.0%) | 0 (0.0%) |
| 25 to 34 Years | 0 (0.0%) | 27 (24.8%) |
| 35 to 44 Years | 68 (31.0%) | 0 (0.0%) |
| 45 to 54 Years | 31 (22.1%) | 0 (0.0%) |
| 55 to 64 Years | 13 (8.1%) | 24 (9.9%) |
| 65 to 74 Years | 42 (13.0%) | 0 (0.0%) |
| 75 Years and over | 0 (0.0%) | 86 (24.2%) |
| Total | 154 (12.2%) | 137 (8.2%) |
Income Above Poverty by Sex and Age in Galena
According to the poverty statistics in Galena, males aged under 5 years and females aged under 5 years are the age groups that are most secure financially, with 100.0% of males and 100.0% of females in these age groups living above the poverty line.
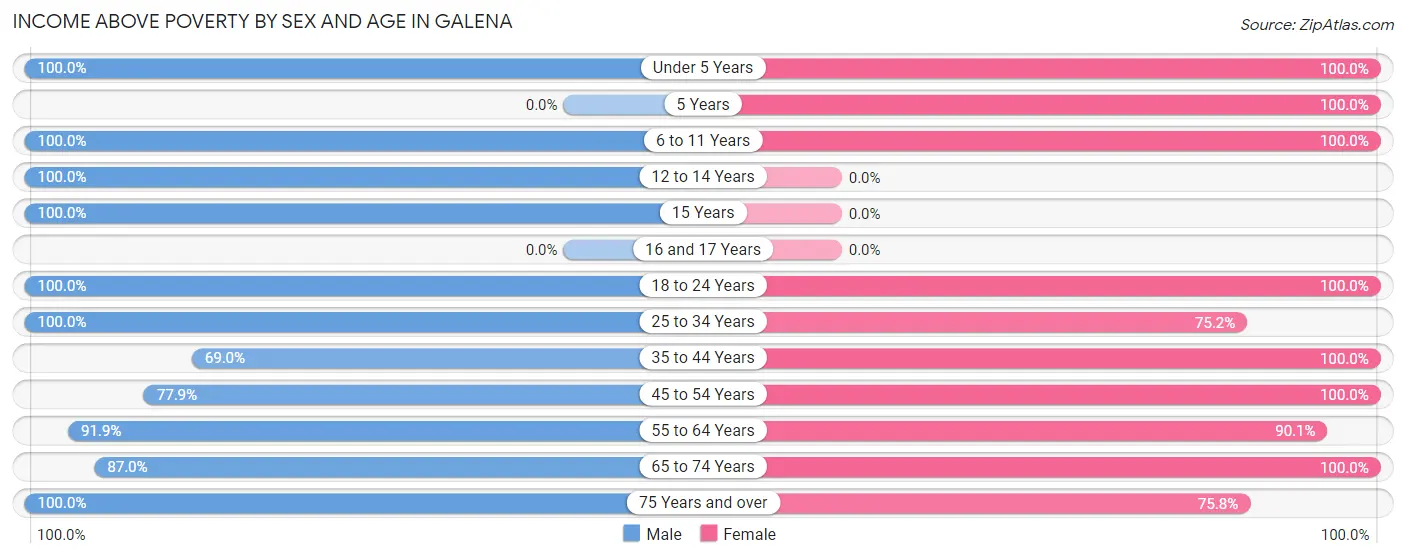
| Age Bracket | Male | Female |
| Under 5 Years | 38 (100.0%) | 53 (100.0%) |
| 5 Years | 0 (0.0%) | 59 (100.0%) |
| 6 to 11 Years | 99 (100.0%) | 73 (100.0%) |
| 12 to 14 Years | 24 (100.0%) | 0 (0.0%) |
| 15 Years | 2 (100.0%) | 0 (0.0%) |
| 16 and 17 Years | 0 (0.0%) | 0 (0.0%) |
| 18 to 24 Years | 43 (100.0%) | 186 (100.0%) |
| 25 to 34 Years | 55 (100.0%) | 82 (75.2%) |
| 35 to 44 Years | 151 (69.0%) | 162 (100.0%) |
| 45 to 54 Years | 109 (77.9%) | 31 (100.0%) |
| 55 to 64 Years | 148 (91.9%) | 219 (90.1%) |
| 65 to 74 Years | 282 (87.0%) | 411 (100.0%) |
| 75 Years and over | 153 (100.0%) | 269 (75.8%) |
| Total | 1,104 (87.8%) | 1,545 (91.8%) |
Income Below Poverty Among Married-Couple Families in Galena
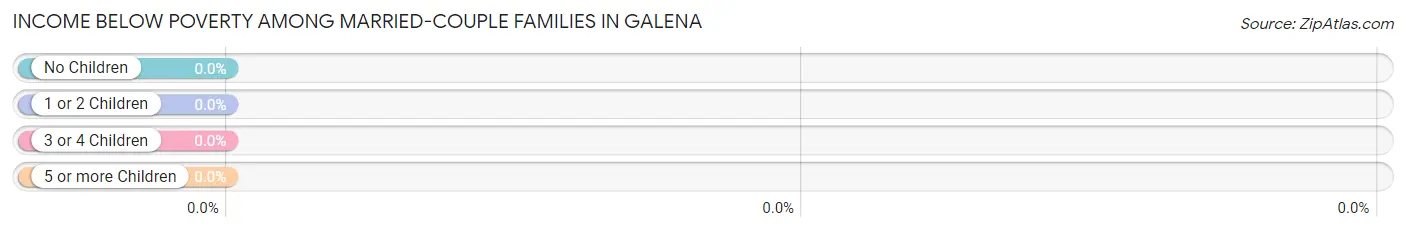
| Children | Above Poverty | Below Poverty |
| No Children | 511 (100.0%) | 0 (0.0%) |
| 1 or 2 Children | 78 (100.0%) | 0 (0.0%) |
| 3 or 4 Children | 0 (0.0%) | 0 (0.0%) |
| 5 or more Children | 0 (0.0%) | 0 (0.0%) |
| Total | 589 (100.0%) | 0 (0.0%) |
Income Below Poverty Among Single-Parent Households in Galena
| Children | Single Father | Single Mother |
| No Children | 0 (0.0%) | 0 (0.0%) |
| 1 or 2 Children | 0 (0.0%) | 0 (0.0%) |
| 3 or 4 Children | 0 (0.0%) | 0 (0.0%) |
| 5 or more Children | 0 (0.0%) | 0 (0.0%) |
| Total | 0 (0.0%) | 0 (0.0%) |
Income Below Poverty Among Married-Couple vs Single-Parent Households in Galena
| Children | Married-Couple Families | Single-Parent Households |
| No Children | 0 (0.0%) | 0 (0.0%) |
| 1 or 2 Children | 0 (0.0%) | 0 (0.0%) |
| 3 or 4 Children | 0 (0.0%) | 0 (0.0%) |
| 5 or more Children | 0 (0.0%) | 0 (0.0%) |
| Total | 0 (0.0%) | 0 (0.0%) |
Race in Galena
The most populous races in Galena are White / Caucasian (2,962 | 99.0%), Hispanic or Latino (68 | 2.3%), and Black / African American (18 | 0.6%).
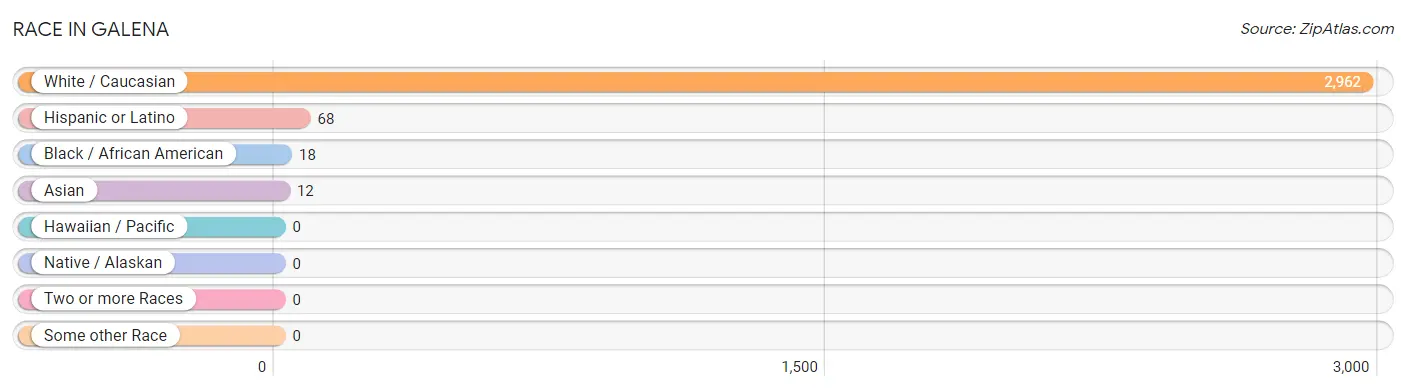
| Race | # Population | % Population |
| Asian | 12 | 0.4% |
| Black / African American | 18 | 0.6% |
| Hawaiian / Pacific | 0 | 0.0% |
| Hispanic or Latino | 68 | 2.3% |
| Native / Alaskan | 0 | 0.0% |
| White / Caucasian | 2,962 | 99.0% |
| Two or more Races | 0 | 0.0% |
| Some other Race | 0 | 0.0% |
| Total | 2,992 | 100.0% |
Ancestry in Galena
The most populous ancestries reported in Galena are German (1,341 | 44.8%), Irish (575 | 19.2%), English (365 | 12.2%), French (342 | 11.4%), and Norwegian (226 | 7.5%), together accounting for 95.2% of all Galena residents.
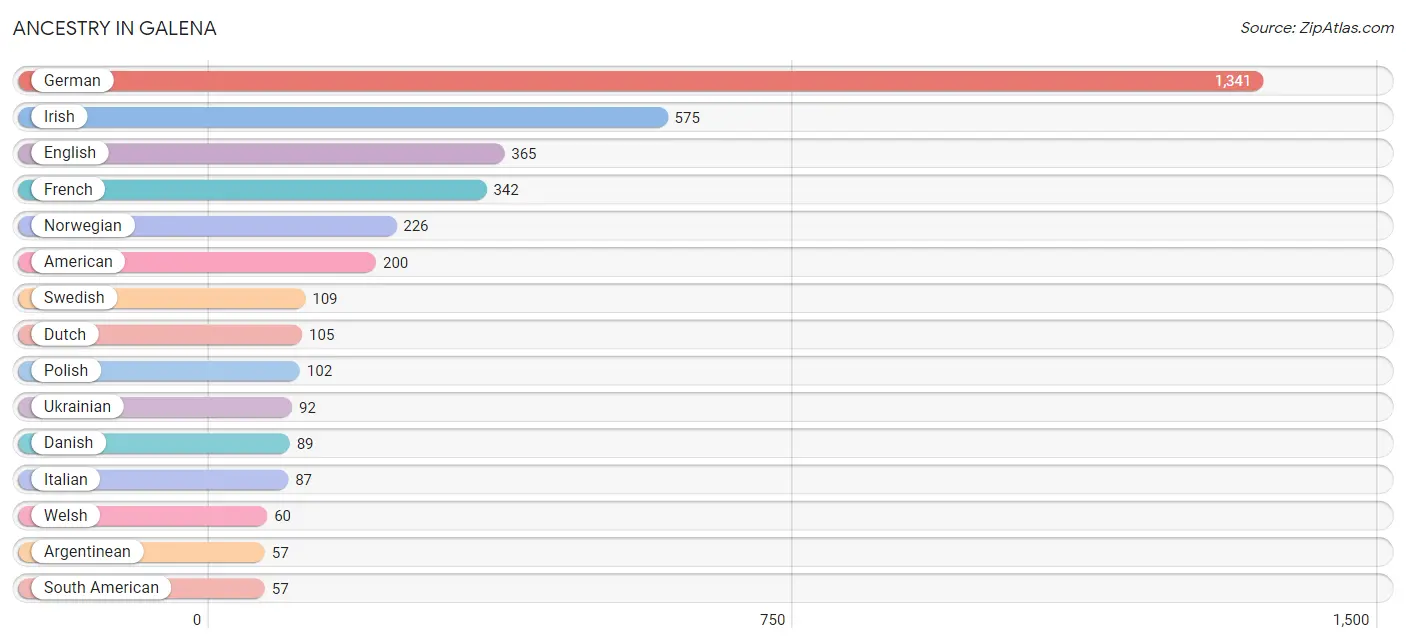
| Ancestry | # Population | % Population |
| Albanian | 27 | 0.9% |
| American | 200 | 6.7% |
| Argentinean | 57 | 1.9% |
| Belgian | 19 | 0.6% |
| British | 42 | 1.4% |
| Cajun | 18 | 0.6% |
| Danish | 89 | 3.0% |
| Dutch | 105 | 3.5% |
| English | 365 | 12.2% |
| European | 4 | 0.1% |
| French | 342 | 11.4% |
| German | 1,341 | 44.8% |
| Greek | 41 | 1.4% |
| Irish | 575 | 19.2% |
| Italian | 87 | 2.9% |
| Mexican | 11 | 0.4% |
| Norwegian | 226 | 7.5% |
| Polish | 102 | 3.4% |
| Russian | 41 | 1.4% |
| Scandinavian | 16 | 0.5% |
| Scottish | 13 | 0.4% |
| South American | 57 | 1.9% |
| Sri Lankan | 12 | 0.4% |
| Swedish | 109 | 3.6% |
| Ukrainian | 92 | 3.1% |
| Welsh | 60 | 2.0% | View All 26 Rows |
Immigrants in Galena
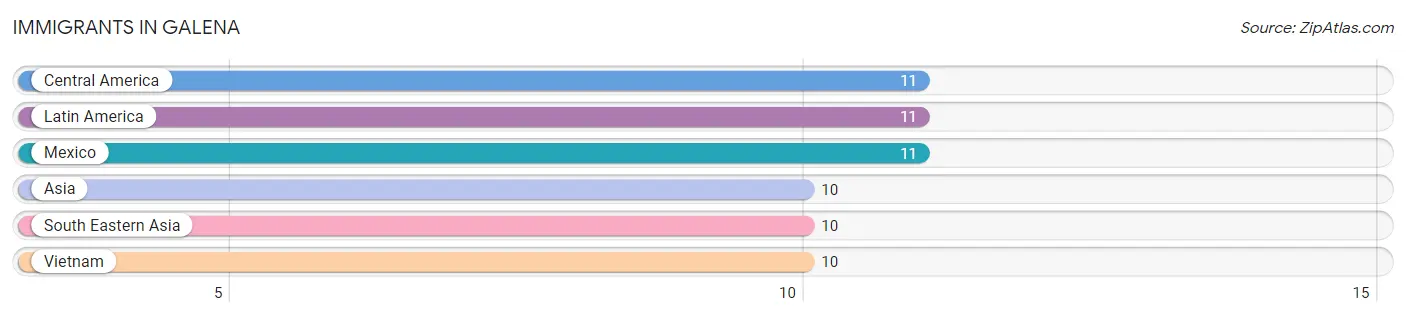
The most numerous immigrant groups reported in Galena came from Central America (11 | 0.4%), Latin America (11 | 0.4%), Mexico (11 | 0.4%), Asia (10 | 0.3%), and South Eastern Asia (10 | 0.3%), together accounting for 1.8% of all Galena residents.
| Immigration Origin | # Population | % Population |
| Asia | 10 | 0.3% |
| Central America | 11 | 0.4% |
| Latin America | 11 | 0.4% |
| Mexico | 11 | 0.4% |
| South Eastern Asia | 10 | 0.3% |
| Vietnam | 10 | 0.3% | View All 6 Rows |
Sex and Age in Galena
Sex and Age in Galena
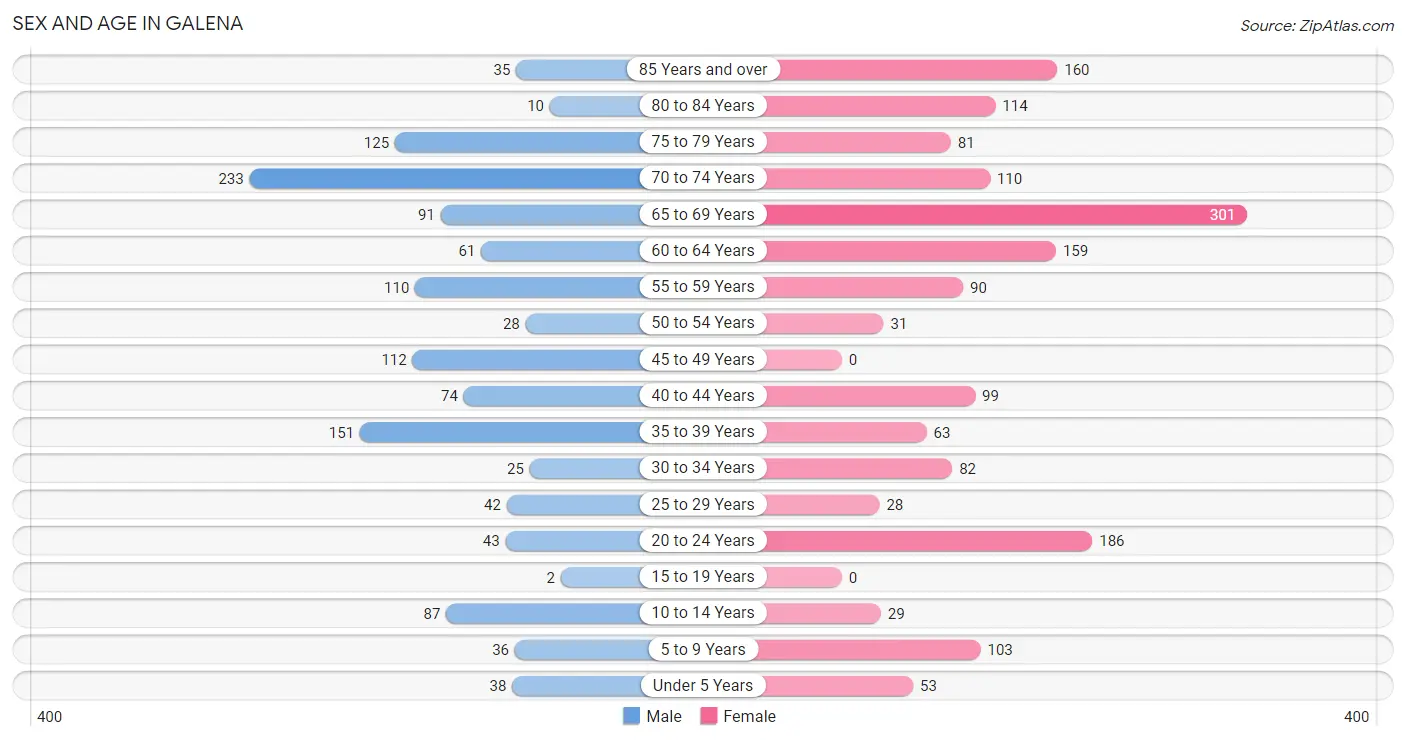
The most populous age groups in Galena are 70 to 74 Years (233 | 17.9%) for men and 65 to 69 Years (301 | 17.8%) for women.
| Age Bracket | Male | Female |
| Under 5 Years | 38 (2.9%) | 53 (3.1%) |
| 5 to 9 Years | 36 (2.8%) | 103 (6.1%) |
| 10 to 14 Years | 87 (6.7%) | 29 (1.7%) |
| 15 to 19 Years | 2 (0.2%) | 0 (0.0%) |
| 20 to 24 Years | 43 (3.3%) | 186 (11.0%) |
| 25 to 29 Years | 42 (3.2%) | 28 (1.7%) |
| 30 to 34 Years | 25 (1.9%) | 82 (4.9%) |
| 35 to 39 Years | 151 (11.6%) | 63 (3.7%) |
| 40 to 44 Years | 74 (5.7%) | 99 (5.9%) |
| 45 to 49 Years | 112 (8.6%) | 0 (0.0%) |
| 50 to 54 Years | 28 (2.1%) | 31 (1.8%) |
| 55 to 59 Years | 110 (8.4%) | 90 (5.3%) |
| 60 to 64 Years | 61 (4.7%) | 159 (9.4%) |
| 65 to 69 Years | 91 (7.0%) | 301 (17.8%) |
| 70 to 74 Years | 233 (17.9%) | 110 (6.5%) |
| 75 to 79 Years | 125 (9.6%) | 81 (4.8%) |
| 80 to 84 Years | 10 (0.8%) | 114 (6.8%) |
| 85 Years and over | 35 (2.7%) | 160 (9.5%) |
| Total | 1,303 (100.0%) | 1,689 (100.0%) |
Families and Households in Galena
Median Family Size in Galena
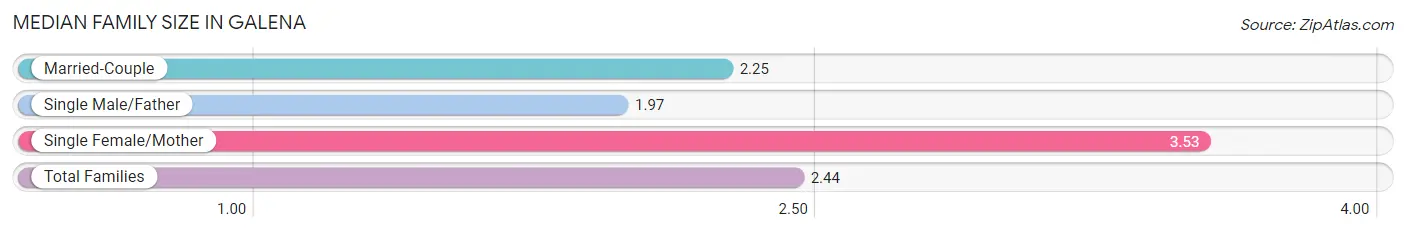
The median family size in Galena is 2.44 persons per family, with single female/mother families (137 | 17.1%) accounting for the largest median family size of 3.53 persons per family. On the other hand, single male/father families (76 | 9.5%) represent the smallest median family size with 1.97 persons per family.
| Family Type | # Families | Family Size |
| Married-Couple | 589 (73.4%) | 2.25 |
| Single Male/Father | 76 (9.5%) | 1.97 |
| Single Female/Mother | 137 (17.1%) | 3.53 |
| Total Families | 802 (100.0%) | 2.44 |
Median Household Size in Galena
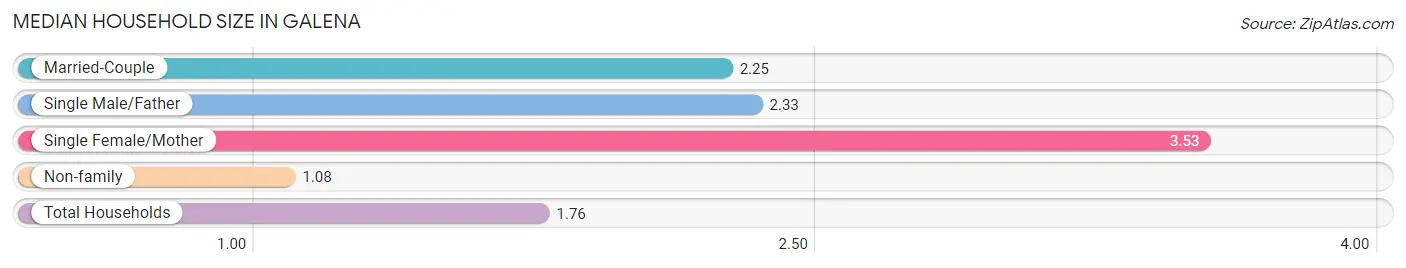
The median household size in Galena is 1.76 persons per household, with single female/mother households (137 | 8.3%) accounting for the largest median household size of 3.53 persons per household. non-family households (859 | 51.7%) represent the smallest median household size with 1.08 persons per household.
| Household Type | # Households | Household Size |
| Married-Couple | 589 (35.5%) | 2.25 |
| Single Male/Father | 76 (4.6%) | 2.33 |
| Single Female/Mother | 137 (8.3%) | 3.53 |
| Non-family | 859 (51.7%) | 1.08 |
| Total Households | 1,661 (100.0%) | 1.76 |
Household Size by Marriage Status in Galena
Out of a total of 1,661 households in Galena, 802 (48.3%) are family households, while 859 (51.7%) are nonfamily households. The most numerous type of family households are 2-person households, comprising 615, and the most common type of nonfamily households are 1-person households, comprising 801.
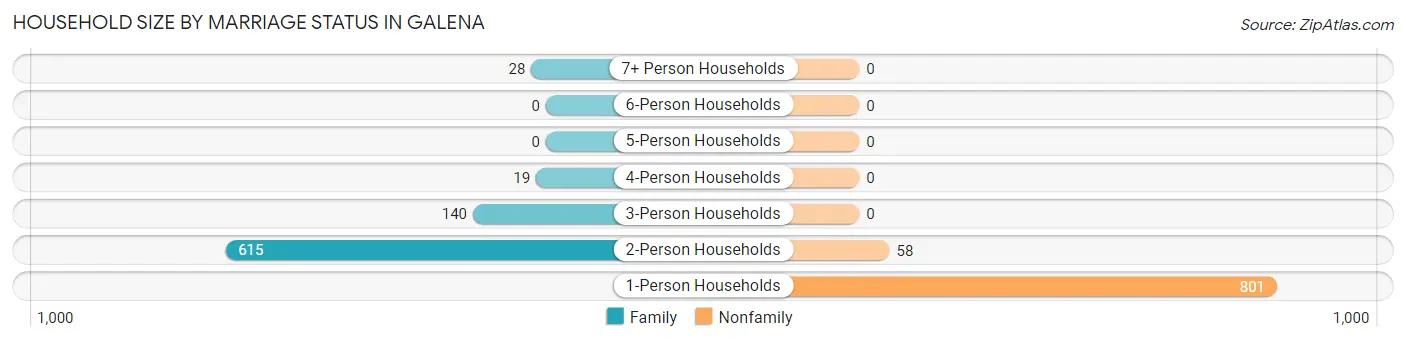
| Household Size | Family Households | Nonfamily Households |
| 1-Person Households | - | 801 (48.2%) |
| 2-Person Households | 615 (37.0%) | 58 (3.5%) |
| 3-Person Households | 140 (8.4%) | 0 (0.0%) |
| 4-Person Households | 19 (1.1%) | 0 (0.0%) |
| 5-Person Households | 0 (0.0%) | 0 (0.0%) |
| 6-Person Households | 0 (0.0%) | 0 (0.0%) |
| 7+ Person Households | 28 (1.7%) | 0 (0.0%) |
| Total | 802 (48.3%) | 859 (51.7%) |
Female Fertility in Galena
Fertility by Age in Galena
Average fertility rate in Galena is 90.0 births per 1,000 women. Women in the age bracket of 20 to 34 years have the highest fertility rate with 139.0 births per 1,000 women. Women in the age bracket of 20 to 34 years acount for 100.0% of all women with births.
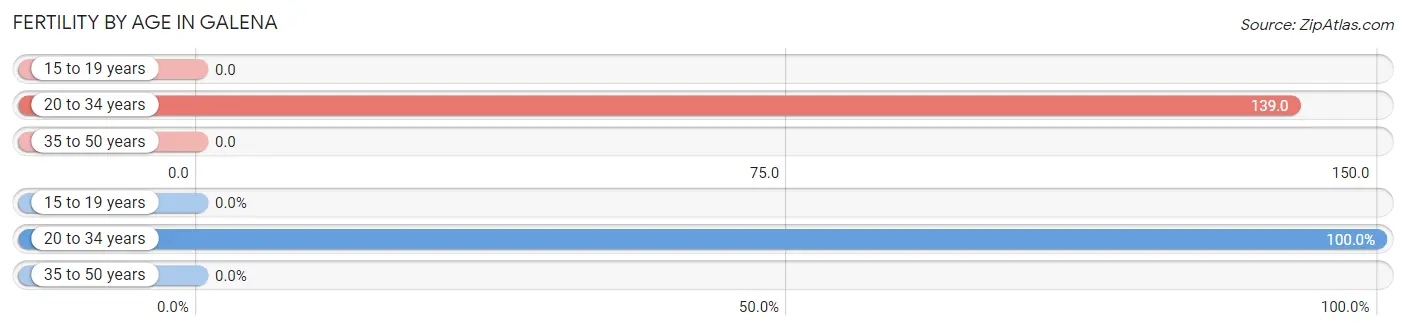
| Age Bracket | Women with Births | Births / 1,000 Women |
| 15 to 19 years | 0 (0.0%) | 0.0 |
| 20 to 34 years | 41 (100.0%) | 139.0 |
| 35 to 50 years | 0 (0.0%) | 0.0 |
| Total | 41 (100.0%) | 90.0 |
Fertility by Age by Marriage Status in Galena
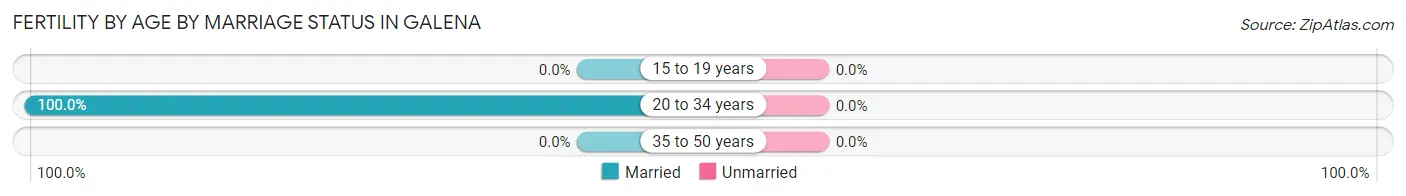
| Age Bracket | Married | Unmarried |
| 15 to 19 years | 0 (0.0%) | 0 (0.0%) |
| 20 to 34 years | 41 (100.0%) | 0 (0.0%) |
| 35 to 50 years | 0 (0.0%) | 0 (0.0%) |
| Total | 41 (100.0%) | 0 (0.0%) |
Fertility by Education in Galena
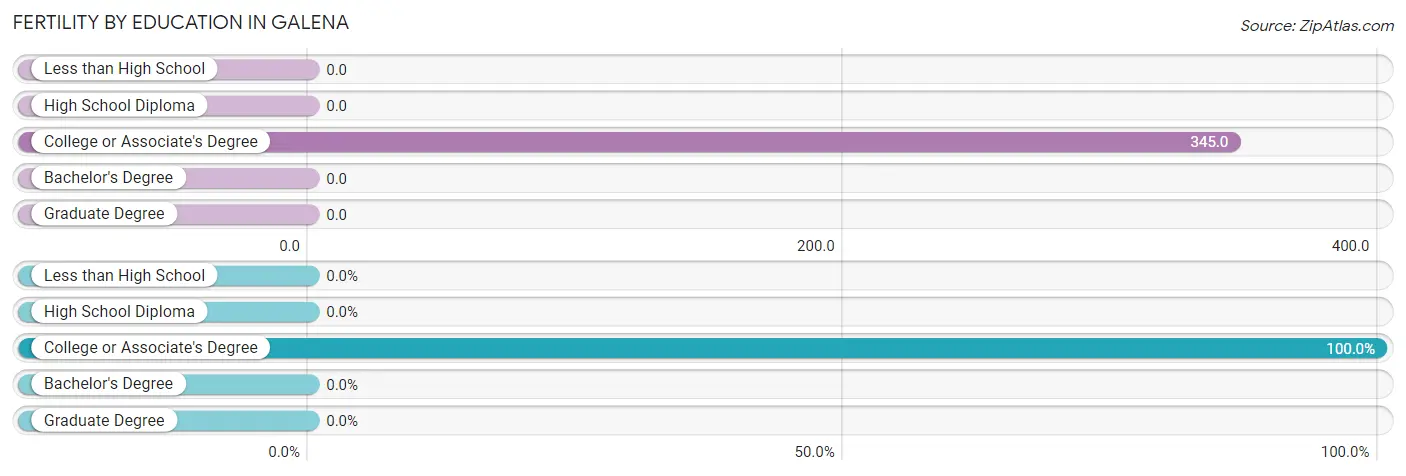
| Educational Attainment | Women with Births | Births / 1,000 Women |
| Less than High School | 0 (0.0%) | 0.0 |
| High School Diploma | 0 (0.0%) | 0.0 |
| College or Associate's Degree | 41 (100.0%) | 345.0 |
| Bachelor's Degree | 0 (0.0%) | 0.0 |
| Graduate Degree | 0 (0.0%) | 0.0 |
| Total | 41 (100.0%) | 90.0 |
Fertility by Education by Marriage Status in Galena
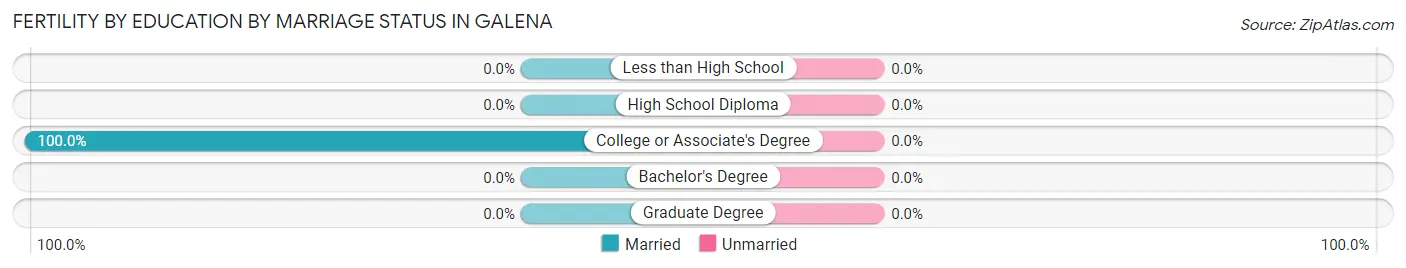
| Educational Attainment | Married | Unmarried |
| Less than High School | 0 (0.0%) | 0 (0.0%) |
| High School Diploma | 0 (0.0%) | 0 (0.0%) |
| College or Associate's Degree | 41 (100.0%) | 0 (0.0%) |
| Bachelor's Degree | 0 (0.0%) | 0 (0.0%) |
| Graduate Degree | 0 (0.0%) | 0 (0.0%) |
| Total | 41 (100.0%) | 0 (0.0%) |
Employment Characteristics in Galena
Employment by Class of Employer in Galena
Among the 1,461 employed individuals in Galena, private company employees (916 | 62.7%), self-employed (incorporated) (152 | 10.4%), and self-employed (not incorporated) (130 | 8.9%) make up the most common classes of employment.
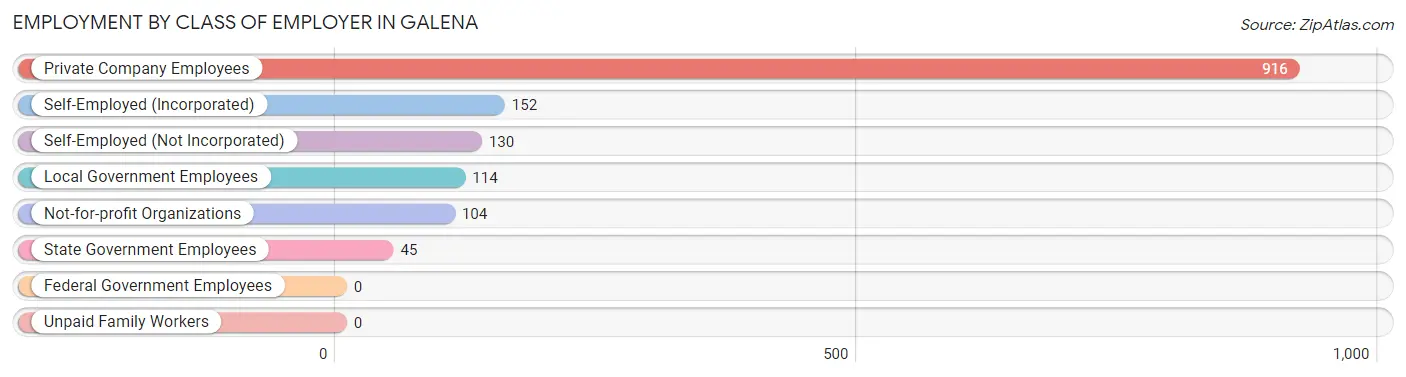
| Employer Class | # Employees | % Employees |
| Private Company Employees | 916 | 62.7% |
| Self-Employed (Incorporated) | 152 | 10.4% |
| Self-Employed (Not Incorporated) | 130 | 8.9% |
| Not-for-profit Organizations | 104 | 7.1% |
| Local Government Employees | 114 | 7.8% |
| State Government Employees | 45 | 3.1% |
| Federal Government Employees | 0 | 0.0% |
| Unpaid Family Workers | 0 | 0.0% |
| Total | 1,461 | 100.0% |
Employment Status by Age in Galena
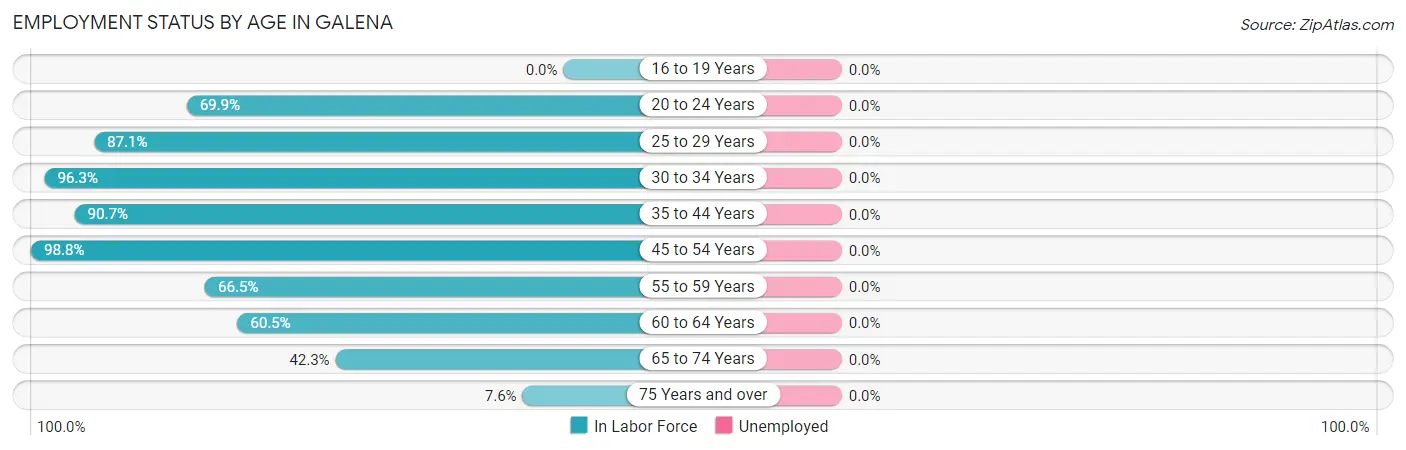
| Age Bracket | In Labor Force | Unemployed |
| 16 to 19 Years | 0 (0.0%) | 0 (0.0%) |
| 20 to 24 Years | 160 (69.9%) | 0 (0.0%) |
| 25 to 29 Years | 61 (87.1%) | 0 (0.0%) |
| 30 to 34 Years | 103 (96.3%) | 0 (0.0%) |
| 35 to 44 Years | 351 (90.7%) | 0 (0.0%) |
| 45 to 54 Years | 169 (98.8%) | 0 (0.0%) |
| 55 to 59 Years | 133 (66.5%) | 0 (0.0%) |
| 60 to 64 Years | 133 (60.5%) | 0 (0.0%) |
| 65 to 74 Years | 311 (42.3%) | 0 (0.0%) |
| 75 Years and over | 40 (7.6%) | 0 (0.0%) |
| Total | 1,462 (55.3%) | 0 (0.0%) |
Employment Status by Educational Attainment in Galena
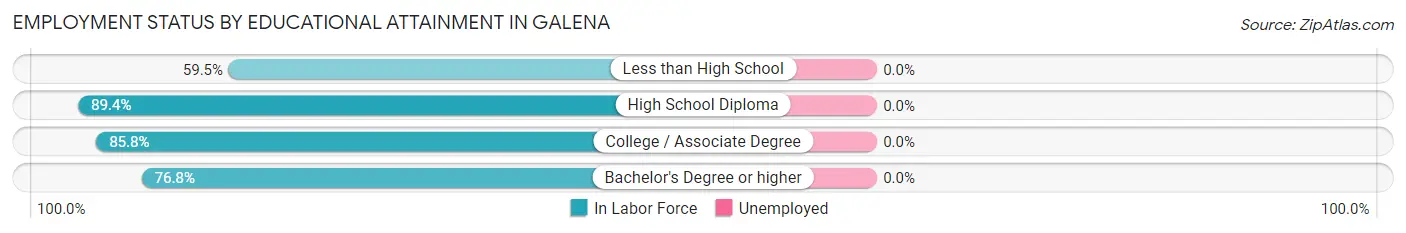
| Educational Attainment | In Labor Force | Unemployed |
| Less than High School | 25 (59.5%) | 0 (0.0%) |
| High School Diploma | 322 (89.4%) | 0 (0.0%) |
| College / Associate Degree | 235 (85.8%) | 0 (0.0%) |
| Bachelor's Degree or higher | 368 (76.8%) | 0 (0.0%) |
| Total | 951 (82.3%) | 0 (0.0%) |
Employment Occupations by Sex in Galena
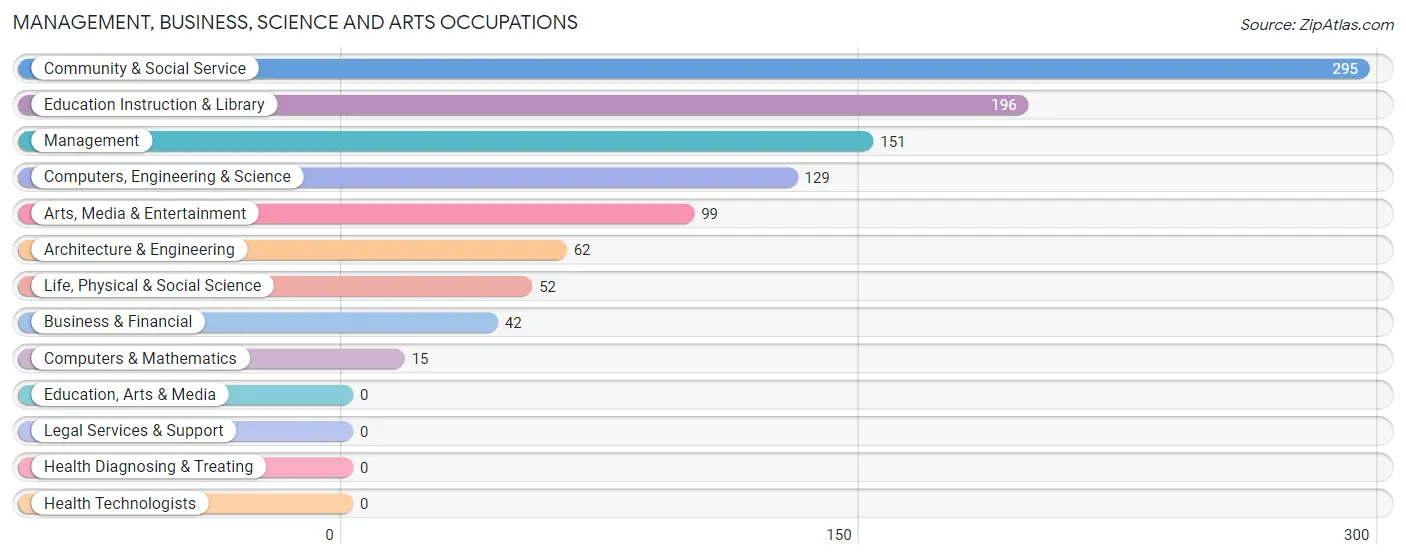
Management, Business, Science and Arts Occupations
The most common Management, Business, Science and Arts occupations in Galena are Community & Social Service (295 | 20.2%), Education Instruction & Library (196 | 13.4%), Management (151 | 10.3%), Computers, Engineering & Science (129 | 8.8%), and Arts, Media & Entertainment (99 | 6.8%).
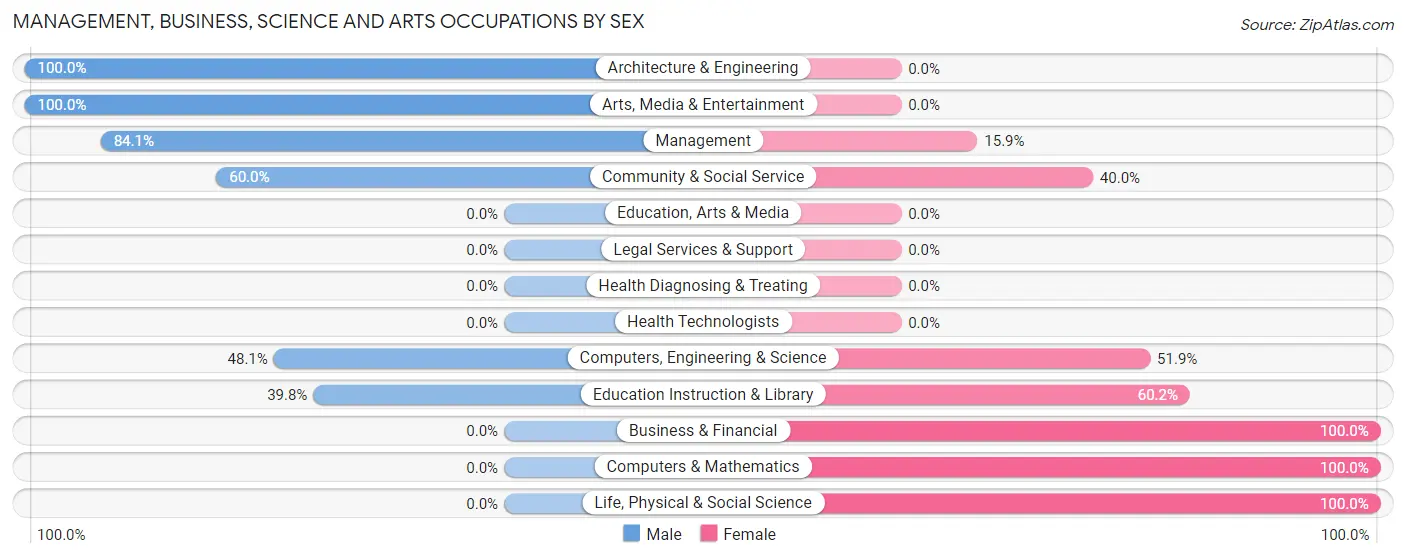
Management, Business, Science and Arts Occupations by Sex
Within the Management, Business, Science and Arts occupations in Galena, the most male-oriented occupations are Architecture & Engineering (100.0%), Arts, Media & Entertainment (100.0%), and Management (84.1%), while the most female-oriented occupations are Business & Financial (100.0%), Computers & Mathematics (100.0%), and Life, Physical & Social Science (100.0%).
| Occupation | Male | Female |
| Management | 127 (84.1%) | 24 (15.9%) |
| Business & Financial | 0 (0.0%) | 42 (100.0%) |
| Computers, Engineering & Science | 62 (48.1%) | 67 (51.9%) |
| Computers & Mathematics | 0 (0.0%) | 15 (100.0%) |
| Architecture & Engineering | 62 (100.0%) | 0 (0.0%) |
| Life, Physical & Social Science | 0 (0.0%) | 52 (100.0%) |
| Community & Social Service | 177 (60.0%) | 118 (40.0%) |
| Education, Arts & Media | 0 (0.0%) | 0 (0.0%) |
| Legal Services & Support | 0 (0.0%) | 0 (0.0%) |
| Education Instruction & Library | 78 (39.8%) | 118 (60.2%) |
| Arts, Media & Entertainment | 99 (100.0%) | 0 (0.0%) |
| Health Diagnosing & Treating | 0 (0.0%) | 0 (0.0%) |
| Health Technologists | 0 (0.0%) | 0 (0.0%) |
| Total (Category) | 366 (59.3%) | 251 (40.7%) |
| Total (Overall) | 712 (48.7%) | 749 (51.3%) |
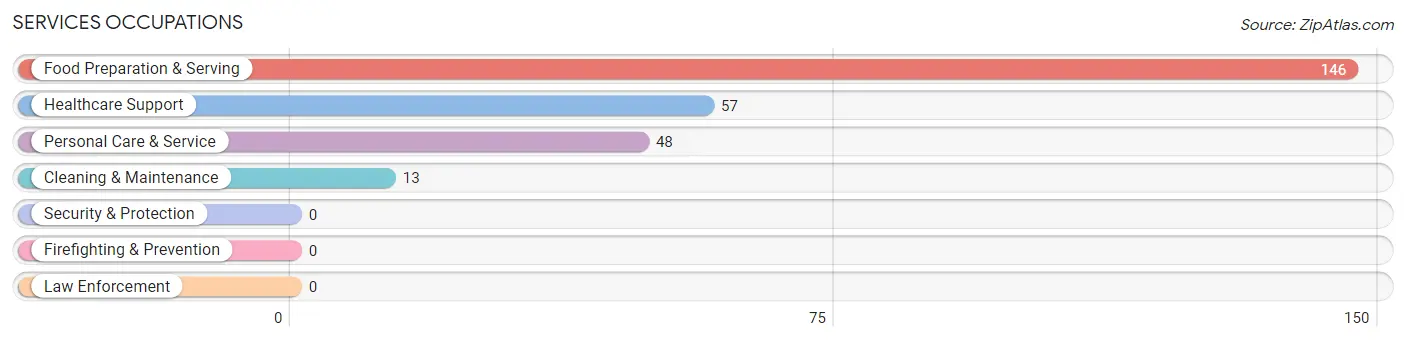
Services Occupations
The most common Services occupations in Galena are Food Preparation & Serving (146 | 10.0%), Healthcare Support (57 | 3.9%), Personal Care & Service (48 | 3.3%), and Cleaning & Maintenance (13 | 0.9%).
Services Occupations by Sex
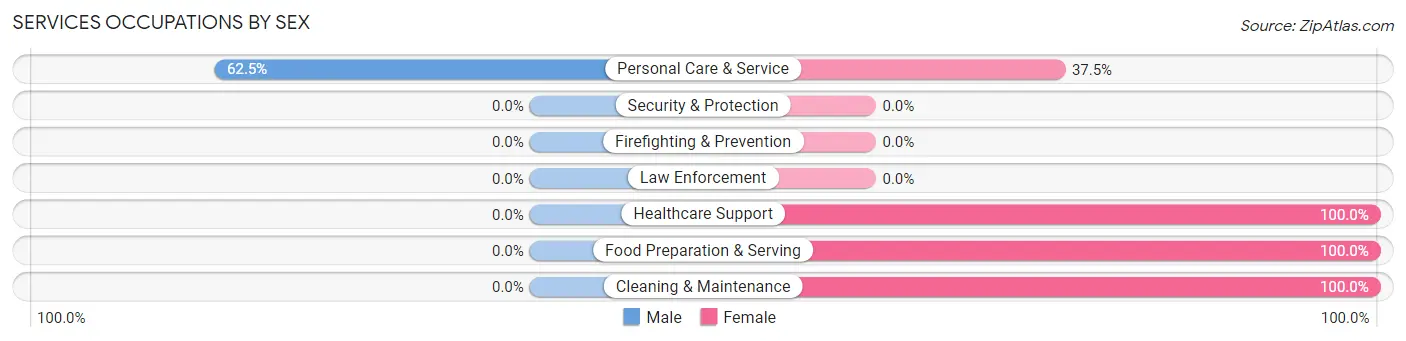
| Occupation | Male | Female |
| Healthcare Support | 0 (0.0%) | 57 (100.0%) |
| Security & Protection | 0 (0.0%) | 0 (0.0%) |
| Firefighting & Prevention | 0 (0.0%) | 0 (0.0%) |
| Law Enforcement | 0 (0.0%) | 0 (0.0%) |
| Food Preparation & Serving | 0 (0.0%) | 146 (100.0%) |
| Cleaning & Maintenance | 0 (0.0%) | 13 (100.0%) |
| Personal Care & Service | 30 (62.5%) | 18 (37.5%) |
| Total (Category) | 30 (11.4%) | 234 (88.6%) |
| Total (Overall) | 712 (48.7%) | 749 (51.3%) |
Sales and Office Occupations
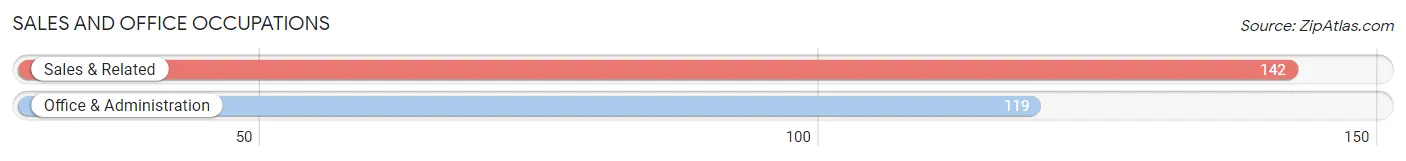
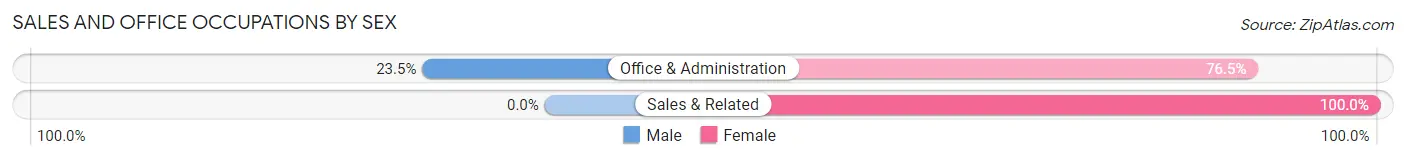
The most common Sales and Office occupations in Galena are Sales & Related (142 | 9.7%), and Office & Administration (119 | 8.2%).
Sales and Office Occupations by Sex
| Occupation | Male | Female |
| Sales & Related | 0 (0.0%) | 142 (100.0%) |
| Office & Administration | 28 (23.5%) | 91 (76.5%) |
| Total (Category) | 28 (10.7%) | 233 (89.3%) |
| Total (Overall) | 712 (48.7%) | 749 (51.3%) |
Natural Resources, Construction and Maintenance Occupations
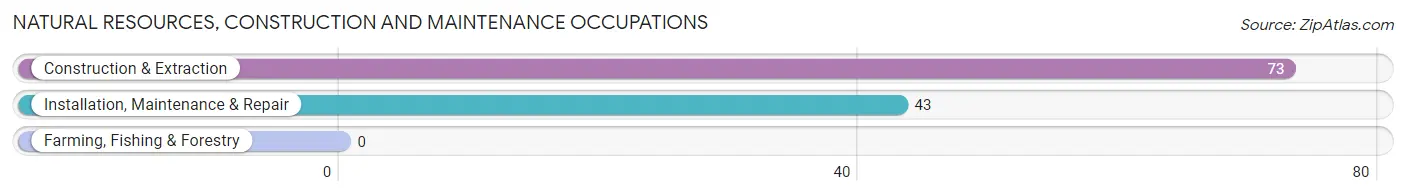
The most common Natural Resources, Construction and Maintenance occupations in Galena are Construction & Extraction (73 | 5.0%), and Installation, Maintenance & Repair (43 | 2.9%).
Natural Resources, Construction and Maintenance Occupations by Sex
| Occupation | Male | Female |
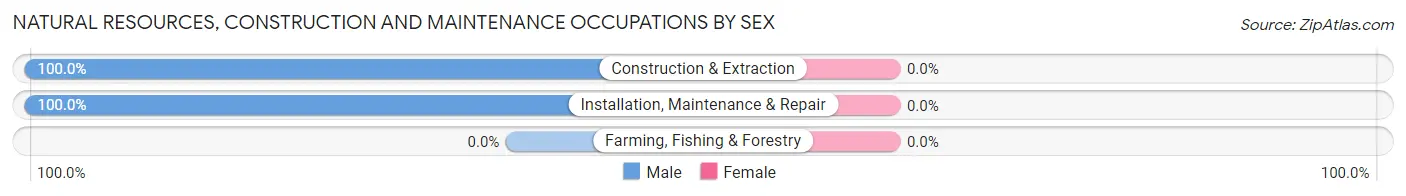
| Farming, Fishing & Forestry | 0 (0.0%) | 0 (0.0%) |
| Construction & Extraction | 73 (100.0%) | 0 (0.0%) |
| Installation, Maintenance & Repair | 43 (100.0%) | 0 (0.0%) |
| Total (Category) | 116 (100.0%) | 0 (0.0%) |
| Total (Overall) | 712 (48.7%) | 749 (51.3%) |
Production, Transportation and Moving Occupations
The most common Production, Transportation and Moving occupations in Galena are Production (100 | 6.8%), Material Moving (91 | 6.2%), and Transportation (12 | 0.8%).
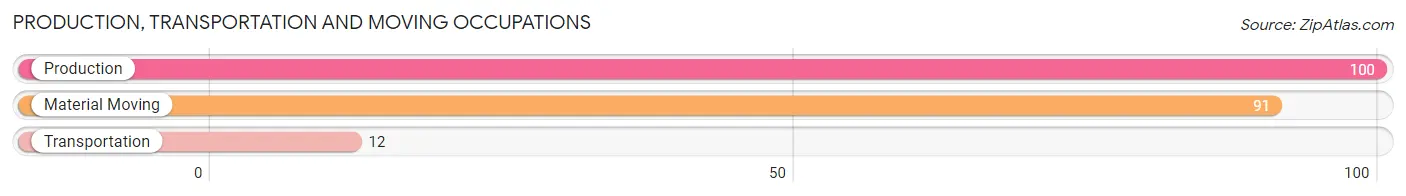
Production, Transportation and Moving Occupations by Sex
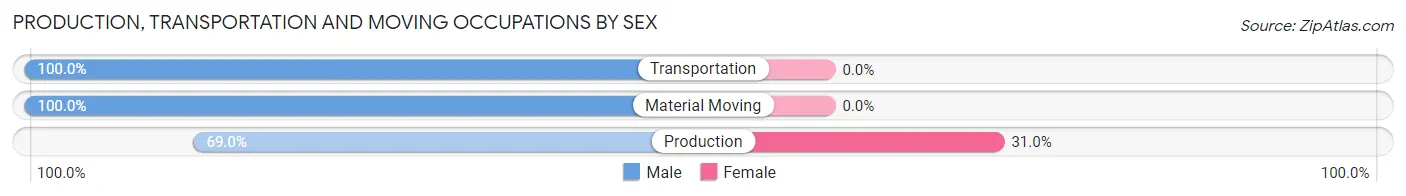
| Occupation | Male | Female |
| Production | 69 (69.0%) | 31 (31.0%) |
| Transportation | 12 (100.0%) | 0 (0.0%) |
| Material Moving | 91 (100.0%) | 0 (0.0%) |
| Total (Category) | 172 (84.7%) | 31 (15.3%) |
| Total (Overall) | 712 (48.7%) | 749 (51.3%) |
Employment Industries by Sex in Galena
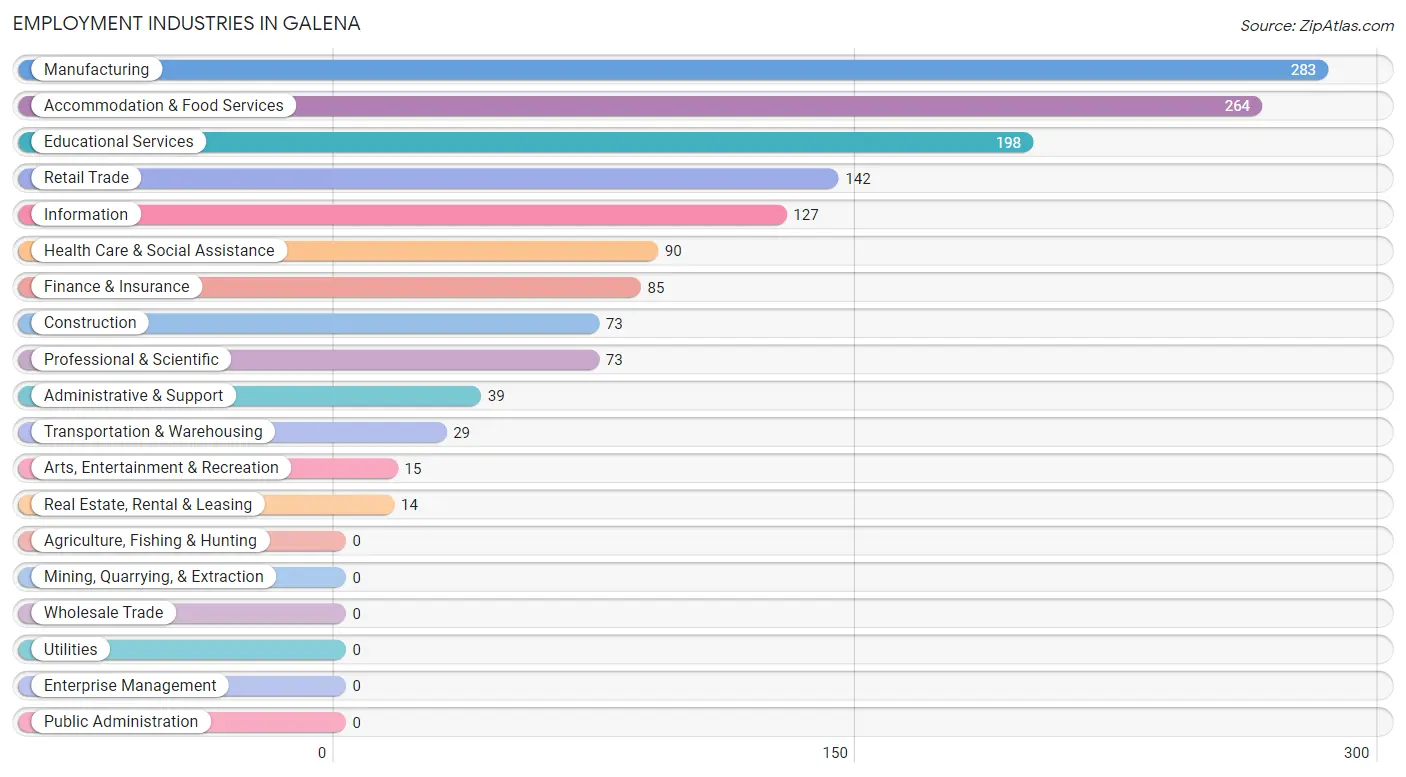
Employment Industries in Galena
The major employment industries in Galena include Manufacturing (283 | 19.4%), Accommodation & Food Services (264 | 18.1%), Educational Services (198 | 13.6%), Retail Trade (142 | 9.7%), and Information (127 | 8.7%).
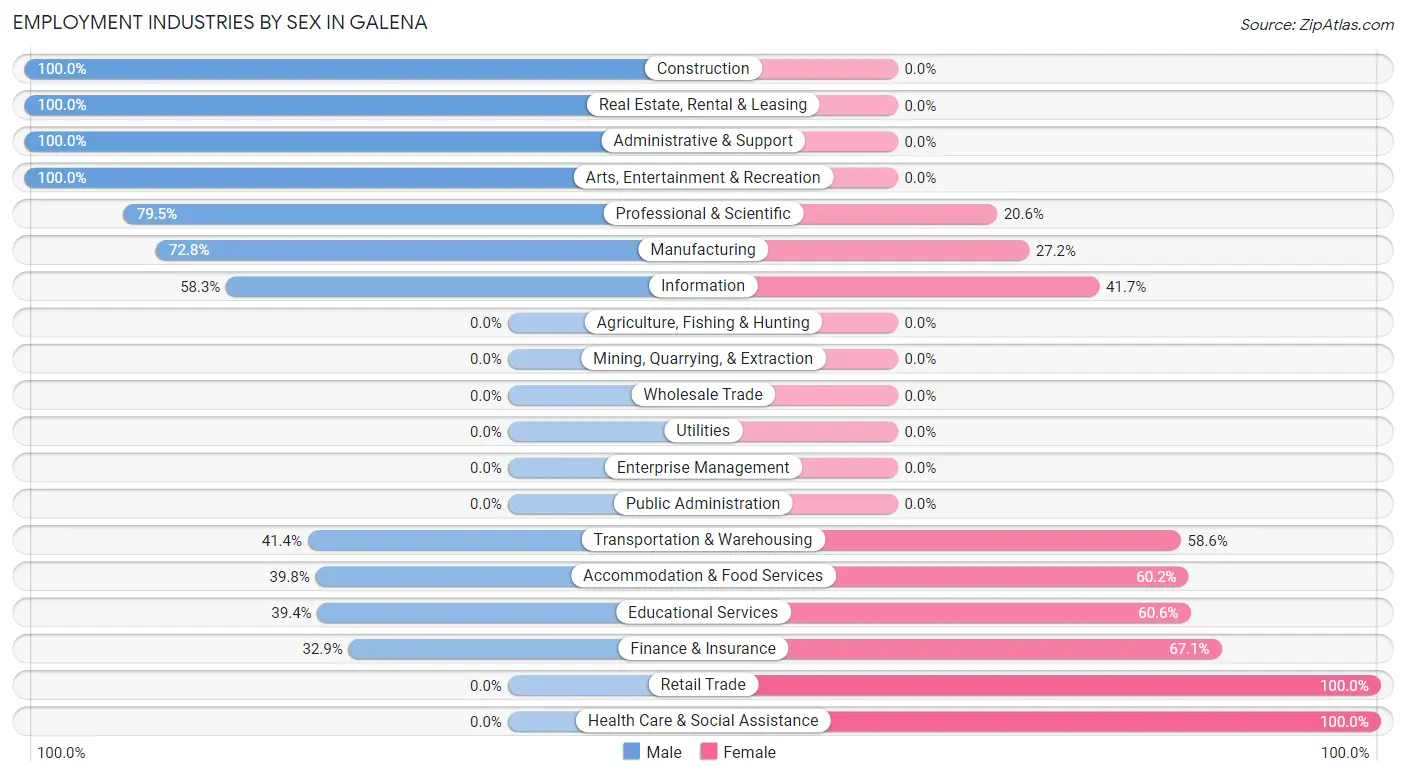
Employment Industries by Sex in Galena
The Galena industries that see more men than women are Construction (100.0%), Real Estate, Rental & Leasing (100.0%), and Administrative & Support (100.0%), whereas the industries that tend to have a higher number of women are Retail Trade (100.0%), Health Care & Social Assistance (100.0%), and Finance & Insurance (67.1%).
| Industry | Male | Female |
| Agriculture, Fishing & Hunting | 0 (0.0%) | 0 (0.0%) |
| Mining, Quarrying, & Extraction | 0 (0.0%) | 0 (0.0%) |
| Construction | 73 (100.0%) | 0 (0.0%) |
| Manufacturing | 206 (72.8%) | 77 (27.2%) |
| Wholesale Trade | 0 (0.0%) | 0 (0.0%) |
| Retail Trade | 0 (0.0%) | 142 (100.0%) |
| Transportation & Warehousing | 12 (41.4%) | 17 (58.6%) |
| Utilities | 0 (0.0%) | 0 (0.0%) |
| Information | 74 (58.3%) | 53 (41.7%) |
| Finance & Insurance | 28 (32.9%) | 57 (67.1%) |
| Real Estate, Rental & Leasing | 14 (100.0%) | 0 (0.0%) |
| Professional & Scientific | 58 (79.4%) | 15 (20.5%) |
| Enterprise Management | 0 (0.0%) | 0 (0.0%) |
| Administrative & Support | 39 (100.0%) | 0 (0.0%) |
| Educational Services | 78 (39.4%) | 120 (60.6%) |
| Health Care & Social Assistance | 0 (0.0%) | 90 (100.0%) |
| Arts, Entertainment & Recreation | 15 (100.0%) | 0 (0.0%) |
| Accommodation & Food Services | 105 (39.8%) | 159 (60.2%) |
| Public Administration | 0 (0.0%) | 0 (0.0%) |
| Total | 712 (48.7%) | 749 (51.3%) |
Education in Galena
School Enrollment in Galena
The most common levels of schooling among the 307 students in Galena are middle school (87 | 28.3%), elementary school (80 | 26.1%), and college / undergraduate (51 | 16.6%).
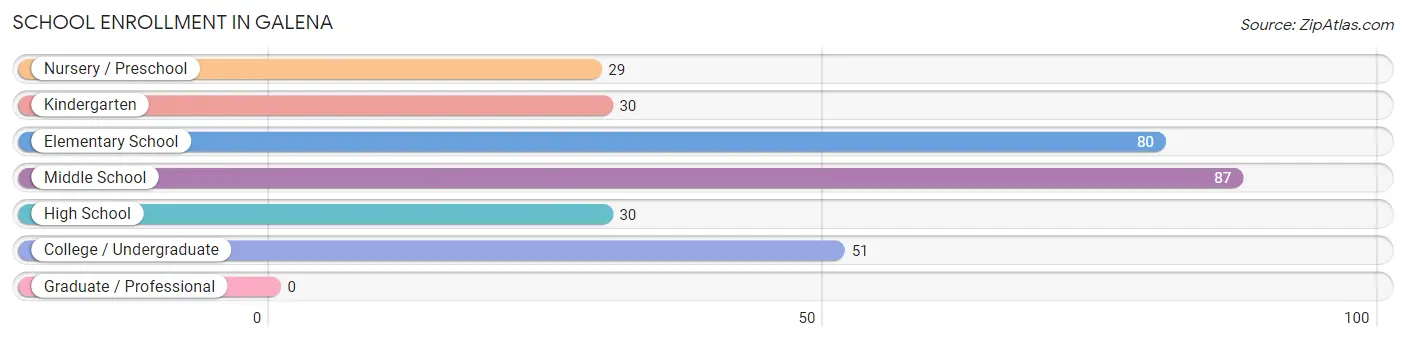
| School Level | # Students | % Students |
| Nursery / Preschool | 29 | 9.5% |
| Kindergarten | 30 | 9.8% |
| Elementary School | 80 | 26.1% |
| Middle School | 87 | 28.3% |
| High School | 30 | 9.8% |
| College / Undergraduate | 51 | 16.6% |
| Graduate / Professional | 0 | 0.0% |
| Total | 307 | 100.0% |
School Enrollment by Age by Funding Source in Galena
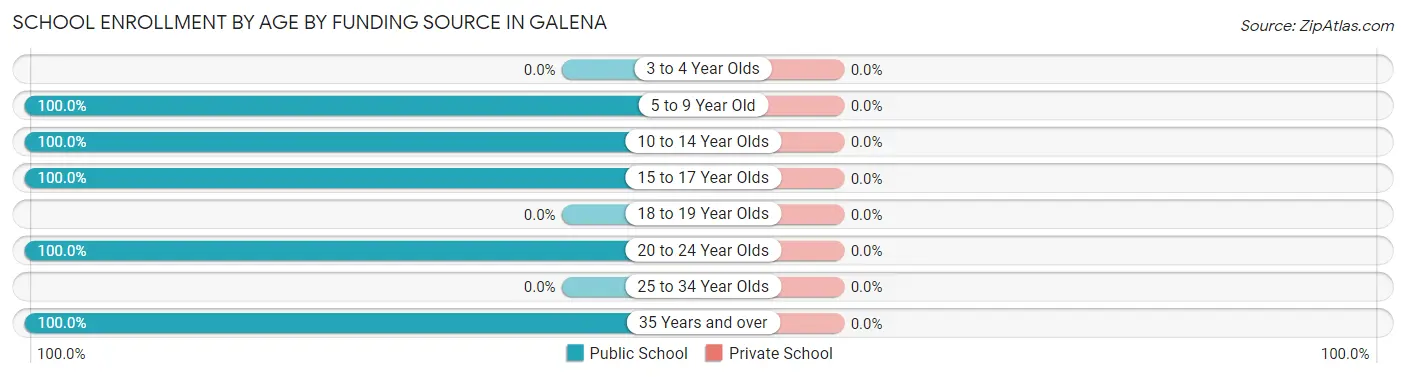
| Age Bracket | Public School | Private School |
| 3 to 4 Year Olds | 0 (0.0%) | 0 (0.0%) |
| 5 to 9 Year Old | 139 (100.0%) | 0 (0.0%) |
| 10 to 14 Year Olds | 87 (100.0%) | 0 (0.0%) |
| 15 to 17 Year Olds | 2 (100.0%) | 0 (0.0%) |
| 18 to 19 Year Olds | 0 (0.0%) | 0 (0.0%) |
| 20 to 24 Year Olds | 28 (100.0%) | 0 (0.0%) |
| 25 to 34 Year Olds | 0 (0.0%) | 0 (0.0%) |
| 35 Years and over | 51 (100.0%) | 0 (0.0%) |
| Total | 307 (100.0%) | 0 (0.0%) |
Educational Attainment by Field of Study in Galena
Education (156 | 14.7%), business (133 | 12.5%), communications (113 | 10.6%), literature & languages (109 | 10.2%), and psychology (87 | 8.2%) are the most common fields of study among 1,064 individuals in Galena who have obtained a bachelor's degree or higher.
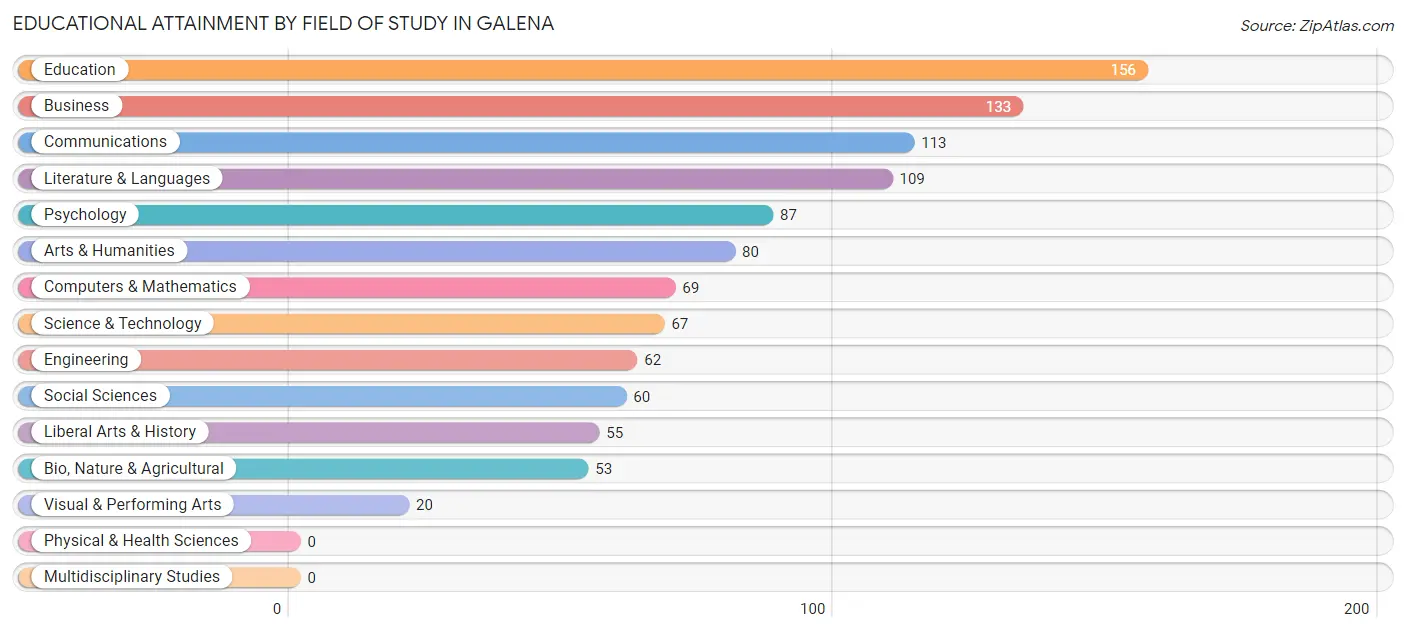
| Field of Study | # Graduates | % Graduates |
| Computers & Mathematics | 69 | 6.5% |
| Bio, Nature & Agricultural | 53 | 5.0% |
| Physical & Health Sciences | 0 | 0.0% |
| Psychology | 87 | 8.2% |
| Social Sciences | 60 | 5.6% |
| Engineering | 62 | 5.8% |
| Multidisciplinary Studies | 0 | 0.0% |
| Science & Technology | 67 | 6.3% |
| Business | 133 | 12.5% |
| Education | 156 | 14.7% |
| Literature & Languages | 109 | 10.2% |
| Liberal Arts & History | 55 | 5.2% |
| Visual & Performing Arts | 20 | 1.9% |
| Communications | 113 | 10.6% |
| Arts & Humanities | 80 | 7.5% |
| Total | 1,064 | 100.0% |
Transportation & Commute in Galena
Vehicle Availability by Sex in Galena
The most prevalent vehicle ownership categories in Galena are males with 2 vehicles (378, accounting for 53.2%) and females with 2 vehicles (319, making up 50.5%).
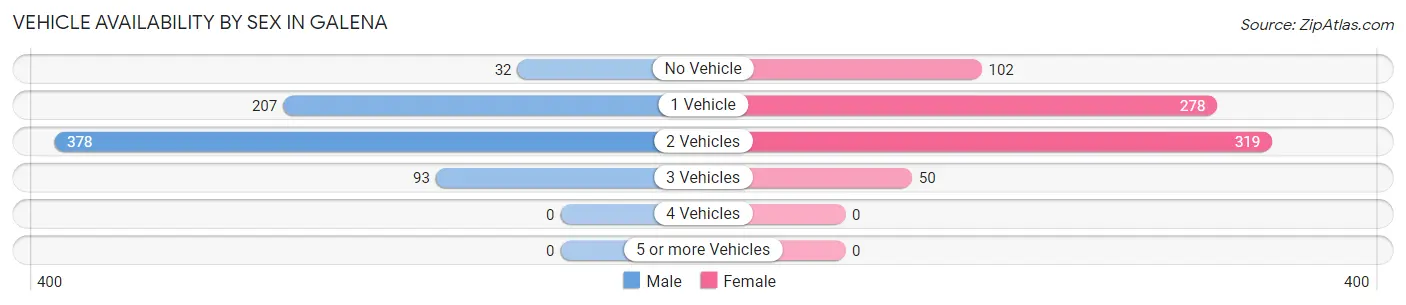
| Vehicles Available | Male | Female |
| No Vehicle | 32 (4.5%) | 102 (13.6%) |
| 1 Vehicle | 207 (29.1%) | 278 (37.1%) |
| 2 Vehicles | 378 (53.2%) | 319 (42.6%) |
| 3 Vehicles | 93 (13.1%) | 50 (6.7%) |
| 4 Vehicles | 0 (0.0%) | 0 (0.0%) |
| 5 or more Vehicles | 0 (0.0%) | 0 (0.0%) |
| Total | 710 (100.0%) | 749 (100.0%) |
Commute Time in Galena
The most frequently occuring commute durations in Galena are 5 to 9 minutes (371 commuters, 29.2%), 10 to 14 minutes (320 commuters, 25.2%), and less than 5 minutes (151 commuters, 11.9%).
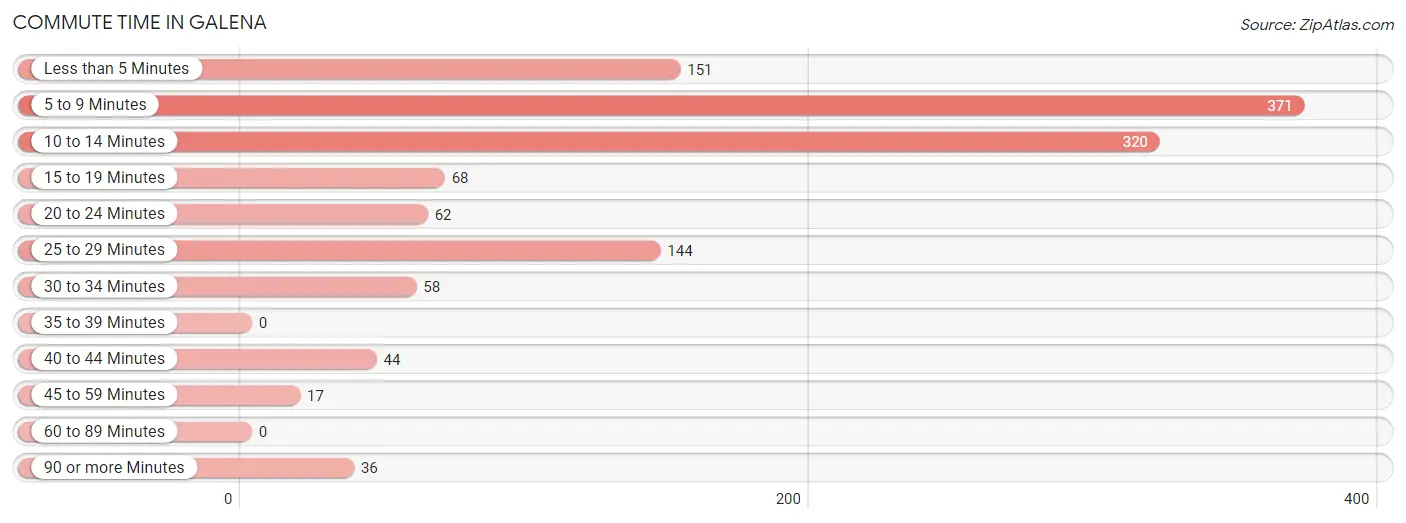
| Commute Time | # Commuters | % Commuters |
| Less than 5 Minutes | 151 | 11.9% |
| 5 to 9 Minutes | 371 | 29.2% |
| 10 to 14 Minutes | 320 | 25.2% |
| 15 to 19 Minutes | 68 | 5.3% |
| 20 to 24 Minutes | 62 | 4.9% |
| 25 to 29 Minutes | 144 | 11.3% |
| 30 to 34 Minutes | 58 | 4.6% |
| 35 to 39 Minutes | 0 | 0.0% |
| 40 to 44 Minutes | 44 | 3.5% |
| 45 to 59 Minutes | 17 | 1.3% |
| 60 to 89 Minutes | 0 | 0.0% |
| 90 or more Minutes | 36 | 2.8% |
Commute Time by Sex in Galena
The most common commute times in Galena are 5 to 9 minutes (223 commuters, 39.6%) for males and 10 to 14 minutes (218 commuters, 30.8%) for females.
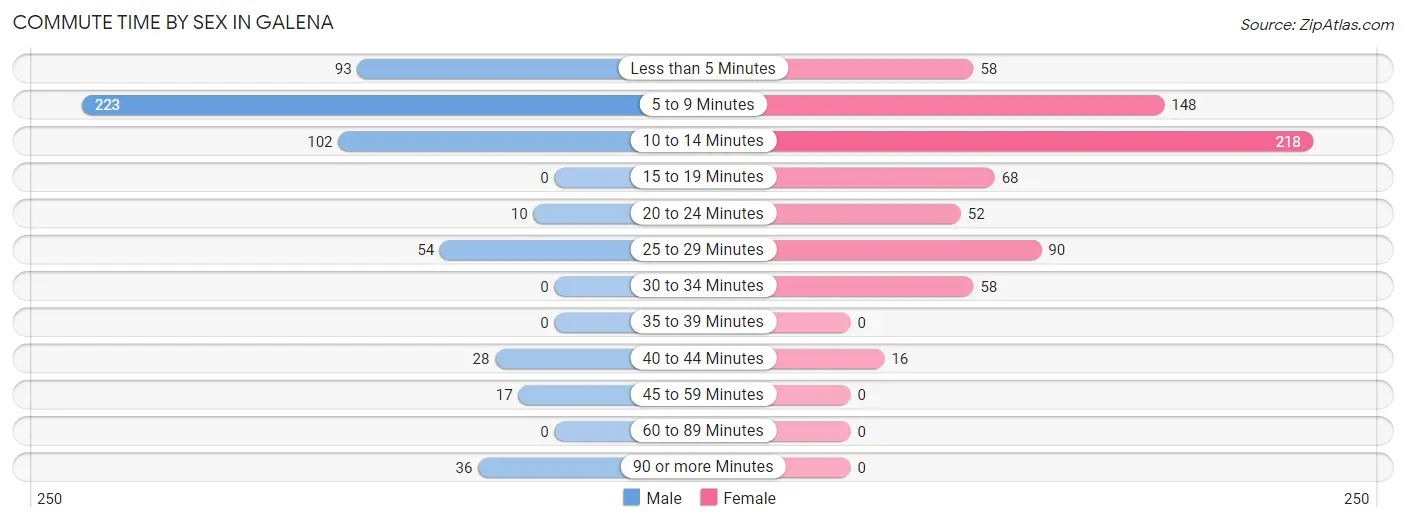
| Commute Time | Male | Female |
| Less than 5 Minutes | 93 (16.5%) | 58 (8.2%) |
| 5 to 9 Minutes | 223 (39.6%) | 148 (20.9%) |
| 10 to 14 Minutes | 102 (18.1%) | 218 (30.8%) |
| 15 to 19 Minutes | 0 (0.0%) | 68 (9.6%) |
| 20 to 24 Minutes | 10 (1.8%) | 52 (7.3%) |
| 25 to 29 Minutes | 54 (9.6%) | 90 (12.7%) |
| 30 to 34 Minutes | 0 (0.0%) | 58 (8.2%) |
| 35 to 39 Minutes | 0 (0.0%) | 0 (0.0%) |
| 40 to 44 Minutes | 28 (5.0%) | 16 (2.3%) |
| 45 to 59 Minutes | 17 (3.0%) | 0 (0.0%) |
| 60 to 89 Minutes | 0 (0.0%) | 0 (0.0%) |
| 90 or more Minutes | 36 (6.4%) | 0 (0.0%) |
Time of Departure to Work by Sex in Galena
The most frequent times of departure to work in Galena are 6:00 AM to 6:29 AM (91, 16.2%) for males and 4:00 PM to 11:59 PM (116, 16.4%) for females.
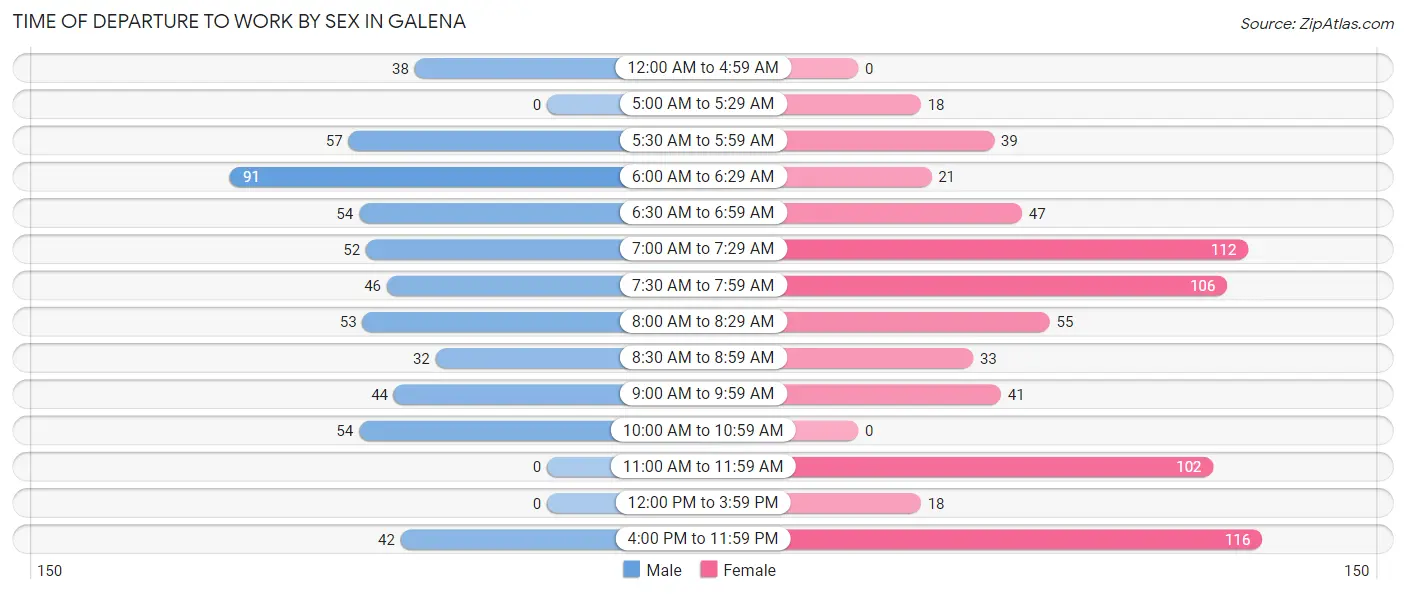
| Time of Departure | Male | Female |
| 12:00 AM to 4:59 AM | 38 (6.8%) | 0 (0.0%) |
| 5:00 AM to 5:29 AM | 0 (0.0%) | 18 (2.5%) |
| 5:30 AM to 5:59 AM | 57 (10.1%) | 39 (5.5%) |
| 6:00 AM to 6:29 AM | 91 (16.2%) | 21 (3.0%) |
| 6:30 AM to 6:59 AM | 54 (9.6%) | 47 (6.6%) |
| 7:00 AM to 7:29 AM | 52 (9.2%) | 112 (15.8%) |
| 7:30 AM to 7:59 AM | 46 (8.2%) | 106 (15.0%) |
| 8:00 AM to 8:29 AM | 53 (9.4%) | 55 (7.8%) |
| 8:30 AM to 8:59 AM | 32 (5.7%) | 33 (4.7%) |
| 9:00 AM to 9:59 AM | 44 (7.8%) | 41 (5.8%) |
| 10:00 AM to 10:59 AM | 54 (9.6%) | 0 (0.0%) |
| 11:00 AM to 11:59 AM | 0 (0.0%) | 102 (14.4%) |
| 12:00 PM to 3:59 PM | 0 (0.0%) | 18 (2.5%) |
| 4:00 PM to 11:59 PM | 42 (7.5%) | 116 (16.4%) |
| Total | 563 (100.0%) | 708 (100.0%) |
Housing Occupancy in Galena
Occupancy by Ownership in Galena
Of the total 1,661 dwellings in Galena, owner-occupied units account for 1,043 (62.8%), while renter-occupied units make up 618 (37.2%).
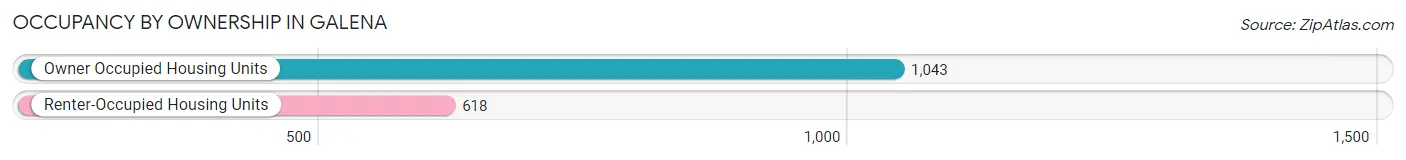
| Occupancy | # Housing Units | % Housing Units |
| Owner Occupied Housing Units | 1,043 | 62.8% |
| Renter-Occupied Housing Units | 618 | 37.2% |
| Total Occupied Housing Units | 1,661 | 100.0% |
Occupancy by Household Size in Galena
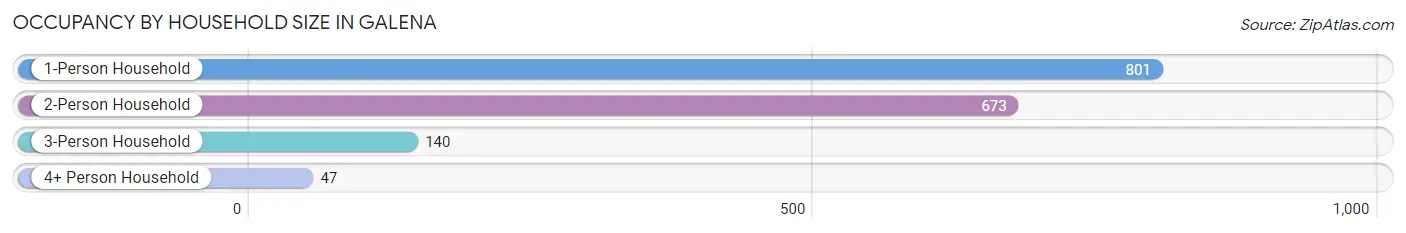
| Household Size | # Housing Units | % Housing Units |
| 1-Person Household | 801 | 48.2% |
| 2-Person Household | 673 | 40.5% |
| 3-Person Household | 140 | 8.4% |
| 4+ Person Household | 47 | 2.8% |
| Total Housing Units | 1,661 | 100.0% |
Occupancy by Ownership by Household Size in Galena
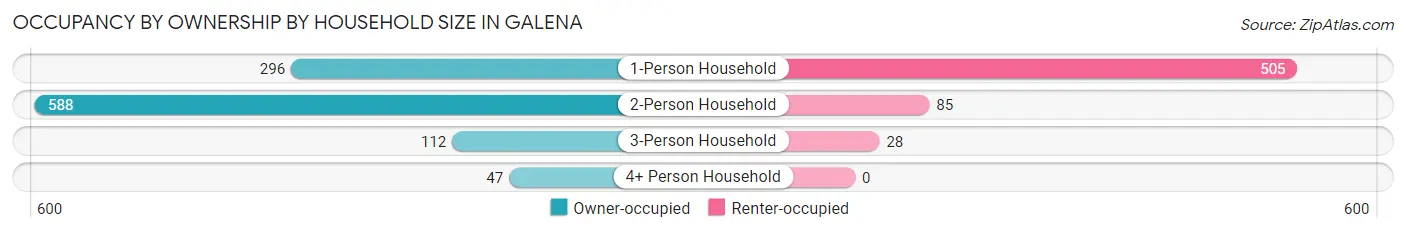
| Household Size | Owner-occupied | Renter-occupied |
| 1-Person Household | 296 (36.9%) | 505 (63.0%) |
| 2-Person Household | 588 (87.4%) | 85 (12.6%) |
| 3-Person Household | 112 (80.0%) | 28 (20.0%) |
| 4+ Person Household | 47 (100.0%) | 0 (0.0%) |
| Total Housing Units | 1,043 (62.8%) | 618 (37.2%) |
Occupancy by Educational Attainment in Galena
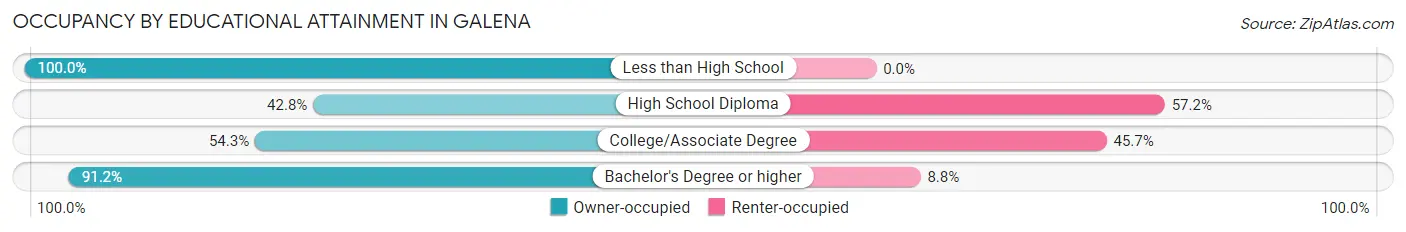
| Household Size | Owner-occupied | Renter-occupied |
| Less than High School | 29 (100.0%) | 0 (0.0%) |
| High School Diploma | 276 (42.8%) | 369 (57.2%) |
| College/Associate Degree | 239 (54.3%) | 201 (45.7%) |
| Bachelor's Degree or higher | 499 (91.2%) | 48 (8.8%) |
Occupancy by Age of Householder in Galena
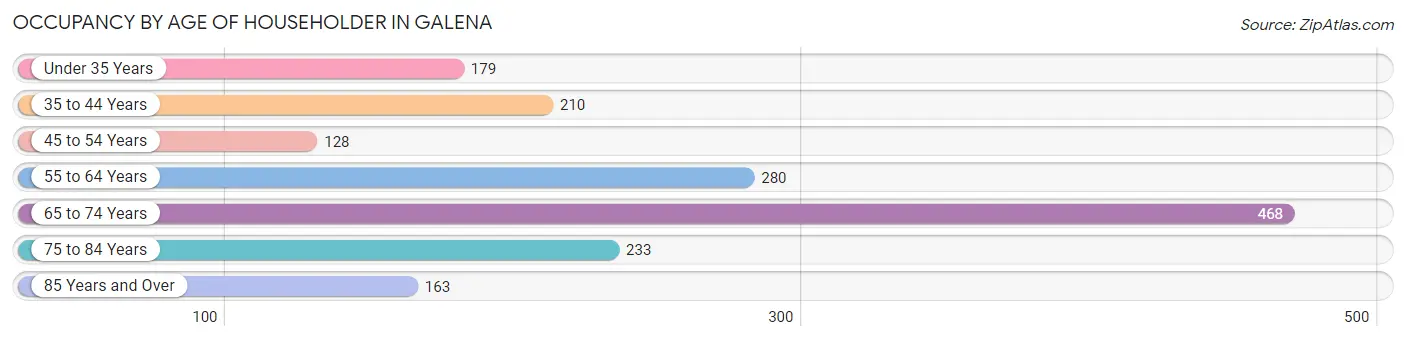
| Age Bracket | # Households | % Households |
| Under 35 Years | 179 | 10.8% |
| 35 to 44 Years | 210 | 12.6% |
| 45 to 54 Years | 128 | 7.7% |
| 55 to 64 Years | 280 | 16.9% |
| 65 to 74 Years | 468 | 28.2% |
| 75 to 84 Years | 233 | 14.0% |
| 85 Years and Over | 163 | 9.8% |
| Total | 1,661 | 100.0% |
Housing Finances in Galena
Median Income by Occupancy in Galena
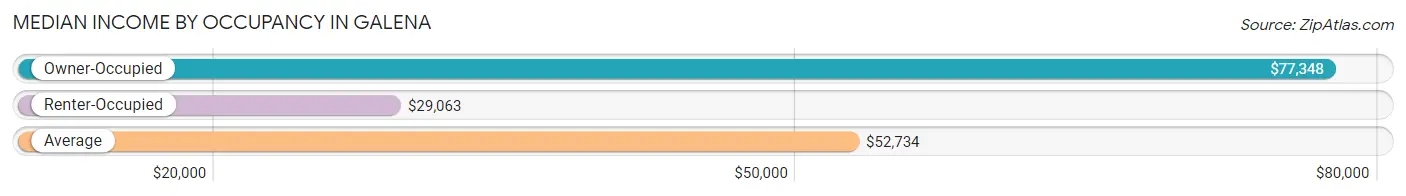
| Occupancy Type | # Households | Median Income |
| Owner-Occupied | 1,043 (62.8%) | $77,348 |
| Renter-Occupied | 618 (37.2%) | $29,063 |
| Average | 1,661 (100.0%) | $52,734 |
Occupancy by Householder Income Bracket in Galena
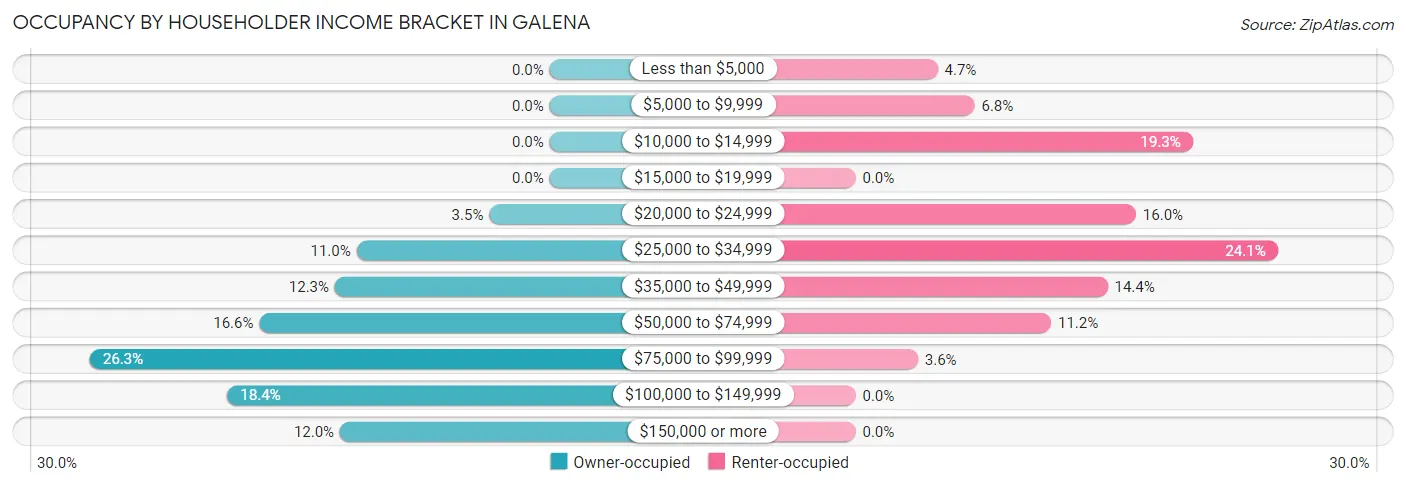
| Income Bracket | Owner-occupied | Renter-occupied |
| Less than $5,000 | 0 (0.0%) | 29 (4.7%) |
| $5,000 to $9,999 | 0 (0.0%) | 42 (6.8%) |
| $10,000 to $14,999 | 0 (0.0%) | 119 (19.3%) |
| $15,000 to $19,999 | 0 (0.0%) | 0 (0.0%) |
| $20,000 to $24,999 | 36 (3.5%) | 99 (16.0%) |
| $25,000 to $34,999 | 115 (11.0%) | 149 (24.1%) |
| $35,000 to $49,999 | 128 (12.3%) | 89 (14.4%) |
| $50,000 to $74,999 | 173 (16.6%) | 69 (11.2%) |
| $75,000 to $99,999 | 274 (26.3%) | 22 (3.6%) |
| $100,000 to $149,999 | 192 (18.4%) | 0 (0.0%) |
| $150,000 or more | 125 (12.0%) | 0 (0.0%) |
| Total | 1,043 (100.0%) | 618 (100.0%) |
Monthly Housing Cost Tiers in Galena
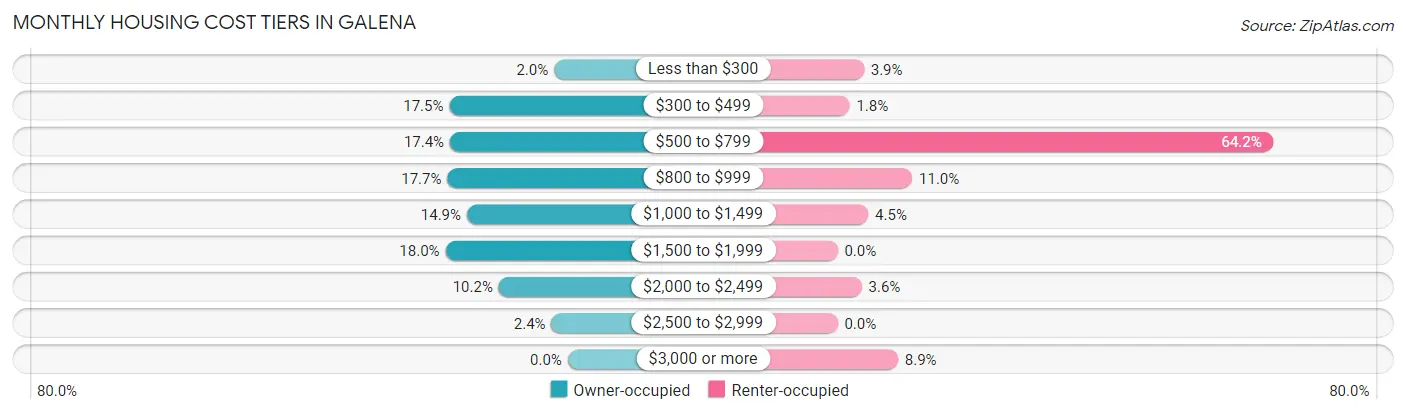
| Monthly Cost | Owner-occupied | Renter-occupied |
| Less than $300 | 21 (2.0%) | 24 (3.9%) |
| $300 to $499 | 182 (17.4%) | 11 (1.8%) |
| $500 to $799 | 181 (17.3%) | 397 (64.2%) |
| $800 to $999 | 185 (17.7%) | 68 (11.0%) |
| $1,000 to $1,499 | 155 (14.9%) | 28 (4.5%) |
| $1,500 to $1,999 | 188 (18.0%) | 0 (0.0%) |
| $2,000 to $2,499 | 106 (10.2%) | 22 (3.6%) |
| $2,500 to $2,999 | 25 (2.4%) | 0 (0.0%) |
| $3,000 or more | 0 (0.0%) | 55 (8.9%) |
| Total | 1,043 (100.0%) | 618 (100.0%) |
Physical Housing Characteristics in Galena
Housing Structures in Galena
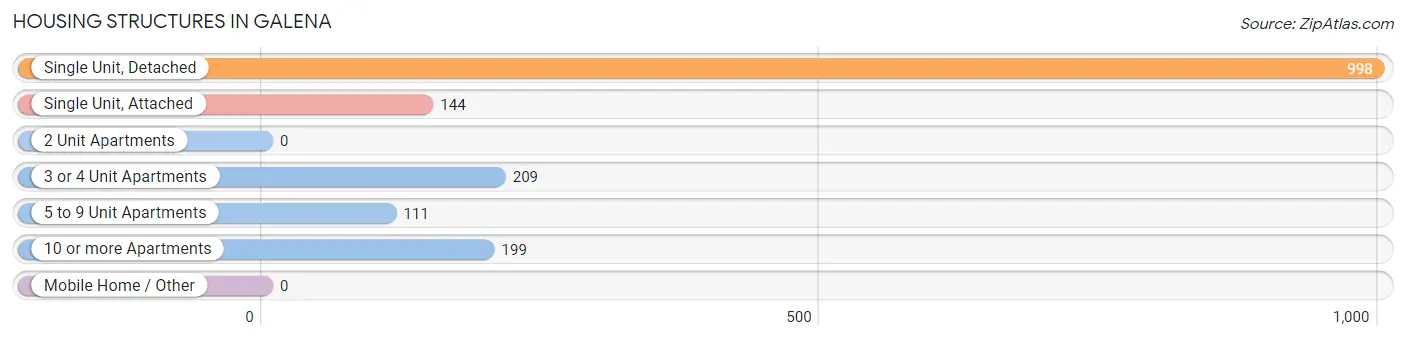
| Structure Type | # Housing Units | % Housing Units |
| Single Unit, Detached | 998 | 60.1% |
| Single Unit, Attached | 144 | 8.7% |
| 2 Unit Apartments | 0 | 0.0% |
| 3 or 4 Unit Apartments | 209 | 12.6% |
| 5 to 9 Unit Apartments | 111 | 6.7% |
| 10 or more Apartments | 199 | 12.0% |
| Mobile Home / Other | 0 | 0.0% |
| Total | 1,661 | 100.0% |
Housing Structures by Occupancy in Galena
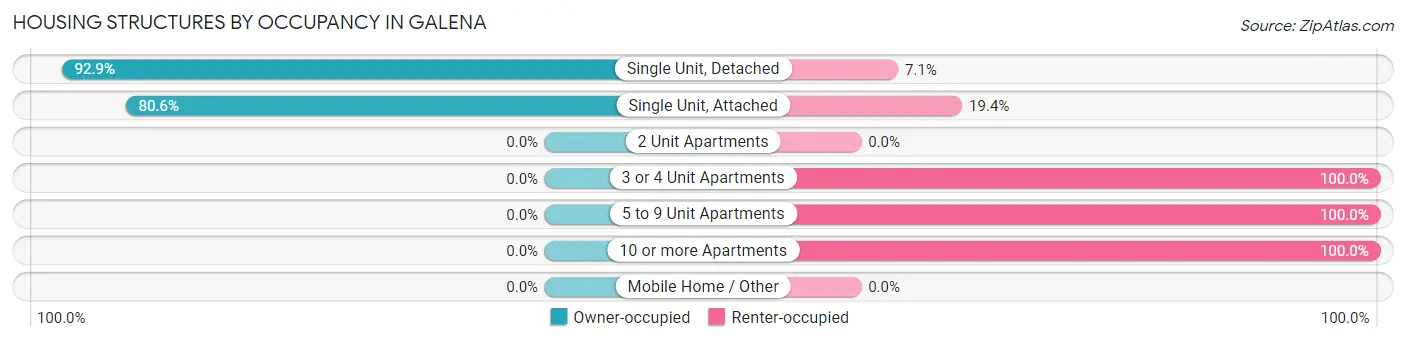
| Structure Type | Owner-occupied | Renter-occupied |
| Single Unit, Detached | 927 (92.9%) | 71 (7.1%) |
| Single Unit, Attached | 116 (80.6%) | 28 (19.4%) |
| 2 Unit Apartments | 0 (0.0%) | 0 (0.0%) |
| 3 or 4 Unit Apartments | 0 (0.0%) | 209 (100.0%) |
| 5 to 9 Unit Apartments | 0 (0.0%) | 111 (100.0%) |
| 10 or more Apartments | 0 (0.0%) | 199 (100.0%) |
| Mobile Home / Other | 0 (0.0%) | 0 (0.0%) |
| Total | 1,043 (62.8%) | 618 (37.2%) |
Housing Structures by Number of Rooms in Galena
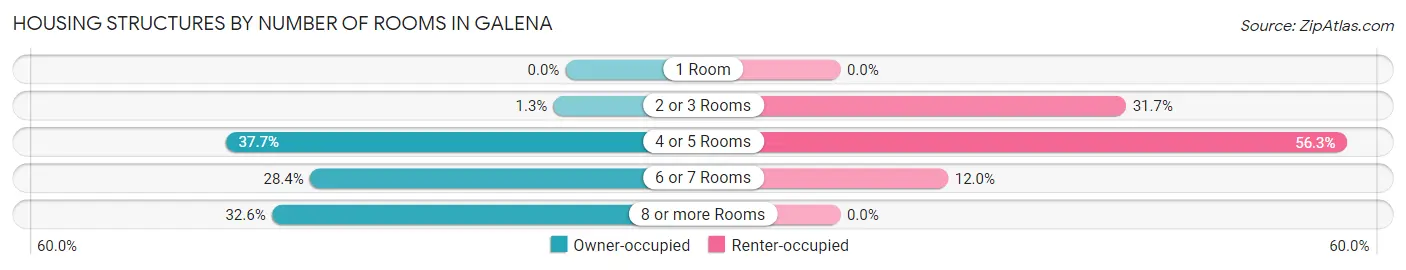
| Number of Rooms | Owner-occupied | Renter-occupied |
| 1 Room | 0 (0.0%) | 0 (0.0%) |
| 2 or 3 Rooms | 14 (1.3%) | 196 (31.7%) |
| 4 or 5 Rooms | 393 (37.7%) | 348 (56.3%) |
| 6 or 7 Rooms | 296 (28.4%) | 74 (12.0%) |
| 8 or more Rooms | 340 (32.6%) | 0 (0.0%) |
| Total | 1,043 (100.0%) | 618 (100.0%) |
Housing Structure by Heating Type in Galena
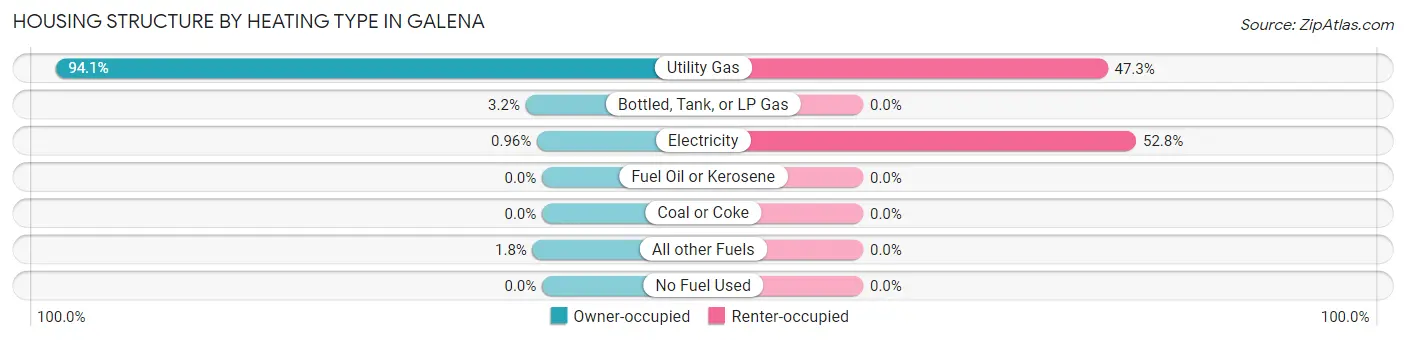
| Heating Type | Owner-occupied | Renter-occupied |
| Utility Gas | 981 (94.1%) | 292 (47.2%) |
| Bottled, Tank, or LP Gas | 33 (3.2%) | 0 (0.0%) |
| Electricity | 10 (1.0%) | 326 (52.7%) |
| Fuel Oil or Kerosene | 0 (0.0%) | 0 (0.0%) |
| Coal or Coke | 0 (0.0%) | 0 (0.0%) |
| All other Fuels | 19 (1.8%) | 0 (0.0%) |
| No Fuel Used | 0 (0.0%) | 0 (0.0%) |
| Total | 1,043 (100.0%) | 618 (100.0%) |
Household Vehicle Usage in Galena
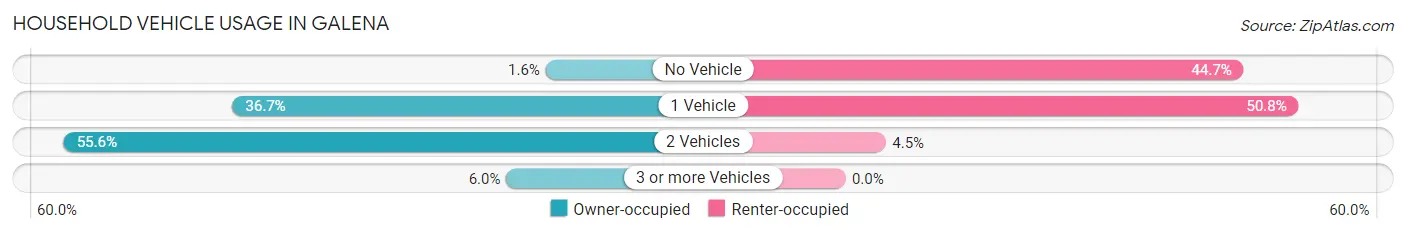
| Vehicles per Household | Owner-occupied | Renter-occupied |
| No Vehicle | 17 (1.6%) | 276 (44.7%) |
| 1 Vehicle | 383 (36.7%) | 314 (50.8%) |
| 2 Vehicles | 580 (55.6%) | 28 (4.5%) |
| 3 or more Vehicles | 63 (6.0%) | 0 (0.0%) |
| Total | 1,043 (100.0%) | 618 (100.0%) |
Real Estate & Mortgages in Galena
Real Estate and Mortgage Overview in Galena
| Characteristic | Without Mortgage | With Mortgage |
| Housing Units | 446 | 597 |
| Median Property Value | $182,900 | $172,300 |
| Median Household Income | $78,846 | $98 |
| Monthly Housing Costs | $613 | $0 |
| Real Estate Taxes | $4,086 | $17 |
Property Value by Mortgage Status in Galena
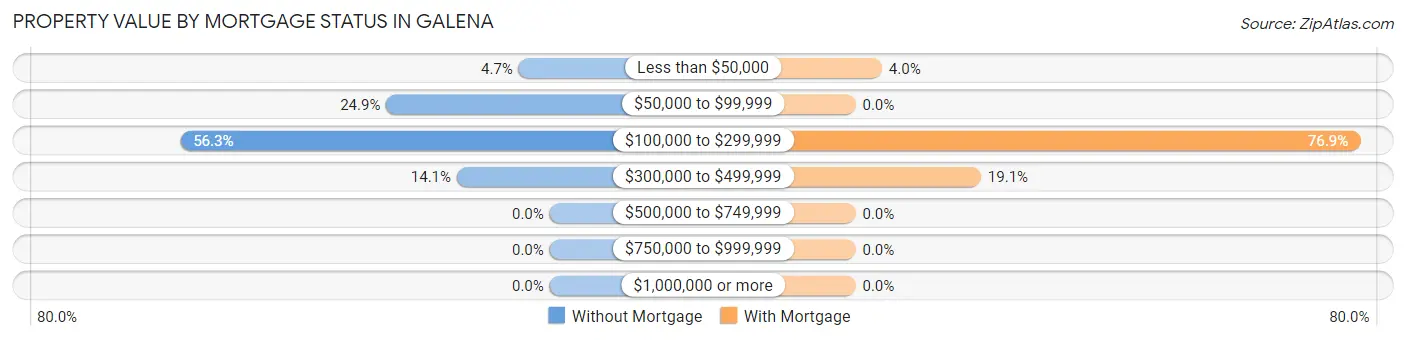
| Property Value | Without Mortgage | With Mortgage |
| Less than $50,000 | 21 (4.7%) | 24 (4.0%) |
| $50,000 to $99,999 | 111 (24.9%) | 0 (0.0%) |
| $100,000 to $299,999 | 251 (56.3%) | 459 (76.9%) |
| $300,000 to $499,999 | 63 (14.1%) | 114 (19.1%) |
| $500,000 to $749,999 | 0 (0.0%) | 0 (0.0%) |
| $750,000 to $999,999 | 0 (0.0%) | 0 (0.0%) |
| $1,000,000 or more | 0 (0.0%) | 0 (0.0%) |
| Total | 446 (100.0%) | 597 (100.0%) |
Household Income by Mortgage Status in Galena
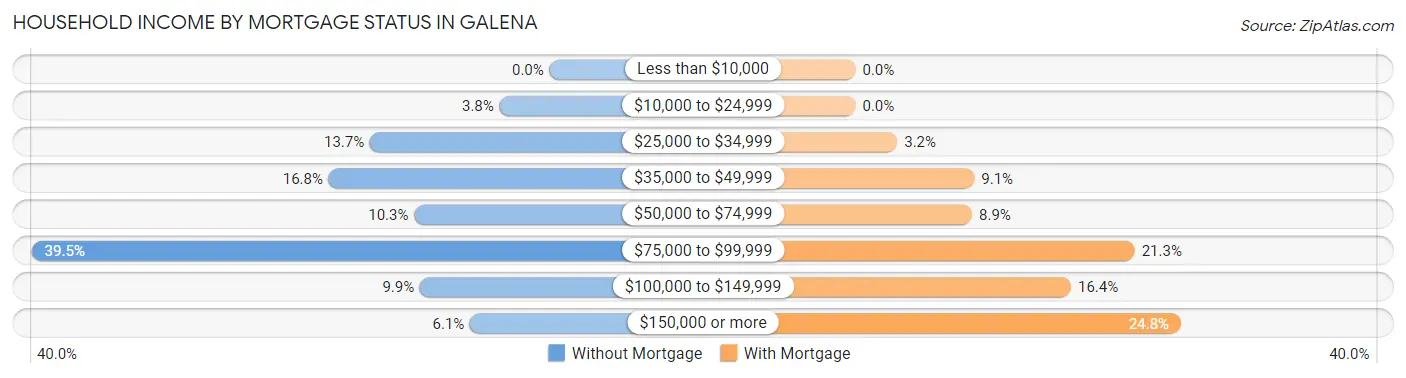
| Household Income | Without Mortgage | With Mortgage |
| Less than $10,000 | 0 (0.0%) | 0 (0.0%) |
| $10,000 to $24,999 | 17 (3.8%) | 0 (0.0%) |
| $25,000 to $34,999 | 61 (13.7%) | 19 (3.2%) |
| $35,000 to $49,999 | 75 (16.8%) | 54 (9.0%) |
| $50,000 to $74,999 | 46 (10.3%) | 53 (8.9%) |
| $75,000 to $99,999 | 176 (39.5%) | 127 (21.3%) |
| $100,000 to $149,999 | 44 (9.9%) | 98 (16.4%) |
| $150,000 or more | 27 (6.0%) | 148 (24.8%) |
| Total | 446 (100.0%) | 597 (100.0%) |
Property Value to Household Income Ratio in Galena
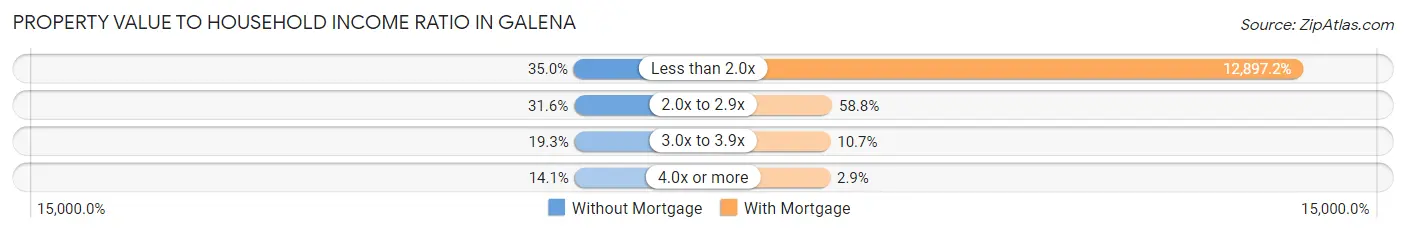
| Value-to-Income Ratio | Without Mortgage | With Mortgage |
| Less than 2.0x | 156 (35.0%) | 76,996 (12,897.1%) |
| 2.0x to 2.9x | 141 (31.6%) | 351 (58.8%) |
| 3.0x to 3.9x | 86 (19.3%) | 64 (10.7%) |
| 4.0x or more | 63 (14.1%) | 17 (2.9%) |
| Total | 446 (100.0%) | 597 (100.0%) |
Real Estate Taxes by Mortgage Status in Galena
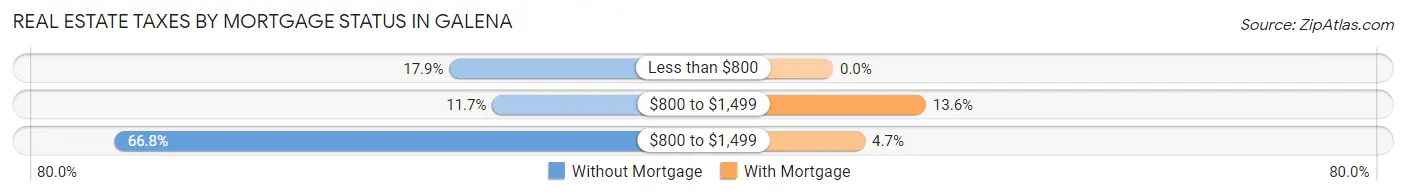
| Property Taxes | Without Mortgage | With Mortgage |
| Less than $800 | 80 (17.9%) | 0 (0.0%) |
| $800 to $1,499 | 52 (11.7%) | 81 (13.6%) |
| $800 to $1,499 | 298 (66.8%) | 28 (4.7%) |
| Total | 446 (100.0%) | 597 (100.0%) |
Health & Disability in Galena
Health Insurance Coverage by Age in Galena
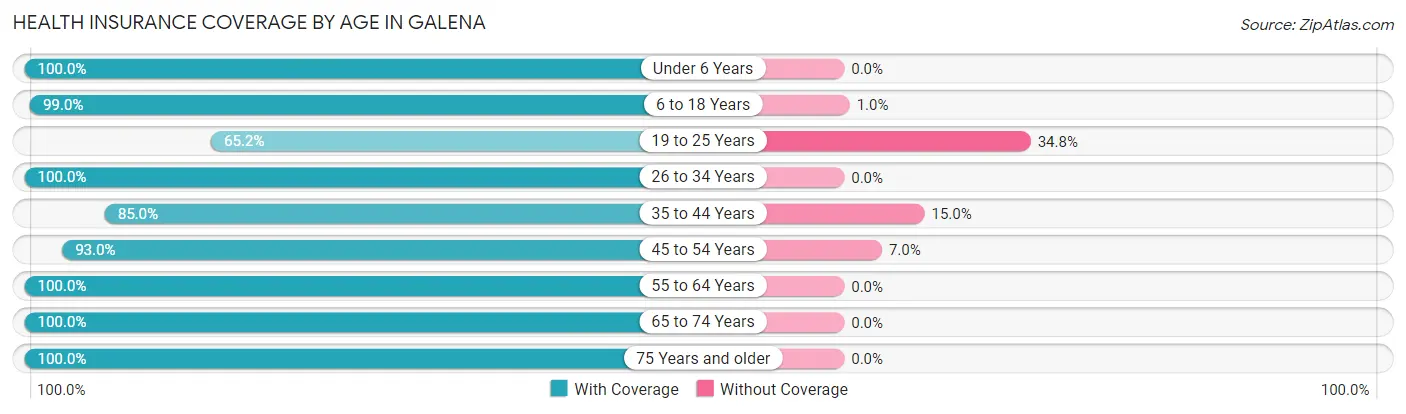
| Age Bracket | With Coverage | Without Coverage |
| Under 6 Years | 150 (100.0%) | 0 (0.0%) |
| 6 to 18 Years | 196 (99.0%) | 2 (1.0%) |
| 19 to 25 Years | 167 (65.2%) | 89 (34.8%) |
| 26 to 34 Years | 137 (100.0%) | 0 (0.0%) |
| 35 to 44 Years | 324 (85.0%) | 57 (15.0%) |
| 45 to 54 Years | 159 (93.0%) | 12 (7.0%) |
| 55 to 64 Years | 404 (100.0%) | 0 (0.0%) |
| 65 to 74 Years | 735 (100.0%) | 0 (0.0%) |
| 75 Years and older | 508 (100.0%) | 0 (0.0%) |
| Total | 2,780 (94.6%) | 160 (5.4%) |
Health Insurance Coverage by Citizenship Status in Galena
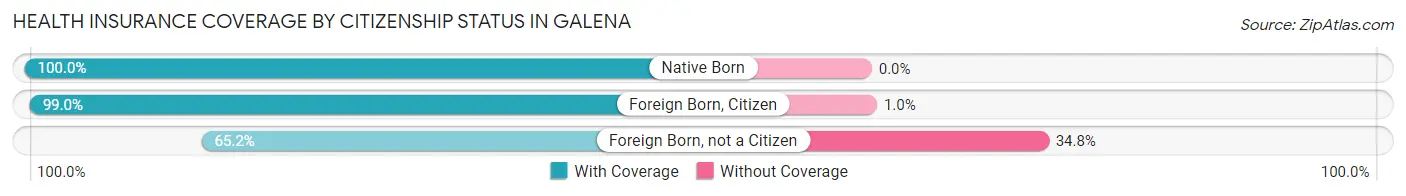
| Citizenship Status | With Coverage | Without Coverage |
| Native Born | 150 (100.0%) | 0 (0.0%) |
| Foreign Born, Citizen | 196 (99.0%) | 2 (1.0%) |
| Foreign Born, not a Citizen | 167 (65.2%) | 89 (34.8%) |
Health Insurance Coverage by Household Income in Galena
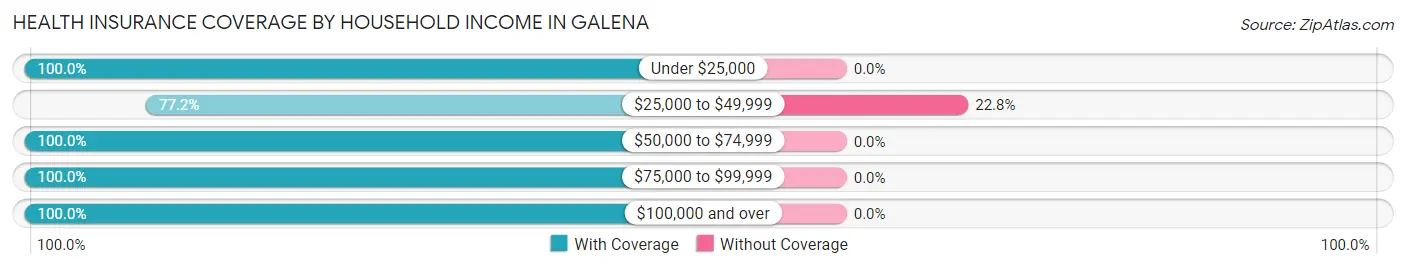
| Household Income | With Coverage | Without Coverage |
| Under $25,000 | 391 (100.0%) | 0 (0.0%) |
| $25,000 to $49,999 | 536 (77.2%) | 158 (22.8%) |
| $50,000 to $74,999 | 477 (100.0%) | 0 (0.0%) |
| $75,000 to $99,999 | 483 (100.0%) | 0 (0.0%) |
| $100,000 and over | 872 (100.0%) | 0 (0.0%) |
Public vs Private Health Insurance Coverage by Age in Galena
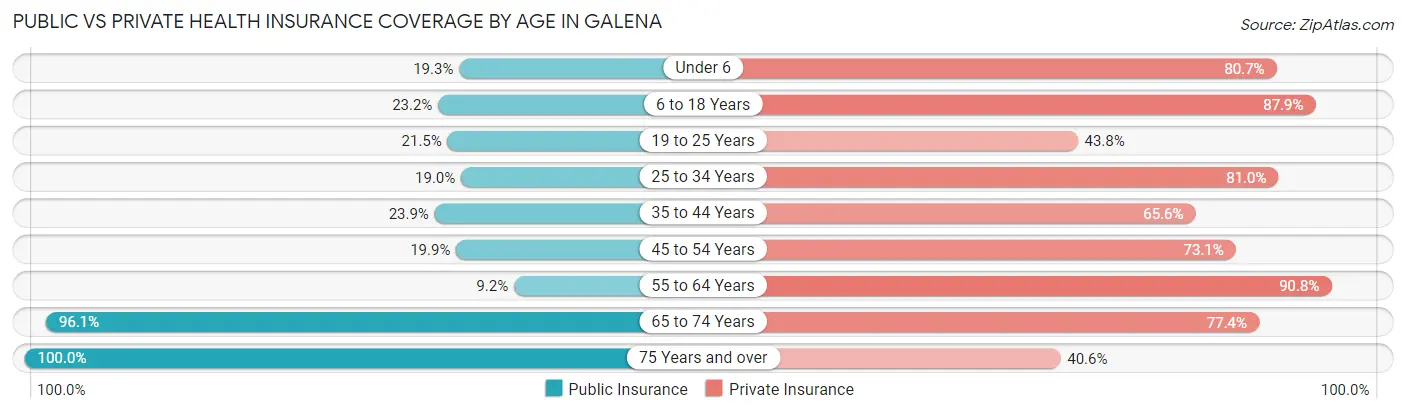
| Age Bracket | Public Insurance | Private Insurance |
| Under 6 | 29 (19.3%) | 121 (80.7%) |
| 6 to 18 Years | 46 (23.2%) | 174 (87.9%) |
| 19 to 25 Years | 55 (21.5%) | 112 (43.8%) |
| 25 to 34 Years | 26 (19.0%) | 111 (81.0%) |
| 35 to 44 Years | 91 (23.9%) | 250 (65.6%) |
| 45 to 54 Years | 34 (19.9%) | 125 (73.1%) |
| 55 to 64 Years | 37 (9.2%) | 367 (90.8%) |
| 65 to 74 Years | 706 (96.1%) | 569 (77.4%) |
| 75 Years and over | 508 (100.0%) | 206 (40.6%) |
| Total | 1,532 (52.1%) | 2,035 (69.2%) |
Disability Status by Sex by Age in Galena
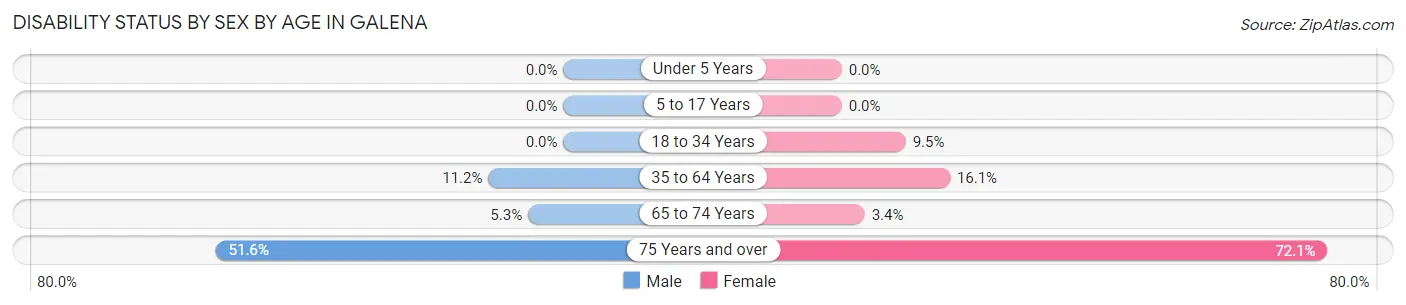
| Age Bracket | Male | Female |
| Under 5 Years | 0 (0.0%) | 0 (0.0%) |
| 5 to 17 Years | 0 (0.0%) | 0 (0.0%) |
| 18 to 34 Years | 0 (0.0%) | 28 (9.5%) |
| 35 to 64 Years | 58 (11.2%) | 70 (16.1%) |
| 65 to 74 Years | 17 (5.2%) | 14 (3.4%) |
| 75 Years and over | 79 (51.6%) | 256 (72.1%) |
Disability Class by Sex by Age in Galena
Disability Class: Hearing Difficulty
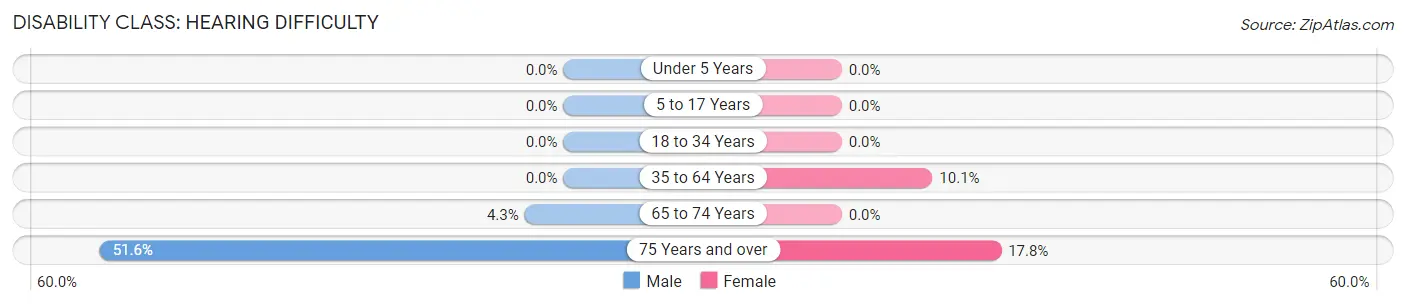
| Age Bracket | Male | Female |
| Under 5 Years | 0 (0.0%) | 0 (0.0%) |
| 5 to 17 Years | 0 (0.0%) | 0 (0.0%) |
| 18 to 34 Years | 0 (0.0%) | 0 (0.0%) |
| 35 to 64 Years | 0 (0.0%) | 44 (10.1%) |
| 65 to 74 Years | 14 (4.3%) | 0 (0.0%) |
| 75 Years and over | 79 (51.6%) | 63 (17.7%) |
Disability Class: Vision Difficulty
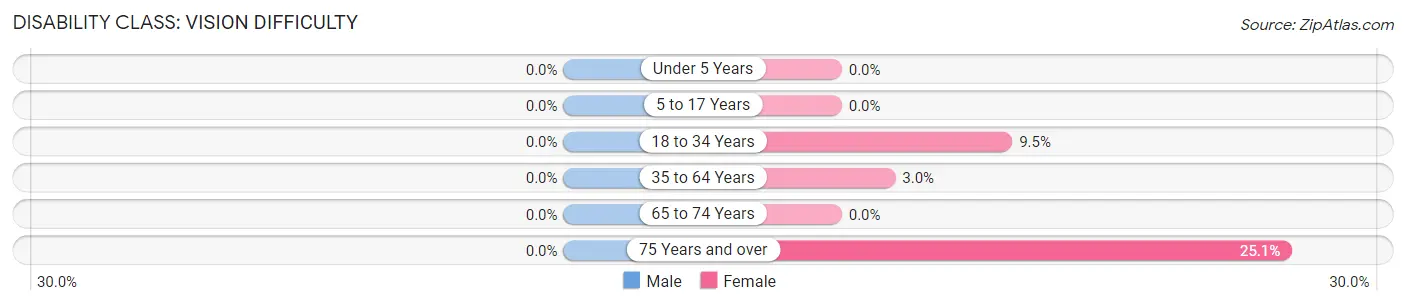
| Age Bracket | Male | Female |
| Under 5 Years | 0 (0.0%) | 0 (0.0%) |
| 5 to 17 Years | 0 (0.0%) | 0 (0.0%) |
| 18 to 34 Years | 0 (0.0%) | 28 (9.5%) |
| 35 to 64 Years | 0 (0.0%) | 13 (3.0%) |
| 65 to 74 Years | 0 (0.0%) | 0 (0.0%) |
| 75 Years and over | 0 (0.0%) | 89 (25.1%) |
Disability Class: Cognitive Difficulty
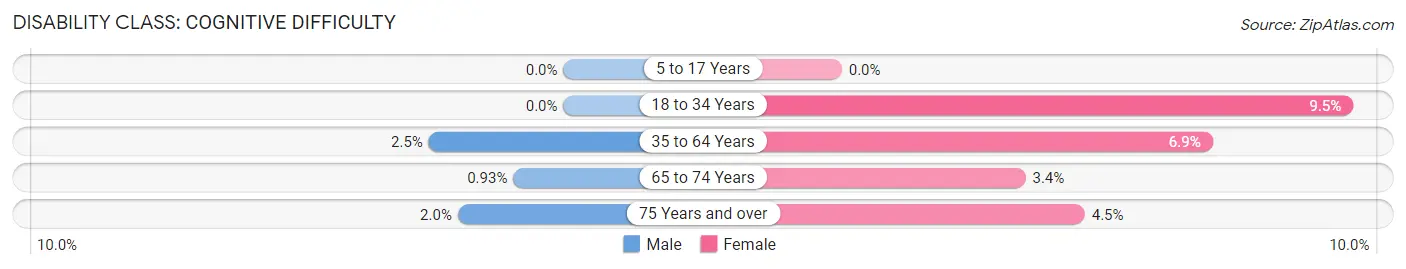
| Age Bracket | Male | Female |
| 5 to 17 Years | 0 (0.0%) | 0 (0.0%) |
| 18 to 34 Years | 0 (0.0%) | 28 (9.5%) |
| 35 to 64 Years | 13 (2.5%) | 30 (6.9%) |
| 65 to 74 Years | 3 (0.9%) | 14 (3.4%) |
| 75 Years and over | 3 (2.0%) | 16 (4.5%) |
Disability Class: Ambulatory Difficulty
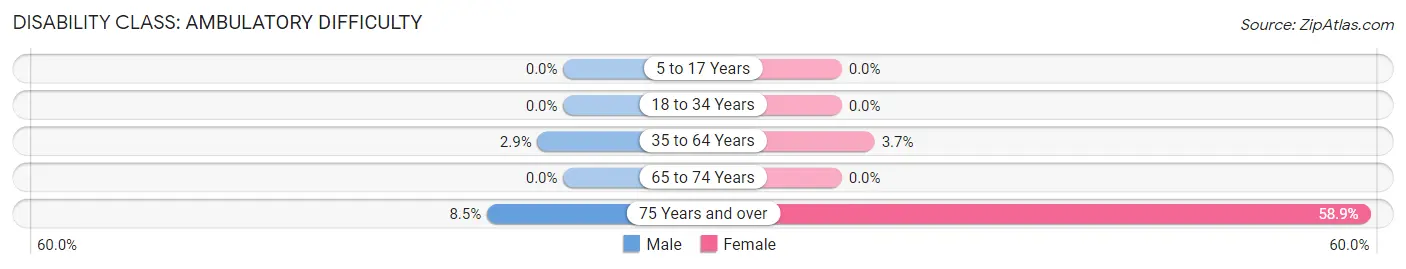
| Age Bracket | Male | Female |
| 5 to 17 Years | 0 (0.0%) | 0 (0.0%) |
| 18 to 34 Years | 0 (0.0%) | 0 (0.0%) |
| 35 to 64 Years | 15 (2.9%) | 16 (3.7%) |
| 65 to 74 Years | 0 (0.0%) | 0 (0.0%) |
| 75 Years and over | 13 (8.5%) | 209 (58.9%) |
Disability Class: Self-Care Difficulty
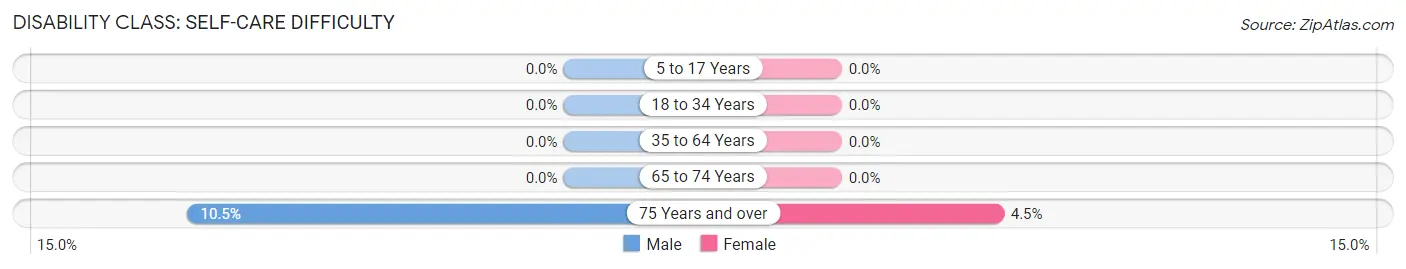
| Age Bracket | Male | Female |
| 5 to 17 Years | 0 (0.0%) | 0 (0.0%) |
| 18 to 34 Years | 0 (0.0%) | 0 (0.0%) |
| 35 to 64 Years | 0 (0.0%) | 0 (0.0%) |
| 65 to 74 Years | 0 (0.0%) | 0 (0.0%) |
| 75 Years and over | 16 (10.5%) | 16 (4.5%) |
Technology Access in Galena
Computing Device Access in Galena
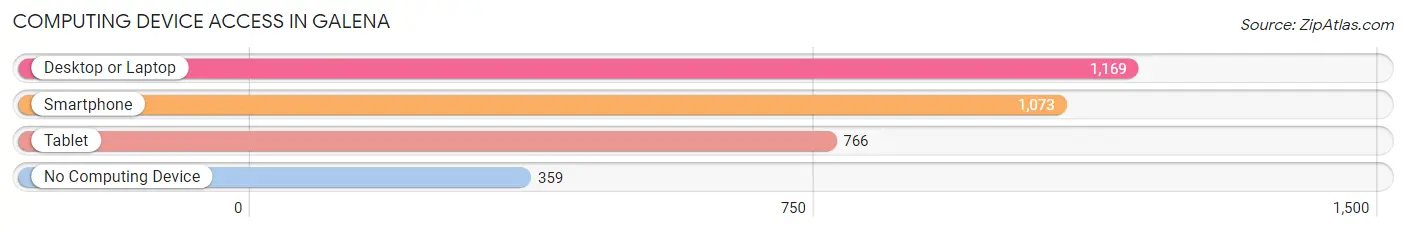
| Device Type | # Households | % Households |
| Desktop or Laptop | 1,169 | 70.4% |
| Smartphone | 1,073 | 64.6% |
| Tablet | 766 | 46.1% |
| No Computing Device | 359 | 21.6% |
| Total | 1,661 | 100.0% |
Internet Access in Galena
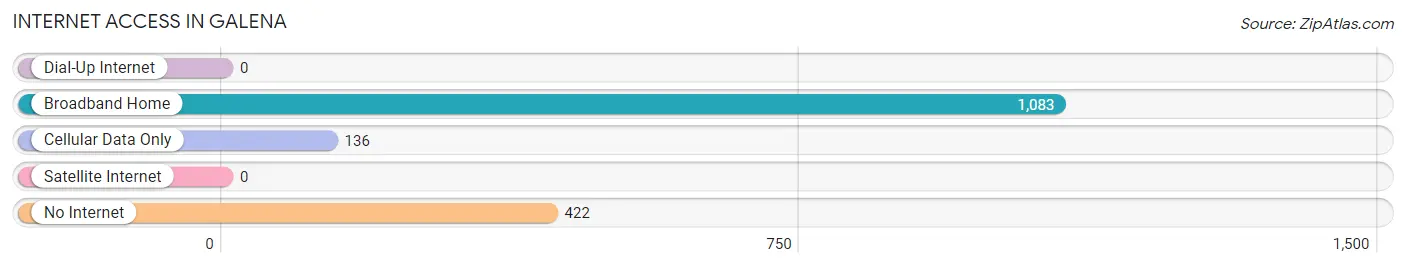
| Internet Type | # Households | % Households |
| Dial-Up Internet | 0 | 0.0% |
| Broadband Home | 1,083 | 65.2% |
| Cellular Data Only | 136 | 8.2% |
| Satellite Internet | 0 | 0.0% |
| No Internet | 422 | 25.4% |
| Total | 1,661 | 100.0% |
Galena Summary
Galena, Illinois is a city located in the northwest corner of the state, in Jo Daviess County. It is situated on the banks of the Galena River, and is the county seat. The city is known for its rich history, beautiful scenery, and vibrant economy.
History
Galena was first settled in 1826 by settlers from the East Coast. The city was named after the lead ore found in the area, which was mined and used to make ammunition during the Black Hawk War. The city quickly grew, and by 1827 it had become the county seat.
In 1845, Galena was incorporated as a city. During the Civil War, the city was a major supplier of lead and zinc for the Union Army. After the war, the city continued to grow and prosper, becoming a major center for trade and industry.
In the late 19th century, Galena was a popular tourist destination, and many of the city’s historic buildings were built during this time. The city was also home to several prominent figures, including Ulysses S. Grant, who lived in Galena for a time before the Civil War.
Geography
Galena is located in the northwest corner of Illinois, in Jo Daviess County. The city is situated on the banks of the Galena River, and is surrounded by rolling hills and bluffs. The city is located about 25 miles from the Mississippi River, and is about 90 miles from Chicago.
The city has a total area of 4.2 square miles, of which 4.1 square miles is land and 0.1 square miles is water. The city has a humid continental climate, with cold winters and hot, humid summers.
Economy
Galena’s economy is largely based on tourism, with many visitors coming to the city to explore its historic sites and enjoy its natural beauty. The city is also home to several manufacturing companies, including a lead smelter and a zinc smelter.
The city is also home to several wineries, breweries, and distilleries, as well as a variety of restaurants and shops. The city is also home to several festivals and events throughout the year, including the Galena Festival of the Arts and the Galena Garlic Festival.
Demographics
As of the 2010 census, the population of Galena was 3,429. The racial makeup of the city was 97.2% White, 0.7% African American, 0.3% Native American, 0.3% Asian, 0.1% Pacific Islander, 0.4% from other races, and 1.0% from two or more races. Hispanic or Latino of any race were 1.7% of the population.
The median income for a household in the city was $41,944, and the median income for a family was $50,917. The per capita income for the city was $22,845. About 8.2% of families and 11.2% of the population were below the poverty line, including 16.2% of those under age 18 and 8.2% of those age 65 or over.
Galena is a city with a rich history, beautiful scenery, and a vibrant economy. It is home to a diverse population, and offers a variety of attractions and activities for visitors and residents alike.
Common Questions
What is Per Capita Income in Galena?
Per Capita income in Galena is $38,387.
What is the Median Family Income in Galena?
Median Family Income in Galena is $79,231.
What is the Median Household income in Galena?
Median Household Income in Galena is $52,734.
What is Income or Wage Gap in Galena?
Income or Wage Gap in Galena is 25.2%.
Women in Galena earn 74.8 cents for every dollar earned by a man.
What is Inequality or Gini Index in Galena?
Inequality or Gini Index in Galena is 0.41.
What is the Total Population of Galena?
Total Population of Galena is 2,992.
What is the Total Male Population of Galena?
Total Male Population of Galena is 1,303.
What is the Total Female Population of Galena?
Total Female Population of Galena is 1,689.
What is the Ratio of Males per 100 Females in Galena?
There are 77.15 Males per 100 Females in Galena.
What is the Ratio of Females per 100 Males in Galena?
There are 129.62 Females per 100 Males in Galena.
What is the Median Population Age in Galena?
Median Population Age in Galena is 59.7 Years.
What is the Average Family Size in Galena
Average Family Size in Galena is 2.4 People.
What is the Average Household Size in Galena
Average Household Size in Galena is 1.8 People.
How Large is the Labor Force in Galena?
There are 1,462 People in the Labor Forcein in Galena.
What is the Percentage of People in the Labor Force in Galena?
55.3% of People are in the Labor Force in Galena.