Nora, IL Map & Demographics
Nora Map
Nora Overview
$26,199
PER CAPITA INCOME
$66,250
AVG FAMILY INCOME
$51,473
AVG HOUSEHOLD INCOME
9.2%
WAGE / INCOME GAP [ % ]
90.8¢/ $1
WAGE / INCOME GAP [ $ ]
0.22
INEQUALITY / GINI INDEX
176
TOTAL POPULATION
120
MALE POPULATION
56
FEMALE POPULATION
214.29
MALES / 100 FEMALES
46.67
FEMALES / 100 MALES
42.5
MEDIAN AGE
3.5
AVG FAMILY SIZE
2.7
AVG HOUSEHOLD SIZE
120
LABOR FORCE [ PEOPLE ]
74.1%
PERCENT IN LABOR FORCE
2.5%
UNEMPLOYMENT RATE
Nora Zip Codes
Nora Area Codes
Income in Nora
Income Overview in Nora
Per Capita Income in Nora is $26,199, while median incomes of families and households are $66,250 and $51,473 respectively.
| Characteristic | Number | Measure |
| Per Capita Income | 176 | $26,199 |
| Median Family Income | 32 | $66,250 |
| Mean Family Income | 32 | $74,488 |
| Median Household Income | 65 | $51,473 |
| Mean Household Income | 65 | $61,415 |
| Income Deficit | 32 | $0 |
| Wage / Income Gap (%) | 176 | 9.18% |
| Wage / Income Gap ($) | 176 | 90.82¢ per $1 |
| Gini / Inequality Index | 176 | 0.22 |
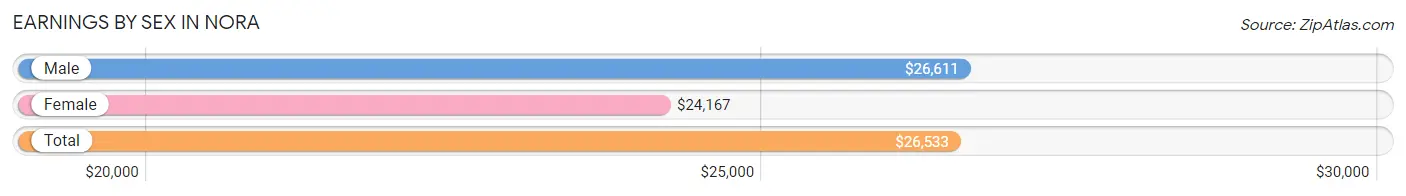
Earnings by Sex in Nora
Average Earnings in Nora are $26,533, $26,611 for men and $24,167 for women, a difference of 9.2%.
| Sex | Number | Average Earnings |
| Male | 95 (73.6%) | $26,611 |
| Female | 34 (26.4%) | $24,167 |
| Total | 129 (100.0%) | $26,533 |
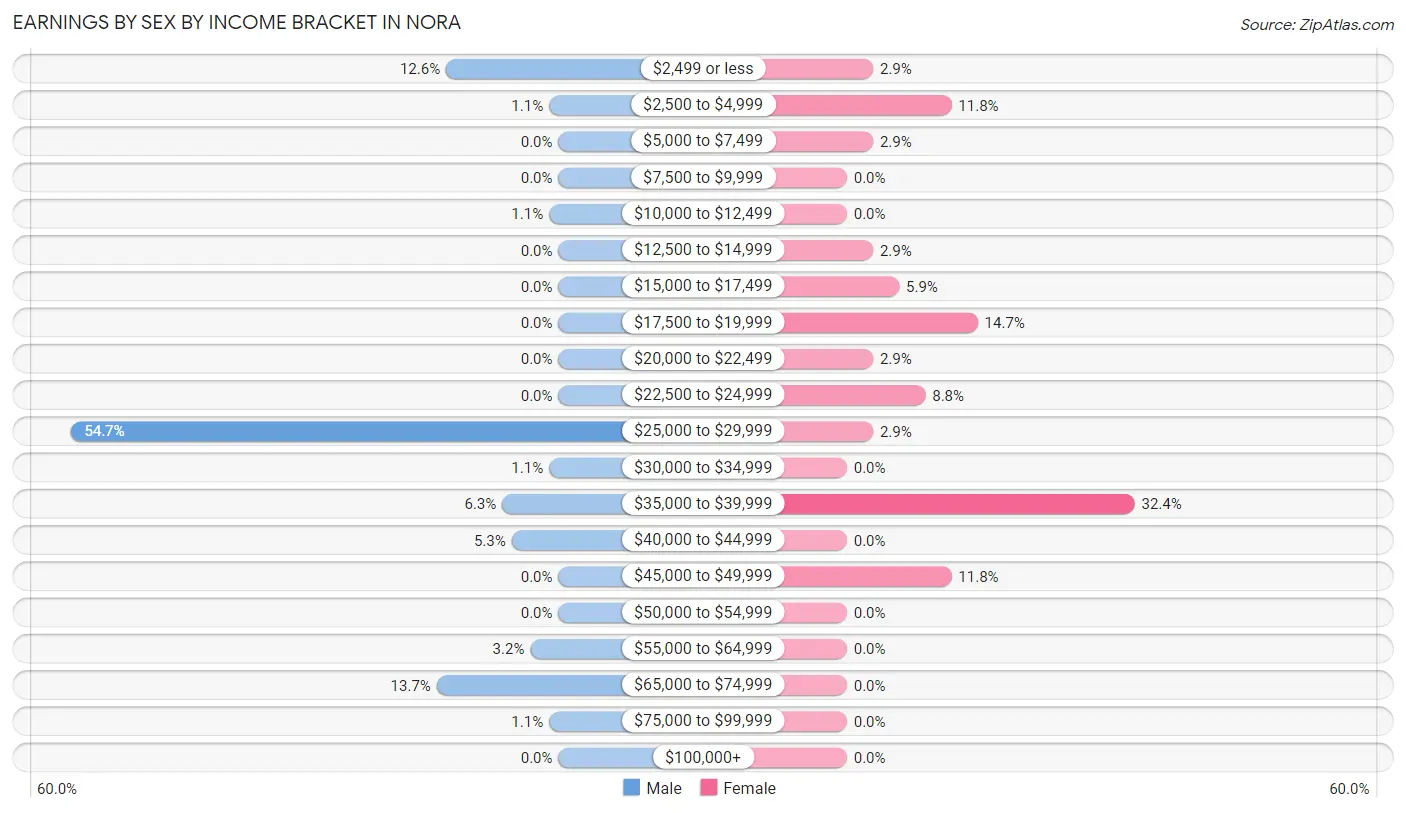
Earnings by Sex by Income Bracket in Nora
The most common earnings brackets in Nora are $25,000 to $29,999 for men (52 | 54.7%) and $35,000 to $39,999 for women (11 | 32.4%).
| Income | Male | Female |
| $2,499 or less | 12 (12.6%) | 1 (2.9%) |
| $2,500 to $4,999 | 1 (1.1%) | 4 (11.8%) |
| $5,000 to $7,499 | 0 (0.0%) | 1 (2.9%) |
| $7,500 to $9,999 | 0 (0.0%) | 0 (0.0%) |
| $10,000 to $12,499 | 1 (1.1%) | 0 (0.0%) |
| $12,500 to $14,999 | 0 (0.0%) | 1 (2.9%) |
| $15,000 to $17,499 | 0 (0.0%) | 2 (5.9%) |
| $17,500 to $19,999 | 0 (0.0%) | 5 (14.7%) |
| $20,000 to $22,499 | 0 (0.0%) | 1 (2.9%) |
| $22,500 to $24,999 | 0 (0.0%) | 3 (8.8%) |
| $25,000 to $29,999 | 52 (54.7%) | 1 (2.9%) |
| $30,000 to $34,999 | 1 (1.1%) | 0 (0.0%) |
| $35,000 to $39,999 | 6 (6.3%) | 11 (32.4%) |
| $40,000 to $44,999 | 5 (5.3%) | 0 (0.0%) |
| $45,000 to $49,999 | 0 (0.0%) | 4 (11.8%) |
| $50,000 to $54,999 | 0 (0.0%) | 0 (0.0%) |
| $55,000 to $64,999 | 3 (3.2%) | 0 (0.0%) |
| $65,000 to $74,999 | 13 (13.7%) | 0 (0.0%) |
| $75,000 to $99,999 | 1 (1.1%) | 0 (0.0%) |
| $100,000+ | 0 (0.0%) | 0 (0.0%) |
| Total | 95 (100.0%) | 34 (100.0%) |
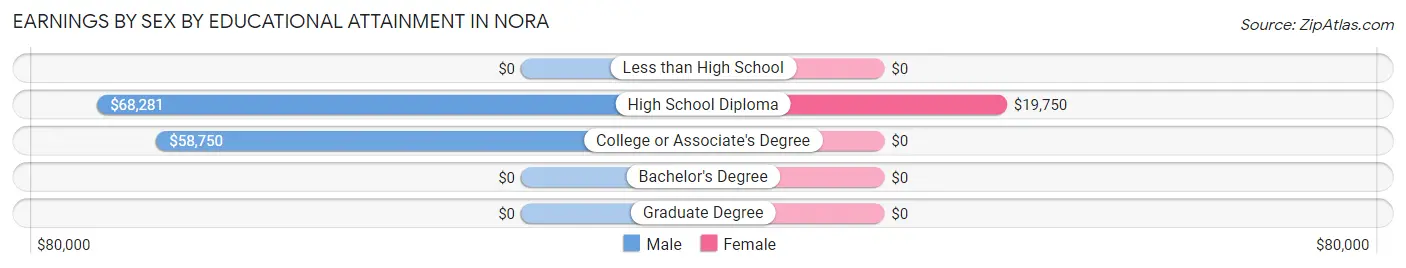
Earnings by Sex by Educational Attainment in Nora
| Educational Attainment | Male Income | Female Income |
| Less than High School | - | - |
| High School Diploma | $68,281 | $19,750 |
| College or Associate's Degree | $58,750 | $0 |
| Bachelor's Degree | - | - |
| Graduate Degree | - | - |
| Total | $50,000 | $0 |
Family Income in Nora
Family Income Brackets in Nora
According to the Nora family income data, there are 11 families falling into the $50,000 to $74,999 income range, which is the most common income bracket and makes up 34.4% of all families.
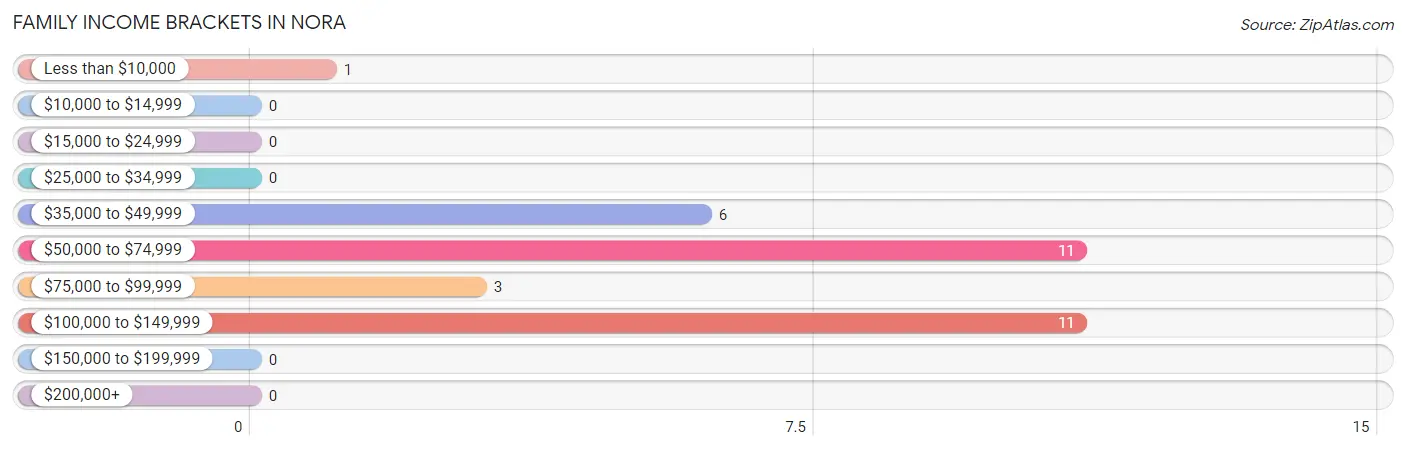
| Income Bracket | # Families | % Families |
| Less than $10,000 | 1 | 3.1% |
| $10,000 to $14,999 | 0 | 0.0% |
| $15,000 to $24,999 | 0 | 0.0% |
| $25,000 to $34,999 | 0 | 0.0% |
| $35,000 to $49,999 | 6 | 18.8% |
| $50,000 to $74,999 | 11 | 34.4% |
| $75,000 to $99,999 | 3 | 9.4% |
| $100,000 to $149,999 | 11 | 34.4% |
| $150,000 to $199,999 | 0 | 0.0% |
| $200,000+ | 0 | 0.0% |
Family Income by Famaliy Size in Nora
3-person families (14 | 43.8%) account for the highest median family income in Nora with $107,813 per family, while 3-person families (14 | 43.8%) have the highest median income of $35,938 per family member.
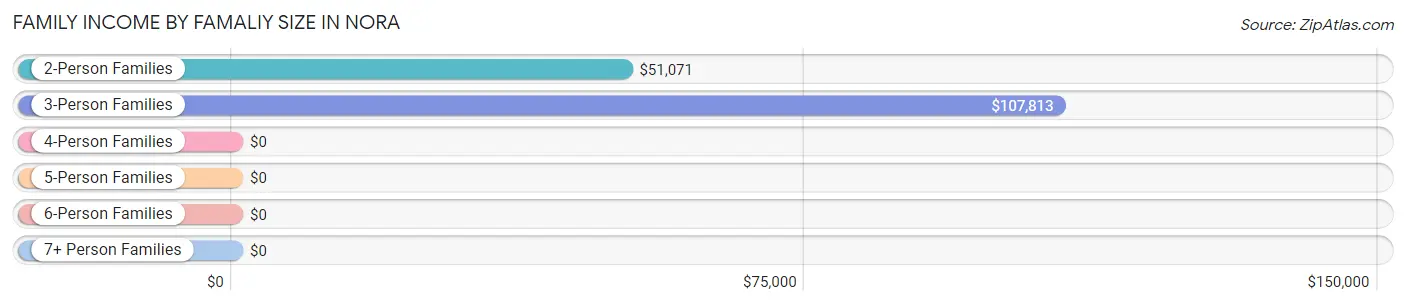
| Income Bracket | # Families | Median Income |
| 2-Person Families | 14 (43.8%) | $51,071 |
| 3-Person Families | 14 (43.8%) | $107,813 |
| 4-Person Families | 1 (3.1%) | $0 |
| 5-Person Families | 1 (3.1%) | $0 |
| 6-Person Families | 2 (6.2%) | $0 |
| 7+ Person Families | 0 (0.0%) | $0 |
| Total | 32 (100.0%) | $66,250 |
Family Income by Number of Earners in Nora
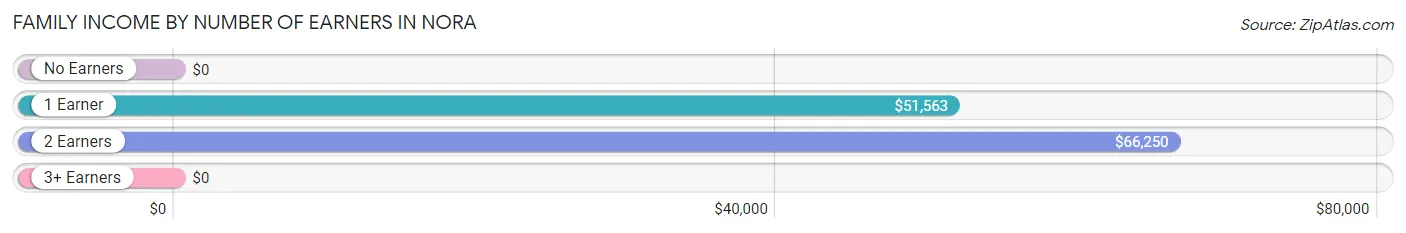
| Number of Earners | # Families | Median Income |
| No Earners | 3 (9.4%) | $0 |
| 1 Earner | 11 (34.4%) | $51,563 |
| 2 Earners | 9 (28.1%) | $66,250 |
| 3+ Earners | 9 (28.1%) | $0 |
| Total | 32 (100.0%) | $66,250 |
Household Income in Nora
Household Income Brackets in Nora
With 33 households falling in the category, the $50,000 to $74,999 income range is the most frequent in Nora, accounting for 50.8% of all households.
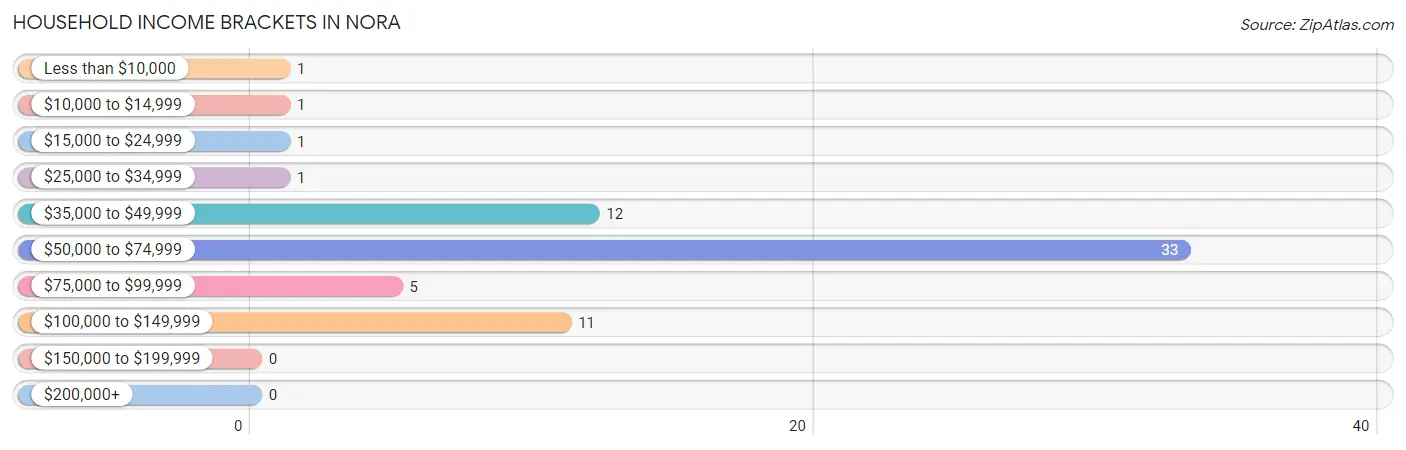
| Income Bracket | # Households | % Households |
| Less than $10,000 | 1 | 1.5% |
| $10,000 to $14,999 | 1 | 1.5% |
| $15,000 to $24,999 | 1 | 1.5% |
| $25,000 to $34,999 | 1 | 1.5% |
| $35,000 to $49,999 | 12 | 18.5% |
| $50,000 to $74,999 | 33 | 50.8% |
| $75,000 to $99,999 | 5 | 7.7% |
| $100,000 to $149,999 | 11 | 16.9% |
| $150,000 to $199,999 | 0 | 0.0% |
| $200,000+ | 0 | 0.0% |
Household Income by Householder Age in Nora
The median household income in Nora is $51,473, with the highest median household income of $66,667 found in the 25 to 44 years age bracket for the primary householder. A total of 6 households (9.2%) fall into this category. Meanwhile, the 15 to 24 years age bracket for the primary householder has the lowest median household income of $0, with 22 households (33.9%) in this group.
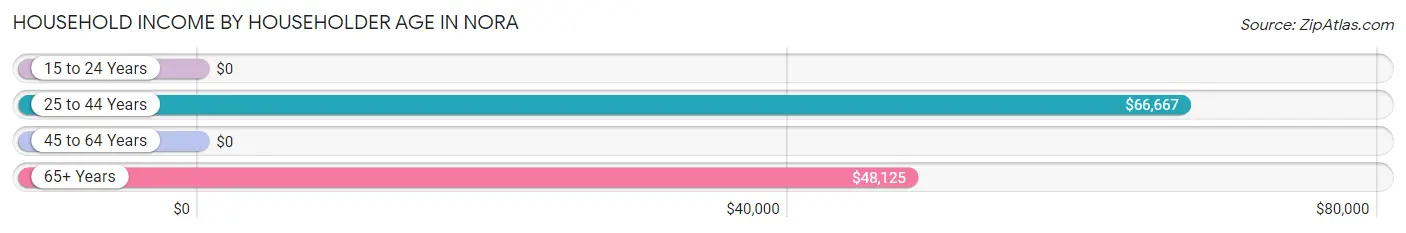
| Income Bracket | # Households | Median Income |
| 15 to 24 Years | 22 (33.9%) | $0 |
| 25 to 44 Years | 6 (9.2%) | $66,667 |
| 45 to 64 Years | 27 (41.5%) | $0 |
| 65+ Years | 10 (15.4%) | $48,125 |
| Total | 65 (100.0%) | $51,473 |
Poverty in Nora
Income Below Poverty by Sex and Age in Nora
With 2.5% poverty level for males and 3.6% for females among the residents of Nora, 65 to 74 year old males and 55 to 64 year old females are the most vulnerable to poverty, with 2 males (25.0%) and 1 females (11.1%) in their respective age groups living below the poverty level.
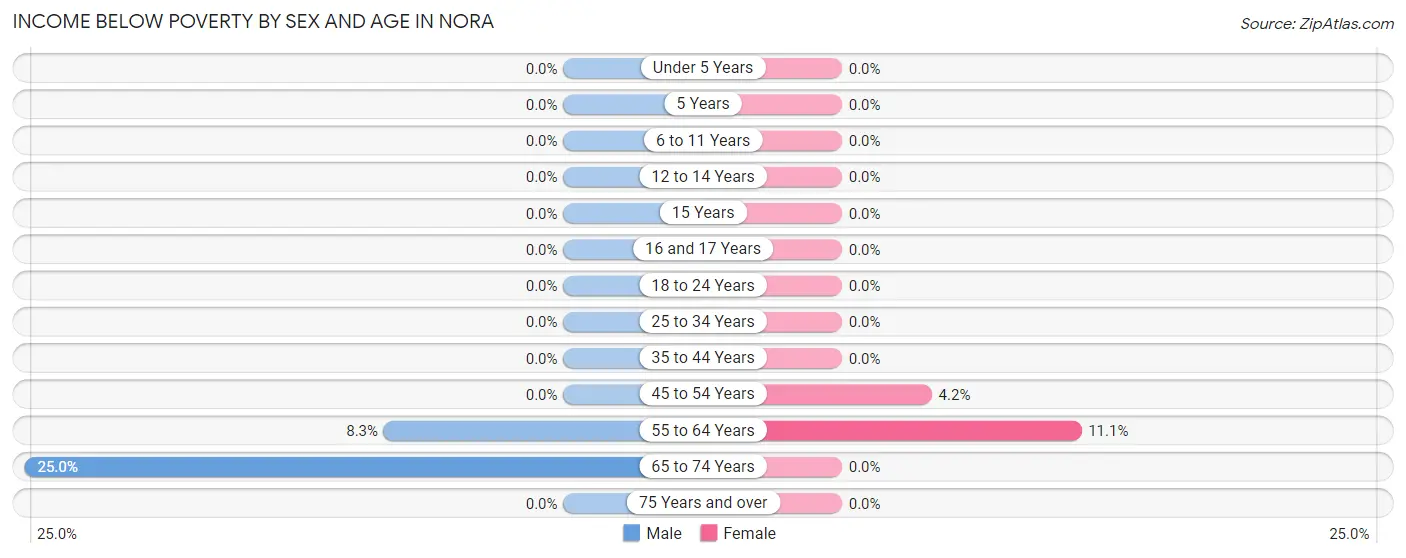
| Age Bracket | Male | Female |
| Under 5 Years | 0 (0.0%) | 0 (0.0%) |
| 5 Years | 0 (0.0%) | 0 (0.0%) |
| 6 to 11 Years | 0 (0.0%) | 0 (0.0%) |
| 12 to 14 Years | 0 (0.0%) | 0 (0.0%) |
| 15 Years | 0 (0.0%) | 0 (0.0%) |
| 16 and 17 Years | 0 (0.0%) | 0 (0.0%) |
| 18 to 24 Years | 0 (0.0%) | 0 (0.0%) |
| 25 to 34 Years | 0 (0.0%) | 0 (0.0%) |
| 35 to 44 Years | 0 (0.0%) | 0 (0.0%) |
| 45 to 54 Years | 0 (0.0%) | 1 (4.2%) |
| 55 to 64 Years | 1 (8.3%) | 1 (11.1%) |
| 65 to 74 Years | 2 (25.0%) | 0 (0.0%) |
| 75 Years and over | 0 (0.0%) | 0 (0.0%) |
| Total | 3 (2.5%) | 2 (3.6%) |
Income Above Poverty by Sex and Age in Nora
According to the poverty statistics in Nora, males aged 12 to 14 years and females aged under 5 years are the age groups that are most secure financially, with 100.0% of males and 100.0% of females in these age groups living above the poverty line.
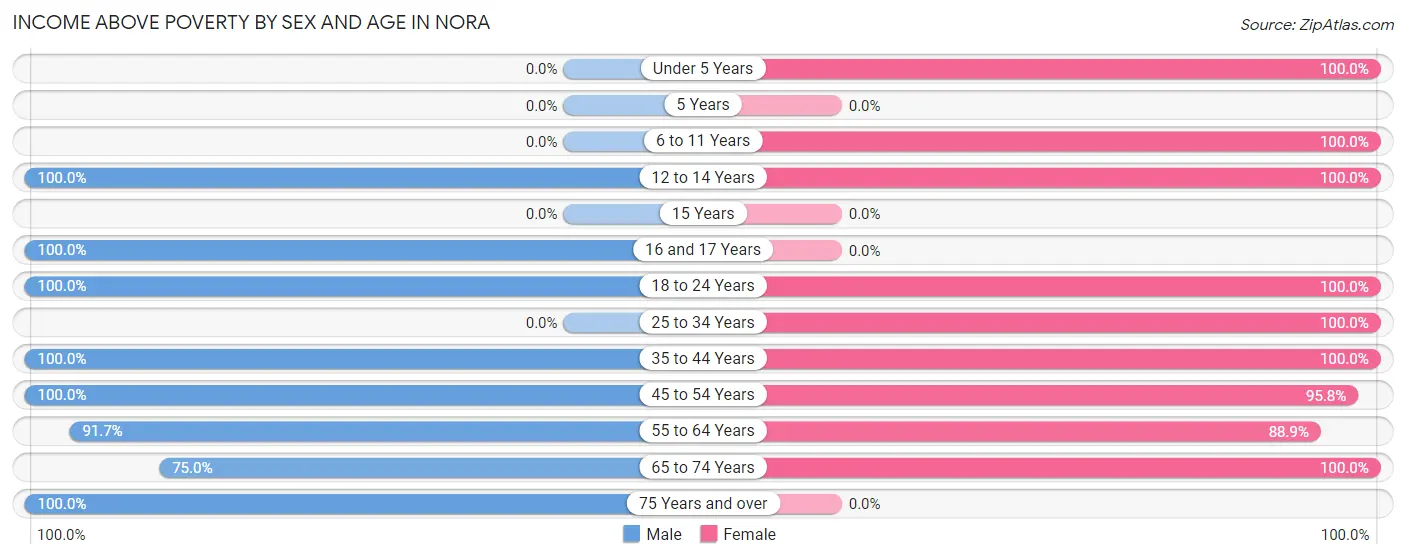
| Age Bracket | Male | Female |
| Under 5 Years | 0 (0.0%) | 4 (100.0%) |
| 5 Years | 0 (0.0%) | 0 (0.0%) |
| 6 to 11 Years | 0 (0.0%) | 6 (100.0%) |
| 12 to 14 Years | 3 (100.0%) | 1 (100.0%) |
| 15 Years | 0 (0.0%) | 0 (0.0%) |
| 16 and 17 Years | 15 (100.0%) | 0 (0.0%) |
| 18 to 24 Years | 53 (100.0%) | 2 (100.0%) |
| 25 to 34 Years | 0 (0.0%) | 1 (100.0%) |
| 35 to 44 Years | 3 (100.0%) | 4 (100.0%) |
| 45 to 54 Years | 20 (100.0%) | 23 (95.8%) |
| 55 to 64 Years | 11 (91.7%) | 8 (88.9%) |
| 65 to 74 Years | 6 (75.0%) | 5 (100.0%) |
| 75 Years and over | 6 (100.0%) | 0 (0.0%) |
| Total | 117 (97.5%) | 54 (96.4%) |
Income Below Poverty Among Married-Couple Families in Nora
The poverty statistics for married-couple families in Nora show that 3.5% or 1 of the total 29 families live below the poverty line. Families with no children have the highest poverty rate of 6.2%, comprising of 1 families. On the other hand, families with 1 or 2 children have the lowest poverty rate of 0.0%, which includes 0 families.
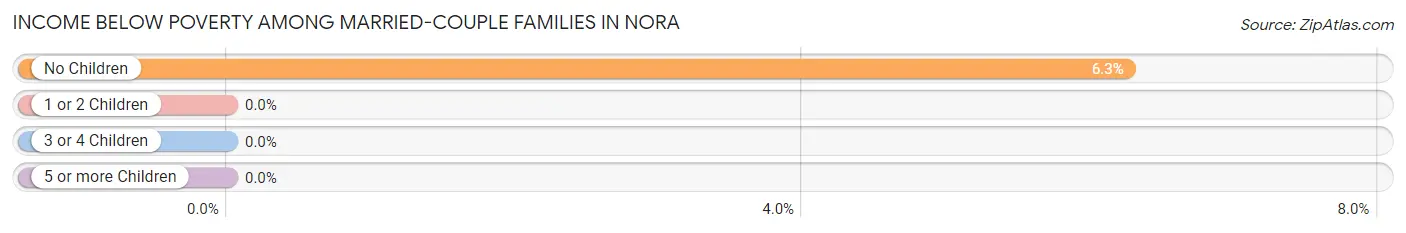
| Children | Above Poverty | Below Poverty |
| No Children | 15 (93.8%) | 1 (6.2%) |
| 1 or 2 Children | 11 (100.0%) | 0 (0.0%) |
| 3 or 4 Children | 2 (100.0%) | 0 (0.0%) |
| 5 or more Children | 0 (0.0%) | 0 (0.0%) |
| Total | 28 (96.6%) | 1 (3.5%) |
Income Below Poverty Among Single-Parent Households in Nora
| Children | Single Father | Single Mother |
| No Children | 0 (0.0%) | 0 (0.0%) |
| 1 or 2 Children | 0 (0.0%) | 0 (0.0%) |
| 3 or 4 Children | 0 (0.0%) | 0 (0.0%) |
| 5 or more Children | 0 (0.0%) | 0 (0.0%) |
| Total | 0 (0.0%) | 0 (0.0%) |
Income Below Poverty Among Married-Couple vs Single-Parent Households in Nora
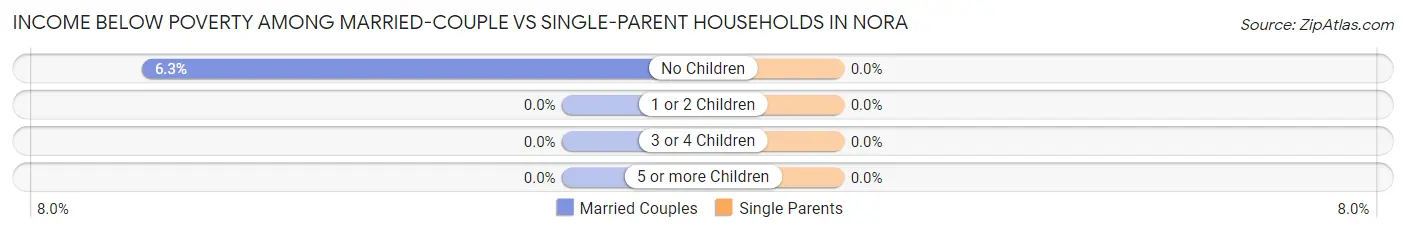
| Children | Married-Couple Families | Single-Parent Households |
| No Children | 1 (6.2%) | 0 (0.0%) |
| 1 or 2 Children | 0 (0.0%) | 0 (0.0%) |
| 3 or 4 Children | 0 (0.0%) | 0 (0.0%) |
| 5 or more Children | 0 (0.0%) | 0 (0.0%) |
| Total | 1 (3.5%) | 0 (0.0%) |
Race in Nora
The most populous races in Nora are White / Caucasian (169 | 96.0%), Two or more Races (7 | 4.0%), and Hispanic or Latino (2 | 1.1%).
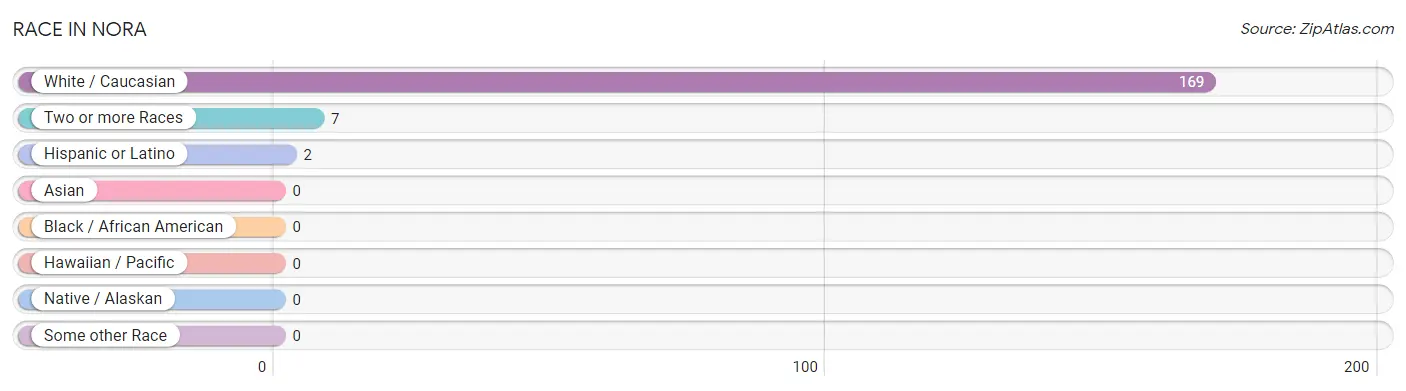
| Race | # Population | % Population |
| Asian | 0 | 0.0% |
| Black / African American | 0 | 0.0% |
| Hawaiian / Pacific | 0 | 0.0% |
| Hispanic or Latino | 2 | 1.1% |
| Native / Alaskan | 0 | 0.0% |
| White / Caucasian | 169 | 96.0% |
| Two or more Races | 7 | 4.0% |
| Some other Race | 0 | 0.0% |
| Total | 176 | 100.0% |
Ancestry in Nora
The most populous ancestries reported in Nora are German (114 | 64.8%), Irish (35 | 19.9%), American (33 | 18.8%), Swedish (12 | 6.8%), and English (9 | 5.1%), together accounting for 115.3% of all Nora residents.
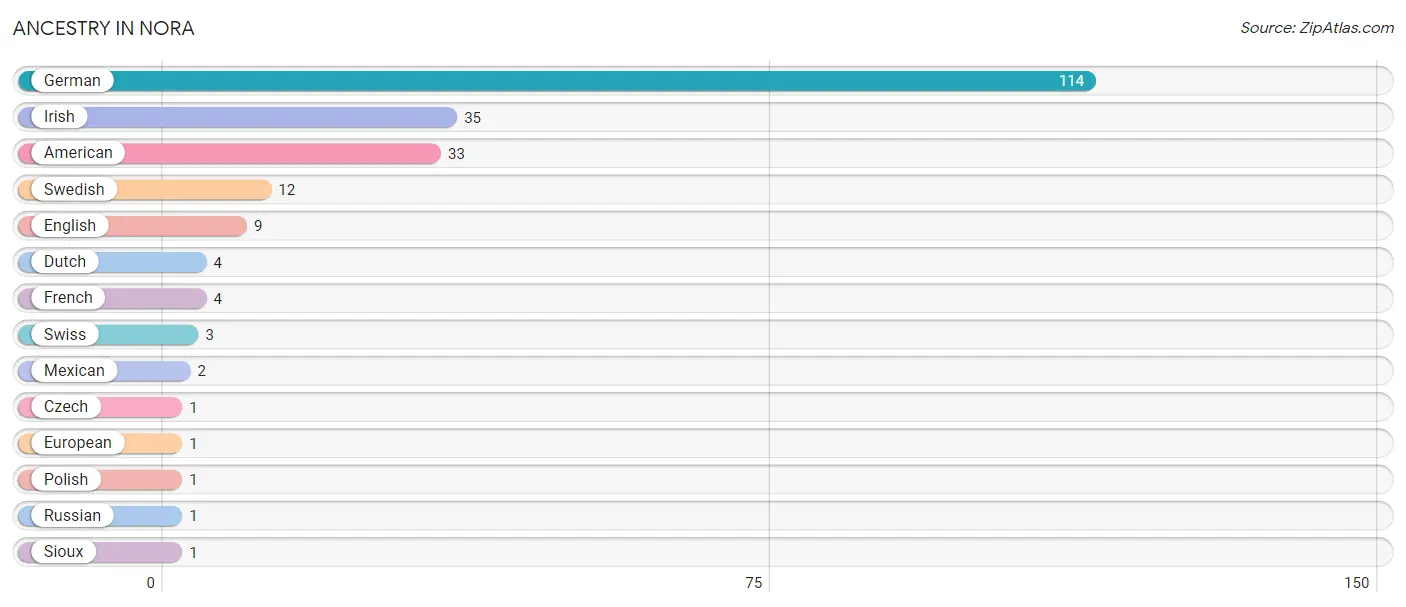
| Ancestry | # Population | % Population |
| American | 33 | 18.8% |
| Czech | 1 | 0.6% |
| Dutch | 4 | 2.3% |
| English | 9 | 5.1% |
| European | 1 | 0.6% |
| French | 4 | 2.3% |
| German | 114 | 64.8% |
| Irish | 35 | 19.9% |
| Mexican | 2 | 1.1% |
| Polish | 1 | 0.6% |
| Russian | 1 | 0.6% |
| Sioux | 1 | 0.6% |
| Swedish | 12 | 6.8% |
| Swiss | 3 | 1.7% | View All 14 Rows |
Immigrants in Nora

| Immigration Origin | # Population | % Population | View All 0 Rows |
Sex and Age in Nora
Sex and Age in Nora
The most populous age groups in Nora are 20 to 24 Years (53 | 44.2%) for men and 45 to 49 Years (21 | 37.5%) for women.
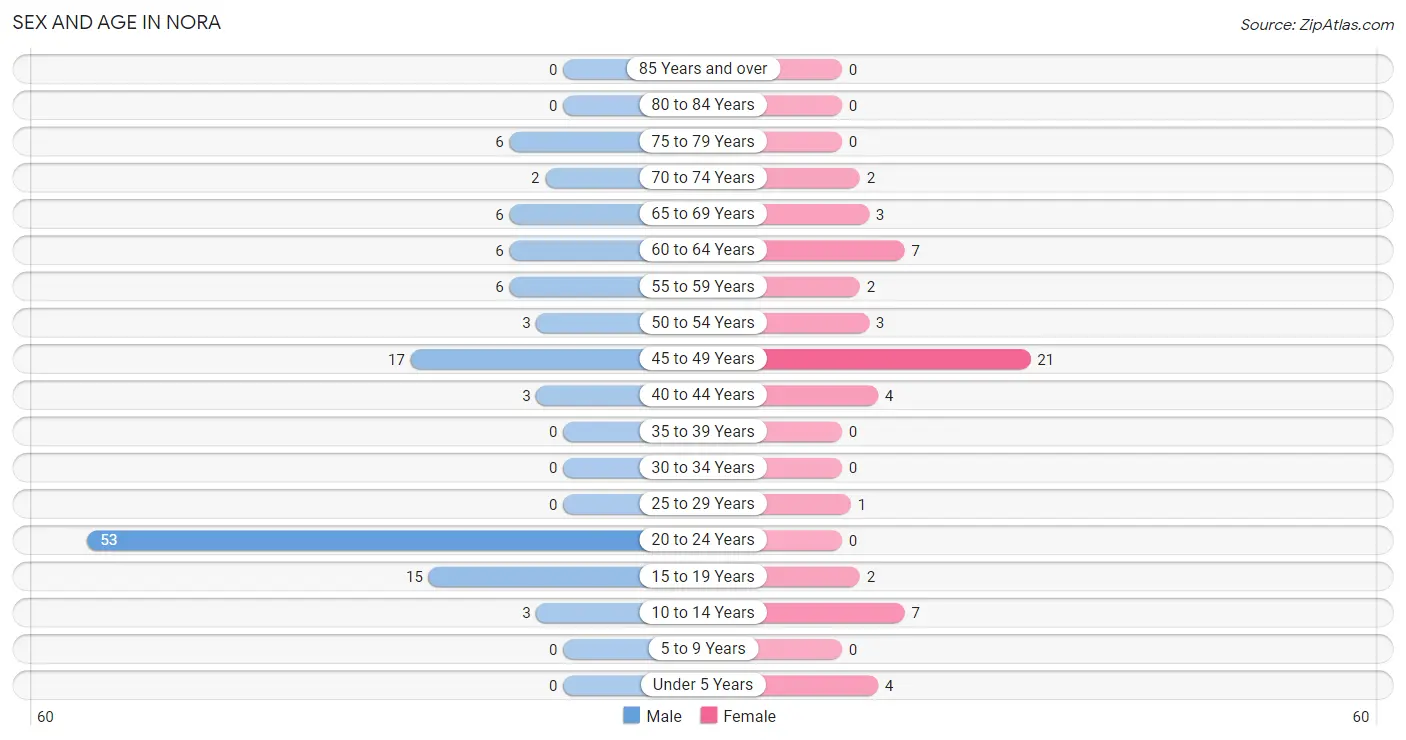
| Age Bracket | Male | Female |
| Under 5 Years | 0 (0.0%) | 4 (7.1%) |
| 5 to 9 Years | 0 (0.0%) | 0 (0.0%) |
| 10 to 14 Years | 3 (2.5%) | 7 (12.5%) |
| 15 to 19 Years | 15 (12.5%) | 2 (3.6%) |
| 20 to 24 Years | 53 (44.2%) | 0 (0.0%) |
| 25 to 29 Years | 0 (0.0%) | 1 (1.8%) |
| 30 to 34 Years | 0 (0.0%) | 0 (0.0%) |
| 35 to 39 Years | 0 (0.0%) | 0 (0.0%) |
| 40 to 44 Years | 3 (2.5%) | 4 (7.1%) |
| 45 to 49 Years | 17 (14.2%) | 21 (37.5%) |
| 50 to 54 Years | 3 (2.5%) | 3 (5.4%) |
| 55 to 59 Years | 6 (5.0%) | 2 (3.6%) |
| 60 to 64 Years | 6 (5.0%) | 7 (12.5%) |
| 65 to 69 Years | 6 (5.0%) | 3 (5.4%) |
| 70 to 74 Years | 2 (1.7%) | 2 (3.6%) |
| 75 to 79 Years | 6 (5.0%) | 0 (0.0%) |
| 80 to 84 Years | 0 (0.0%) | 0 (0.0%) |
| 85 Years and over | 0 (0.0%) | 0 (0.0%) |
| Total | 120 (100.0%) | 56 (100.0%) |
Families and Households in Nora
Median Family Size in Nora
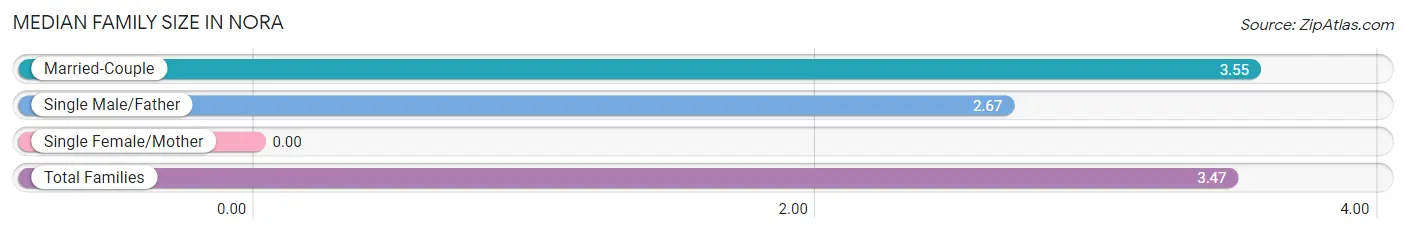
| Family Type | # Families | Family Size |
| Married-Couple | 29 (90.6%) | 3.55 |
| Single Male/Father | 3 (9.4%) | 2.67 |
| Single Female/Mother | 0 (0.0%) | - |
| Total Families | 32 (100.0%) | 3.47 |
Median Household Size in Nora
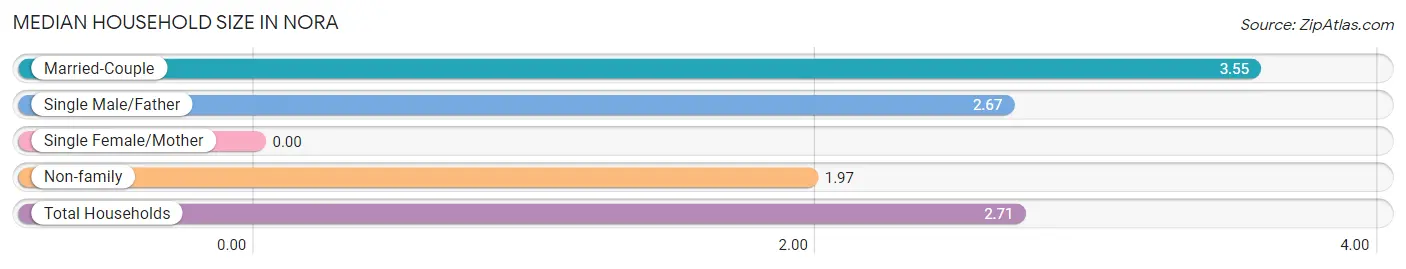
| Household Type | # Households | Household Size |
| Married-Couple | 29 (44.6%) | 3.55 |
| Single Male/Father | 3 (4.6%) | 2.67 |
| Single Female/Mother | 0 (0.0%) | - |
| Non-family | 33 (50.8%) | 1.97 |
| Total Households | 65 (100.0%) | 2.71 |
Household Size by Marriage Status in Nora
Out of a total of 65 households in Nora, 32 (49.2%) are family households, while 33 (50.8%) are nonfamily households. The most numerous type of family households are 2-person households, comprising 14, and the most common type of nonfamily households are 2-person households, comprising 24.
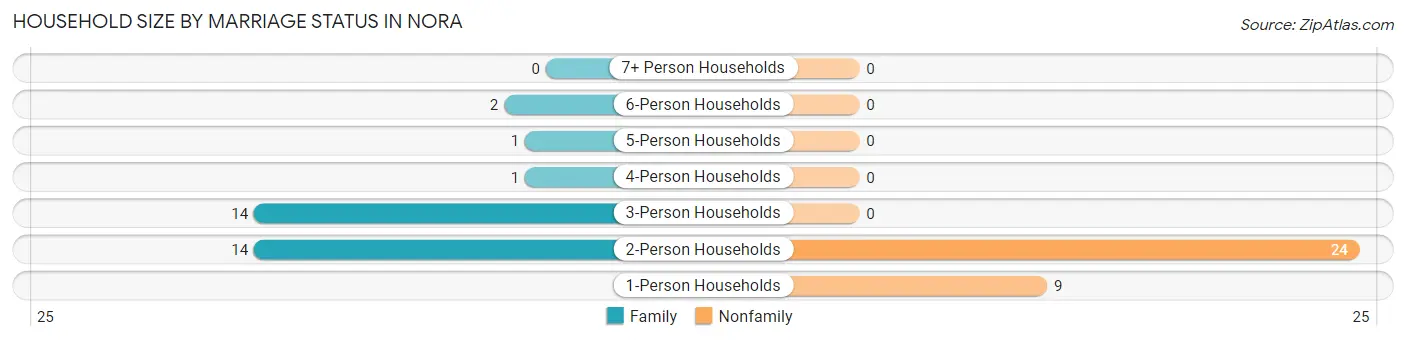
| Household Size | Family Households | Nonfamily Households |
| 1-Person Households | - | 9 (13.9%) |
| 2-Person Households | 14 (21.5%) | 24 (36.9%) |
| 3-Person Households | 14 (21.5%) | 0 (0.0%) |
| 4-Person Households | 1 (1.5%) | 0 (0.0%) |
| 5-Person Households | 1 (1.5%) | 0 (0.0%) |
| 6-Person Households | 2 (3.1%) | 0 (0.0%) |
| 7+ Person Households | 0 (0.0%) | 0 (0.0%) |
| Total | 32 (49.2%) | 33 (50.8%) |
Female Fertility in Nora
Fertility by Age in Nora
| Age Bracket | Women with Births | Births / 1,000 Women |
| 15 to 19 years | 0 (0.0%) | 0.0 |
| 20 to 34 years | 0 (0.0%) | 0.0 |
| 35 to 50 years | 0 (0.0%) | 0.0 |
| Total | 0 (0.0%) | 0.0 |
Fertility by Age by Marriage Status in Nora
| Age Bracket | Married | Unmarried |
| 15 to 19 years | 0 (0.0%) | 0 (0.0%) |
| 20 to 34 years | 0 (0.0%) | 0 (0.0%) |
| 35 to 50 years | 0 (0.0%) | 0 (0.0%) |
| Total | 0 (0.0%) | 0 (0.0%) |
Fertility by Education in Nora
| Educational Attainment | Women with Births | Births / 1,000 Women |
| Less than High School | 0 (0.0%) | 0.0 |
| High School Diploma | 0 (0.0%) | 0.0 |
| College or Associate's Degree | 0 (0.0%) | 0.0 |
| Bachelor's Degree | 0 (0.0%) | 0.0 |
| Graduate Degree | 0 (0.0%) | 0.0 |
| Total | 0 (0.0%) | 0.0 |
Fertility by Education by Marriage Status in Nora
| Educational Attainment | Married | Unmarried |
| Less than High School | 0 (0.0%) | 0 (0.0%) |
| High School Diploma | 0 (0.0%) | 0 (0.0%) |
| College or Associate's Degree | 0 (0.0%) | 0 (0.0%) |
| Bachelor's Degree | 0 (0.0%) | 0 (0.0%) |
| Graduate Degree | 0 (0.0%) | 0 (0.0%) |
| Total | 0 (0.0%) | 0 (0.0%) |
Employment Characteristics in Nora
Employment by Class of Employer in Nora
Among the 114 employed individuals in Nora, local government employees (56 | 49.1%), private company employees (45 | 39.5%), and self-employed (incorporated) (10 | 8.8%) make up the most common classes of employment.
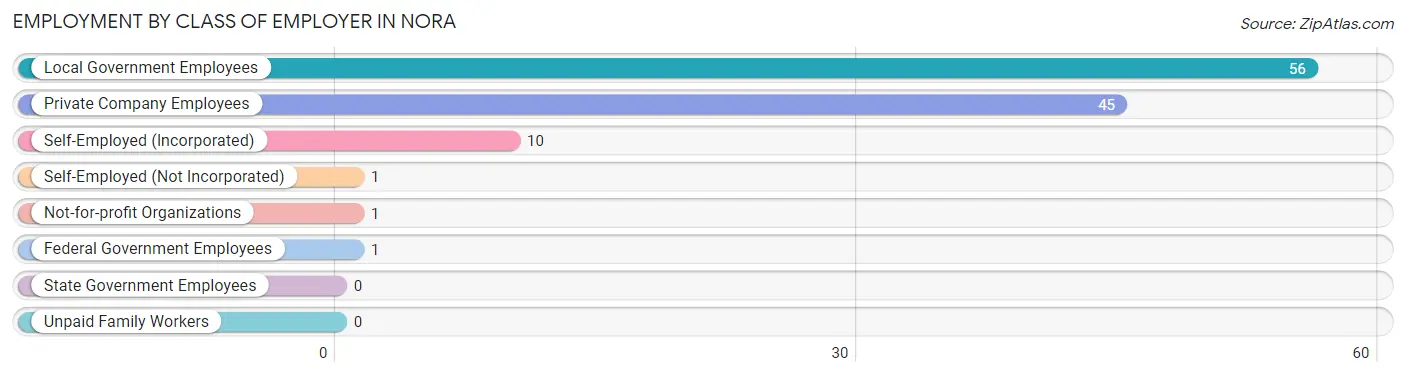
| Employer Class | # Employees | % Employees |
| Private Company Employees | 45 | 39.5% |
| Self-Employed (Incorporated) | 10 | 8.8% |
| Self-Employed (Not Incorporated) | 1 | 0.9% |
| Not-for-profit Organizations | 1 | 0.9% |
| Local Government Employees | 56 | 49.1% |
| State Government Employees | 0 | 0.0% |
| Federal Government Employees | 1 | 0.9% |
| Unpaid Family Workers | 0 | 0.0% |
| Total | 114 | 100.0% |
Employment Status by Age in Nora
According to the labor force statistics for Nora, out of the total population over 16 years of age (162), 74.1% or 120 individuals are in the labor force, with 2.5% or 3 of them unemployed. The age group with the highest labor force participation rate is 25 to 29 years, with 100.0% or 1 individuals in the labor force. Within the labor force, the 65 to 74 years age range has the highest percentage of unemployed individuals, with 40.0% or 2 of them being unemployed.
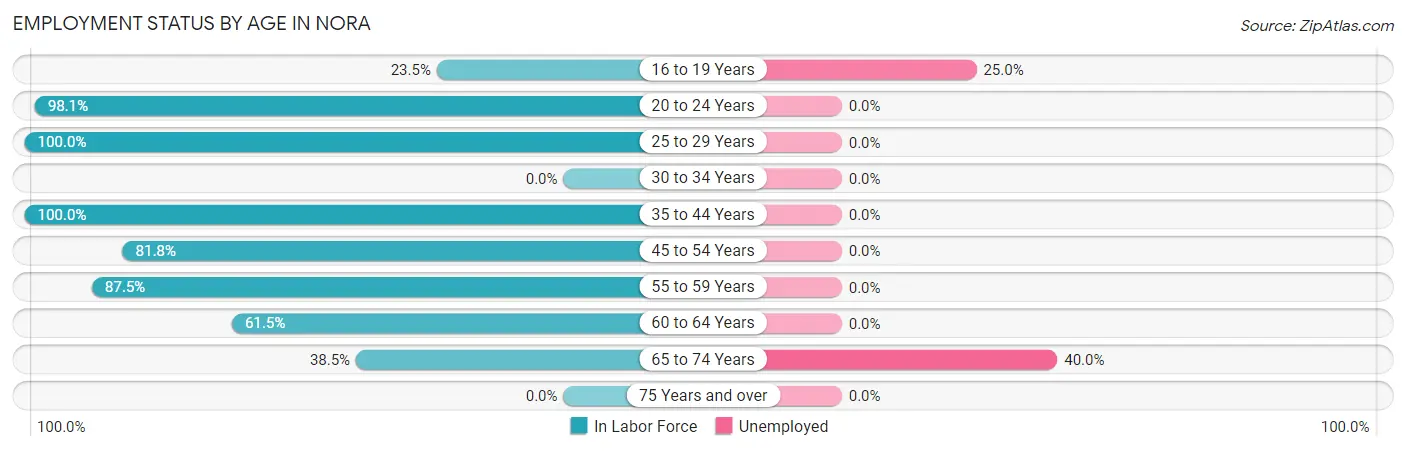
| Age Bracket | In Labor Force | Unemployed |
| 16 to 19 Years | 4 (23.5%) | 1 (25.0%) |
| 20 to 24 Years | 52 (98.1%) | 0 (0.0%) |
| 25 to 29 Years | 1 (100.0%) | 0 (0.0%) |
| 30 to 34 Years | 0 (0.0%) | 0 (0.0%) |
| 35 to 44 Years | 7 (100.0%) | 0 (0.0%) |
| 45 to 54 Years | 36 (81.8%) | 0 (0.0%) |
| 55 to 59 Years | 7 (87.5%) | 0 (0.0%) |
| 60 to 64 Years | 8 (61.5%) | 0 (0.0%) |
| 65 to 74 Years | 5 (38.5%) | 2 (40.0%) |
| 75 Years and over | 0 (0.0%) | 0 (0.0%) |
| Total | 120 (74.1%) | 3 (2.5%) |
Employment Status by Educational Attainment in Nora
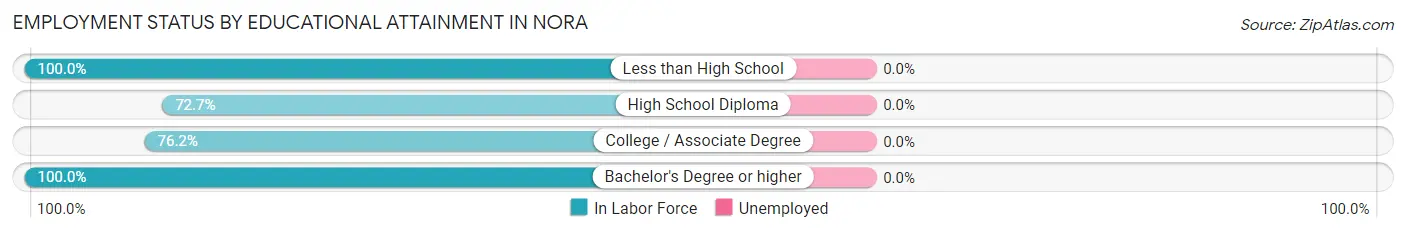
| Educational Attainment | In Labor Force | Unemployed |
| Less than High School | 7 (100.0%) | 0 (0.0%) |
| High School Diploma | 24 (72.7%) | 0 (0.0%) |
| College / Associate Degree | 16 (76.2%) | 0 (0.0%) |
| Bachelor's Degree or higher | 12 (100.0%) | 0 (0.0%) |
| Total | 59 (80.8%) | 0 (0.0%) |
Employment Occupations by Sex in Nora
Management, Business, Science and Arts Occupations
The most common Management, Business, Science and Arts occupations in Nora are Management (6 | 5.1%), Community & Social Service (1 | 0.9%), and Education Instruction & Library (1 | 0.9%).
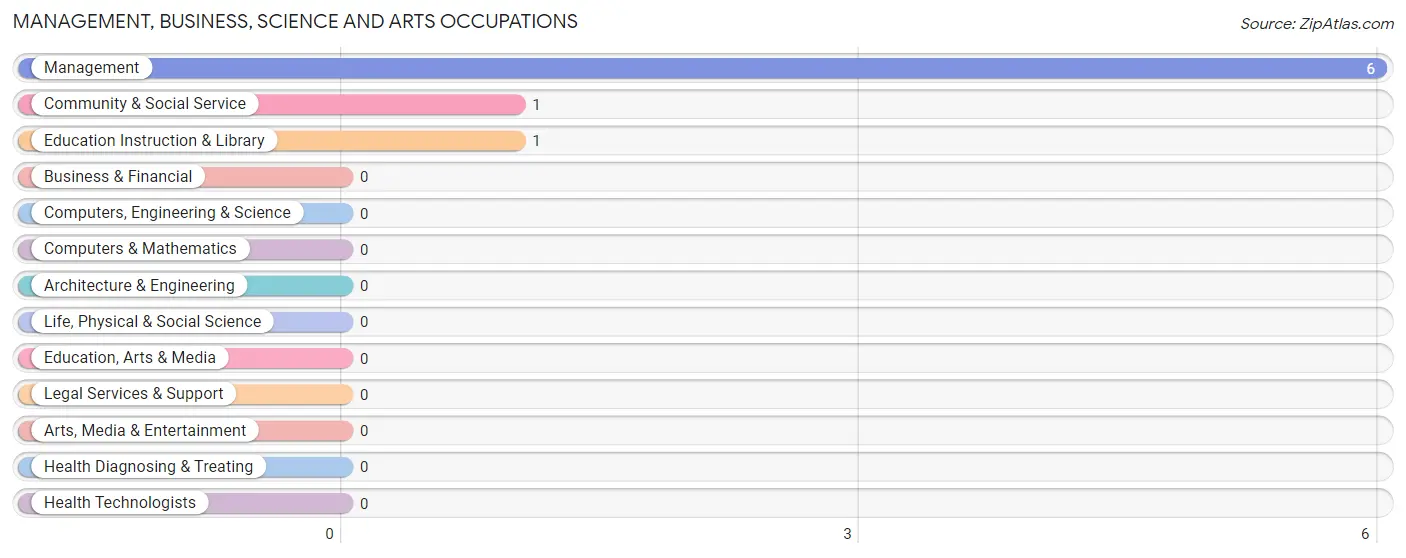
Management, Business, Science and Arts Occupations by Sex
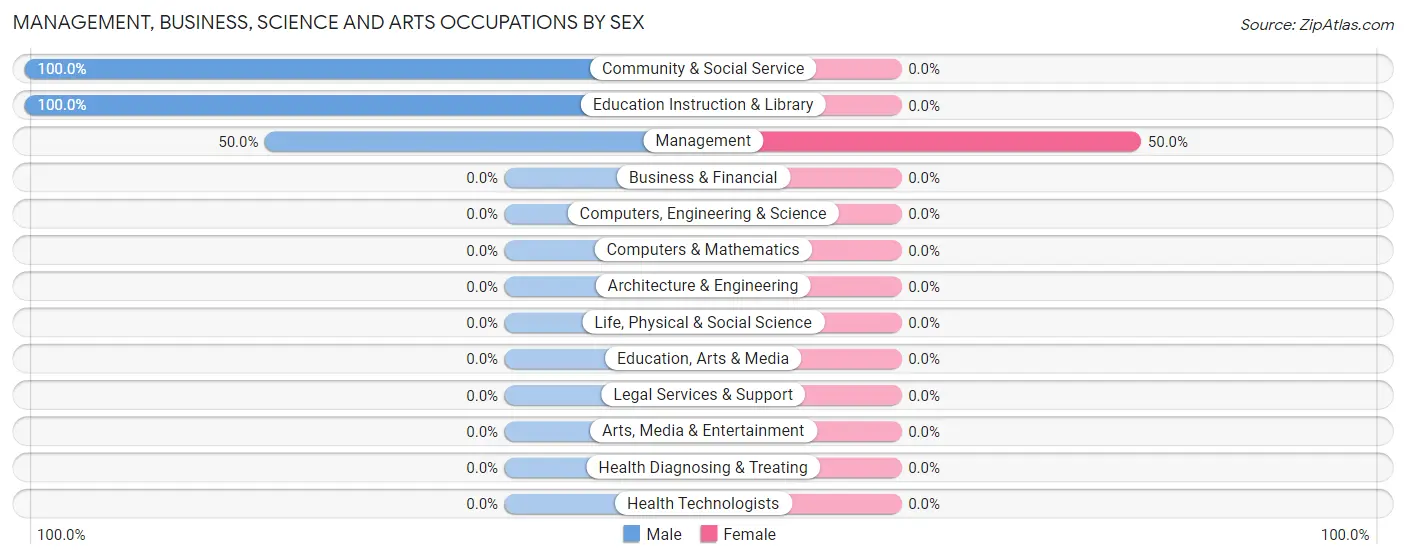
| Occupation | Male | Female |
| Management | 3 (50.0%) | 3 (50.0%) |
| Business & Financial | 0 (0.0%) | 0 (0.0%) |
| Computers, Engineering & Science | 0 (0.0%) | 0 (0.0%) |
| Computers & Mathematics | 0 (0.0%) | 0 (0.0%) |
| Architecture & Engineering | 0 (0.0%) | 0 (0.0%) |
| Life, Physical & Social Science | 0 (0.0%) | 0 (0.0%) |
| Community & Social Service | 1 (100.0%) | 0 (0.0%) |
| Education, Arts & Media | 0 (0.0%) | 0 (0.0%) |
| Legal Services & Support | 0 (0.0%) | 0 (0.0%) |
| Education Instruction & Library | 1 (100.0%) | 0 (0.0%) |
| Arts, Media & Entertainment | 0 (0.0%) | 0 (0.0%) |
| Health Diagnosing & Treating | 0 (0.0%) | 0 (0.0%) |
| Health Technologists | 0 (0.0%) | 0 (0.0%) |
| Total (Category) | 4 (57.1%) | 3 (42.9%) |
| Total (Overall) | 84 (71.8%) | 33 (28.2%) |
Services Occupations
The most common Services occupations in Nora are Cleaning & Maintenance (55 | 47.0%), Food Preparation & Serving (3 | 2.6%), Healthcare Support (2 | 1.7%), and Personal Care & Service (1 | 0.9%).
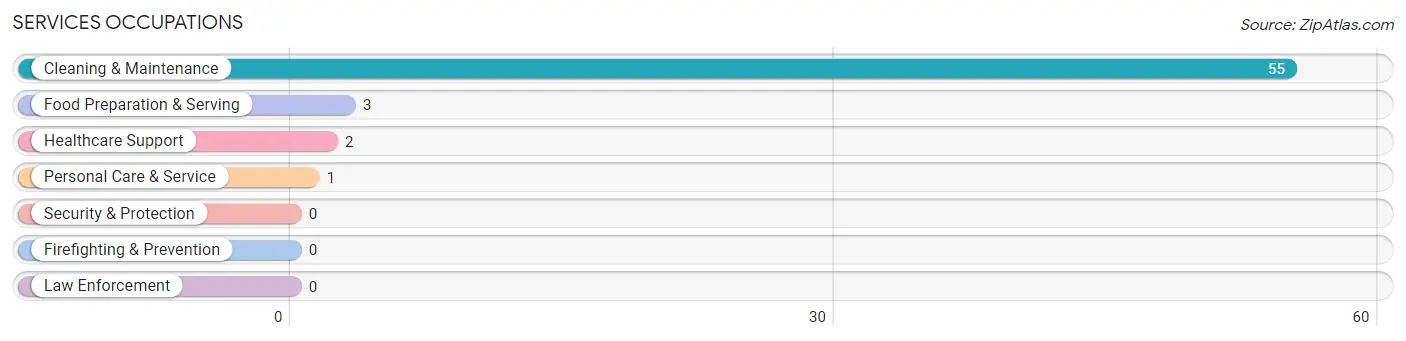
Services Occupations by Sex
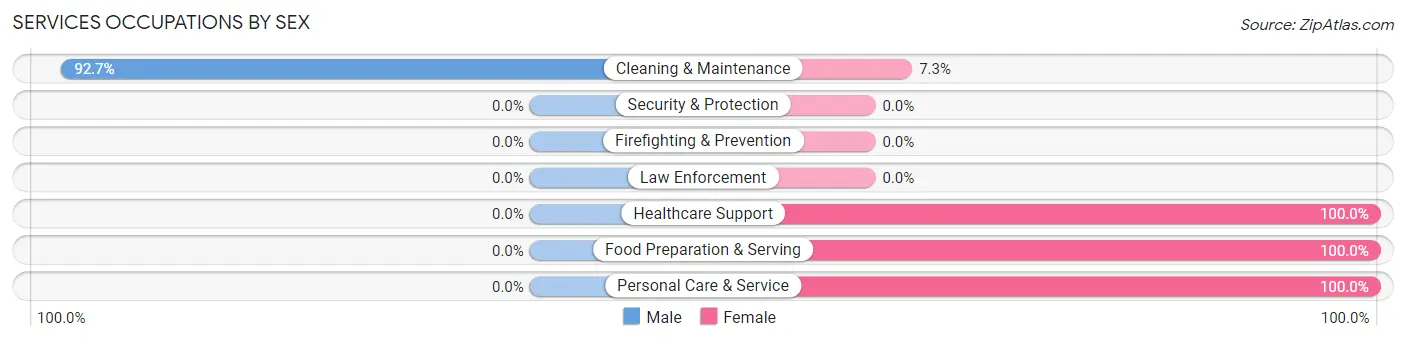
| Occupation | Male | Female |
| Healthcare Support | 0 (0.0%) | 2 (100.0%) |
| Security & Protection | 0 (0.0%) | 0 (0.0%) |
| Firefighting & Prevention | 0 (0.0%) | 0 (0.0%) |
| Law Enforcement | 0 (0.0%) | 0 (0.0%) |
| Food Preparation & Serving | 0 (0.0%) | 3 (100.0%) |
| Cleaning & Maintenance | 51 (92.7%) | 4 (7.3%) |
| Personal Care & Service | 0 (0.0%) | 1 (100.0%) |
| Total (Category) | 51 (83.6%) | 10 (16.4%) |
| Total (Overall) | 84 (71.8%) | 33 (28.2%) |
Sales and Office Occupations
The most common Sales and Office occupations in Nora are , and Office & Administration (23 | 19.7%).
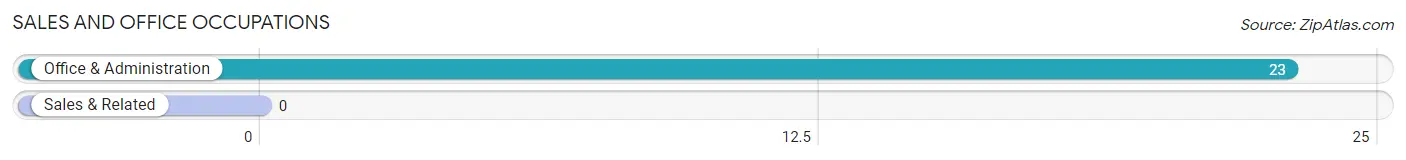
Sales and Office Occupations by Sex
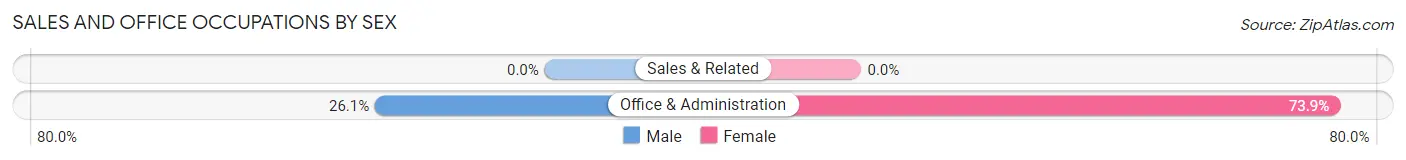
| Occupation | Male | Female |
| Sales & Related | 0 (0.0%) | 0 (0.0%) |
| Office & Administration | 6 (26.1%) | 17 (73.9%) |
| Total (Category) | 6 (26.1%) | 17 (73.9%) |
| Total (Overall) | 84 (71.8%) | 33 (28.2%) |
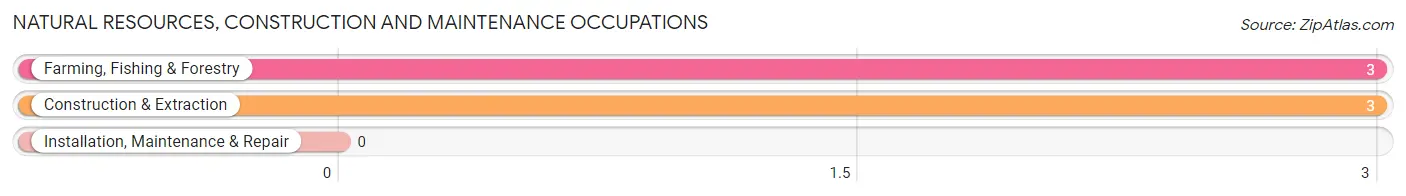
Natural Resources, Construction and Maintenance Occupations
The most common Natural Resources, Construction and Maintenance occupations in Nora are Farming, Fishing & Forestry (3 | 2.6%), and Construction & Extraction (3 | 2.6%).
Natural Resources, Construction and Maintenance Occupations by Sex
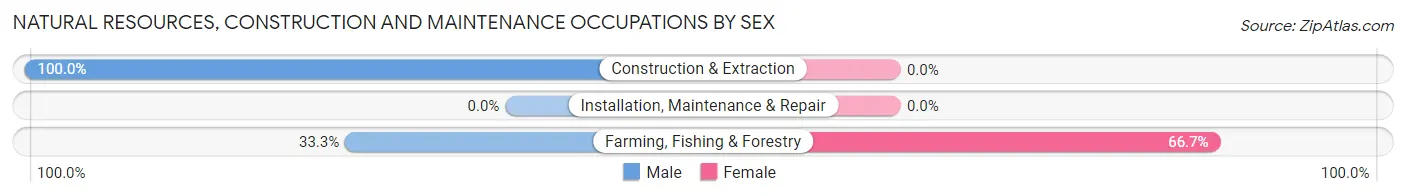
| Occupation | Male | Female |
| Farming, Fishing & Forestry | 1 (33.3%) | 2 (66.7%) |
| Construction & Extraction | 3 (100.0%) | 0 (0.0%) |
| Installation, Maintenance & Repair | 0 (0.0%) | 0 (0.0%) |
| Total (Category) | 4 (66.7%) | 2 (33.3%) |
| Total (Overall) | 84 (71.8%) | 33 (28.2%) |
Production, Transportation and Moving Occupations
The most common Production, Transportation and Moving occupations in Nora are Transportation (14 | 12.0%), Production (5 | 4.3%), and Material Moving (1 | 0.9%).
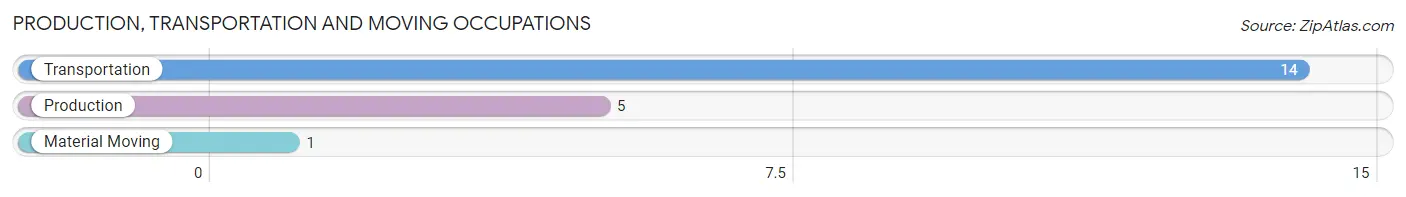
Production, Transportation and Moving Occupations by Sex
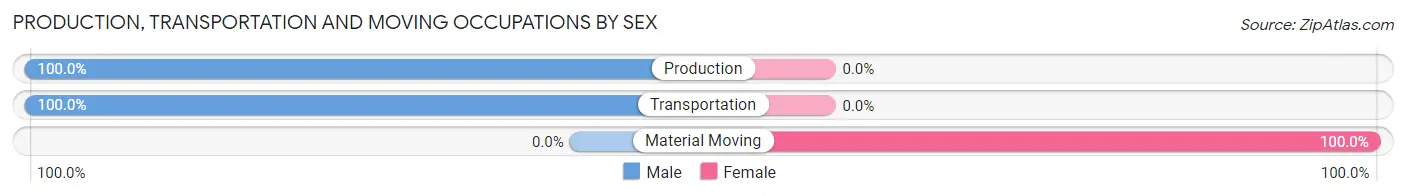
| Occupation | Male | Female |
| Production | 5 (100.0%) | 0 (0.0%) |
| Transportation | 14 (100.0%) | 0 (0.0%) |
| Material Moving | 0 (0.0%) | 1 (100.0%) |
| Total (Category) | 19 (95.0%) | 1 (5.0%) |
| Total (Overall) | 84 (71.8%) | 33 (28.2%) |
Employment Industries by Sex in Nora
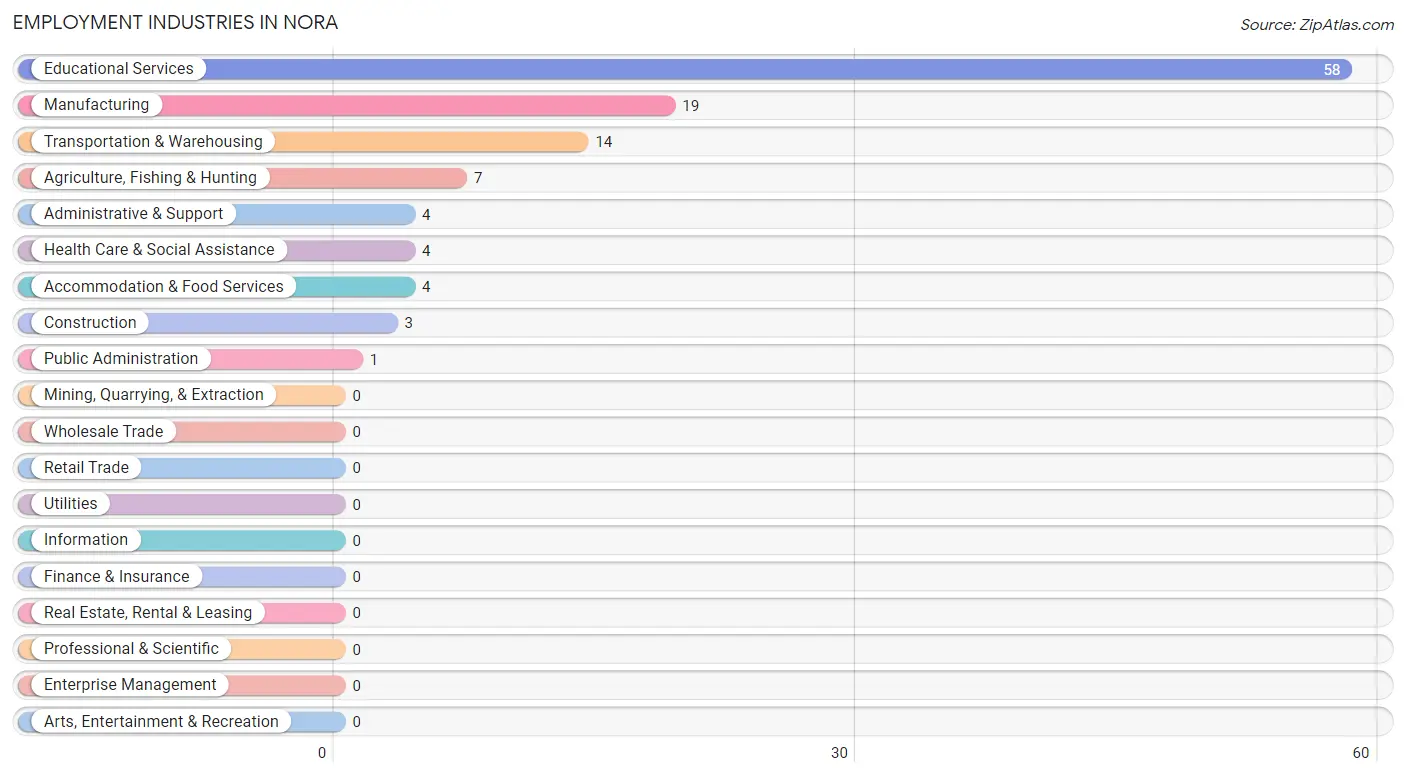
Employment Industries in Nora
The major employment industries in Nora include Educational Services (58 | 49.6%), Manufacturing (19 | 16.2%), Transportation & Warehousing (14 | 12.0%), Agriculture, Fishing & Hunting (7 | 6.0%), and Administrative & Support (4 | 3.4%).
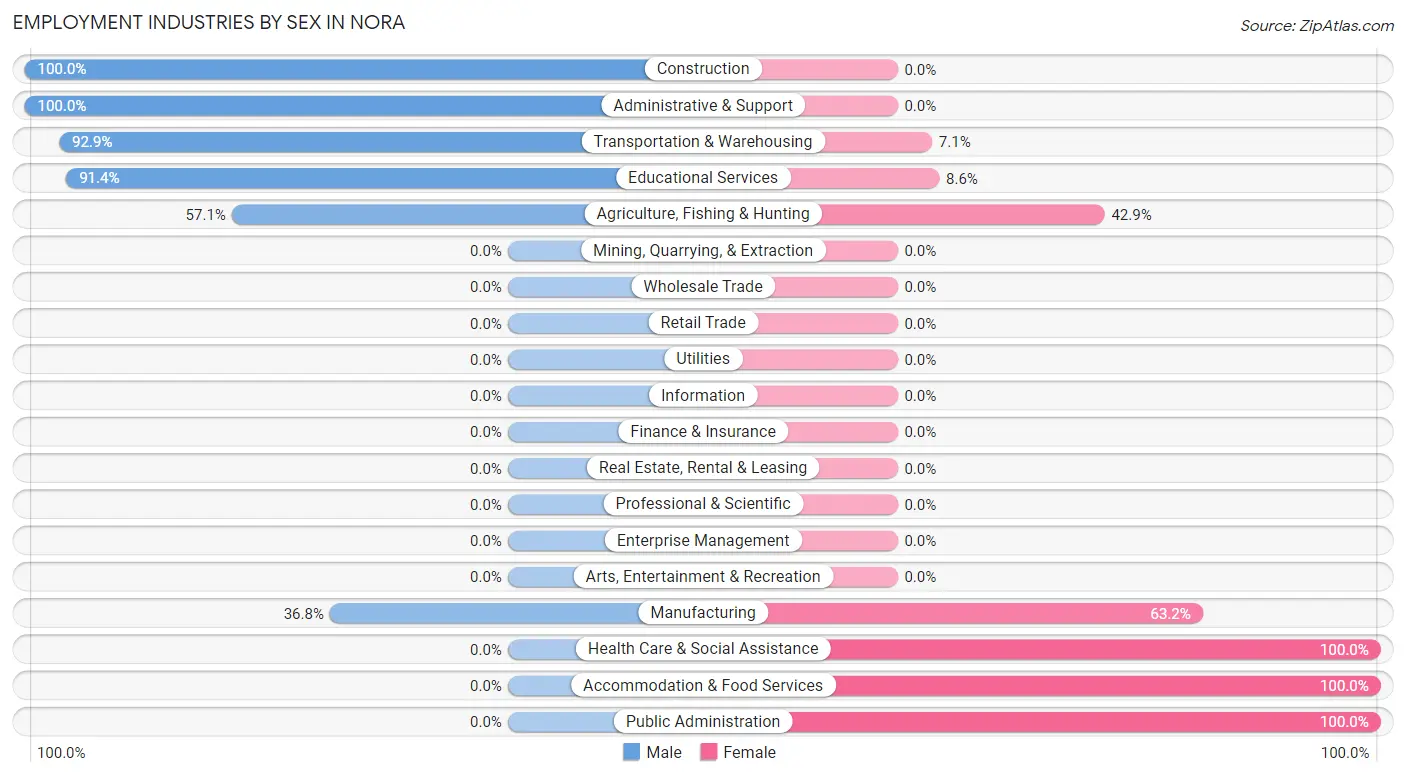
Employment Industries by Sex in Nora
The Nora industries that see more men than women are Construction (100.0%), Administrative & Support (100.0%), and Transportation & Warehousing (92.9%), whereas the industries that tend to have a higher number of women are Health Care & Social Assistance (100.0%), Accommodation & Food Services (100.0%), and Public Administration (100.0%).
| Industry | Male | Female |
| Agriculture, Fishing & Hunting | 4 (57.1%) | 3 (42.9%) |
| Mining, Quarrying, & Extraction | 0 (0.0%) | 0 (0.0%) |
| Construction | 3 (100.0%) | 0 (0.0%) |
| Manufacturing | 7 (36.8%) | 12 (63.2%) |
| Wholesale Trade | 0 (0.0%) | 0 (0.0%) |
| Retail Trade | 0 (0.0%) | 0 (0.0%) |
| Transportation & Warehousing | 13 (92.9%) | 1 (7.1%) |
| Utilities | 0 (0.0%) | 0 (0.0%) |
| Information | 0 (0.0%) | 0 (0.0%) |
| Finance & Insurance | 0 (0.0%) | 0 (0.0%) |
| Real Estate, Rental & Leasing | 0 (0.0%) | 0 (0.0%) |
| Professional & Scientific | 0 (0.0%) | 0 (0.0%) |
| Enterprise Management | 0 (0.0%) | 0 (0.0%) |
| Administrative & Support | 4 (100.0%) | 0 (0.0%) |
| Educational Services | 53 (91.4%) | 5 (8.6%) |
| Health Care & Social Assistance | 0 (0.0%) | 4 (100.0%) |
| Arts, Entertainment & Recreation | 0 (0.0%) | 0 (0.0%) |
| Accommodation & Food Services | 0 (0.0%) | 4 (100.0%) |
| Public Administration | 0 (0.0%) | 1 (100.0%) |
| Total | 84 (71.8%) | 33 (28.2%) |
Education in Nora
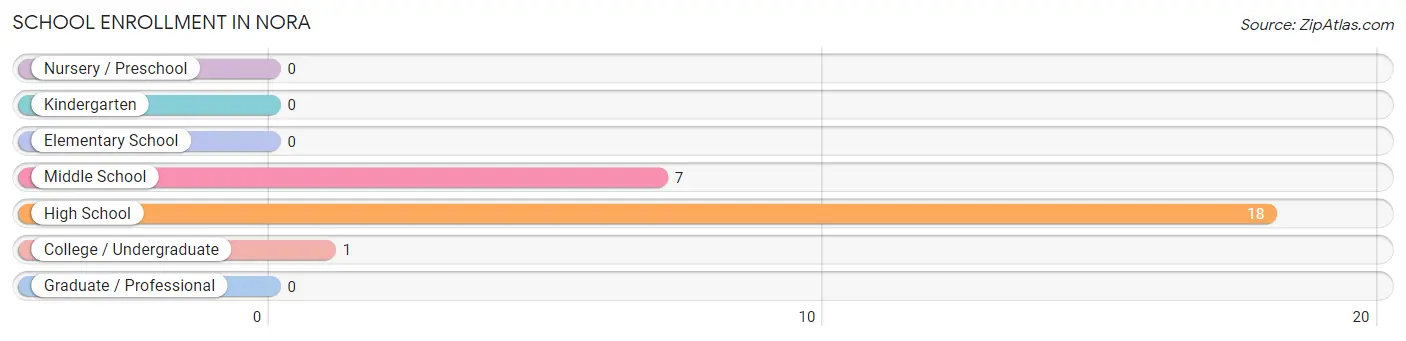
School Enrollment in Nora
The most common levels of schooling among the 26 students in Nora are high school (18 | 69.2%), middle school (7 | 26.9%), and college / undergraduate (1 | 3.8%).
| School Level | # Students | % Students |
| Nursery / Preschool | 0 | 0.0% |
| Kindergarten | 0 | 0.0% |
| Elementary School | 0 | 0.0% |
| Middle School | 7 | 26.9% |
| High School | 18 | 69.2% |
| College / Undergraduate | 1 | 3.8% |
| Graduate / Professional | 0 | 0.0% |
| Total | 26 | 100.0% |
School Enrollment by Age by Funding Source in Nora
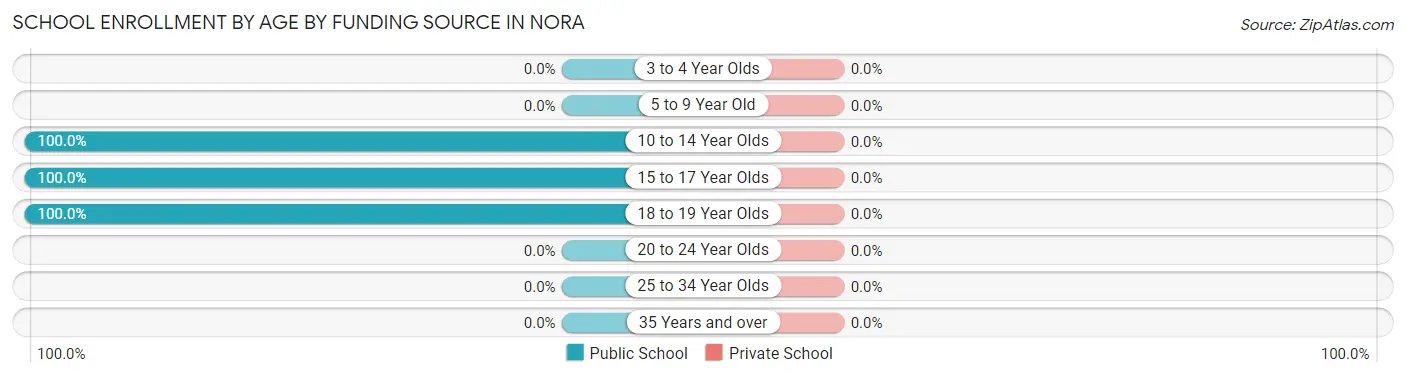
| Age Bracket | Public School | Private School |
| 3 to 4 Year Olds | 0 (0.0%) | 0 (0.0%) |
| 5 to 9 Year Old | 0 (0.0%) | 0 (0.0%) |
| 10 to 14 Year Olds | 10 (100.0%) | 0 (0.0%) |
| 15 to 17 Year Olds | 15 (100.0%) | 0 (0.0%) |
| 18 to 19 Year Olds | 1 (100.0%) | 0 (0.0%) |
| 20 to 24 Year Olds | 0 (0.0%) | 0 (0.0%) |
| 25 to 34 Year Olds | 0 (0.0%) | 0 (0.0%) |
| 35 Years and over | 0 (0.0%) | 0 (0.0%) |
| Total | 26 (100.0%) | 0 (0.0%) |
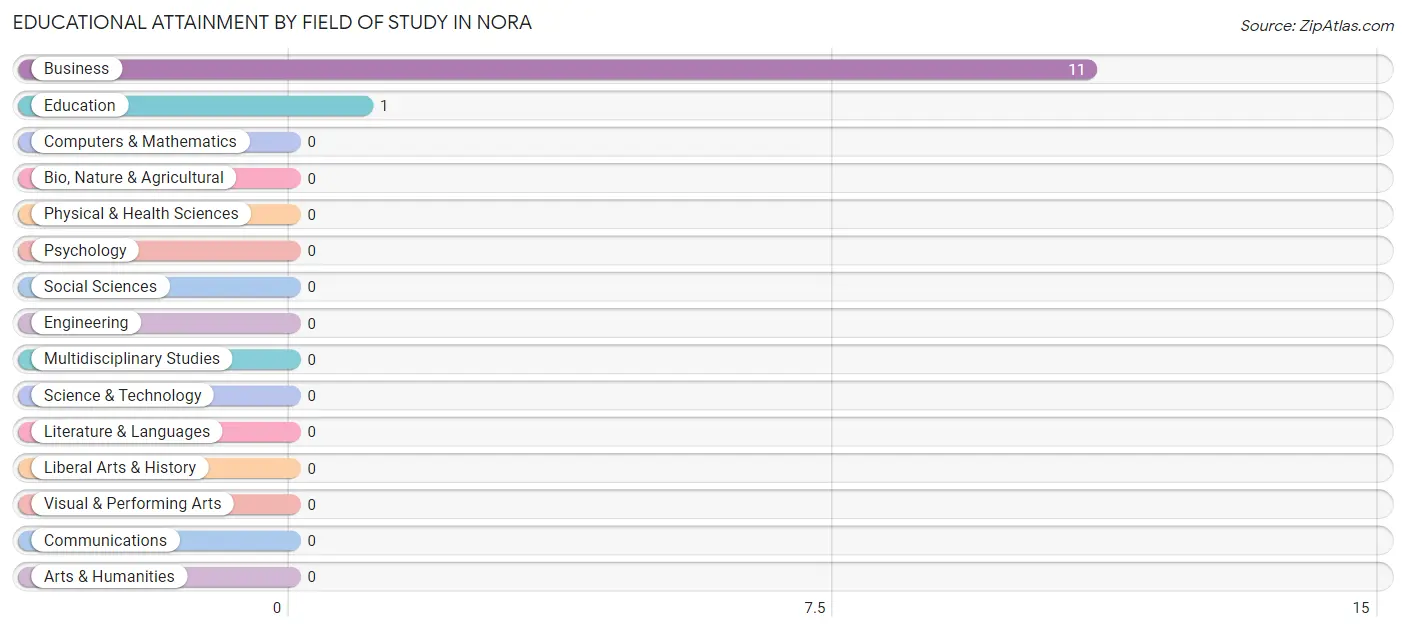
Educational Attainment by Field of Study in Nora
Business (11 | 91.7%), and education (1 | 8.3%) are the most common fields of study among 12 individuals in Nora who have obtained a bachelor's degree or higher.
| Field of Study | # Graduates | % Graduates |
| Computers & Mathematics | 0 | 0.0% |
| Bio, Nature & Agricultural | 0 | 0.0% |
| Physical & Health Sciences | 0 | 0.0% |
| Psychology | 0 | 0.0% |
| Social Sciences | 0 | 0.0% |
| Engineering | 0 | 0.0% |
| Multidisciplinary Studies | 0 | 0.0% |
| Science & Technology | 0 | 0.0% |
| Business | 11 | 91.7% |
| Education | 1 | 8.3% |
| Literature & Languages | 0 | 0.0% |
| Liberal Arts & History | 0 | 0.0% |
| Visual & Performing Arts | 0 | 0.0% |
| Communications | 0 | 0.0% |
| Arts & Humanities | 0 | 0.0% |
| Total | 12 | 100.0% |
Transportation & Commute in Nora
Vehicle Availability by Sex in Nora
The most prevalent vehicle ownership categories in Nora are males with 1 vehicle (51, accounting for 60.7%) and females with 1 vehicle (3, making up 170.0%).
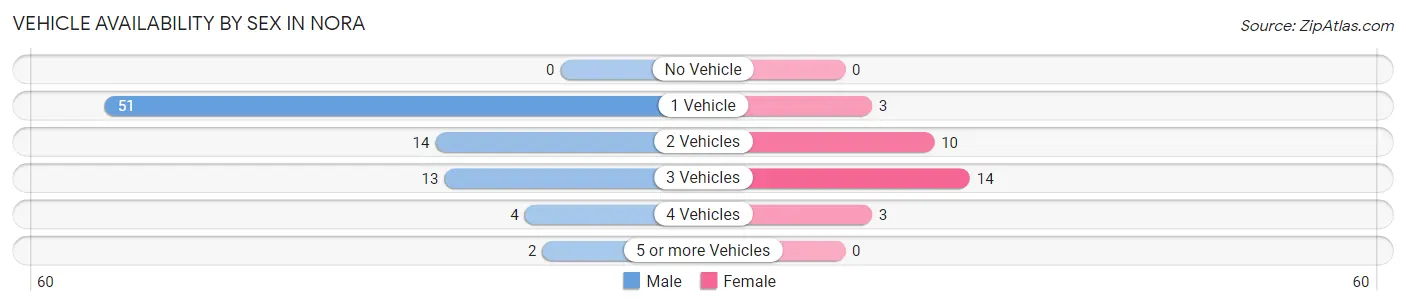
| Vehicles Available | Male | Female |
| No Vehicle | 0 (0.0%) | 0 (0.0%) |
| 1 Vehicle | 51 (60.7%) | 3 (10.0%) |
| 2 Vehicles | 14 (16.7%) | 10 (33.3%) |
| 3 Vehicles | 13 (15.5%) | 14 (46.7%) |
| 4 Vehicles | 4 (4.8%) | 3 (10.0%) |
| 5 or more Vehicles | 2 (2.4%) | 0 (0.0%) |
| Total | 84 (100.0%) | 30 (100.0%) |
Commute Time in Nora
The most frequently occuring commute durations in Nora are 5 to 9 minutes (61 commuters, 64.2%), 45 to 59 minutes (10 commuters, 10.5%), and 35 to 39 minutes (6 commuters, 6.3%).
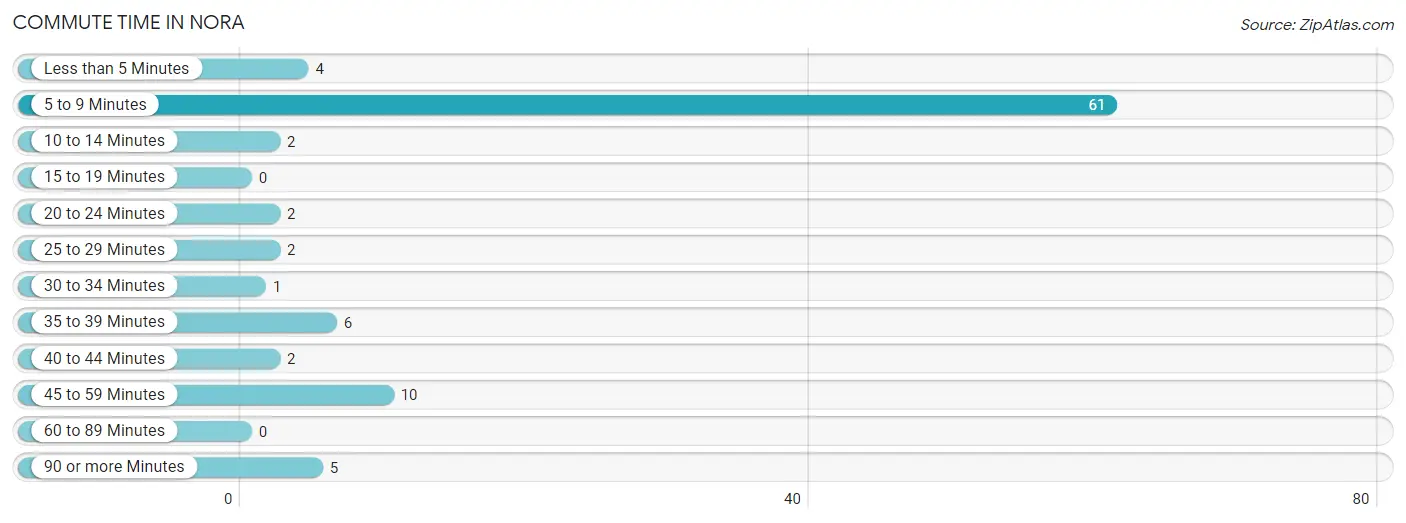
| Commute Time | # Commuters | % Commuters |
| Less than 5 Minutes | 4 | 4.2% |
| 5 to 9 Minutes | 61 | 64.2% |
| 10 to 14 Minutes | 2 | 2.1% |
| 15 to 19 Minutes | 0 | 0.0% |
| 20 to 24 Minutes | 2 | 2.1% |
| 25 to 29 Minutes | 2 | 2.1% |
| 30 to 34 Minutes | 1 | 1.1% |
| 35 to 39 Minutes | 6 | 6.3% |
| 40 to 44 Minutes | 2 | 2.1% |
| 45 to 59 Minutes | 10 | 10.5% |
| 60 to 89 Minutes | 0 | 0.0% |
| 90 or more Minutes | 5 | 5.3% |
Commute Time by Sex in Nora
The most common commute times in Nora are 5 to 9 minutes (56 commuters, 70.9%) for males and 5 to 9 minutes (5 commuters, 31.2%) for females.
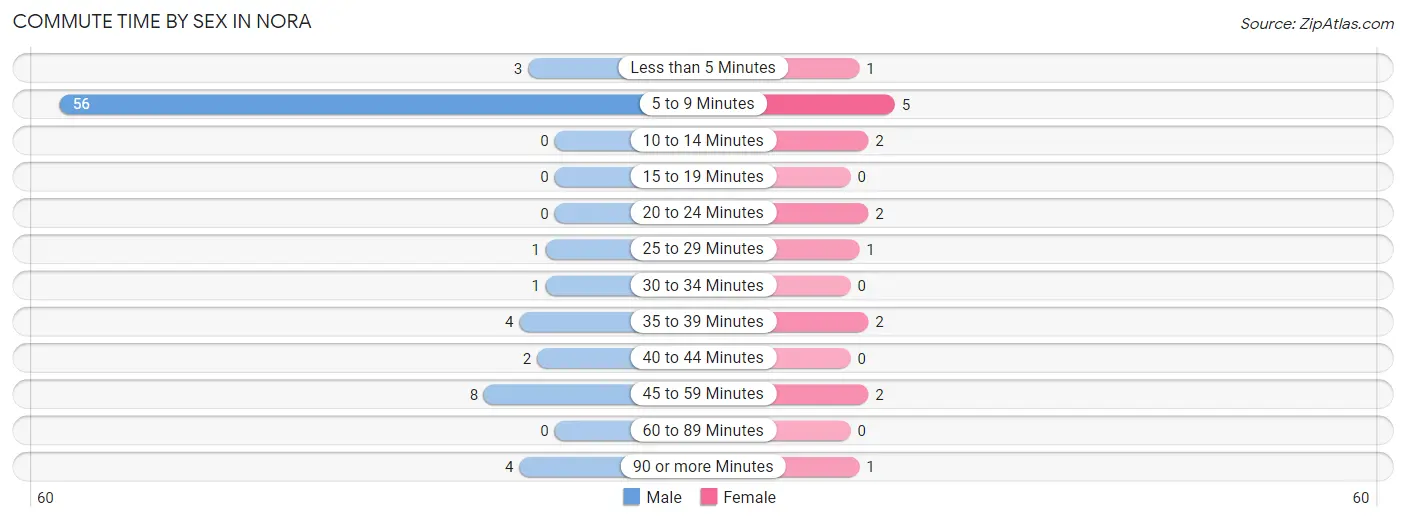
| Commute Time | Male | Female |
| Less than 5 Minutes | 3 (3.8%) | 1 (6.2%) |
| 5 to 9 Minutes | 56 (70.9%) | 5 (31.2%) |
| 10 to 14 Minutes | 0 (0.0%) | 2 (12.5%) |
| 15 to 19 Minutes | 0 (0.0%) | 0 (0.0%) |
| 20 to 24 Minutes | 0 (0.0%) | 2 (12.5%) |
| 25 to 29 Minutes | 1 (1.3%) | 1 (6.2%) |
| 30 to 34 Minutes | 1 (1.3%) | 0 (0.0%) |
| 35 to 39 Minutes | 4 (5.1%) | 2 (12.5%) |
| 40 to 44 Minutes | 2 (2.5%) | 0 (0.0%) |
| 45 to 59 Minutes | 8 (10.1%) | 2 (12.5%) |
| 60 to 89 Minutes | 0 (0.0%) | 0 (0.0%) |
| 90 or more Minutes | 4 (5.1%) | 1 (6.2%) |
Time of Departure to Work by Sex in Nora
The most frequent times of departure to work in Nora are 7:30 AM to 7:59 AM (57, 72.2%) for males and 7:00 AM to 7:29 AM (5, 31.2%) for females.
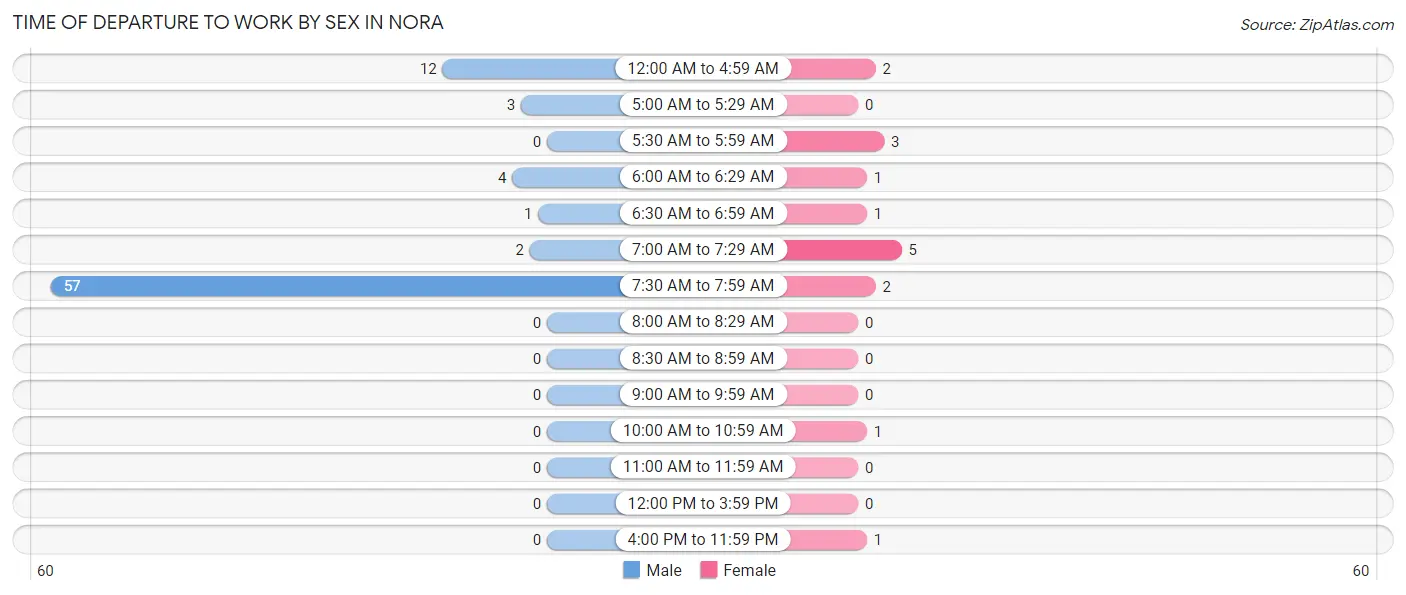
| Time of Departure | Male | Female |
| 12:00 AM to 4:59 AM | 12 (15.2%) | 2 (12.5%) |
| 5:00 AM to 5:29 AM | 3 (3.8%) | 0 (0.0%) |
| 5:30 AM to 5:59 AM | 0 (0.0%) | 3 (18.8%) |
| 6:00 AM to 6:29 AM | 4 (5.1%) | 1 (6.2%) |
| 6:30 AM to 6:59 AM | 1 (1.3%) | 1 (6.2%) |
| 7:00 AM to 7:29 AM | 2 (2.5%) | 5 (31.2%) |
| 7:30 AM to 7:59 AM | 57 (72.2%) | 2 (12.5%) |
| 8:00 AM to 8:29 AM | 0 (0.0%) | 0 (0.0%) |
| 8:30 AM to 8:59 AM | 0 (0.0%) | 0 (0.0%) |
| 9:00 AM to 9:59 AM | 0 (0.0%) | 0 (0.0%) |
| 10:00 AM to 10:59 AM | 0 (0.0%) | 1 (6.2%) |
| 11:00 AM to 11:59 AM | 0 (0.0%) | 0 (0.0%) |
| 12:00 PM to 3:59 PM | 0 (0.0%) | 0 (0.0%) |
| 4:00 PM to 11:59 PM | 0 (0.0%) | 1 (6.2%) |
| Total | 79 (100.0%) | 16 (100.0%) |
Housing Occupancy in Nora
Occupancy by Ownership in Nora
Of the total 65 dwellings in Nora, owner-occupied units account for 40 (61.5%), while renter-occupied units make up 25 (38.5%).
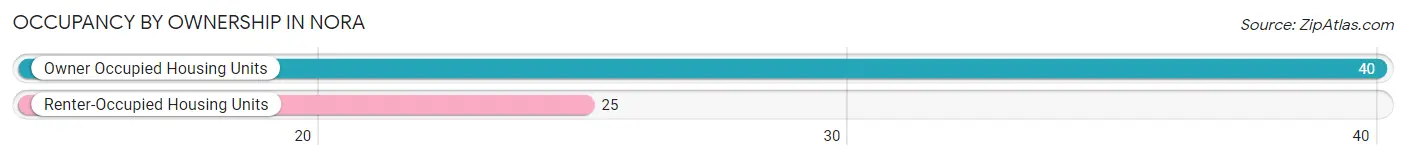
| Occupancy | # Housing Units | % Housing Units |
| Owner Occupied Housing Units | 40 | 61.5% |
| Renter-Occupied Housing Units | 25 | 38.5% |
| Total Occupied Housing Units | 65 | 100.0% |
Occupancy by Household Size in Nora
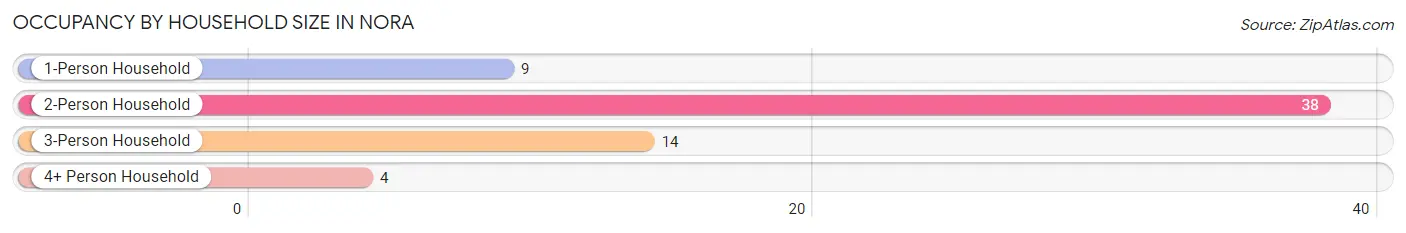
| Household Size | # Housing Units | % Housing Units |
| 1-Person Household | 9 | 13.9% |
| 2-Person Household | 38 | 58.5% |
| 3-Person Household | 14 | 21.5% |
| 4+ Person Household | 4 | 6.1% |
| Total Housing Units | 65 | 100.0% |
Occupancy by Ownership by Household Size in Nora
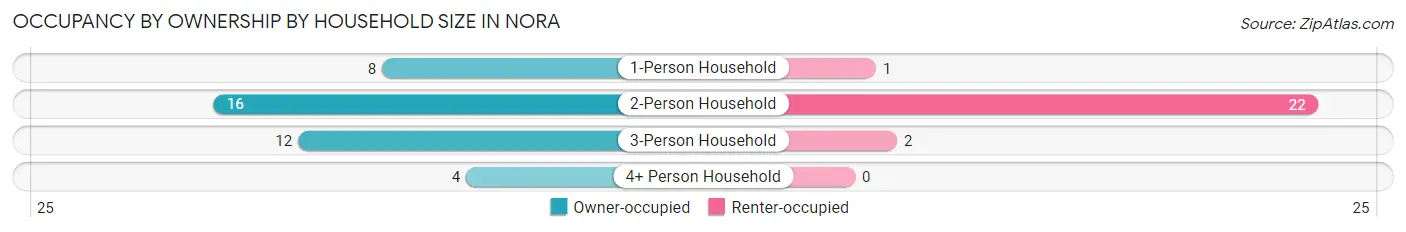
| Household Size | Owner-occupied | Renter-occupied |
| 1-Person Household | 8 (88.9%) | 1 (11.1%) |
| 2-Person Household | 16 (42.1%) | 22 (57.9%) |
| 3-Person Household | 12 (85.7%) | 2 (14.3%) |
| 4+ Person Household | 4 (100.0%) | 0 (0.0%) |
| Total Housing Units | 40 (61.5%) | 25 (38.5%) |
Occupancy by Educational Attainment in Nora
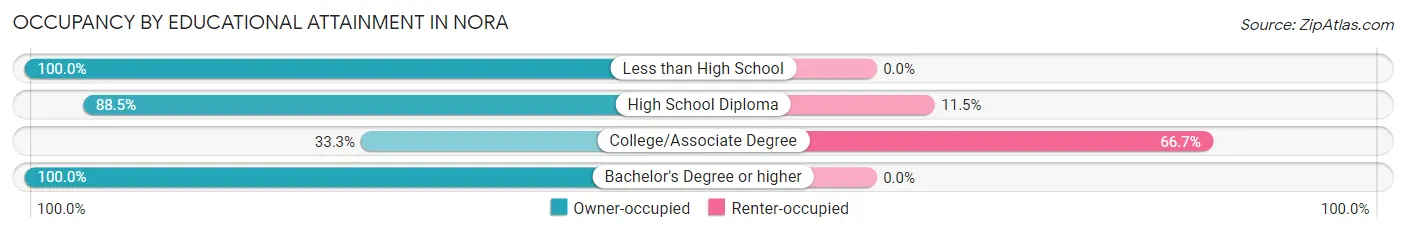
| Household Size | Owner-occupied | Renter-occupied |
| Less than High School | 5 (100.0%) | 0 (0.0%) |
| High School Diploma | 23 (88.5%) | 3 (11.5%) |
| College/Associate Degree | 11 (33.3%) | 22 (66.7%) |
| Bachelor's Degree or higher | 1 (100.0%) | 0 (0.0%) |
Occupancy by Age of Householder in Nora
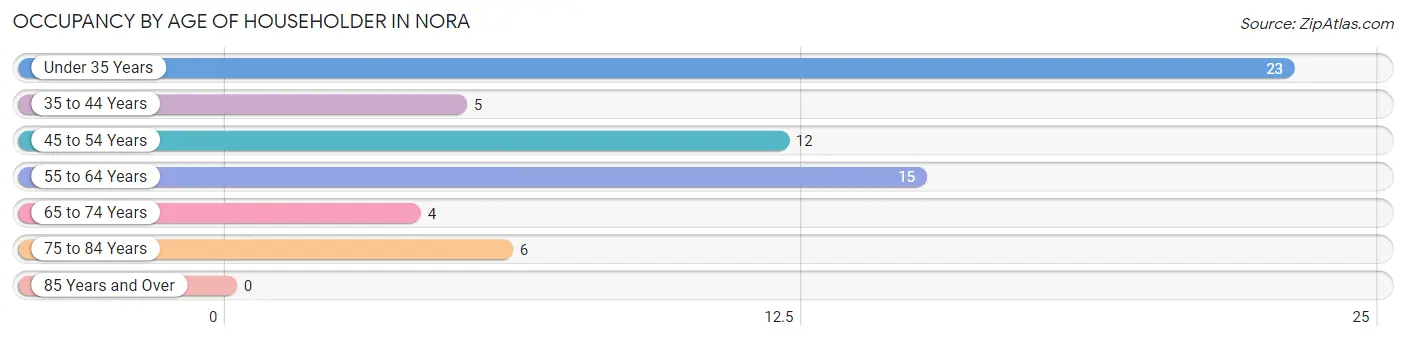
| Age Bracket | # Households | % Households |
| Under 35 Years | 23 | 35.4% |
| 35 to 44 Years | 5 | 7.7% |
| 45 to 54 Years | 12 | 18.5% |
| 55 to 64 Years | 15 | 23.1% |
| 65 to 74 Years | 4 | 6.1% |
| 75 to 84 Years | 6 | 9.2% |
| 85 Years and Over | 0 | 0.0% |
| Total | 65 | 100.0% |
Housing Finances in Nora
Median Income by Occupancy in Nora
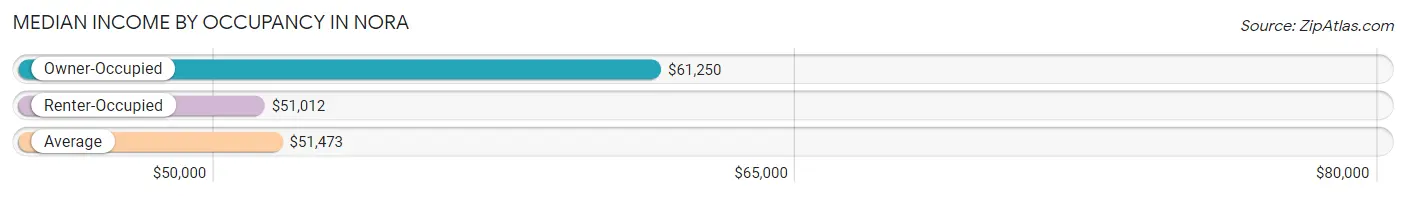
| Occupancy Type | # Households | Median Income |
| Owner-Occupied | 40 (61.5%) | $61,250 |
| Renter-Occupied | 25 (38.5%) | $51,012 |
| Average | 65 (100.0%) | $51,473 |
Occupancy by Householder Income Bracket in Nora
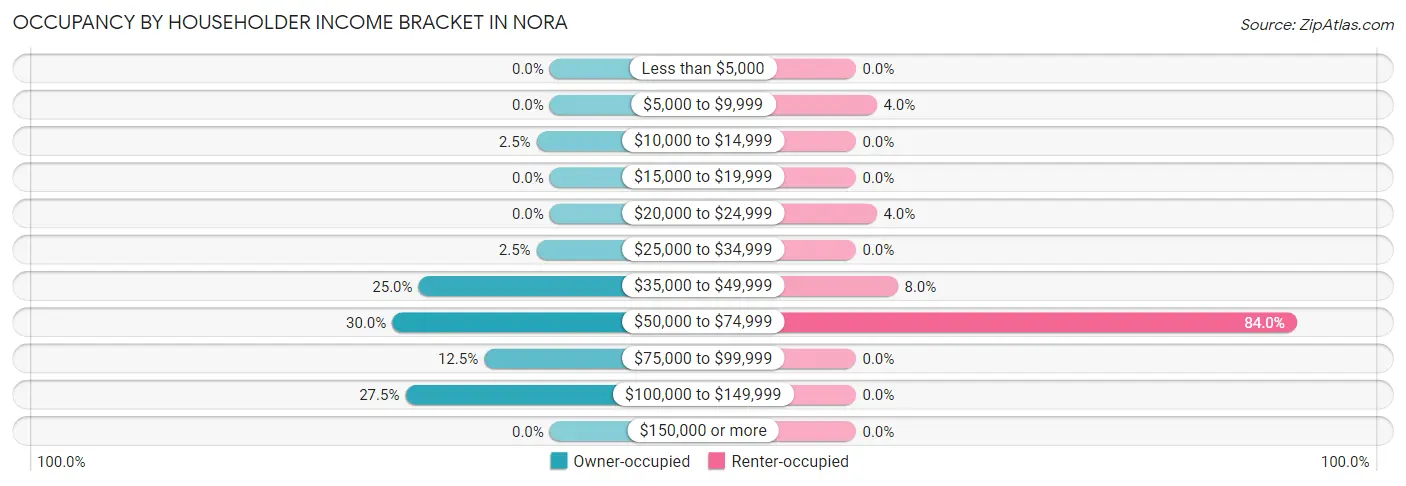
| Income Bracket | Owner-occupied | Renter-occupied |
| Less than $5,000 | 0 (0.0%) | 0 (0.0%) |
| $5,000 to $9,999 | 0 (0.0%) | 1 (4.0%) |
| $10,000 to $14,999 | 1 (2.5%) | 0 (0.0%) |
| $15,000 to $19,999 | 0 (0.0%) | 0 (0.0%) |
| $20,000 to $24,999 | 0 (0.0%) | 1 (4.0%) |
| $25,000 to $34,999 | 1 (2.5%) | 0 (0.0%) |
| $35,000 to $49,999 | 10 (25.0%) | 2 (8.0%) |
| $50,000 to $74,999 | 12 (30.0%) | 21 (84.0%) |
| $75,000 to $99,999 | 5 (12.5%) | 0 (0.0%) |
| $100,000 to $149,999 | 11 (27.5%) | 0 (0.0%) |
| $150,000 or more | 0 (0.0%) | 0 (0.0%) |
| Total | 40 (100.0%) | 25 (100.0%) |
Monthly Housing Cost Tiers in Nora
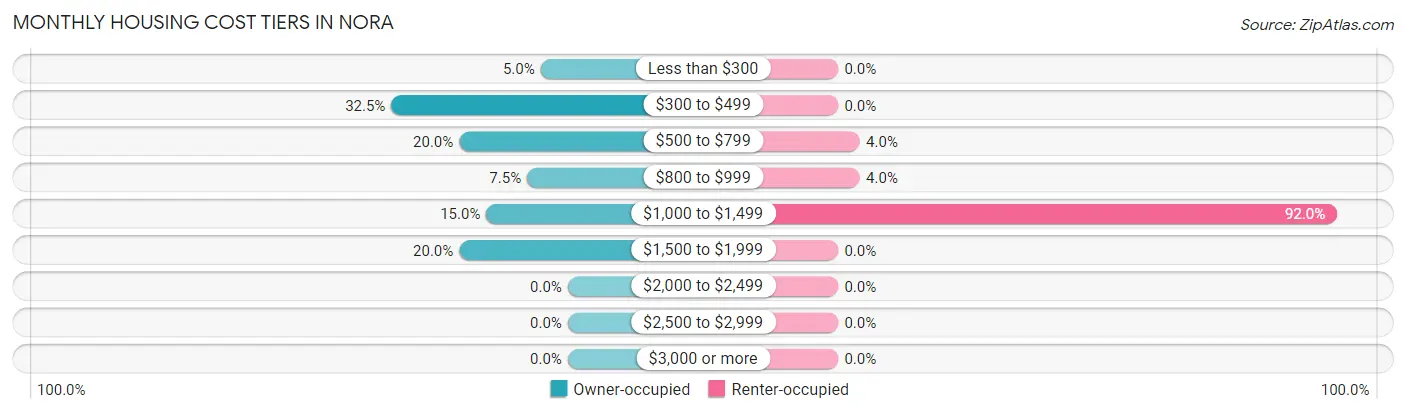
| Monthly Cost | Owner-occupied | Renter-occupied |
| Less than $300 | 2 (5.0%) | 0 (0.0%) |
| $300 to $499 | 13 (32.5%) | 0 (0.0%) |
| $500 to $799 | 8 (20.0%) | 1 (4.0%) |
| $800 to $999 | 3 (7.5%) | 1 (4.0%) |
| $1,000 to $1,499 | 6 (15.0%) | 23 (92.0%) |
| $1,500 to $1,999 | 8 (20.0%) | 0 (0.0%) |
| $2,000 to $2,499 | 0 (0.0%) | 0 (0.0%) |
| $2,500 to $2,999 | 0 (0.0%) | 0 (0.0%) |
| $3,000 or more | 0 (0.0%) | 0 (0.0%) |
| Total | 40 (100.0%) | 25 (100.0%) |
Physical Housing Characteristics in Nora
Housing Structures in Nora
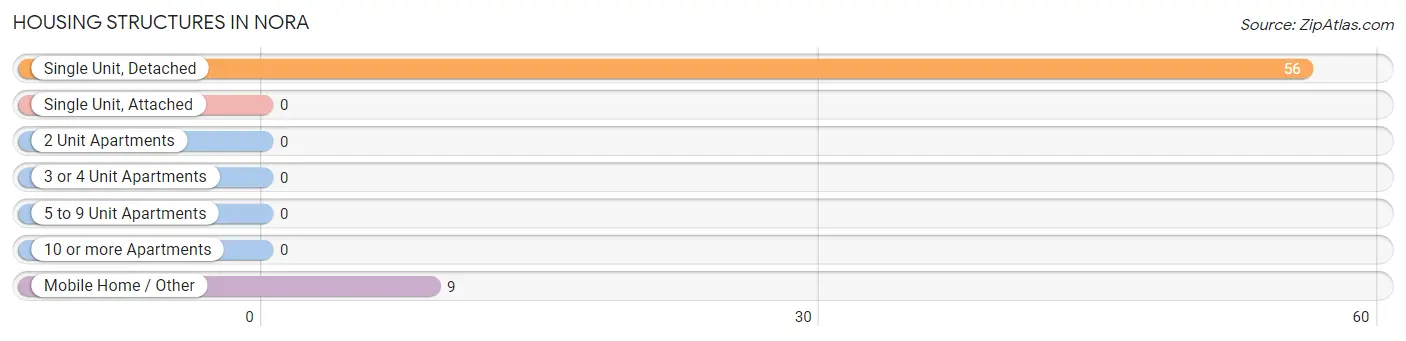
| Structure Type | # Housing Units | % Housing Units |
| Single Unit, Detached | 56 | 86.2% |
| Single Unit, Attached | 0 | 0.0% |
| 2 Unit Apartments | 0 | 0.0% |
| 3 or 4 Unit Apartments | 0 | 0.0% |
| 5 to 9 Unit Apartments | 0 | 0.0% |
| 10 or more Apartments | 0 | 0.0% |
| Mobile Home / Other | 9 | 13.9% |
| Total | 65 | 100.0% |
Housing Structures by Occupancy in Nora
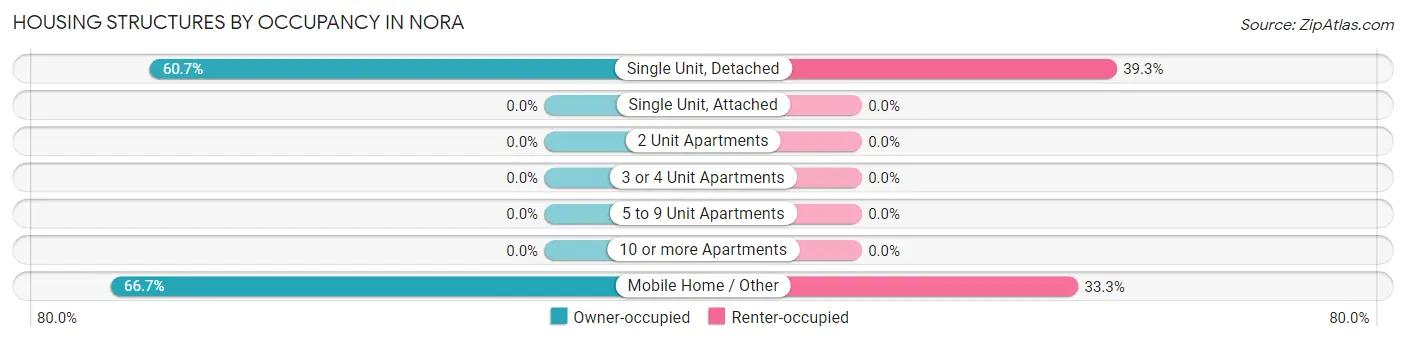
| Structure Type | Owner-occupied | Renter-occupied |
| Single Unit, Detached | 34 (60.7%) | 22 (39.3%) |
| Single Unit, Attached | 0 (0.0%) | 0 (0.0%) |
| 2 Unit Apartments | 0 (0.0%) | 0 (0.0%) |
| 3 or 4 Unit Apartments | 0 (0.0%) | 0 (0.0%) |
| 5 to 9 Unit Apartments | 0 (0.0%) | 0 (0.0%) |
| 10 or more Apartments | 0 (0.0%) | 0 (0.0%) |
| Mobile Home / Other | 6 (66.7%) | 3 (33.3%) |
| Total | 40 (61.5%) | 25 (38.5%) |
Housing Structures by Number of Rooms in Nora
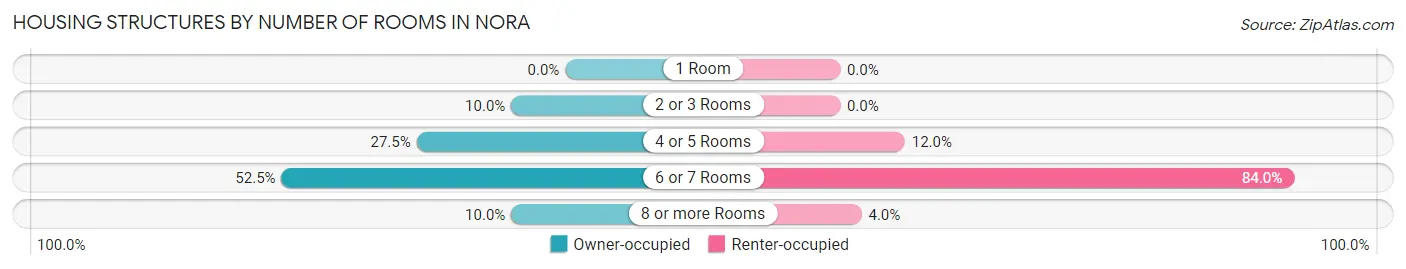
| Number of Rooms | Owner-occupied | Renter-occupied |
| 1 Room | 0 (0.0%) | 0 (0.0%) |
| 2 or 3 Rooms | 4 (10.0%) | 0 (0.0%) |
| 4 or 5 Rooms | 11 (27.5%) | 3 (12.0%) |
| 6 or 7 Rooms | 21 (52.5%) | 21 (84.0%) |
| 8 or more Rooms | 4 (10.0%) | 1 (4.0%) |
| Total | 40 (100.0%) | 25 (100.0%) |
Housing Structure by Heating Type in Nora
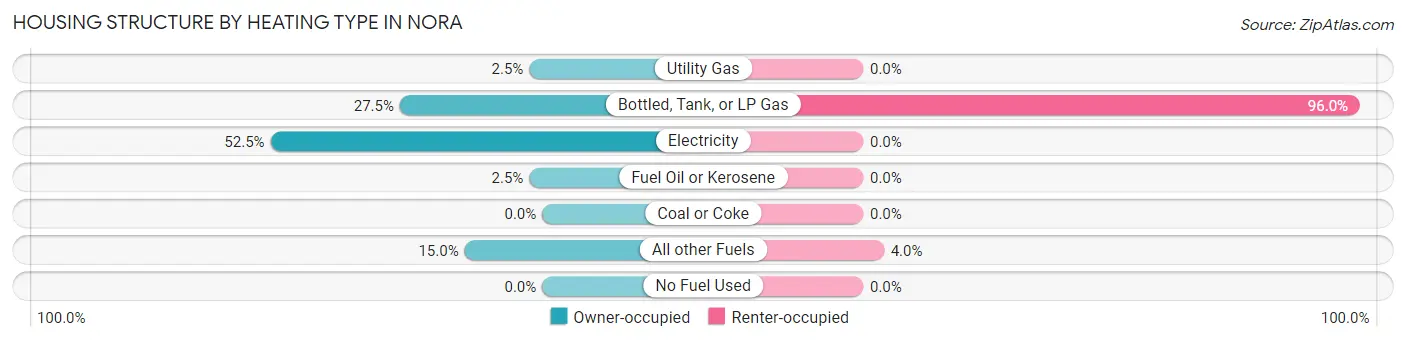
| Heating Type | Owner-occupied | Renter-occupied |
| Utility Gas | 1 (2.5%) | 0 (0.0%) |
| Bottled, Tank, or LP Gas | 11 (27.5%) | 24 (96.0%) |
| Electricity | 21 (52.5%) | 0 (0.0%) |
| Fuel Oil or Kerosene | 1 (2.5%) | 0 (0.0%) |
| Coal or Coke | 0 (0.0%) | 0 (0.0%) |
| All other Fuels | 6 (15.0%) | 1 (4.0%) |
| No Fuel Used | 0 (0.0%) | 0 (0.0%) |
| Total | 40 (100.0%) | 25 (100.0%) |
Household Vehicle Usage in Nora
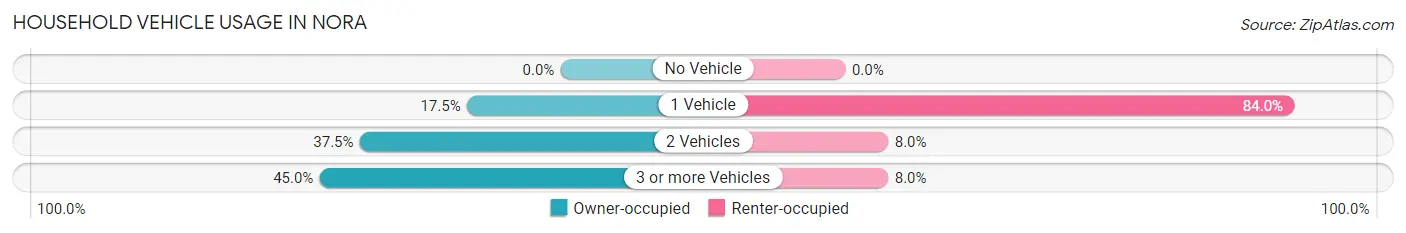
| Vehicles per Household | Owner-occupied | Renter-occupied |
| No Vehicle | 0 (0.0%) | 0 (0.0%) |
| 1 Vehicle | 7 (17.5%) | 21 (84.0%) |
| 2 Vehicles | 15 (37.5%) | 2 (8.0%) |
| 3 or more Vehicles | 18 (45.0%) | 2 (8.0%) |
| Total | 40 (100.0%) | 25 (100.0%) |
Real Estate & Mortgages in Nora
Real Estate and Mortgage Overview in Nora
| Characteristic | Without Mortgage | With Mortgage |
| Housing Units | 18 | 22 |
| Median Property Value | $67,500 | $80,000 |
| Median Household Income | $50,625 | $0 |
| Monthly Housing Costs | $375 | $0 |
| Real Estate Taxes | $1,800 | $1 |
Property Value by Mortgage Status in Nora
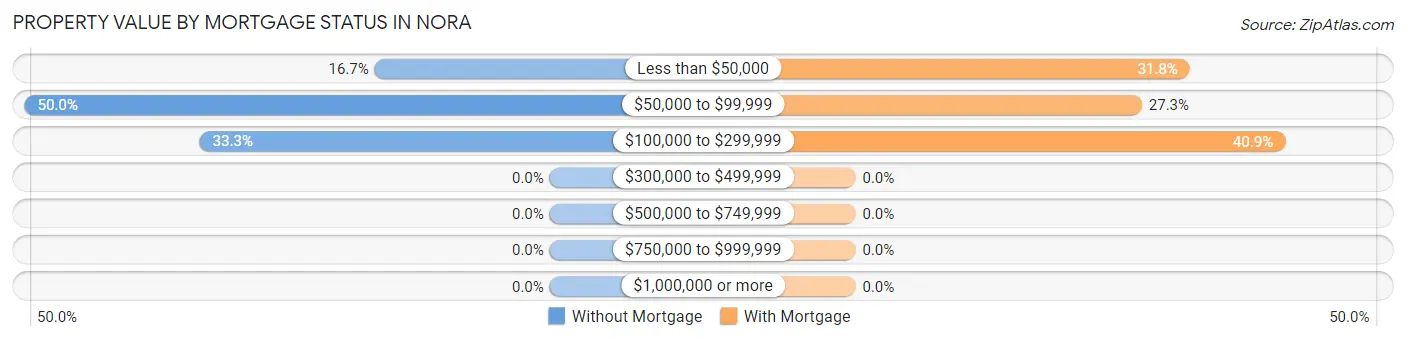
| Property Value | Without Mortgage | With Mortgage |
| Less than $50,000 | 3 (16.7%) | 7 (31.8%) |
| $50,000 to $99,999 | 9 (50.0%) | 6 (27.3%) |
| $100,000 to $299,999 | 6 (33.3%) | 9 (40.9%) |
| $300,000 to $499,999 | 0 (0.0%) | 0 (0.0%) |
| $500,000 to $749,999 | 0 (0.0%) | 0 (0.0%) |
| $750,000 to $999,999 | 0 (0.0%) | 0 (0.0%) |
| $1,000,000 or more | 0 (0.0%) | 0 (0.0%) |
| Total | 18 (100.0%) | 22 (100.0%) |
Household Income by Mortgage Status in Nora
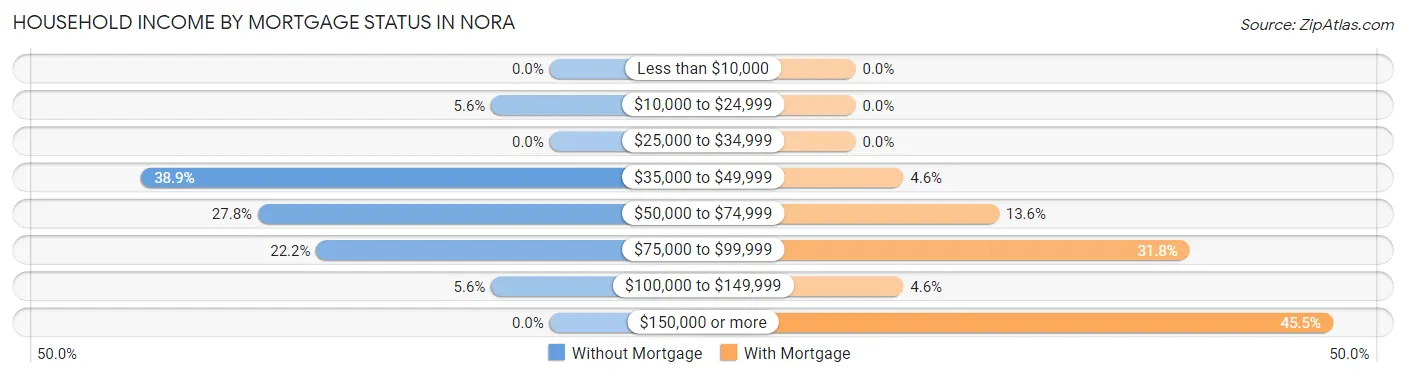
| Household Income | Without Mortgage | With Mortgage |
| Less than $10,000 | 0 (0.0%) | 0 (0.0%) |
| $10,000 to $24,999 | 1 (5.6%) | 0 (0.0%) |
| $25,000 to $34,999 | 0 (0.0%) | 0 (0.0%) |
| $35,000 to $49,999 | 7 (38.9%) | 1 (4.5%) |
| $50,000 to $74,999 | 5 (27.8%) | 3 (13.6%) |
| $75,000 to $99,999 | 4 (22.2%) | 7 (31.8%) |
| $100,000 to $149,999 | 1 (5.6%) | 1 (4.5%) |
| $150,000 or more | 0 (0.0%) | 10 (45.5%) |
| Total | 18 (100.0%) | 22 (100.0%) |
Property Value to Household Income Ratio in Nora
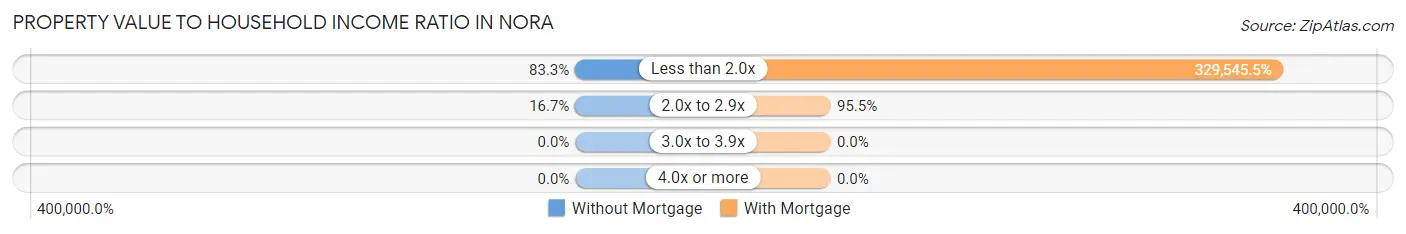
| Value-to-Income Ratio | Without Mortgage | With Mortgage |
| Less than 2.0x | 15 (83.3%) | 72,500 (329,545.4%) |
| 2.0x to 2.9x | 3 (16.7%) | 21 (95.5%) |
| 3.0x to 3.9x | 0 (0.0%) | 0 (0.0%) |
| 4.0x or more | 0 (0.0%) | 0 (0.0%) |
| Total | 18 (100.0%) | 22 (100.0%) |
Real Estate Taxes by Mortgage Status in Nora
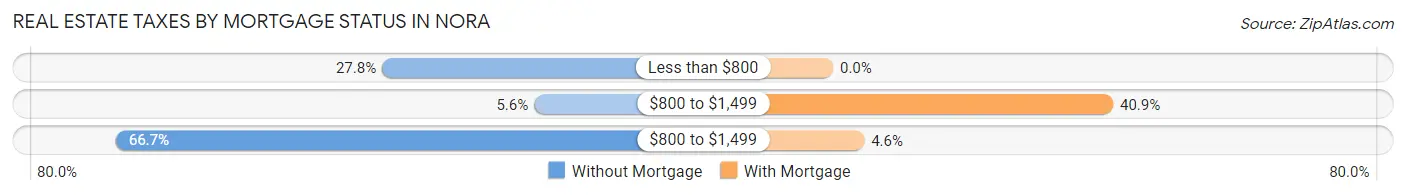
| Property Taxes | Without Mortgage | With Mortgage |
| Less than $800 | 5 (27.8%) | 0 (0.0%) |
| $800 to $1,499 | 1 (5.6%) | 9 (40.9%) |
| $800 to $1,499 | 12 (66.7%) | 1 (4.5%) |
| Total | 18 (100.0%) | 22 (100.0%) |
Health & Disability in Nora
Health Insurance Coverage by Age in Nora
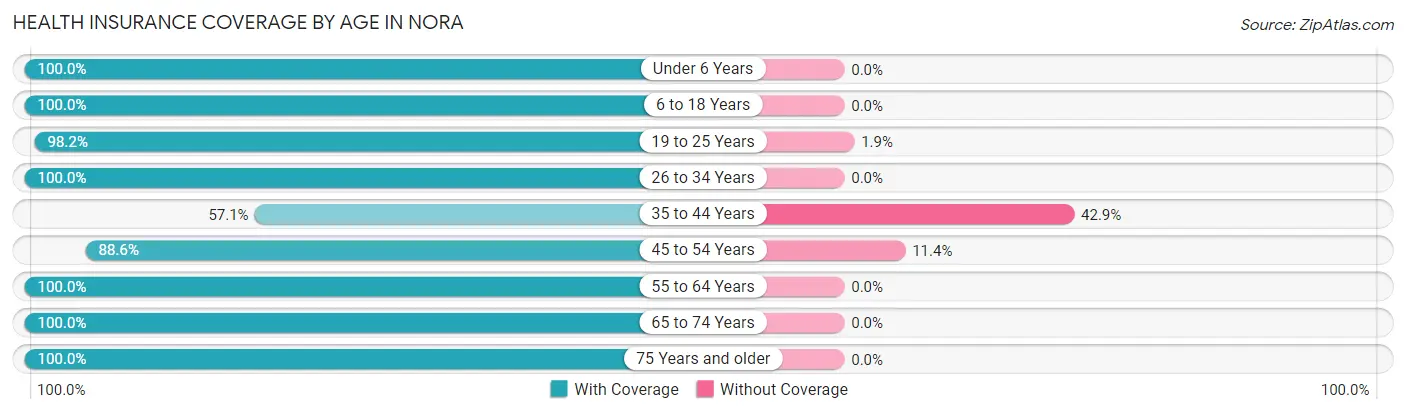
| Age Bracket | With Coverage | Without Coverage |
| Under 6 Years | 4 (100.0%) | 0 (0.0%) |
| 6 to 18 Years | 26 (100.0%) | 0 (0.0%) |
| 19 to 25 Years | 53 (98.2%) | 1 (1.8%) |
| 26 to 34 Years | 1 (100.0%) | 0 (0.0%) |
| 35 to 44 Years | 4 (57.1%) | 3 (42.9%) |
| 45 to 54 Years | 39 (88.6%) | 5 (11.4%) |
| 55 to 64 Years | 21 (100.0%) | 0 (0.0%) |
| 65 to 74 Years | 13 (100.0%) | 0 (0.0%) |
| 75 Years and older | 6 (100.0%) | 0 (0.0%) |
| Total | 167 (94.9%) | 9 (5.1%) |
Health Insurance Coverage by Citizenship Status in Nora
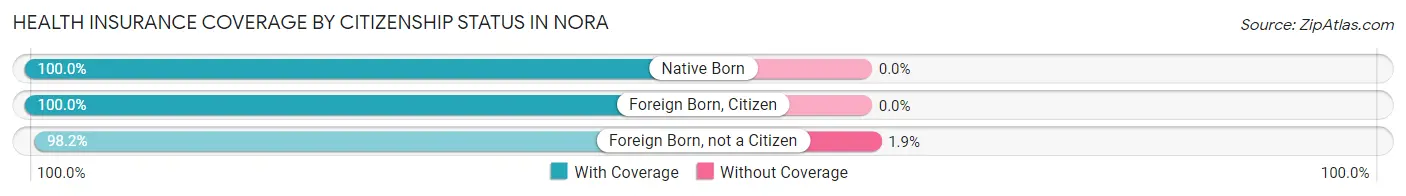
| Citizenship Status | With Coverage | Without Coverage |
| Native Born | 4 (100.0%) | 0 (0.0%) |
| Foreign Born, Citizen | 26 (100.0%) | 0 (0.0%) |
| Foreign Born, not a Citizen | 53 (98.2%) | 1 (1.8%) |
Health Insurance Coverage by Household Income in Nora
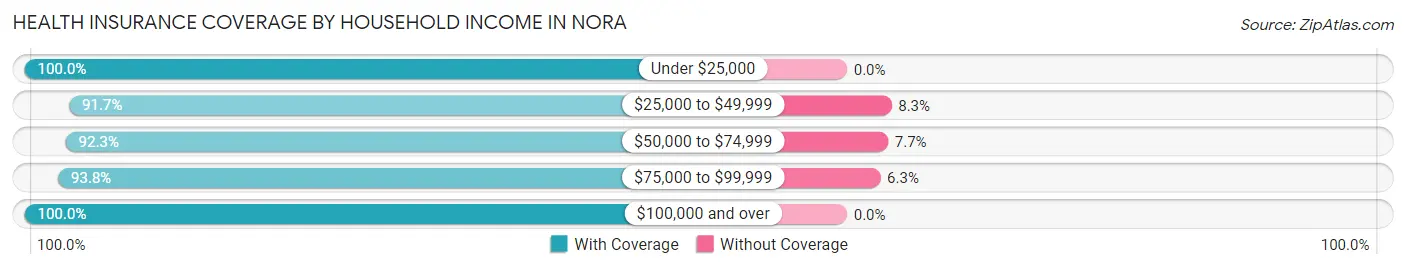
| Household Income | With Coverage | Without Coverage |
| Under $25,000 | 4 (100.0%) | 0 (0.0%) |
| $25,000 to $49,999 | 22 (91.7%) | 2 (8.3%) |
| $50,000 to $74,999 | 72 (92.3%) | 6 (7.7%) |
| $75,000 to $99,999 | 15 (93.8%) | 1 (6.2%) |
| $100,000 and over | 54 (100.0%) | 0 (0.0%) |
Public vs Private Health Insurance Coverage by Age in Nora
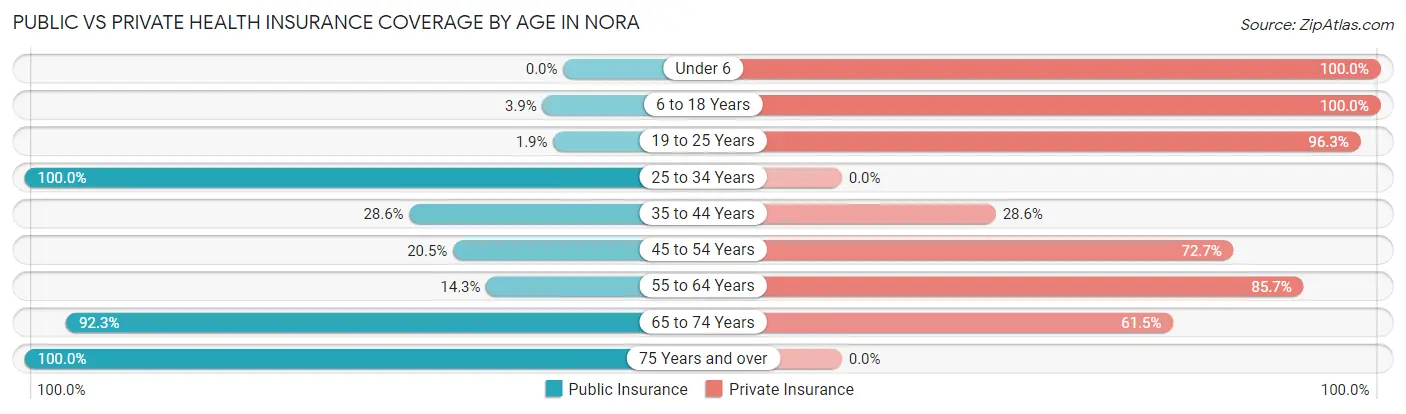
| Age Bracket | Public Insurance | Private Insurance |
| Under 6 | 0 (0.0%) | 4 (100.0%) |
| 6 to 18 Years | 1 (3.8%) | 26 (100.0%) |
| 19 to 25 Years | 1 (1.8%) | 52 (96.3%) |
| 25 to 34 Years | 1 (100.0%) | 0 (0.0%) |
| 35 to 44 Years | 2 (28.6%) | 2 (28.6%) |
| 45 to 54 Years | 9 (20.4%) | 32 (72.7%) |
| 55 to 64 Years | 3 (14.3%) | 18 (85.7%) |
| 65 to 74 Years | 12 (92.3%) | 8 (61.5%) |
| 75 Years and over | 6 (100.0%) | 0 (0.0%) |
| Total | 35 (19.9%) | 142 (80.7%) |
Disability Status by Sex by Age in Nora
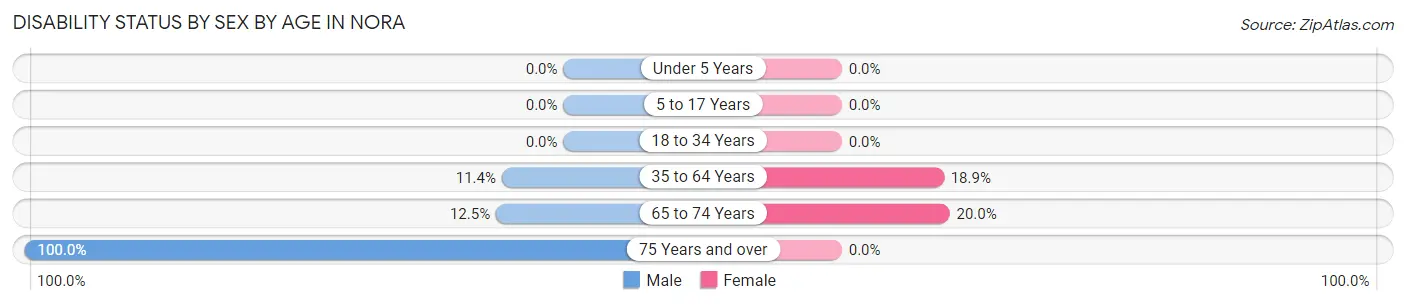
| Age Bracket | Male | Female |
| Under 5 Years | 0 (0.0%) | 0 (0.0%) |
| 5 to 17 Years | 0 (0.0%) | 0 (0.0%) |
| 18 to 34 Years | 0 (0.0%) | 0 (0.0%) |
| 35 to 64 Years | 4 (11.4%) | 7 (18.9%) |
| 65 to 74 Years | 1 (12.5%) | 1 (20.0%) |
| 75 Years and over | 6 (100.0%) | 0 (0.0%) |
Disability Class by Sex by Age in Nora
Disability Class: Hearing Difficulty
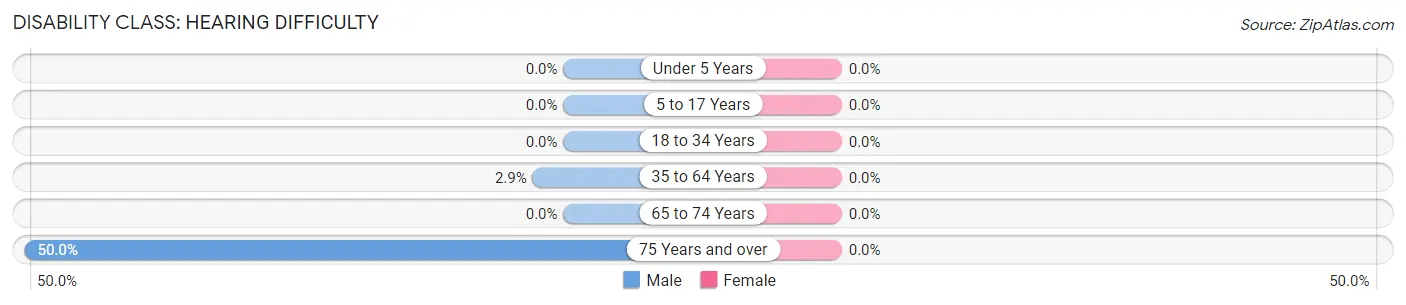
| Age Bracket | Male | Female |
| Under 5 Years | 0 (0.0%) | 0 (0.0%) |
| 5 to 17 Years | 0 (0.0%) | 0 (0.0%) |
| 18 to 34 Years | 0 (0.0%) | 0 (0.0%) |
| 35 to 64 Years | 1 (2.9%) | 0 (0.0%) |
| 65 to 74 Years | 0 (0.0%) | 0 (0.0%) |
| 75 Years and over | 3 (50.0%) | 0 (0.0%) |
Disability Class: Vision Difficulty
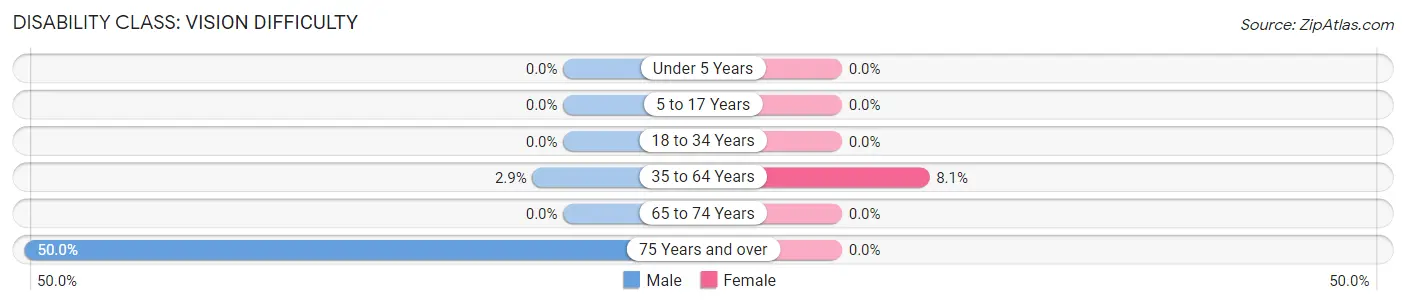
| Age Bracket | Male | Female |
| Under 5 Years | 0 (0.0%) | 0 (0.0%) |
| 5 to 17 Years | 0 (0.0%) | 0 (0.0%) |
| 18 to 34 Years | 0 (0.0%) | 0 (0.0%) |
| 35 to 64 Years | 1 (2.9%) | 3 (8.1%) |
| 65 to 74 Years | 0 (0.0%) | 0 (0.0%) |
| 75 Years and over | 3 (50.0%) | 0 (0.0%) |
Disability Class: Cognitive Difficulty
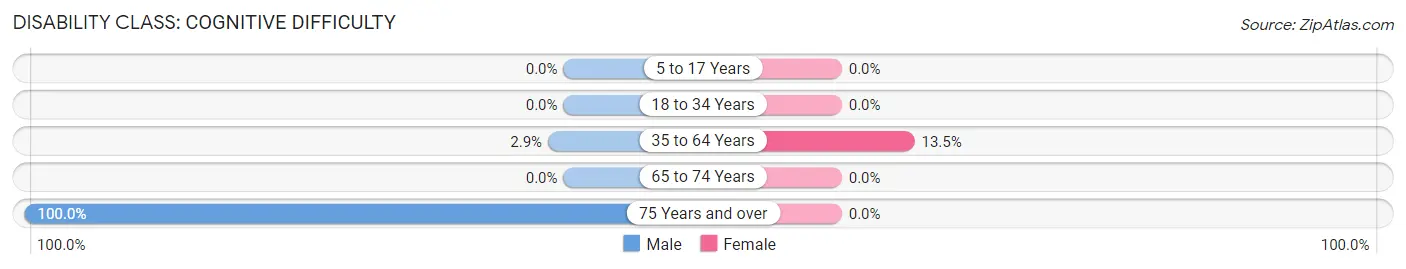
| Age Bracket | Male | Female |
| 5 to 17 Years | 0 (0.0%) | 0 (0.0%) |
| 18 to 34 Years | 0 (0.0%) | 0 (0.0%) |
| 35 to 64 Years | 1 (2.9%) | 5 (13.5%) |
| 65 to 74 Years | 0 (0.0%) | 0 (0.0%) |
| 75 Years and over | 6 (100.0%) | 0 (0.0%) |
Disability Class: Ambulatory Difficulty
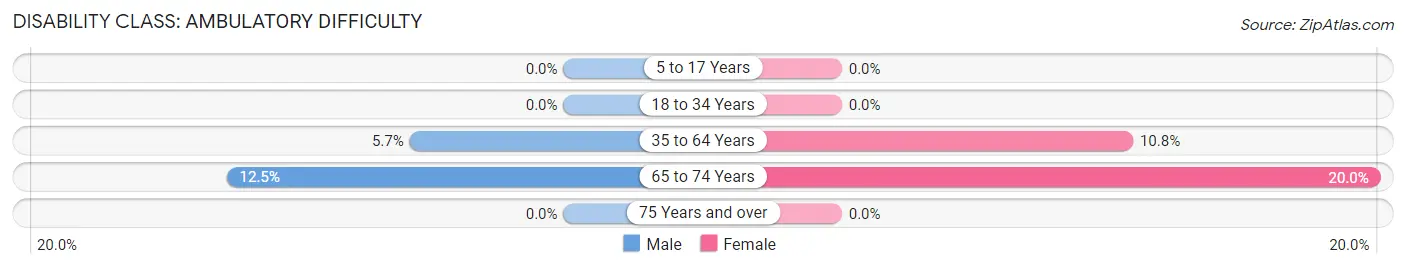
| Age Bracket | Male | Female |
| 5 to 17 Years | 0 (0.0%) | 0 (0.0%) |
| 18 to 34 Years | 0 (0.0%) | 0 (0.0%) |
| 35 to 64 Years | 2 (5.7%) | 4 (10.8%) |
| 65 to 74 Years | 1 (12.5%) | 1 (20.0%) |
| 75 Years and over | 0 (0.0%) | 0 (0.0%) |
Disability Class: Self-Care Difficulty
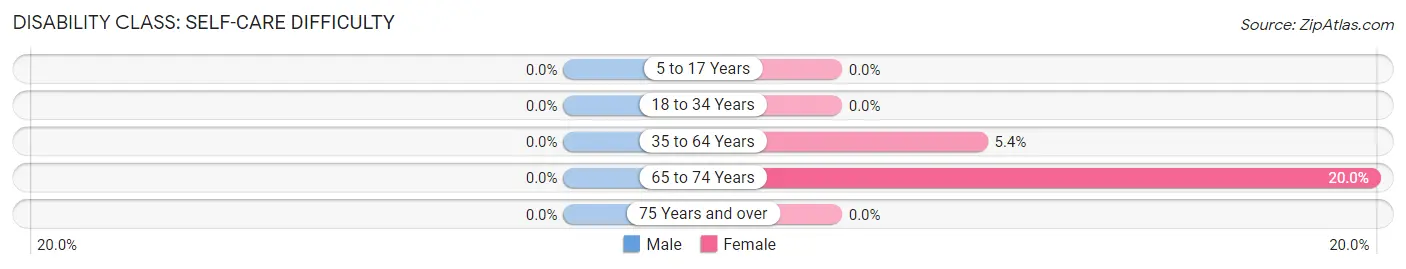
| Age Bracket | Male | Female |
| 5 to 17 Years | 0 (0.0%) | 0 (0.0%) |
| 18 to 34 Years | 0 (0.0%) | 0 (0.0%) |
| 35 to 64 Years | 0 (0.0%) | 2 (5.4%) |
| 65 to 74 Years | 0 (0.0%) | 1 (20.0%) |
| 75 Years and over | 0 (0.0%) | 0 (0.0%) |
Technology Access in Nora
Computing Device Access in Nora
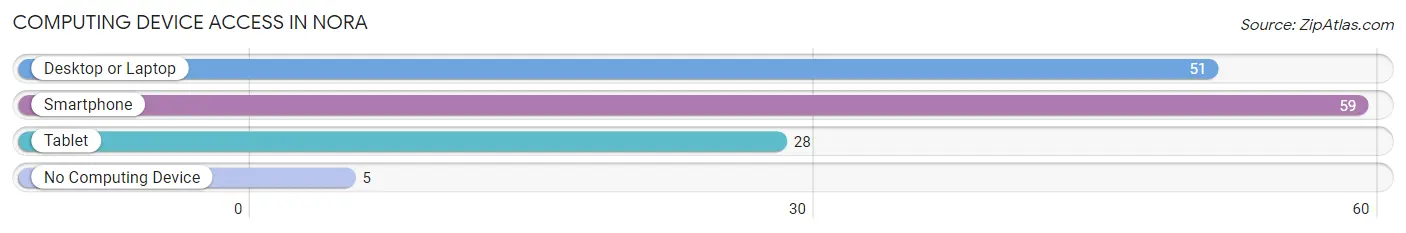
| Device Type | # Households | % Households |
| Desktop or Laptop | 51 | 78.5% |
| Smartphone | 59 | 90.8% |
| Tablet | 28 | 43.1% |
| No Computing Device | 5 | 7.7% |
| Total | 65 | 100.0% |
Internet Access in Nora
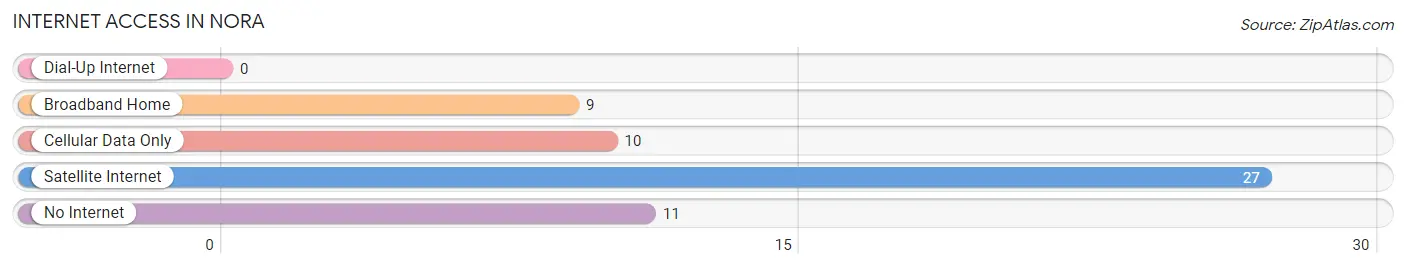
| Internet Type | # Households | % Households |
| Dial-Up Internet | 0 | 0.0% |
| Broadband Home | 9 | 13.9% |
| Cellular Data Only | 10 | 15.4% |
| Satellite Internet | 27 | 41.5% |
| No Internet | 11 | 16.9% |
| Total | 65 | 100.0% |
Nora Summary
Nora is a small village located in LaSalle County, Illinois. It is situated in the north-central part of the state, about 60 miles southwest of Chicago. The village has a population of approximately 1,000 people and covers an area of 0.6 square miles.
History
Nora was founded in 1854 by a group of settlers from New York. The village was named after the wife of one of the settlers, Nora Smith. The settlers were attracted to the area due to its fertile soil and abundant natural resources.
The village grew slowly but steadily over the years, and by the early 1900s, it had become a thriving agricultural community. The village was home to several businesses, including a general store, a blacksmith shop, and a grain elevator.
In the late 1950s, the village began to experience a period of decline. Many of the businesses closed, and the population began to decline. However, in the late 1990s, the village began to experience a resurgence. New businesses opened, and the population began to increase.
Geography
Nora is located in the north-central part of Illinois, about 60 miles southwest of Chicago. The village is situated in a rural area, surrounded by farmland and small towns. The village is located on the banks of the Fox River, which flows through the area.
The village has a total area of 0.6 square miles, all of which is land. The village is located at an elevation of 690 feet above sea level.
Economy
Nora’s economy is largely based on agriculture. The village is home to several farms, which produce a variety of crops, including corn, soybeans, and wheat. The village also has several small businesses, including a general store, a hardware store, and a restaurant.
Demographics
As of the 2010 census, Nora had a population of 1,000 people. The racial makeup of the village was 97.2% White, 0.7% African American, 0.3% Native American, 0.2% Asian, and 1.6% from other races. The median household income was $45,000, and the median family income was $50,000.
Conclusion
Nora is a small village located in LaSalle County, Illinois. It is situated in the north-central part of the state, about 60 miles southwest of Chicago. The village has a population of approximately 1,000 people and covers an area of 0.6 square miles. The village was founded in 1854 and has experienced a period of decline and resurgence over the years. The village’s economy is largely based on agriculture, and the median household income is $45,000.
Common Questions
What is Per Capita Income in Nora?
Per Capita income in Nora is $26,199.
What is the Median Family Income in Nora?
Median Family Income in Nora is $66,250.
What is the Median Household income in Nora?
Median Household Income in Nora is $51,473.
What is Income or Wage Gap in Nora?
Income or Wage Gap in Nora is 9.2%.
Women in Nora earn 90.8 cents for every dollar earned by a man.
What is Inequality or Gini Index in Nora?
Inequality or Gini Index in Nora is 0.22.
What is the Total Population of Nora?
Total Population of Nora is 176.
What is the Total Male Population of Nora?
Total Male Population of Nora is 120.
What is the Total Female Population of Nora?
Total Female Population of Nora is 56.
What is the Ratio of Males per 100 Females in Nora?
There are 214.29 Males per 100 Females in Nora.
What is the Ratio of Females per 100 Males in Nora?
There are 46.67 Females per 100 Males in Nora.
What is the Median Population Age in Nora?
Median Population Age in Nora is 42.5 Years.
What is the Average Family Size in Nora
Average Family Size in Nora is 3.5 People.
What is the Average Household Size in Nora
Average Household Size in Nora is 2.7 People.
How Large is the Labor Force in Nora?
There are 120 People in the Labor Forcein in Nora.
What is the Percentage of People in the Labor Force in Nora?
74.1% of People are in the Labor Force in Nora.
What is the Unemployment Rate in Nora?
Unemployment Rate in Nora is 2.5%.