Nauvoo, IL Map & Demographics
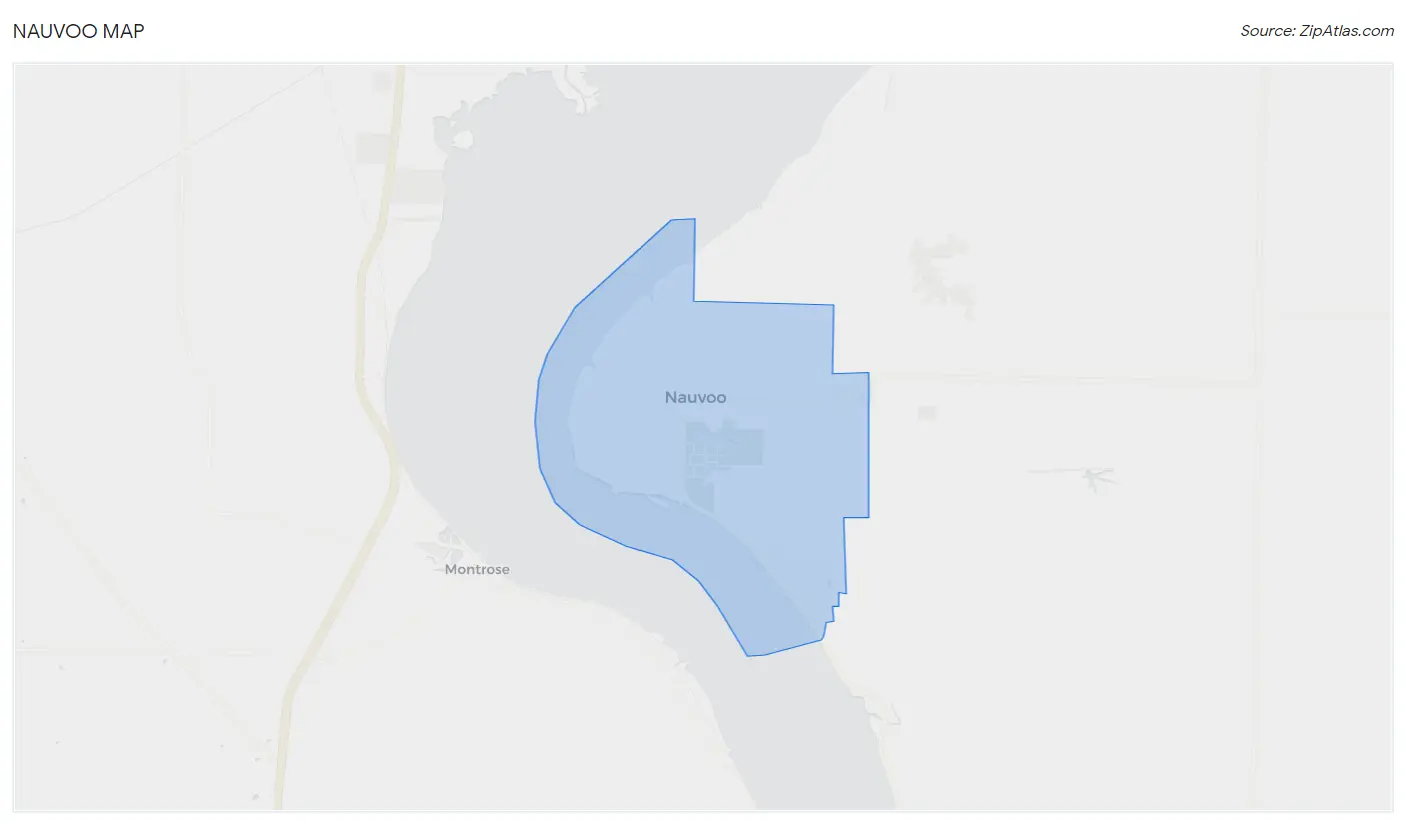
Nauvoo Map
Nauvoo Overview
$24,065
PER CAPITA INCOME
$60,000
AVG FAMILY INCOME
$46,429
AVG HOUSEHOLD INCOME
$9,343
FAMILY INCOME DEFICIT
0.49
INEQUALITY / GINI INDEX
861
TOTAL POPULATION
433
MALE POPULATION
428
FEMALE POPULATION
101.17
MALES / 100 FEMALES
98.85
FEMALES / 100 MALES
40.2
MEDIAN AGE
3.2
AVG FAMILY SIZE
2.8
AVG HOUSEHOLD SIZE
292
LABOR FORCE [ PEOPLE ]
42.5%
PERCENT IN LABOR FORCE
2.4%
UNEMPLOYMENT RATE
Nauvoo Zip Codes
Nauvoo Area Codes
Income in Nauvoo
Income Overview in Nauvoo
Per Capita Income in Nauvoo is $24,065, while median incomes of families and households are $60,000 and $46,429 respectively.
| Characteristic | Number | Measure |
| Per Capita Income | 861 | $24,065 |
| Median Family Income | 218 | $60,000 |
| Mean Family Income | 218 | $77,318 |
| Median Household Income | 296 | $46,429 |
| Mean Household Income | 296 | $65,261 |
| Income Deficit | 218 | $9,343 |
| Wage / Income Gap (%) | 861 | 0.00% |
| Wage / Income Gap ($) | 861 | 100.00¢ per $1 |
| Gini / Inequality Index | 861 | 0.49 |
Earnings by Sex in Nauvoo
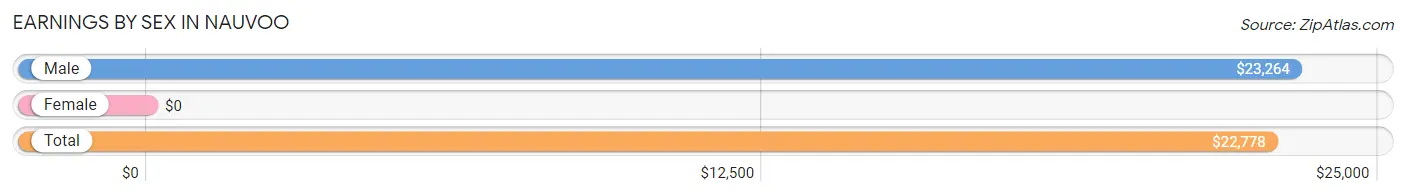
| Sex | Number | Average Earnings |
| Male | 141 (44.9%) | $23,264 |
| Female | 173 (55.1%) | $0 |
| Total | 314 (100.0%) | $22,778 |
Earnings by Sex by Income Bracket in Nauvoo
The most common earnings brackets in Nauvoo are $7,500 to $9,999 for men (20 | 14.2%) and $2,499 or less for women (31 | 17.9%).
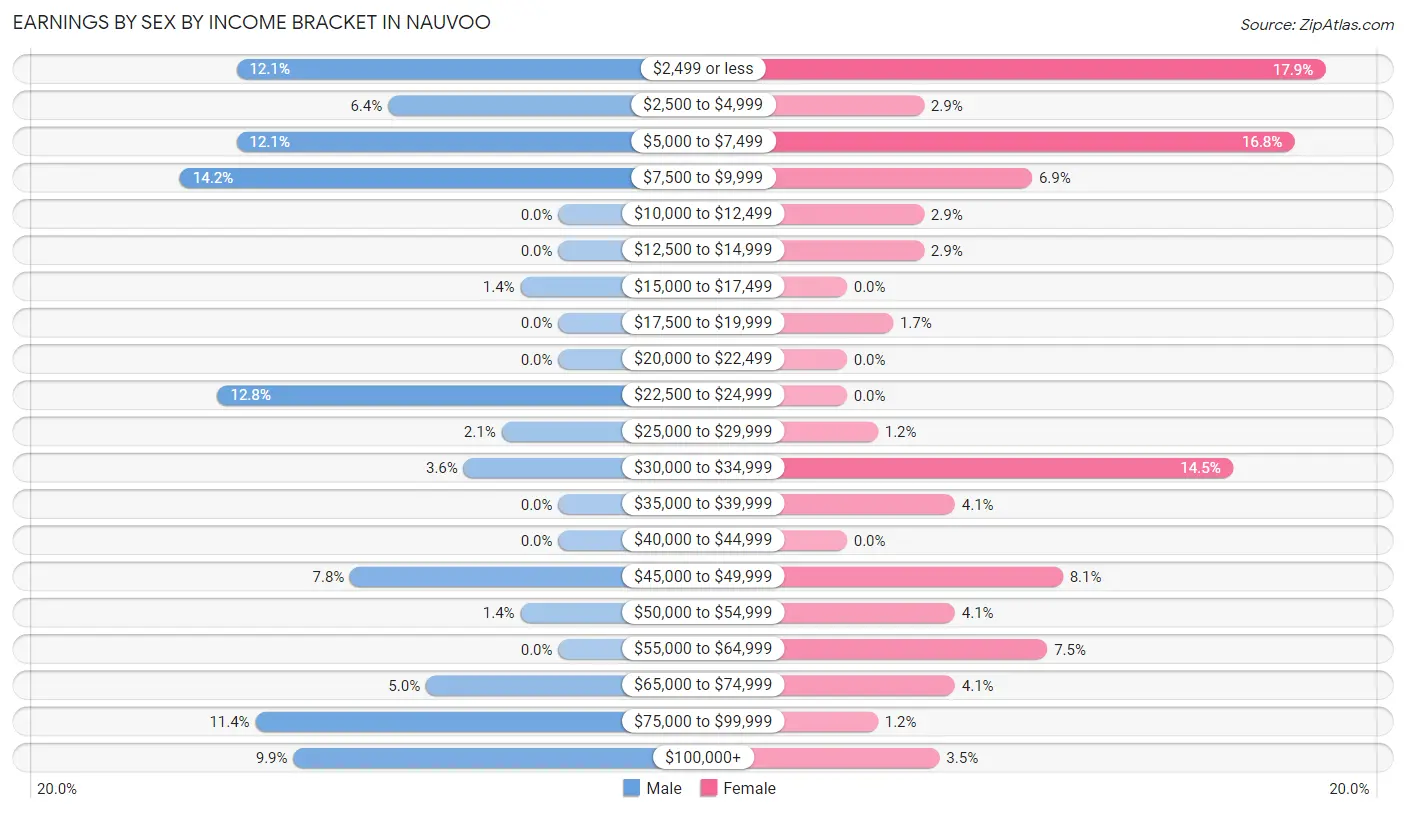
| Income | Male | Female |
| $2,499 or less | 17 (12.1%) | 31 (17.9%) |
| $2,500 to $4,999 | 9 (6.4%) | 5 (2.9%) |
| $5,000 to $7,499 | 17 (12.1%) | 29 (16.8%) |
| $7,500 to $9,999 | 20 (14.2%) | 12 (6.9%) |
| $10,000 to $12,499 | 0 (0.0%) | 5 (2.9%) |
| $12,500 to $14,999 | 0 (0.0%) | 5 (2.9%) |
| $15,000 to $17,499 | 2 (1.4%) | 0 (0.0%) |
| $17,500 to $19,999 | 0 (0.0%) | 3 (1.7%) |
| $20,000 to $22,499 | 0 (0.0%) | 0 (0.0%) |
| $22,500 to $24,999 | 18 (12.8%) | 0 (0.0%) |
| $25,000 to $29,999 | 3 (2.1%) | 2 (1.2%) |
| $30,000 to $34,999 | 5 (3.5%) | 25 (14.4%) |
| $35,000 to $39,999 | 0 (0.0%) | 7 (4.1%) |
| $40,000 to $44,999 | 0 (0.0%) | 0 (0.0%) |
| $45,000 to $49,999 | 11 (7.8%) | 14 (8.1%) |
| $50,000 to $54,999 | 2 (1.4%) | 7 (4.1%) |
| $55,000 to $64,999 | 0 (0.0%) | 13 (7.5%) |
| $65,000 to $74,999 | 7 (5.0%) | 7 (4.1%) |
| $75,000 to $99,999 | 16 (11.4%) | 2 (1.2%) |
| $100,000+ | 14 (9.9%) | 6 (3.5%) |
| Total | 141 (100.0%) | 173 (100.0%) |
Earnings by Sex by Educational Attainment in Nauvoo
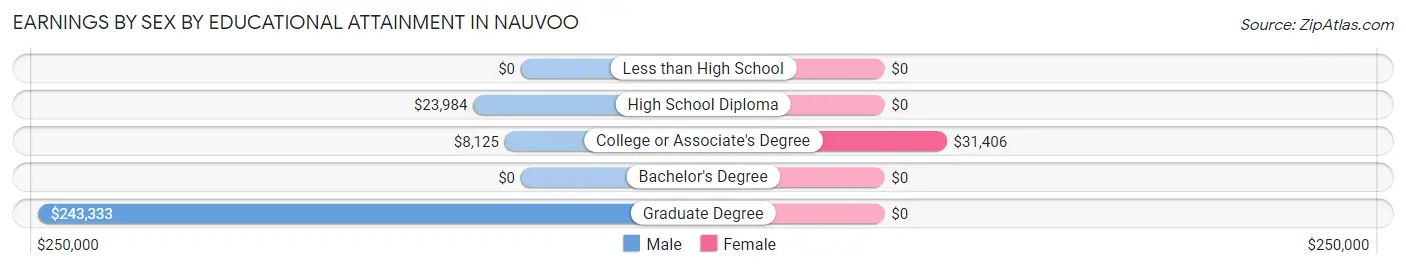
| Educational Attainment | Male Income | Female Income |
| Less than High School | - | - |
| High School Diploma | $23,984 | $0 |
| College or Associate's Degree | $8,125 | $31,406 |
| Bachelor's Degree | - | - |
| Graduate Degree | $243,333 | $0 |
| Total | - | - |
Family Income in Nauvoo
Family Income Brackets in Nauvoo
According to the Nauvoo family income data, there are 37 families falling into the $50,000 to $74,999 income range, which is the most common income bracket and makes up 17.0% of all families. Conversely, the less than $10,000 income bracket is the least frequent group with only 7 families (3.2%) belonging to this category.
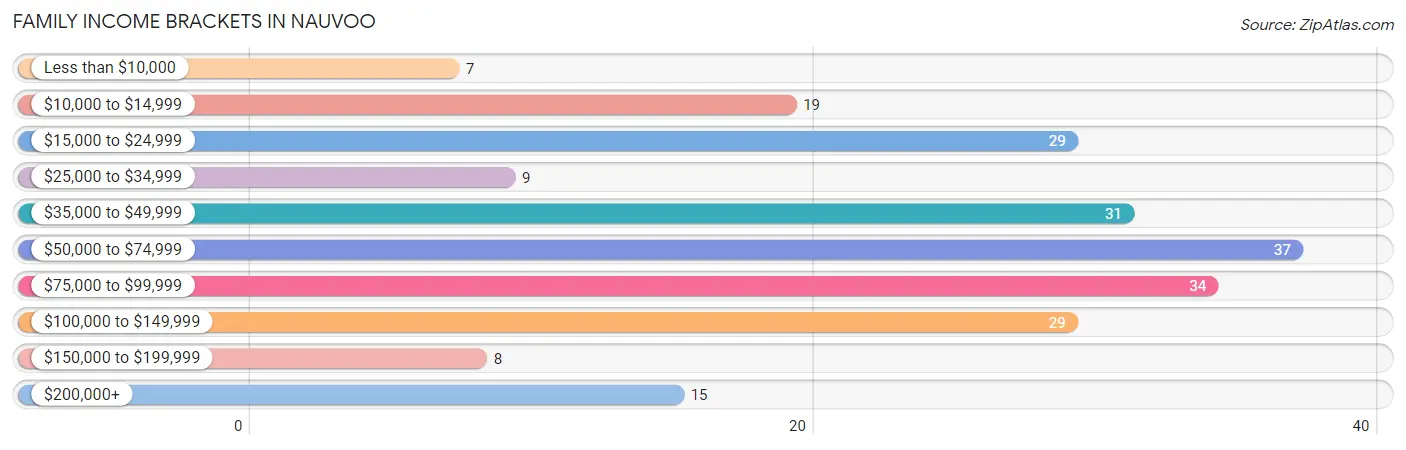
| Income Bracket | # Families | % Families |
| Less than $10,000 | 7 | 3.2% |
| $10,000 to $14,999 | 19 | 8.7% |
| $15,000 to $24,999 | 29 | 13.3% |
| $25,000 to $34,999 | 9 | 4.1% |
| $35,000 to $49,999 | 31 | 14.2% |
| $50,000 to $74,999 | 37 | 17.0% |
| $75,000 to $99,999 | 34 | 15.6% |
| $100,000 to $149,999 | 29 | 13.3% |
| $150,000 to $199,999 | 8 | 3.7% |
| $200,000+ | 15 | 6.9% |
Family Income by Famaliy Size in Nauvoo
7+ person families (11 | 5.1%) account for the highest median family income in Nauvoo with $98,542 per family, while 2-person families (125 | 57.3%) have the highest median income of $29,956 per family member.
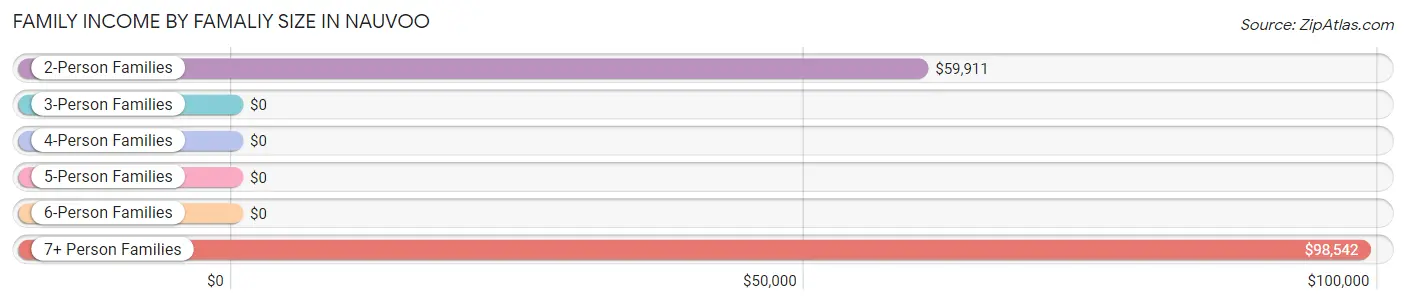
| Income Bracket | # Families | Median Income |
| 2-Person Families | 125 (57.3%) | $59,911 |
| 3-Person Families | 49 (22.5%) | $0 |
| 4-Person Families | 6 (2.8%) | $0 |
| 5-Person Families | 27 (12.4%) | $0 |
| 6-Person Families | 0 (0.0%) | $0 |
| 7+ Person Families | 11 (5.1%) | $98,542 |
| Total | 218 (100.0%) | $60,000 |
Family Income by Number of Earners in Nauvoo
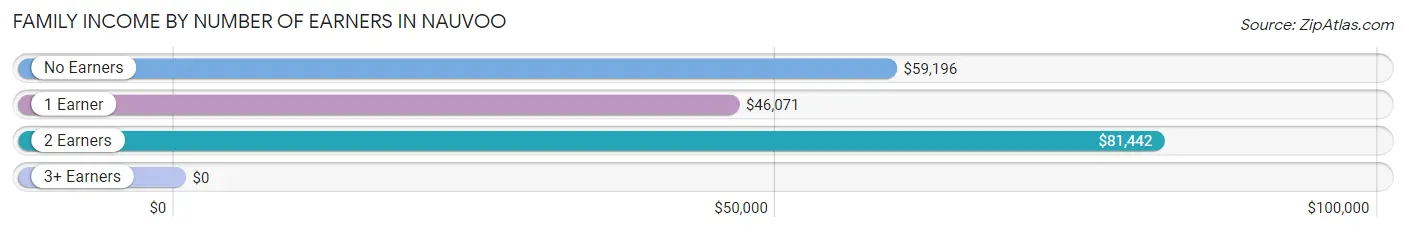
| Number of Earners | # Families | Median Income |
| No Earners | 65 (29.8%) | $59,196 |
| 1 Earner | 94 (43.1%) | $46,071 |
| 2 Earners | 27 (12.4%) | $81,442 |
| 3+ Earners | 32 (14.7%) | $0 |
| Total | 218 (100.0%) | $60,000 |
Household Income in Nauvoo
Household Income Brackets in Nauvoo
With 51 households falling in the category, the $50,000 to $74,999 income range is the most frequent in Nauvoo, accounting for 17.2% of all households. In contrast, only 8 households (2.7%) fall into the $150,000 to $199,999 income bracket, making it the least populous group.
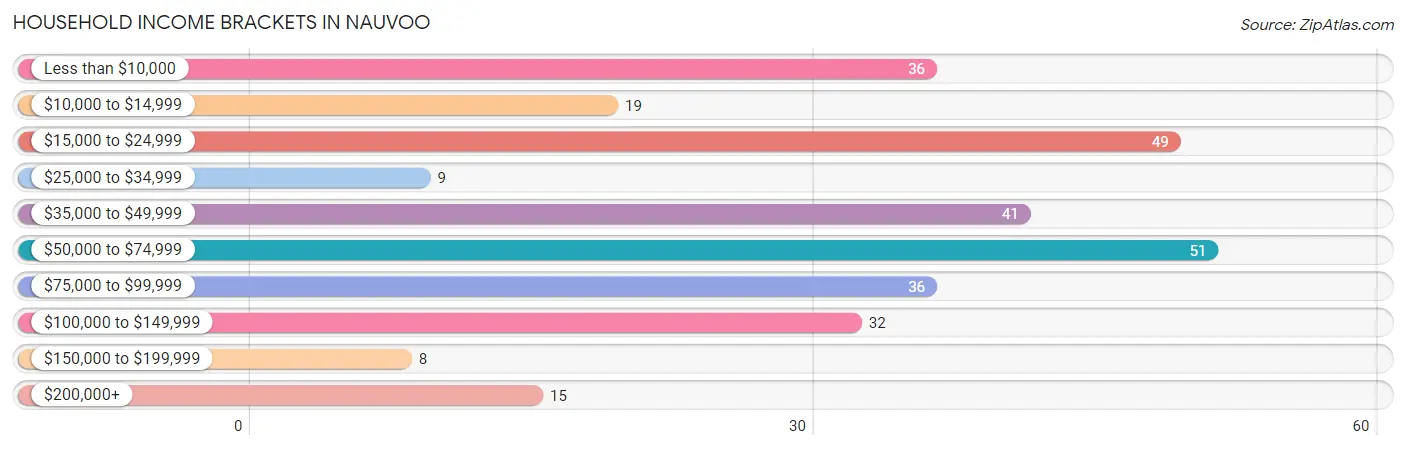
| Income Bracket | # Households | % Households |
| Less than $10,000 | 36 | 12.2% |
| $10,000 to $14,999 | 19 | 6.4% |
| $15,000 to $24,999 | 49 | 16.6% |
| $25,000 to $34,999 | 9 | 3.0% |
| $35,000 to $49,999 | 41 | 13.9% |
| $50,000 to $74,999 | 51 | 17.2% |
| $75,000 to $99,999 | 36 | 12.2% |
| $100,000 to $149,999 | 32 | 10.8% |
| $150,000 to $199,999 | 8 | 2.7% |
| $200,000+ | 15 | 5.1% |
Household Income by Householder Age in Nauvoo
The median household income in Nauvoo is $46,429, with the highest median household income of $61,250 found in the 65+ years age bracket for the primary householder. A total of 140 households (47.3%) fall into this category. Meanwhile, the 15 to 24 years age bracket for the primary householder has the lowest median household income of $0, with 13 households (4.4%) in this group.
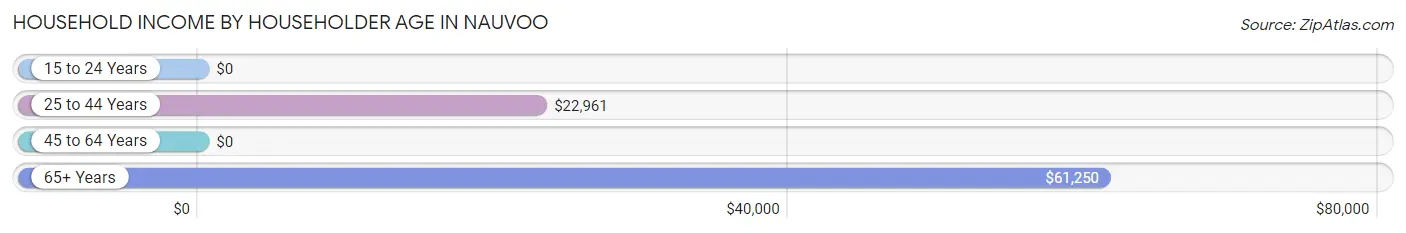
| Income Bracket | # Households | Median Income |
| 15 to 24 Years | 13 (4.4%) | $0 |
| 25 to 44 Years | 101 (34.1%) | $22,961 |
| 45 to 64 Years | 42 (14.2%) | $0 |
| 65+ Years | 140 (47.3%) | $61,250 |
| Total | 296 (100.0%) | $46,429 |
Poverty in Nauvoo
Income Below Poverty by Sex and Age in Nauvoo
With 41.3% poverty level for males and 35.8% for females among the residents of Nauvoo, 12 to 14 year old males and 45 to 54 year old females are the most vulnerable to poverty, with 18 males (85.7%) and 3 females (100.0%) in their respective age groups living below the poverty level.
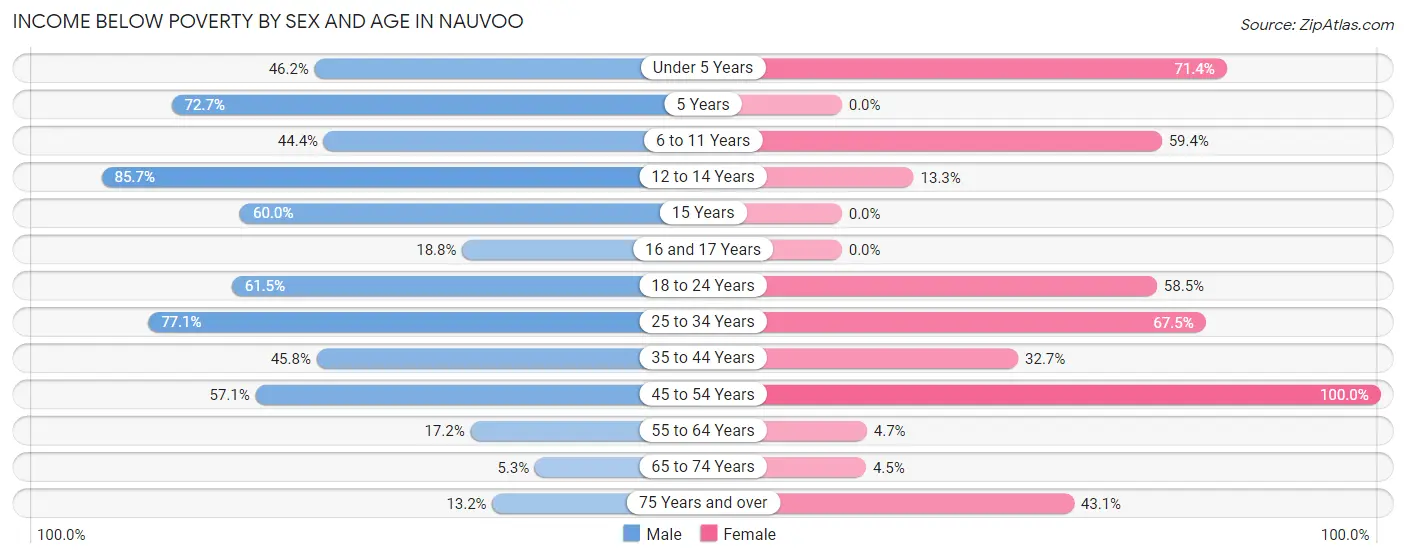
| Age Bracket | Male | Female |
| Under 5 Years | 6 (46.2%) | 15 (71.4%) |
| 5 Years | 16 (72.7%) | 0 (0.0%) |
| 6 to 11 Years | 20 (44.4%) | 19 (59.4%) |
| 12 to 14 Years | 18 (85.7%) | 2 (13.3%) |
| 15 Years | 3 (60.0%) | 0 (0.0%) |
| 16 and 17 Years | 3 (18.8%) | 0 (0.0%) |
| 18 to 24 Years | 8 (61.5%) | 31 (58.5%) |
| 25 to 34 Years | 47 (77.0%) | 27 (67.5%) |
| 35 to 44 Years | 38 (45.8%) | 18 (32.7%) |
| 45 to 54 Years | 4 (57.1%) | 3 (100.0%) |
| 55 to 64 Years | 5 (17.2%) | 2 (4.6%) |
| 65 to 74 Years | 4 (5.3%) | 4 (4.5%) |
| 75 Years and over | 5 (13.2%) | 28 (43.1%) |
| Total | 177 (41.3%) | 149 (35.8%) |
Income Above Poverty by Sex and Age in Nauvoo
According to the poverty statistics in Nauvoo, males aged 65 to 74 years and females aged 65 to 74 years are the age groups that are most secure financially, with 94.7% of males and 95.5% of females in these age groups living above the poverty line.
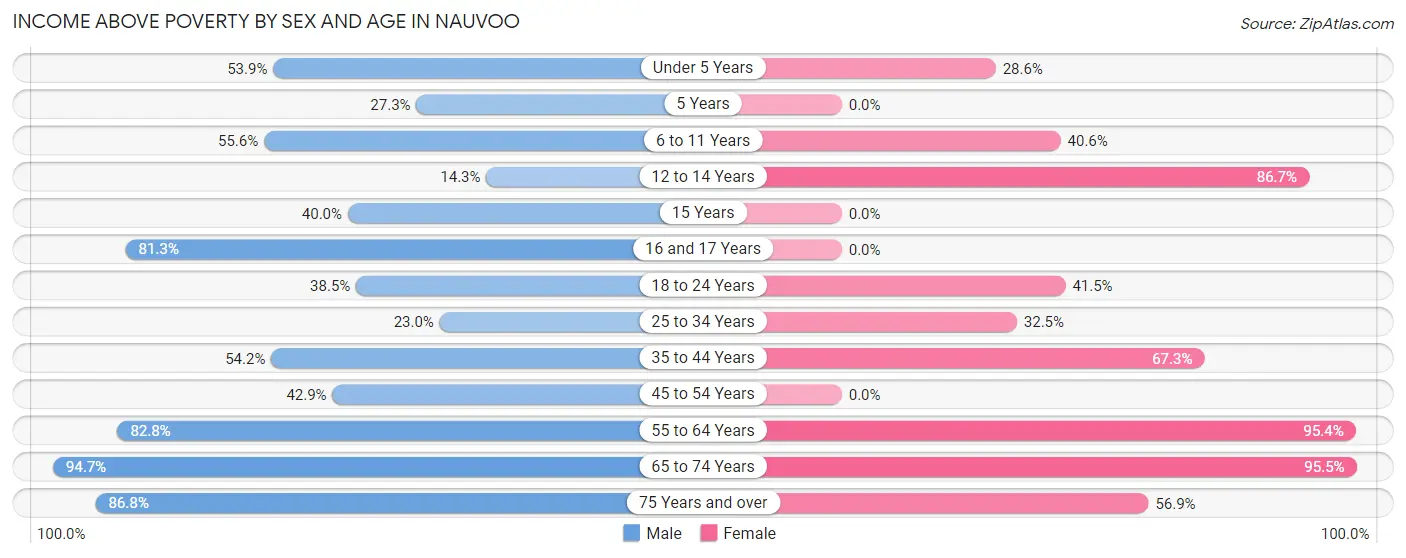
| Age Bracket | Male | Female |
| Under 5 Years | 7 (53.8%) | 6 (28.6%) |
| 5 Years | 6 (27.3%) | 0 (0.0%) |
| 6 to 11 Years | 25 (55.6%) | 13 (40.6%) |
| 12 to 14 Years | 3 (14.3%) | 13 (86.7%) |
| 15 Years | 2 (40.0%) | 0 (0.0%) |
| 16 and 17 Years | 13 (81.2%) | 0 (0.0%) |
| 18 to 24 Years | 5 (38.5%) | 22 (41.5%) |
| 25 to 34 Years | 14 (23.0%) | 13 (32.5%) |
| 35 to 44 Years | 45 (54.2%) | 37 (67.3%) |
| 45 to 54 Years | 3 (42.9%) | 0 (0.0%) |
| 55 to 64 Years | 24 (82.8%) | 41 (95.4%) |
| 65 to 74 Years | 72 (94.7%) | 85 (95.5%) |
| 75 Years and over | 33 (86.8%) | 37 (56.9%) |
| Total | 252 (58.7%) | 267 (64.2%) |
Income Below Poverty Among Married-Couple Families in Nauvoo
The poverty statistics for married-couple families in Nauvoo show that 23.6% or 45 of the total 191 families live below the poverty line. Families with 1 or 2 children have the highest poverty rate of 75.0%, comprising of 33 families. On the other hand, families with 3 or 4 children have the lowest poverty rate of 0.0%, which includes 0 families.
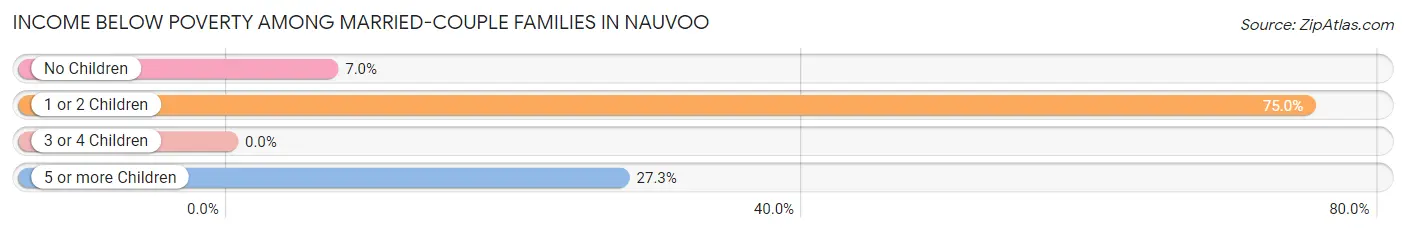
| Children | Above Poverty | Below Poverty |
| No Children | 120 (93.0%) | 9 (7.0%) |
| 1 or 2 Children | 11 (25.0%) | 33 (75.0%) |
| 3 or 4 Children | 7 (100.0%) | 0 (0.0%) |
| 5 or more Children | 8 (72.7%) | 3 (27.3%) |
| Total | 146 (76.4%) | 45 (23.6%) |
Income Below Poverty Among Single-Parent Households in Nauvoo
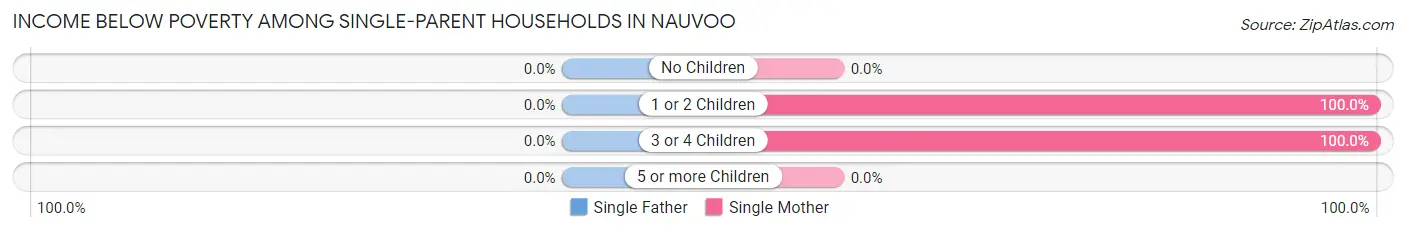
| Children | Single Father | Single Mother |
| No Children | 0 (0.0%) | 0 (0.0%) |
| 1 or 2 Children | 0 (0.0%) | 10 (100.0%) |
| 3 or 4 Children | 0 (0.0%) | 3 (100.0%) |
| 5 or more Children | 0 (0.0%) | 0 (0.0%) |
| Total | 0 (0.0%) | 13 (54.2%) |
Income Below Poverty Among Married-Couple vs Single-Parent Households in Nauvoo
The poverty data for Nauvoo shows that 45 of the married-couple family households (23.6%) and 13 of the single-parent households (48.1%) are living below the poverty level. Within the married-couple family households, those with 1 or 2 children have the highest poverty rate, with 33 households (75.0%) falling below the poverty line. Among the single-parent households, those with 1 or 2 children have the highest poverty rate, with 10 household (100.0%) living below poverty.
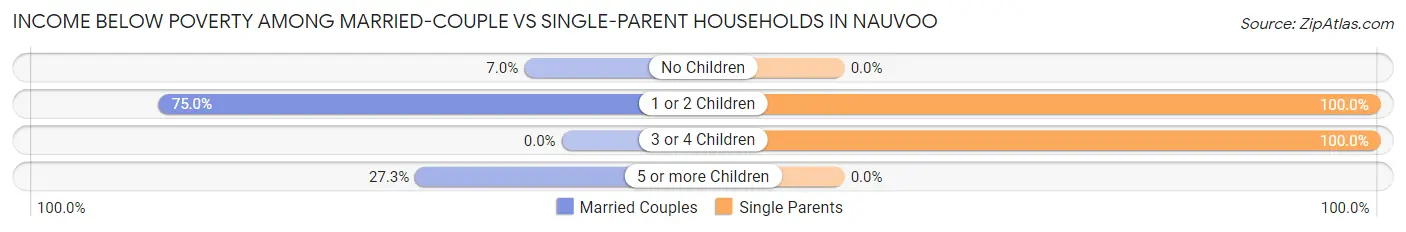
| Children | Married-Couple Families | Single-Parent Households |
| No Children | 9 (7.0%) | 0 (0.0%) |
| 1 or 2 Children | 33 (75.0%) | 10 (100.0%) |
| 3 or 4 Children | 0 (0.0%) | 3 (100.0%) |
| 5 or more Children | 3 (27.3%) | 0 (0.0%) |
| Total | 45 (23.6%) | 13 (48.1%) |
Race in Nauvoo
The most populous races in Nauvoo are White / Caucasian (837 | 97.2%), Black / African American (11 | 1.3%), and Hispanic or Latino (8 | 0.9%).
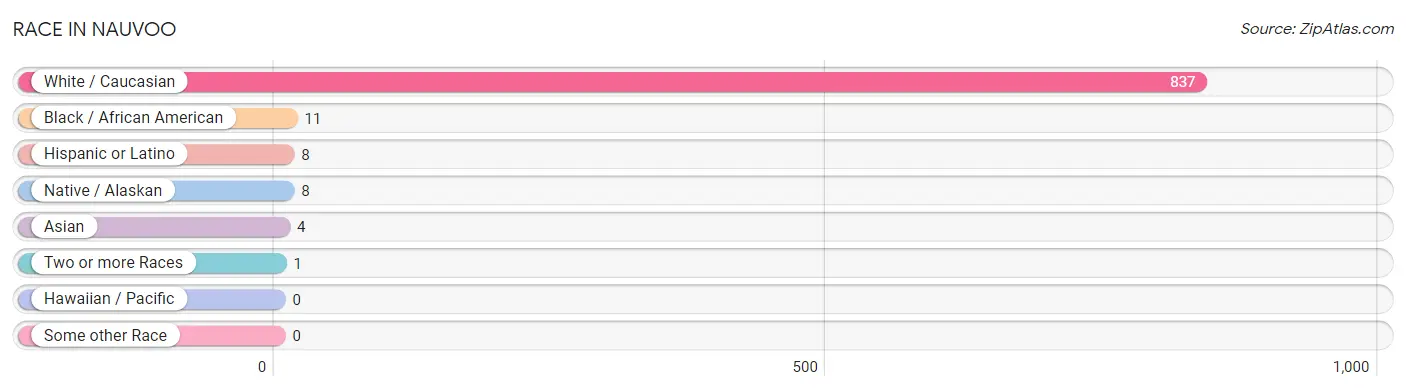
| Race | # Population | % Population |
| Asian | 4 | 0.5% |
| Black / African American | 11 | 1.3% |
| Hawaiian / Pacific | 0 | 0.0% |
| Hispanic or Latino | 8 | 0.9% |
| Native / Alaskan | 8 | 0.9% |
| White / Caucasian | 837 | 97.2% |
| Two or more Races | 1 | 0.1% |
| Some other Race | 0 | 0.0% |
| Total | 861 | 100.0% |
Ancestry in Nauvoo
The most populous ancestries reported in Nauvoo are German (269 | 31.2%), English (208 | 24.2%), Irish (144 | 16.7%), Italian (73 | 8.5%), and American (44 | 5.1%), together accounting for 85.7% of all Nauvoo residents.
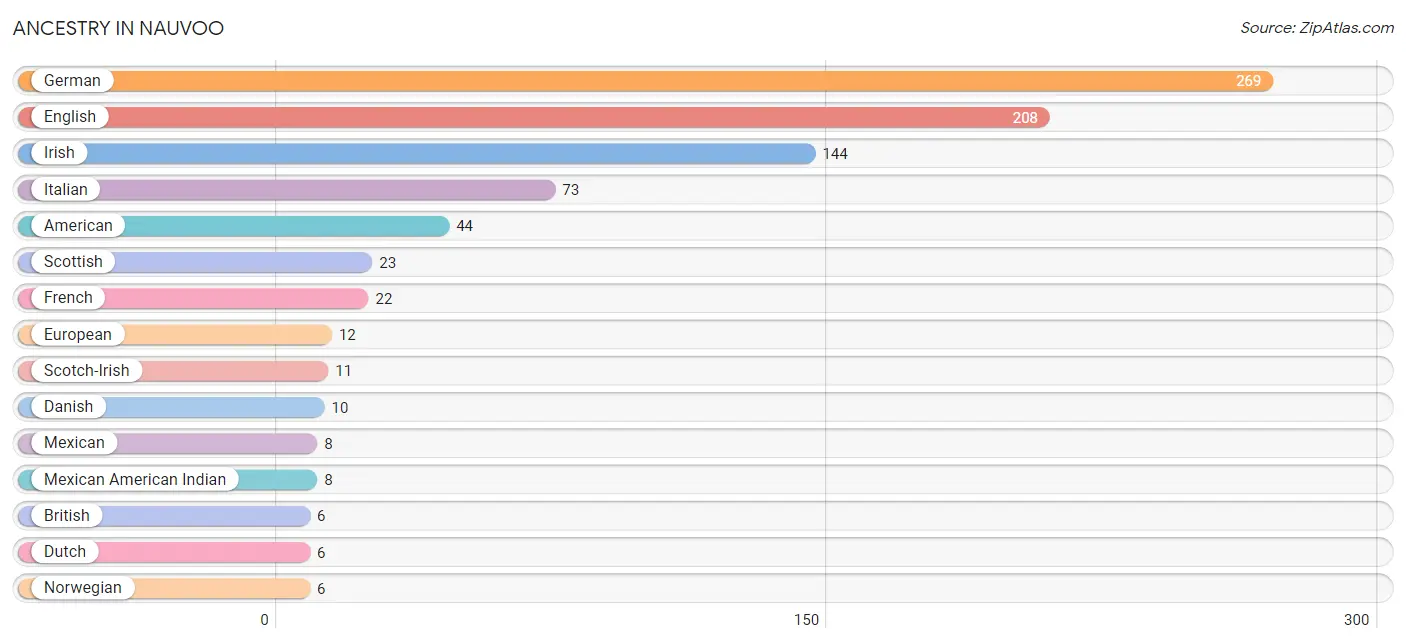
| Ancestry | # Population | % Population |
| American | 44 | 5.1% |
| British | 6 | 0.7% |
| Cherokee | 1 | 0.1% |
| Czech | 2 | 0.2% |
| Danish | 10 | 1.2% |
| Dutch | 6 | 0.7% |
| English | 208 | 24.2% |
| European | 12 | 1.4% |
| French | 22 | 2.6% |
| German | 269 | 31.2% |
| Irish | 144 | 16.7% |
| Italian | 73 | 8.5% |
| Lithuanian | 2 | 0.2% |
| Mexican | 8 | 0.9% |
| Mexican American Indian | 8 | 0.9% |
| Nigerian | 3 | 0.4% |
| Northern European | 5 | 0.6% |
| Norwegian | 6 | 0.7% |
| Polish | 2 | 0.2% |
| Scotch-Irish | 11 | 1.3% |
| Scottish | 23 | 2.7% |
| Slovene | 4 | 0.5% |
| Sri Lankan | 4 | 0.5% |
| Subsaharan African | 3 | 0.4% |
| Swedish | 3 | 0.4% |
| Welsh | 5 | 0.6% | View All 26 Rows |
Immigrants in Nauvoo
The most numerous immigrant groups reported in Nauvoo came from Asia (4 | 0.5%), Europe (4 | 0.5%), Germany (4 | 0.5%), South Eastern Asia (4 | 0.5%), and Vietnam (4 | 0.5%), together accounting for 2.3% of all Nauvoo residents.
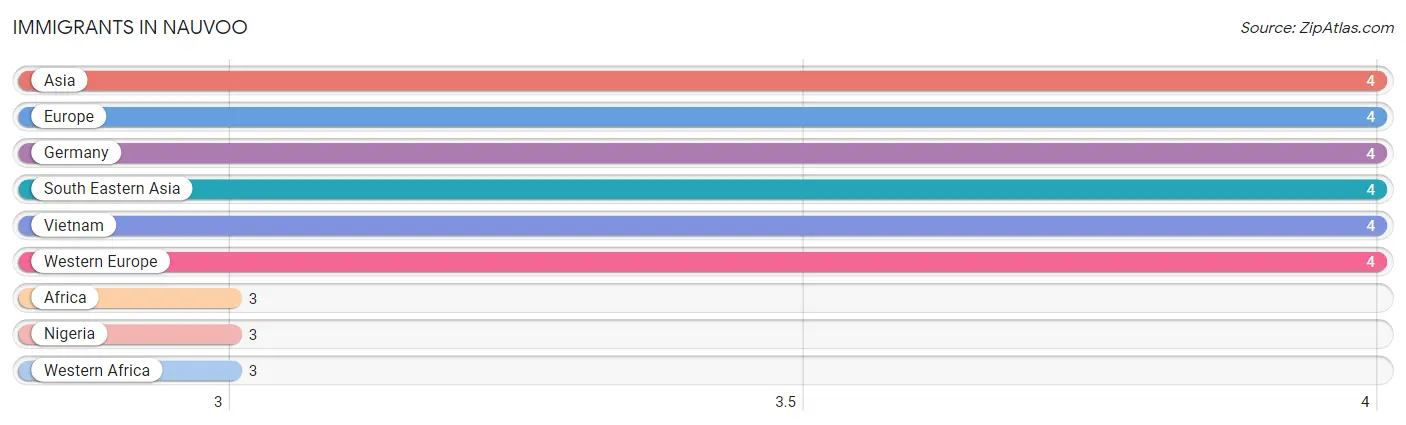
| Immigration Origin | # Population | % Population |
| Africa | 3 | 0.4% |
| Asia | 4 | 0.5% |
| Europe | 4 | 0.5% |
| Germany | 4 | 0.5% |
| Nigeria | 3 | 0.4% |
| South Eastern Asia | 4 | 0.5% |
| Vietnam | 4 | 0.5% |
| Western Africa | 3 | 0.4% |
| Western Europe | 4 | 0.5% | View All 9 Rows |
Sex and Age in Nauvoo
Sex and Age in Nauvoo
The most populous age groups in Nauvoo are 70 to 74 Years (66 | 15.2%) for men and 20 to 24 Years (57 | 13.3%) for women.
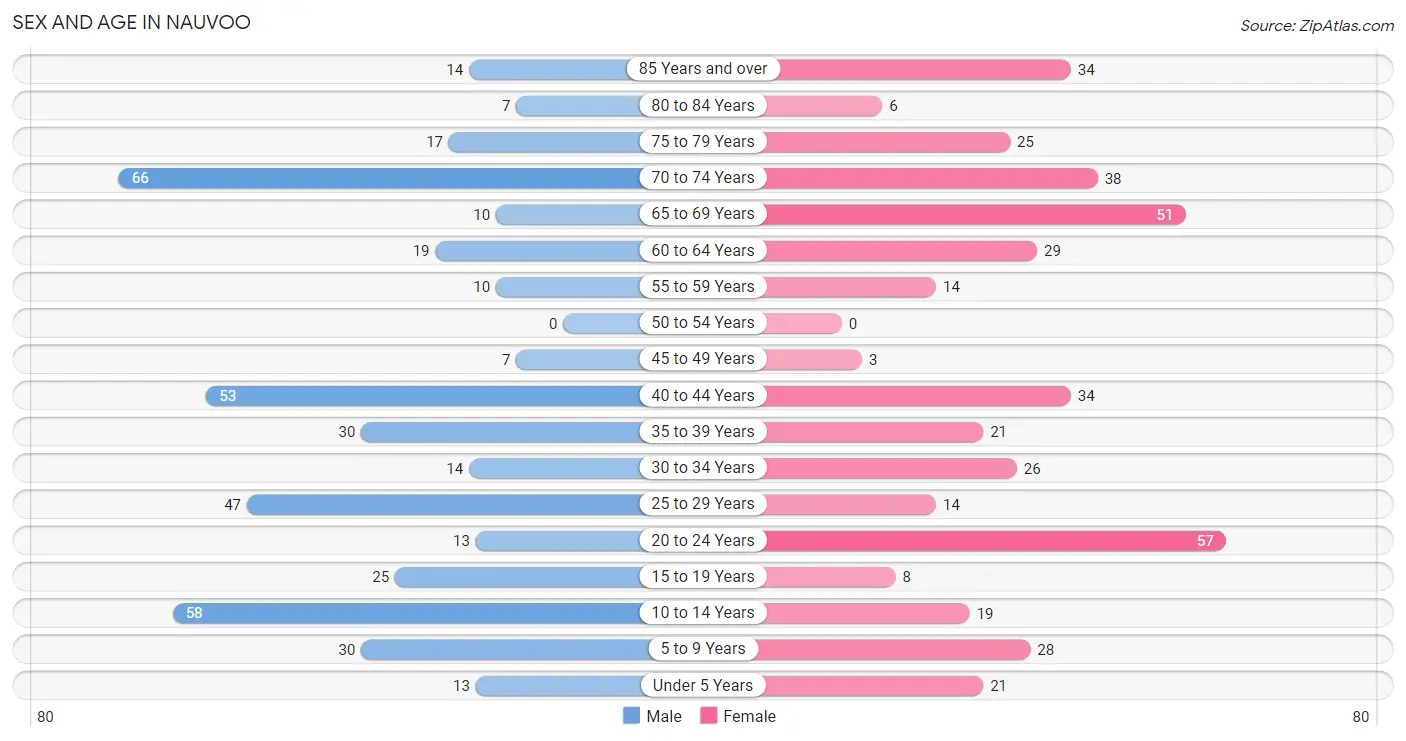
| Age Bracket | Male | Female |
| Under 5 Years | 13 (3.0%) | 21 (4.9%) |
| 5 to 9 Years | 30 (6.9%) | 28 (6.5%) |
| 10 to 14 Years | 58 (13.4%) | 19 (4.4%) |
| 15 to 19 Years | 25 (5.8%) | 8 (1.9%) |
| 20 to 24 Years | 13 (3.0%) | 57 (13.3%) |
| 25 to 29 Years | 47 (10.8%) | 14 (3.3%) |
| 30 to 34 Years | 14 (3.2%) | 26 (6.1%) |
| 35 to 39 Years | 30 (6.9%) | 21 (4.9%) |
| 40 to 44 Years | 53 (12.2%) | 34 (7.9%) |
| 45 to 49 Years | 7 (1.6%) | 3 (0.7%) |
| 50 to 54 Years | 0 (0.0%) | 0 (0.0%) |
| 55 to 59 Years | 10 (2.3%) | 14 (3.3%) |
| 60 to 64 Years | 19 (4.4%) | 29 (6.8%) |
| 65 to 69 Years | 10 (2.3%) | 51 (11.9%) |
| 70 to 74 Years | 66 (15.2%) | 38 (8.9%) |
| 75 to 79 Years | 17 (3.9%) | 25 (5.8%) |
| 80 to 84 Years | 7 (1.6%) | 6 (1.4%) |
| 85 Years and over | 14 (3.2%) | 34 (7.9%) |
| Total | 433 (100.0%) | 428 (100.0%) |
Families and Households in Nauvoo
Median Family Size in Nauvoo
The median family size in Nauvoo is 3.17 persons per family, with single male/father families (3 | 1.4%) accounting for the largest median family size of 4 persons per family. On the other hand, single female/mother families (24 | 11.0%) represent the smallest median family size with 3.08 persons per family.
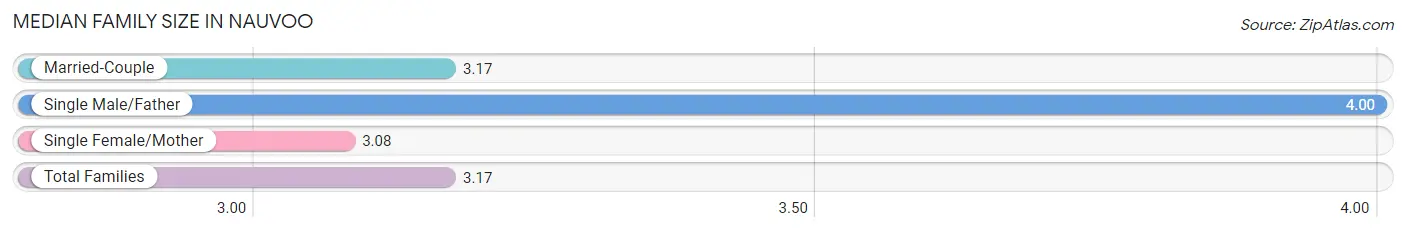
| Family Type | # Families | Family Size |
| Married-Couple | 191 (87.6%) | 3.17 |
| Single Male/Father | 3 (1.4%) | 4.00 |
| Single Female/Mother | 24 (11.0%) | 3.08 |
| Total Families | 218 (100.0%) | 3.17 |
Median Household Size in Nauvoo
The median household size in Nauvoo is 2.79 persons per household, with single male/father households (3 | 1.0%) accounting for the largest median household size of 4 persons per household. non-family households (78 | 26.4%) represent the smallest median household size with 1.60 persons per household.
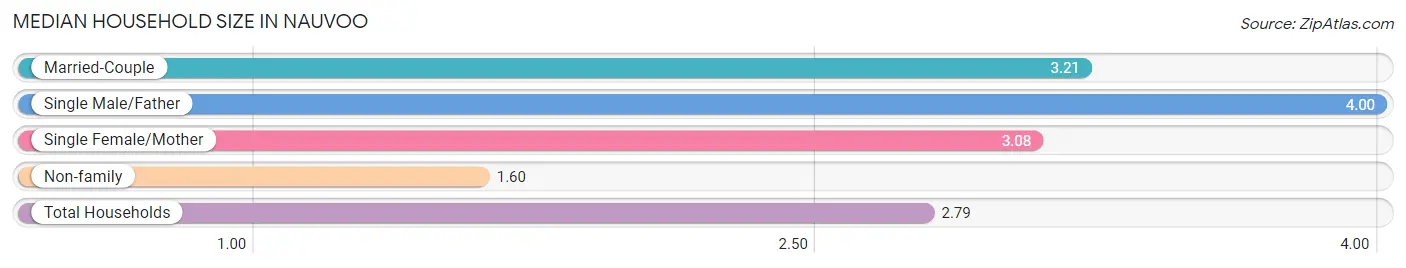
| Household Type | # Households | Household Size |
| Married-Couple | 191 (64.5%) | 3.21 |
| Single Male/Father | 3 (1.0%) | 4.00 |
| Single Female/Mother | 24 (8.1%) | 3.08 |
| Non-family | 78 (26.4%) | 1.60 |
| Total Households | 296 (100.0%) | 2.79 |
Household Size by Marriage Status in Nauvoo
Out of a total of 296 households in Nauvoo, 218 (73.7%) are family households, while 78 (26.4%) are nonfamily households. The most numerous type of family households are 2-person households, comprising 123, and the most common type of nonfamily households are 1-person households, comprising 65.
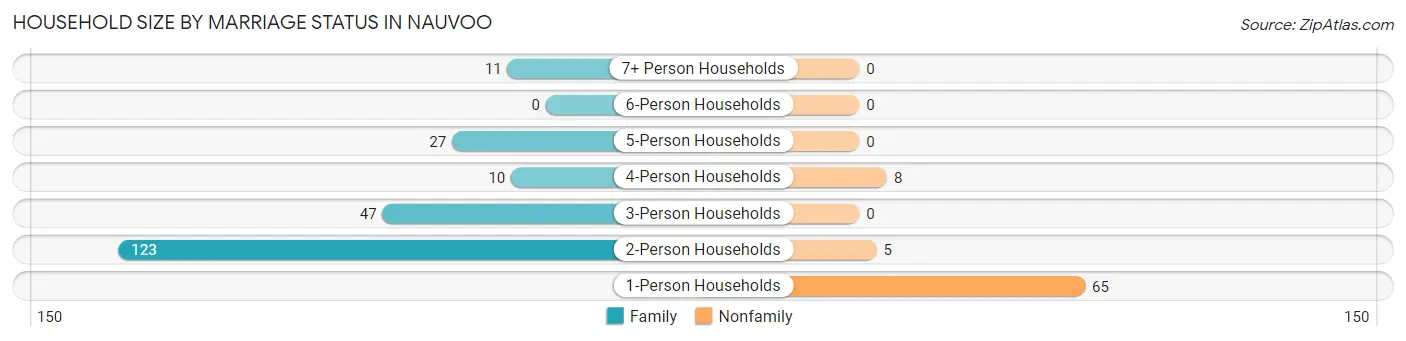
| Household Size | Family Households | Nonfamily Households |
| 1-Person Households | - | 65 (22.0%) |
| 2-Person Households | 123 (41.5%) | 5 (1.7%) |
| 3-Person Households | 47 (15.9%) | 0 (0.0%) |
| 4-Person Households | 10 (3.4%) | 8 (2.7%) |
| 5-Person Households | 27 (9.1%) | 0 (0.0%) |
| 6-Person Households | 0 (0.0%) | 0 (0.0%) |
| 7+ Person Households | 11 (3.7%) | 0 (0.0%) |
| Total | 218 (73.7%) | 78 (26.4%) |
Female Fertility in Nauvoo
Fertility by Age in Nauvoo
Average fertility rate in Nauvoo is 43.0 births per 1,000 women. Women in the age bracket of 20 to 34 years have the highest fertility rate with 72.0 births per 1,000 women. Women in the age bracket of 20 to 34 years acount for 100.0% of all women with births.
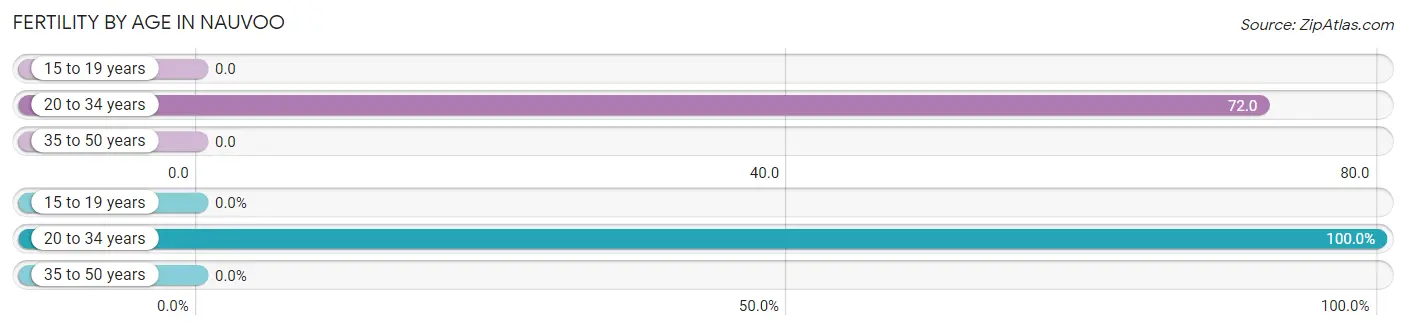
| Age Bracket | Women with Births | Births / 1,000 Women |
| 15 to 19 years | 0 (0.0%) | 0.0 |
| 20 to 34 years | 7 (100.0%) | 72.0 |
| 35 to 50 years | 0 (0.0%) | 0.0 |
| Total | 7 (100.0%) | 43.0 |
Fertility by Age by Marriage Status in Nauvoo
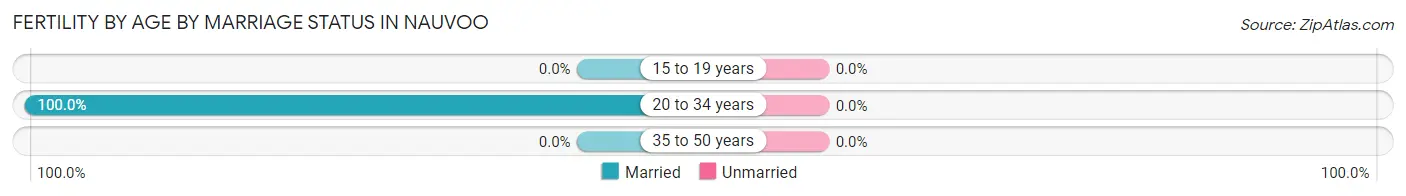
| Age Bracket | Married | Unmarried |
| 15 to 19 years | 0 (0.0%) | 0 (0.0%) |
| 20 to 34 years | 7 (100.0%) | 0 (0.0%) |
| 35 to 50 years | 0 (0.0%) | 0 (0.0%) |
| Total | 7 (100.0%) | 0 (0.0%) |
Fertility by Education in Nauvoo
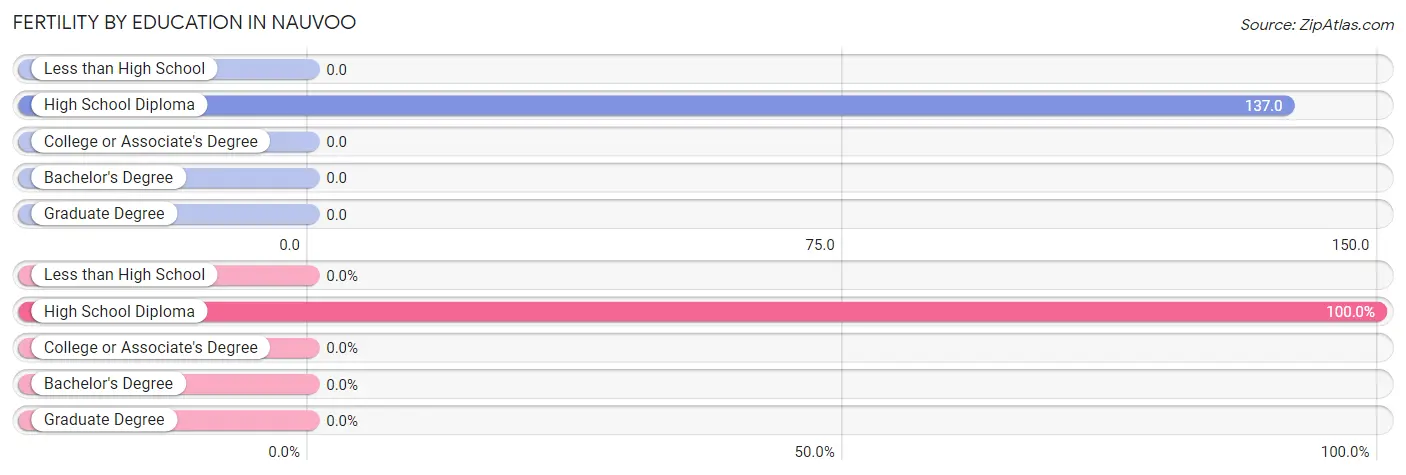
| Educational Attainment | Women with Births | Births / 1,000 Women |
| Less than High School | 0 (0.0%) | 0.0 |
| High School Diploma | 7 (100.0%) | 137.0 |
| College or Associate's Degree | 0 (0.0%) | 0.0 |
| Bachelor's Degree | 0 (0.0%) | 0.0 |
| Graduate Degree | 0 (0.0%) | 0.0 |
| Total | 7 (100.0%) | 43.0 |
Fertility by Education by Marriage Status in Nauvoo
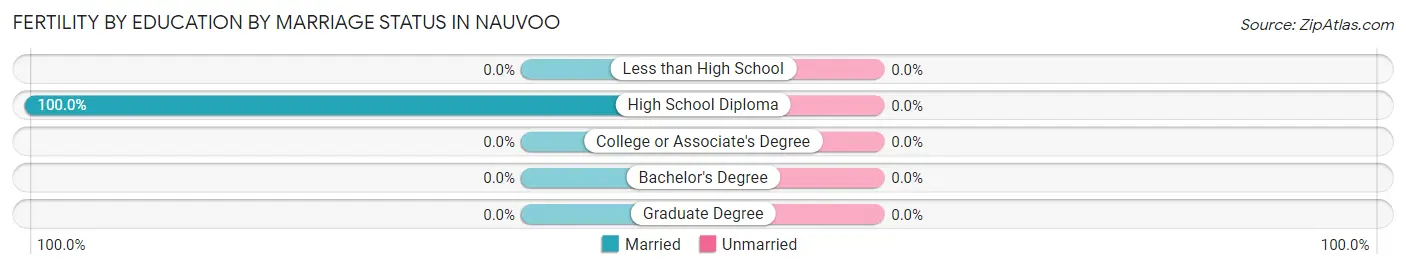
| Educational Attainment | Married | Unmarried |
| Less than High School | 0 (0.0%) | 0 (0.0%) |
| High School Diploma | 7 (100.0%) | 0 (0.0%) |
| College or Associate's Degree | 0 (0.0%) | 0 (0.0%) |
| Bachelor's Degree | 0 (0.0%) | 0 (0.0%) |
| Graduate Degree | 0 (0.0%) | 0 (0.0%) |
| Total | 7 (100.0%) | 0 (0.0%) |
Employment Characteristics in Nauvoo
Employment by Class of Employer in Nauvoo
Among the 285 employed individuals in Nauvoo, private company employees (183 | 64.2%), not-for-profit organizations (48 | 16.8%), and self-employed (not incorporated) (25 | 8.8%) make up the most common classes of employment.
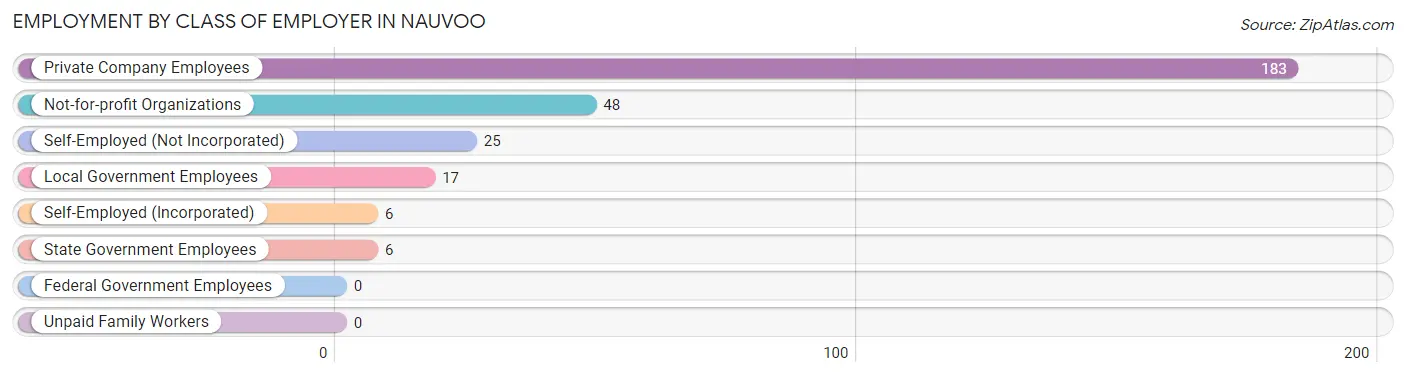
| Employer Class | # Employees | % Employees |
| Private Company Employees | 183 | 64.2% |
| Self-Employed (Incorporated) | 6 | 2.1% |
| Self-Employed (Not Incorporated) | 25 | 8.8% |
| Not-for-profit Organizations | 48 | 16.8% |
| Local Government Employees | 17 | 6.0% |
| State Government Employees | 6 | 2.1% |
| Federal Government Employees | 0 | 0.0% |
| Unpaid Family Workers | 0 | 0.0% |
| Total | 285 | 100.0% |
Employment Status by Age in Nauvoo
According to the labor force statistics for Nauvoo, out of the total population over 16 years of age (687), 42.5% or 292 individuals are in the labor force, with 2.4% or 7 of them unemployed. The age group with the highest labor force participation rate is 35 to 44 years, with 97.8% or 135 individuals in the labor force. Within the labor force, the 16 to 19 years age range has the highest percentage of unemployed individuals, with 11.8% or 2 of them being unemployed.
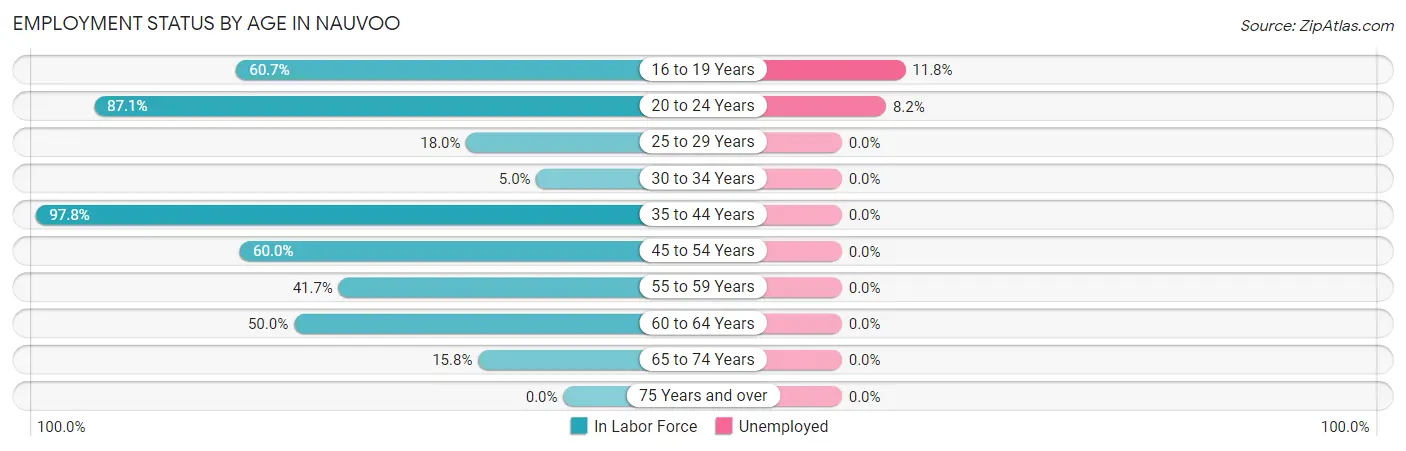
| Age Bracket | In Labor Force | Unemployed |
| 16 to 19 Years | 17 (60.7%) | 2 (11.8%) |
| 20 to 24 Years | 61 (87.1%) | 5 (8.2%) |
| 25 to 29 Years | 11 (18.0%) | 0 (0.0%) |
| 30 to 34 Years | 2 (5.0%) | 0 (0.0%) |
| 35 to 44 Years | 135 (97.8%) | 0 (0.0%) |
| 45 to 54 Years | 6 (60.0%) | 0 (0.0%) |
| 55 to 59 Years | 10 (41.7%) | 0 (0.0%) |
| 60 to 64 Years | 24 (50.0%) | 0 (0.0%) |
| 65 to 74 Years | 26 (15.8%) | 0 (0.0%) |
| 75 Years and over | 0 (0.0%) | 0 (0.0%) |
| Total | 292 (42.5%) | 7 (2.4%) |
Employment Status by Educational Attainment in Nauvoo
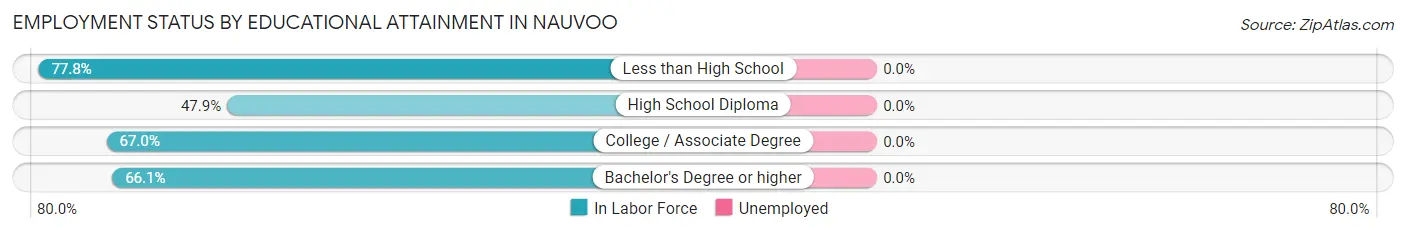
| Educational Attainment | In Labor Force | Unemployed |
| Less than High School | 7 (77.8%) | 0 (0.0%) |
| High School Diploma | 69 (47.9%) | 0 (0.0%) |
| College / Associate Degree | 71 (67.0%) | 0 (0.0%) |
| Bachelor's Degree or higher | 41 (66.1%) | 0 (0.0%) |
| Total | 188 (58.6%) | 0 (0.0%) |
Employment Occupations by Sex in Nauvoo
Management, Business, Science and Arts Occupations
The most common Management, Business, Science and Arts occupations in Nauvoo are Management (32 | 11.2%), Health Diagnosing & Treating (11 | 3.9%), Health Technologists (11 | 3.9%), Computers, Engineering & Science (9 | 3.2%), and Architecture & Engineering (9 | 3.2%).
Management, Business, Science and Arts Occupations by Sex
Within the Management, Business, Science and Arts occupations in Nauvoo, the most male-oriented occupations are Business & Financial (100.0%), Computers, Engineering & Science (100.0%), and Architecture & Engineering (100.0%), while the most female-oriented occupations are Legal Services & Support (100.0%), Education Instruction & Library (100.0%), and Health Diagnosing & Treating (72.7%).
| Occupation | Male | Female |
| Management | 13 (40.6%) | 19 (59.4%) |
| Business & Financial | 5 (100.0%) | 0 (0.0%) |
| Computers, Engineering & Science | 9 (100.0%) | 0 (0.0%) |
| Computers & Mathematics | 0 (0.0%) | 0 (0.0%) |
| Architecture & Engineering | 9 (100.0%) | 0 (0.0%) |
| Life, Physical & Social Science | 0 (0.0%) | 0 (0.0%) |
| Community & Social Service | 3 (37.5%) | 5 (62.5%) |
| Education, Arts & Media | 3 (100.0%) | 0 (0.0%) |
| Legal Services & Support | 0 (0.0%) | 2 (100.0%) |
| Education Instruction & Library | 0 (0.0%) | 3 (100.0%) |
| Arts, Media & Entertainment | 0 (0.0%) | 0 (0.0%) |
| Health Diagnosing & Treating | 3 (27.3%) | 8 (72.7%) |
| Health Technologists | 3 (27.3%) | 8 (72.7%) |
| Total (Category) | 33 (50.8%) | 32 (49.2%) |
| Total (Overall) | 126 (44.2%) | 159 (55.8%) |
Services Occupations
The most common Services occupations in Nauvoo are Personal Care & Service (26 | 9.1%), Security & Protection (20 | 7.0%), Firefighting & Prevention (17 | 6.0%), Cleaning & Maintenance (17 | 6.0%), and Food Preparation & Serving (11 | 3.9%).
Services Occupations by Sex
Within the Services occupations in Nauvoo, the most male-oriented occupations are Security & Protection (100.0%), Firefighting & Prevention (100.0%), and Law Enforcement (100.0%), while the most female-oriented occupations are Healthcare Support (100.0%), Personal Care & Service (100.0%), and Cleaning & Maintenance (41.2%).
| Occupation | Male | Female |
| Healthcare Support | 0 (0.0%) | 6 (100.0%) |
| Security & Protection | 20 (100.0%) | 0 (0.0%) |
| Firefighting & Prevention | 17 (100.0%) | 0 (0.0%) |
| Law Enforcement | 3 (100.0%) | 0 (0.0%) |
| Food Preparation & Serving | 11 (100.0%) | 0 (0.0%) |
| Cleaning & Maintenance | 10 (58.8%) | 7 (41.2%) |
| Personal Care & Service | 0 (0.0%) | 26 (100.0%) |
| Total (Category) | 41 (51.2%) | 39 (48.7%) |
| Total (Overall) | 126 (44.2%) | 159 (55.8%) |
Sales and Office Occupations
The most common Sales and Office occupations in Nauvoo are Office & Administration (29 | 10.2%), and Sales & Related (17 | 6.0%).
Sales and Office Occupations by Sex
| Occupation | Male | Female |
| Sales & Related | 0 (0.0%) | 17 (100.0%) |
| Office & Administration | 0 (0.0%) | 29 (100.0%) |
| Total (Category) | 0 (0.0%) | 46 (100.0%) |
| Total (Overall) | 126 (44.2%) | 159 (55.8%) |
Natural Resources, Construction and Maintenance Occupations
The most common Natural Resources, Construction and Maintenance occupations in Nauvoo are Construction & Extraction (21 | 7.4%), and Farming, Fishing & Forestry (12 | 4.2%).

Natural Resources, Construction and Maintenance Occupations by Sex
| Occupation | Male | Female |
| Farming, Fishing & Forestry | 0 (0.0%) | 12 (100.0%) |
| Construction & Extraction | 21 (100.0%) | 0 (0.0%) |
| Installation, Maintenance & Repair | 0 (0.0%) | 0 (0.0%) |
| Total (Category) | 21 (63.6%) | 12 (36.4%) |
| Total (Overall) | 126 (44.2%) | 159 (55.8%) |
Production, Transportation and Moving Occupations
The most common Production, Transportation and Moving occupations in Nauvoo are Material Moving (24 | 8.4%), Production (21 | 7.4%), and Transportation (16 | 5.6%).
Production, Transportation and Moving Occupations by Sex
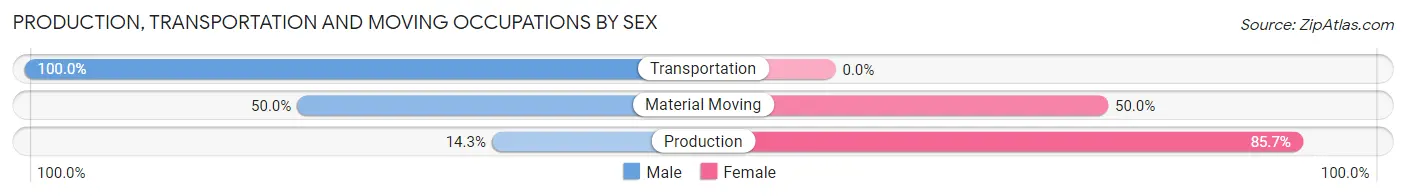
| Occupation | Male | Female |
| Production | 3 (14.3%) | 18 (85.7%) |
| Transportation | 16 (100.0%) | 0 (0.0%) |
| Material Moving | 12 (50.0%) | 12 (50.0%) |
| Total (Category) | 31 (50.8%) | 30 (49.2%) |
| Total (Overall) | 126 (44.2%) | 159 (55.8%) |
Employment Industries by Sex in Nauvoo
Employment Industries in Nauvoo
The major employment industries in Nauvoo include Health Care & Social Assistance (40 | 14.0%), Agriculture, Fishing & Hunting (30 | 10.5%), Accommodation & Food Services (29 | 10.2%), Manufacturing (23 | 8.1%), and Retail Trade (21 | 7.4%).
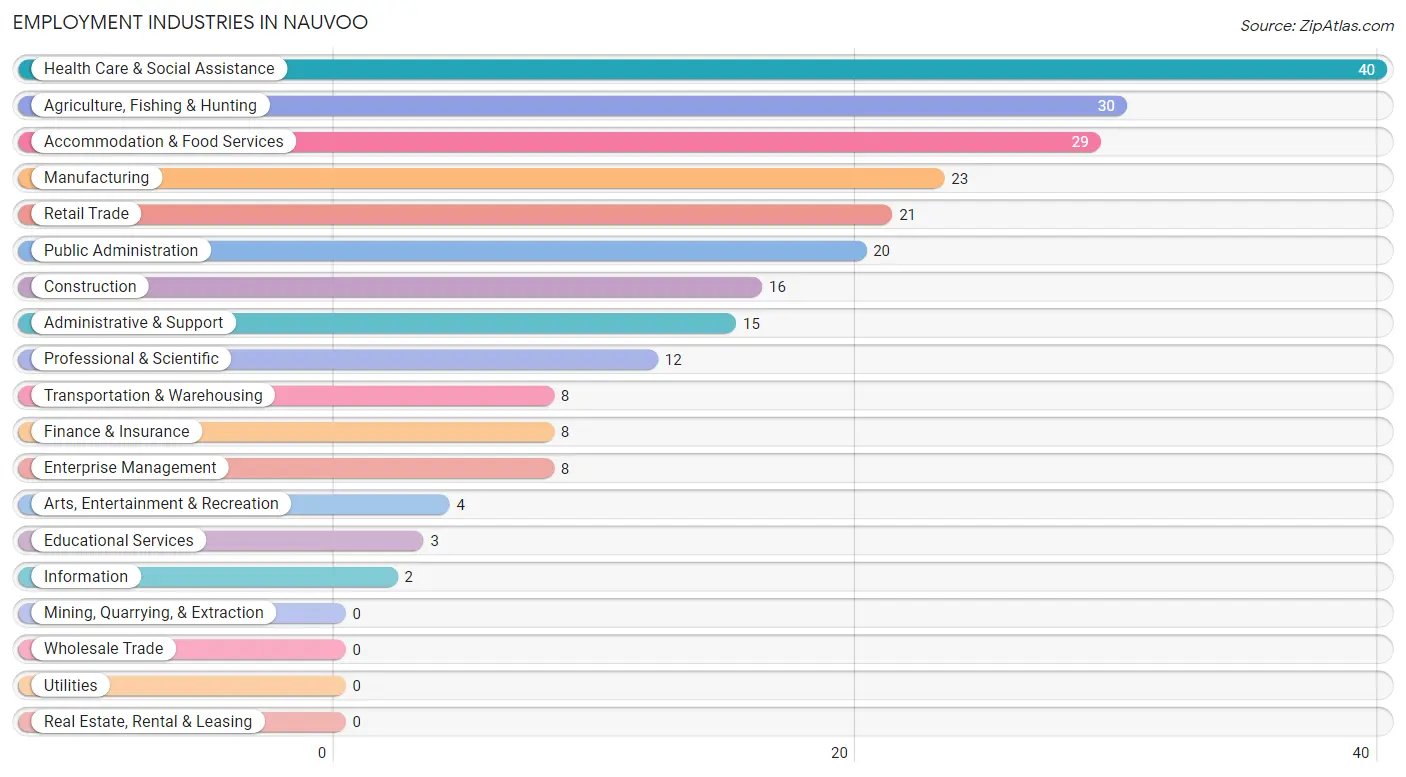
Employment Industries by Sex in Nauvoo
The Nauvoo industries that see more men than women are Construction (100.0%), Transportation & Warehousing (100.0%), and Information (100.0%), whereas the industries that tend to have a higher number of women are Finance & Insurance (100.0%), Enterprise Management (100.0%), and Educational Services (100.0%).
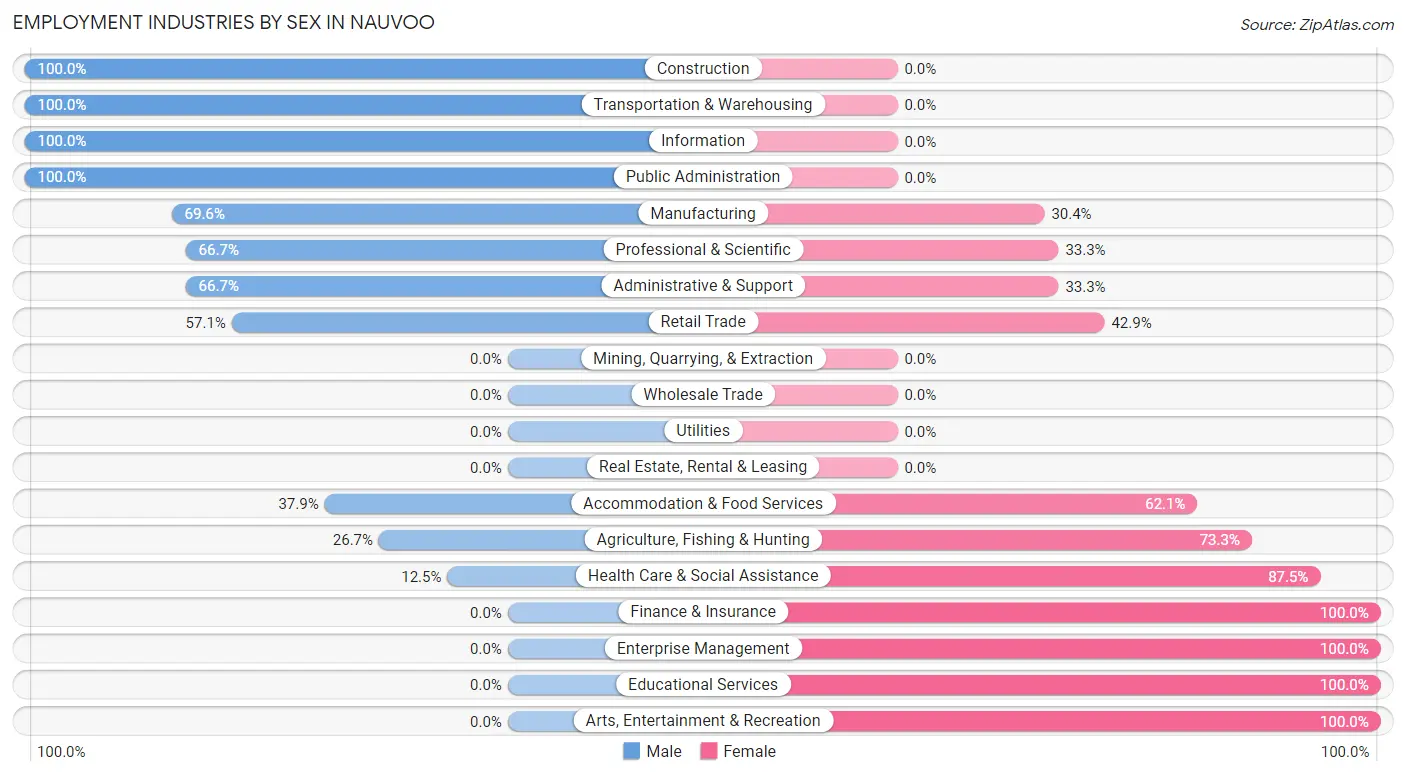
| Industry | Male | Female |
| Agriculture, Fishing & Hunting | 8 (26.7%) | 22 (73.3%) |
| Mining, Quarrying, & Extraction | 0 (0.0%) | 0 (0.0%) |
| Construction | 16 (100.0%) | 0 (0.0%) |
| Manufacturing | 16 (69.6%) | 7 (30.4%) |
| Wholesale Trade | 0 (0.0%) | 0 (0.0%) |
| Retail Trade | 12 (57.1%) | 9 (42.9%) |
| Transportation & Warehousing | 8 (100.0%) | 0 (0.0%) |
| Utilities | 0 (0.0%) | 0 (0.0%) |
| Information | 2 (100.0%) | 0 (0.0%) |
| Finance & Insurance | 0 (0.0%) | 8 (100.0%) |
| Real Estate, Rental & Leasing | 0 (0.0%) | 0 (0.0%) |
| Professional & Scientific | 8 (66.7%) | 4 (33.3%) |
| Enterprise Management | 0 (0.0%) | 8 (100.0%) |
| Administrative & Support | 10 (66.7%) | 5 (33.3%) |
| Educational Services | 0 (0.0%) | 3 (100.0%) |
| Health Care & Social Assistance | 5 (12.5%) | 35 (87.5%) |
| Arts, Entertainment & Recreation | 0 (0.0%) | 4 (100.0%) |
| Accommodation & Food Services | 11 (37.9%) | 18 (62.1%) |
| Public Administration | 20 (100.0%) | 0 (0.0%) |
| Total | 126 (44.2%) | 159 (55.8%) |
Education in Nauvoo
School Enrollment in Nauvoo
The most common levels of schooling among the 200 students in Nauvoo are elementary school (77 | 38.5%), college / undergraduate (34 | 17.0%), and middle school (33 | 16.5%).
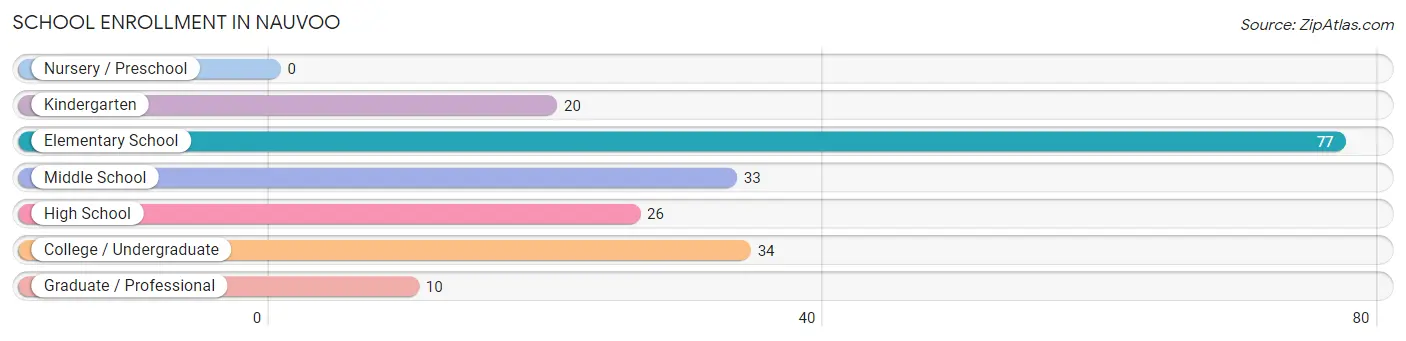
| School Level | # Students | % Students |
| Nursery / Preschool | 0 | 0.0% |
| Kindergarten | 20 | 10.0% |
| Elementary School | 77 | 38.5% |
| Middle School | 33 | 16.5% |
| High School | 26 | 13.0% |
| College / Undergraduate | 34 | 17.0% |
| Graduate / Professional | 10 | 5.0% |
| Total | 200 | 100.0% |
School Enrollment by Age by Funding Source in Nauvoo
Out of a total of 200 students who are enrolled in schools in Nauvoo, 48 (24.0%) attend a private institution, while the remaining 152 (76.0%) are enrolled in public schools. The age group of 18 to 19 year olds has the highest likelihood of being enrolled in private schools, with 8 (66.7% in the age bracket) enrolled. Conversely, the age group of 20 to 24 year olds has the lowest likelihood of being enrolled in a private school, with 16 (100.0% in the age bracket) attending a public institution.
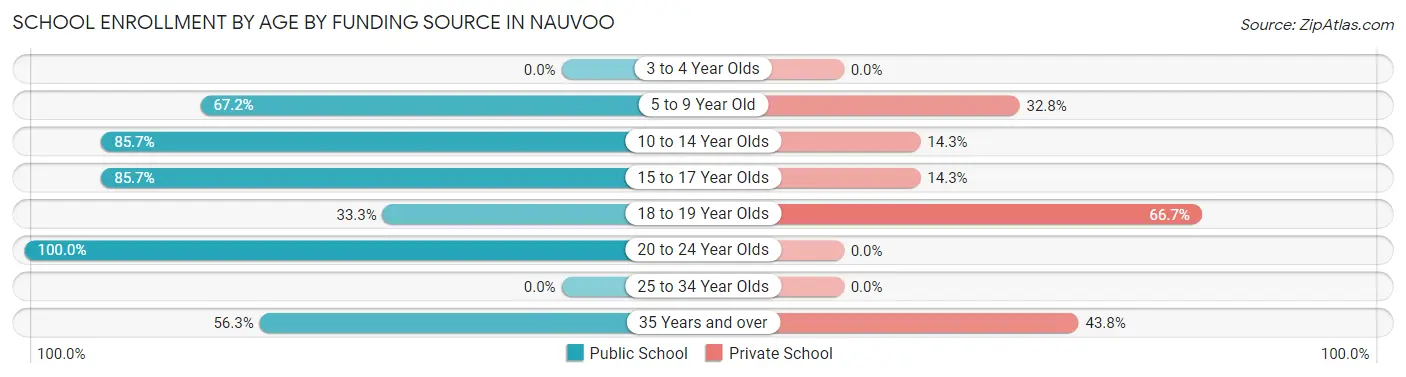
| Age Bracket | Public School | Private School |
| 3 to 4 Year Olds | 0 (0.0%) | 0 (0.0%) |
| 5 to 9 Year Old | 39 (67.2%) | 19 (32.8%) |
| 10 to 14 Year Olds | 66 (85.7%) | 11 (14.3%) |
| 15 to 17 Year Olds | 18 (85.7%) | 3 (14.3%) |
| 18 to 19 Year Olds | 4 (33.3%) | 8 (66.7%) |
| 20 to 24 Year Olds | 16 (100.0%) | 0 (0.0%) |
| 25 to 34 Year Olds | 0 (0.0%) | 0 (0.0%) |
| 35 Years and over | 9 (56.2%) | 7 (43.8%) |
| Total | 152 (76.0%) | 48 (24.0%) |
Educational Attainment by Field of Study in Nauvoo
Education (42 | 27.3%), business (21 | 13.6%), social sciences (20 | 13.0%), science & technology (15 | 9.7%), and communications (13 | 8.4%) are the most common fields of study among 154 individuals in Nauvoo who have obtained a bachelor's degree or higher.
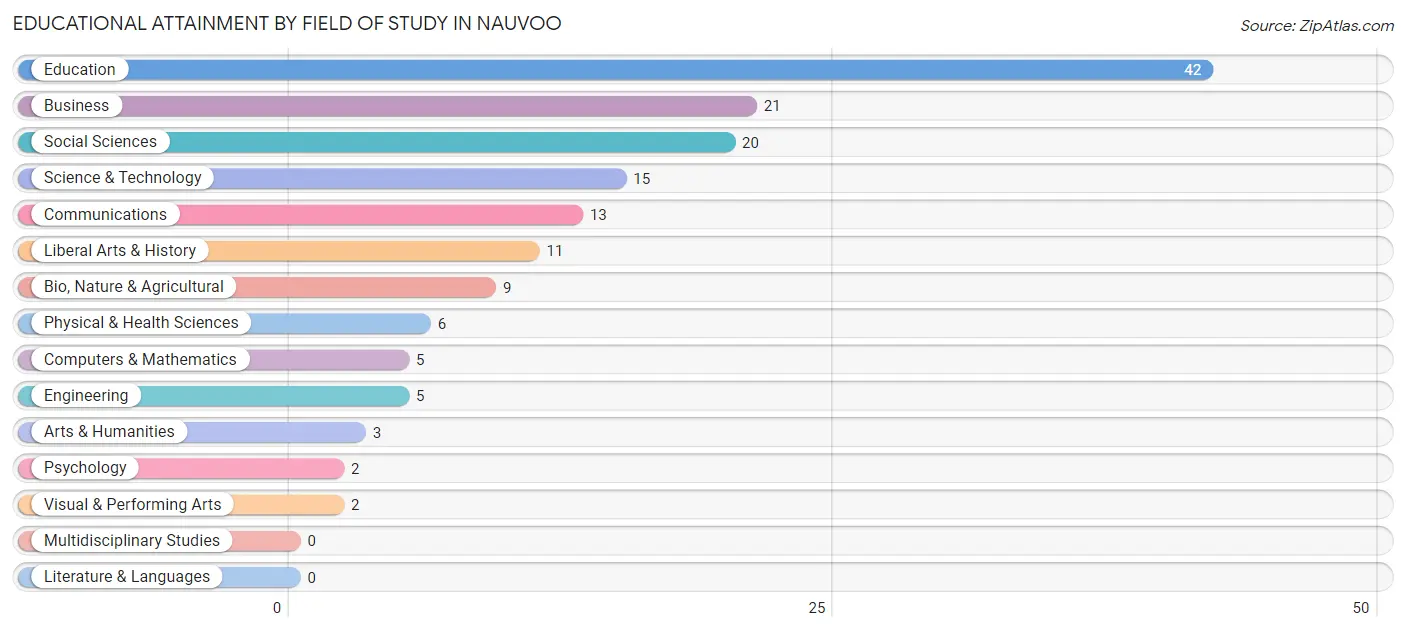
| Field of Study | # Graduates | % Graduates |
| Computers & Mathematics | 5 | 3.3% |
| Bio, Nature & Agricultural | 9 | 5.8% |
| Physical & Health Sciences | 6 | 3.9% |
| Psychology | 2 | 1.3% |
| Social Sciences | 20 | 13.0% |
| Engineering | 5 | 3.3% |
| Multidisciplinary Studies | 0 | 0.0% |
| Science & Technology | 15 | 9.7% |
| Business | 21 | 13.6% |
| Education | 42 | 27.3% |
| Literature & Languages | 0 | 0.0% |
| Liberal Arts & History | 11 | 7.1% |
| Visual & Performing Arts | 2 | 1.3% |
| Communications | 13 | 8.4% |
| Arts & Humanities | 3 | 1.9% |
| Total | 154 | 100.0% |
Transportation & Commute in Nauvoo
Vehicle Availability by Sex in Nauvoo
The most prevalent vehicle ownership categories in Nauvoo are males with 3 vehicles (61, accounting for 48.4%) and females with 3 vehicles (67, making up 39.4%).
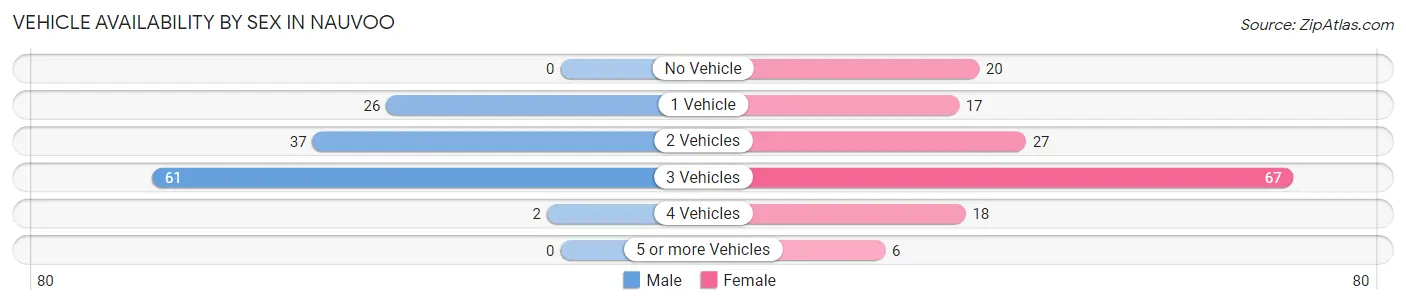
| Vehicles Available | Male | Female |
| No Vehicle | 0 (0.0%) | 20 (12.9%) |
| 1 Vehicle | 26 (20.6%) | 17 (11.0%) |
| 2 Vehicles | 37 (29.4%) | 27 (17.4%) |
| 3 Vehicles | 61 (48.4%) | 67 (43.2%) |
| 4 Vehicles | 2 (1.6%) | 18 (11.6%) |
| 5 or more Vehicles | 0 (0.0%) | 6 (3.9%) |
| Total | 126 (100.0%) | 155 (100.0%) |
Commute Time in Nauvoo
The most frequently occuring commute durations in Nauvoo are less than 5 minutes (60 commuters, 21.3%), 5 to 9 minutes (49 commuters, 17.4%), and 10 to 14 minutes (41 commuters, 14.5%).
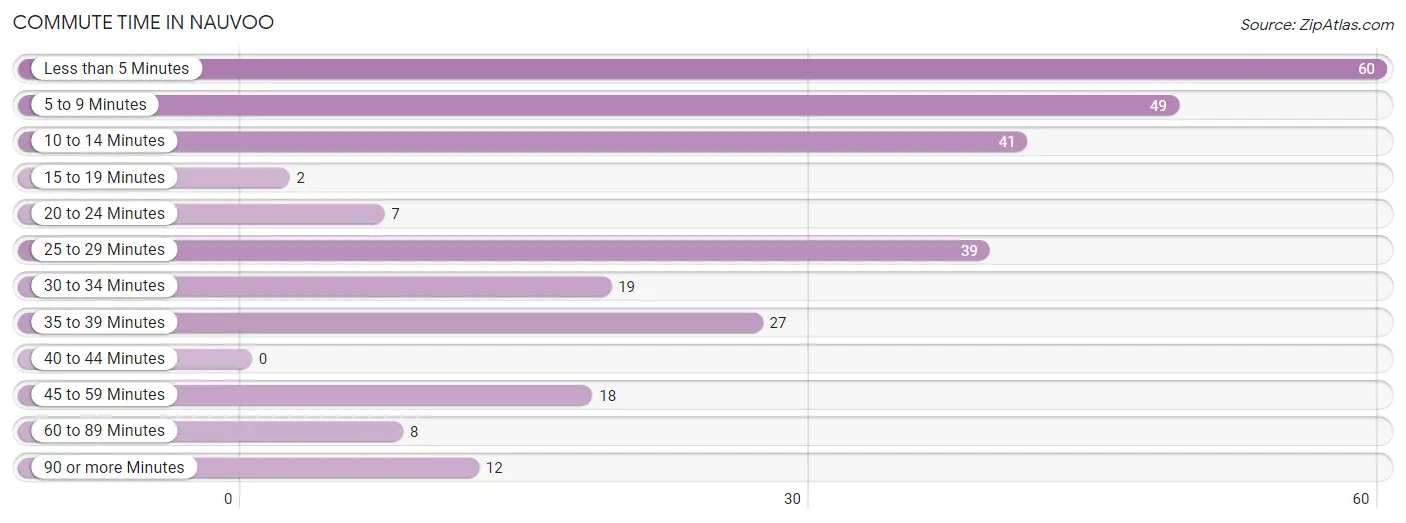
| Commute Time | # Commuters | % Commuters |
| Less than 5 Minutes | 60 | 21.3% |
| 5 to 9 Minutes | 49 | 17.4% |
| 10 to 14 Minutes | 41 | 14.5% |
| 15 to 19 Minutes | 2 | 0.7% |
| 20 to 24 Minutes | 7 | 2.5% |
| 25 to 29 Minutes | 39 | 13.8% |
| 30 to 34 Minutes | 19 | 6.7% |
| 35 to 39 Minutes | 27 | 9.6% |
| 40 to 44 Minutes | 0 | 0.0% |
| 45 to 59 Minutes | 18 | 6.4% |
| 60 to 89 Minutes | 8 | 2.8% |
| 90 or more Minutes | 12 | 4.3% |
Commute Time by Sex in Nauvoo
The most common commute times in Nauvoo are less than 5 minutes (31 commuters, 25.2%) for males and 5 to 9 minutes (42 commuters, 26.4%) for females.
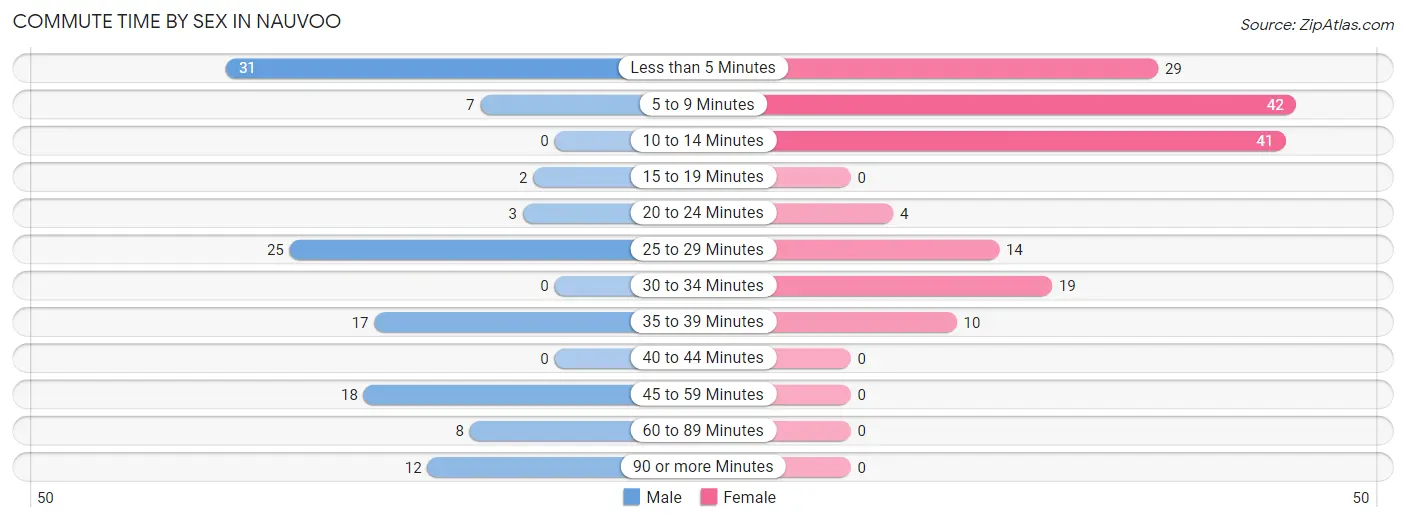
| Commute Time | Male | Female |
| Less than 5 Minutes | 31 (25.2%) | 29 (18.2%) |
| 5 to 9 Minutes | 7 (5.7%) | 42 (26.4%) |
| 10 to 14 Minutes | 0 (0.0%) | 41 (25.8%) |
| 15 to 19 Minutes | 2 (1.6%) | 0 (0.0%) |
| 20 to 24 Minutes | 3 (2.4%) | 4 (2.5%) |
| 25 to 29 Minutes | 25 (20.3%) | 14 (8.8%) |
| 30 to 34 Minutes | 0 (0.0%) | 19 (11.9%) |
| 35 to 39 Minutes | 17 (13.8%) | 10 (6.3%) |
| 40 to 44 Minutes | 0 (0.0%) | 0 (0.0%) |
| 45 to 59 Minutes | 18 (14.6%) | 0 (0.0%) |
| 60 to 89 Minutes | 8 (6.5%) | 0 (0.0%) |
| 90 or more Minutes | 12 (9.8%) | 0 (0.0%) |
Time of Departure to Work by Sex in Nauvoo
The most frequent times of departure to work in Nauvoo are 6:00 AM to 6:29 AM (32, 26.0%) for males and 6:30 AM to 6:59 AM (24, 15.1%) for females.
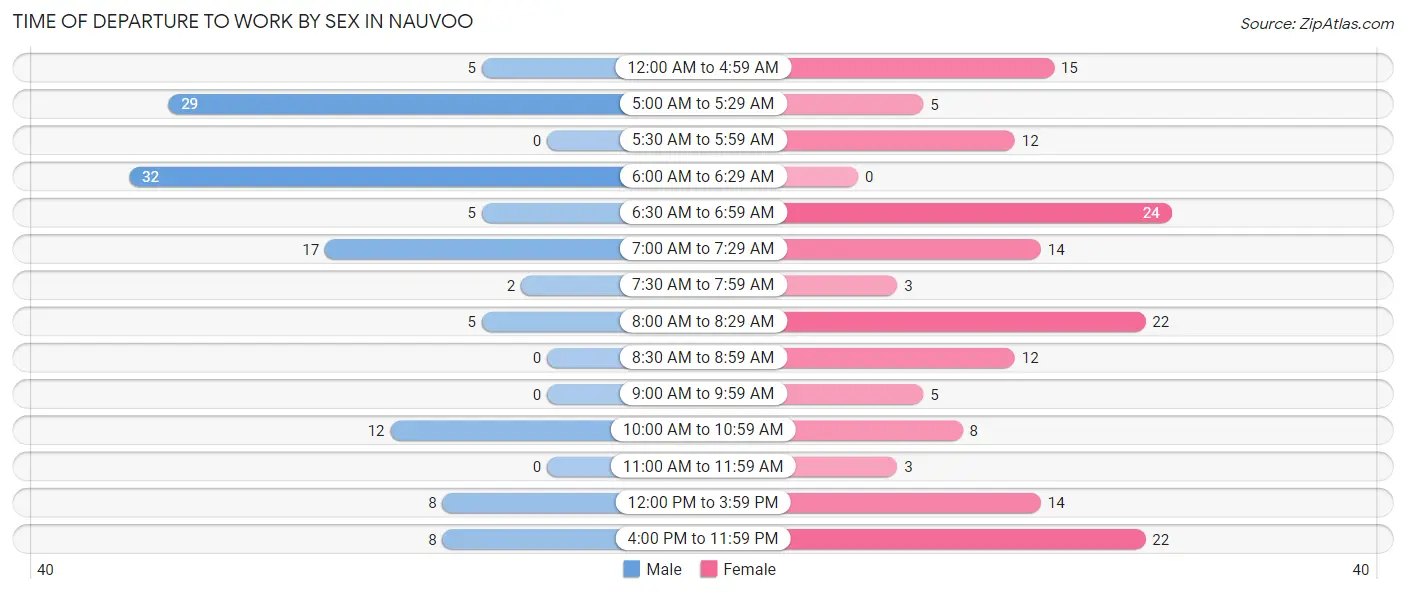
| Time of Departure | Male | Female |
| 12:00 AM to 4:59 AM | 5 (4.1%) | 15 (9.4%) |
| 5:00 AM to 5:29 AM | 29 (23.6%) | 5 (3.1%) |
| 5:30 AM to 5:59 AM | 0 (0.0%) | 12 (7.5%) |
| 6:00 AM to 6:29 AM | 32 (26.0%) | 0 (0.0%) |
| 6:30 AM to 6:59 AM | 5 (4.1%) | 24 (15.1%) |
| 7:00 AM to 7:29 AM | 17 (13.8%) | 14 (8.8%) |
| 7:30 AM to 7:59 AM | 2 (1.6%) | 3 (1.9%) |
| 8:00 AM to 8:29 AM | 5 (4.1%) | 22 (13.8%) |
| 8:30 AM to 8:59 AM | 0 (0.0%) | 12 (7.5%) |
| 9:00 AM to 9:59 AM | 0 (0.0%) | 5 (3.1%) |
| 10:00 AM to 10:59 AM | 12 (9.8%) | 8 (5.0%) |
| 11:00 AM to 11:59 AM | 0 (0.0%) | 3 (1.9%) |
| 12:00 PM to 3:59 PM | 8 (6.5%) | 14 (8.8%) |
| 4:00 PM to 11:59 PM | 8 (6.5%) | 22 (13.8%) |
| Total | 123 (100.0%) | 159 (100.0%) |
Housing Occupancy in Nauvoo
Occupancy by Ownership in Nauvoo
Of the total 296 dwellings in Nauvoo, owner-occupied units account for 218 (73.7%), while renter-occupied units make up 78 (26.4%).
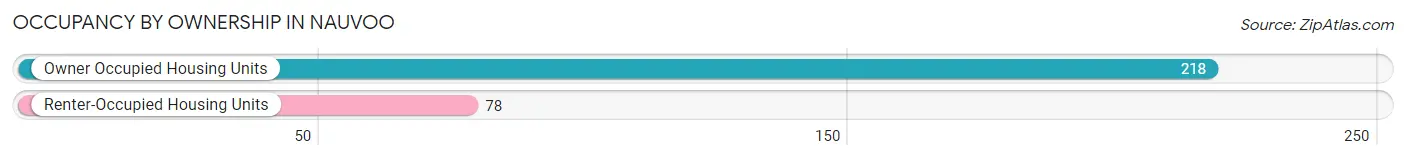
| Occupancy | # Housing Units | % Housing Units |
| Owner Occupied Housing Units | 218 | 73.7% |
| Renter-Occupied Housing Units | 78 | 26.4% |
| Total Occupied Housing Units | 296 | 100.0% |
Occupancy by Household Size in Nauvoo
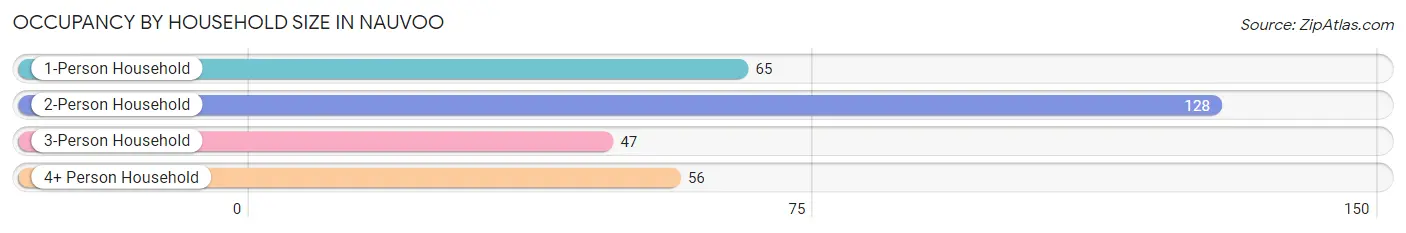
| Household Size | # Housing Units | % Housing Units |
| 1-Person Household | 65 | 22.0% |
| 2-Person Household | 128 | 43.2% |
| 3-Person Household | 47 | 15.9% |
| 4+ Person Household | 56 | 18.9% |
| Total Housing Units | 296 | 100.0% |
Occupancy by Ownership by Household Size in Nauvoo
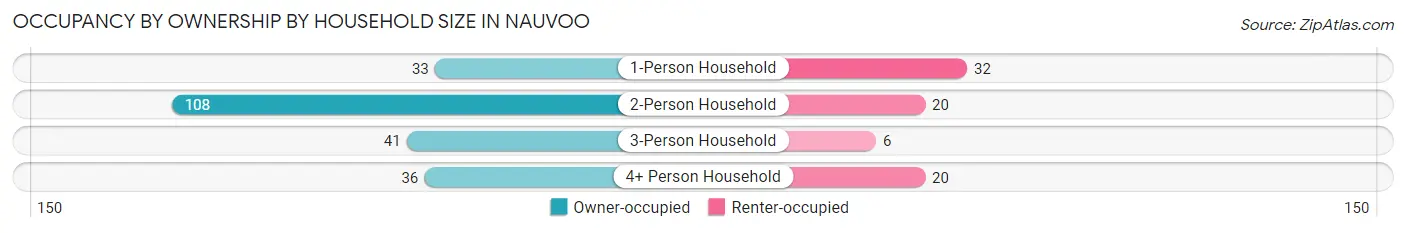
| Household Size | Owner-occupied | Renter-occupied |
| 1-Person Household | 33 (50.8%) | 32 (49.2%) |
| 2-Person Household | 108 (84.4%) | 20 (15.6%) |
| 3-Person Household | 41 (87.2%) | 6 (12.8%) |
| 4+ Person Household | 36 (64.3%) | 20 (35.7%) |
| Total Housing Units | 218 (73.7%) | 78 (26.4%) |
Occupancy by Educational Attainment in Nauvoo
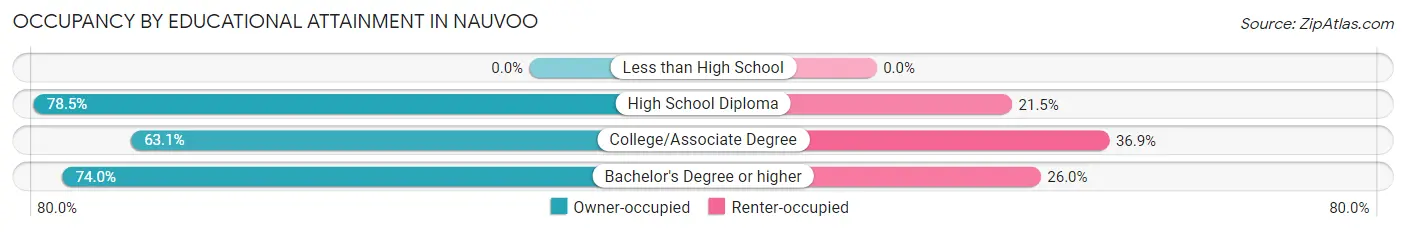
| Household Size | Owner-occupied | Renter-occupied |
| Less than High School | 0 (0.0%) | 0 (0.0%) |
| High School Diploma | 106 (78.5%) | 29 (21.5%) |
| College/Associate Degree | 41 (63.1%) | 24 (36.9%) |
| Bachelor's Degree or higher | 71 (74.0%) | 25 (26.0%) |
Occupancy by Age of Householder in Nauvoo
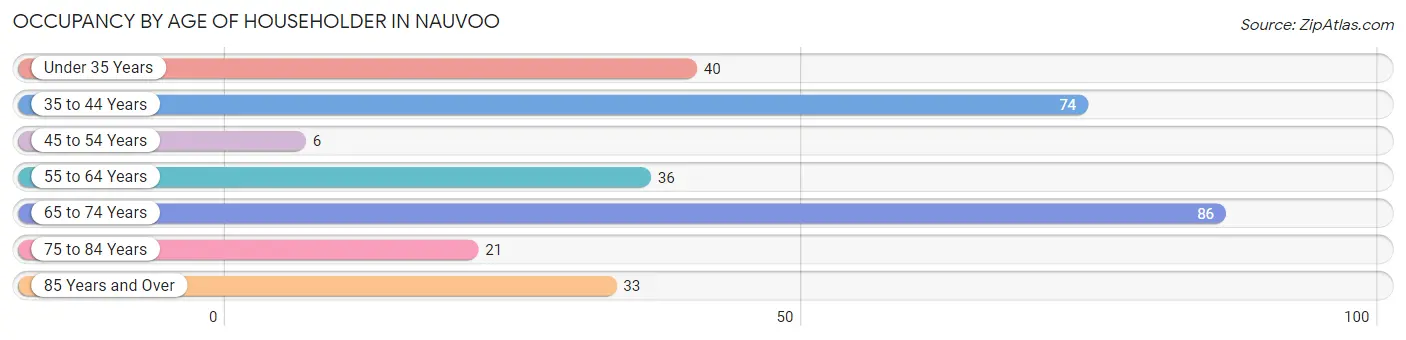
| Age Bracket | # Households | % Households |
| Under 35 Years | 40 | 13.5% |
| 35 to 44 Years | 74 | 25.0% |
| 45 to 54 Years | 6 | 2.0% |
| 55 to 64 Years | 36 | 12.2% |
| 65 to 74 Years | 86 | 29.0% |
| 75 to 84 Years | 21 | 7.1% |
| 85 Years and Over | 33 | 11.2% |
| Total | 296 | 100.0% |
Housing Finances in Nauvoo
Median Income by Occupancy in Nauvoo
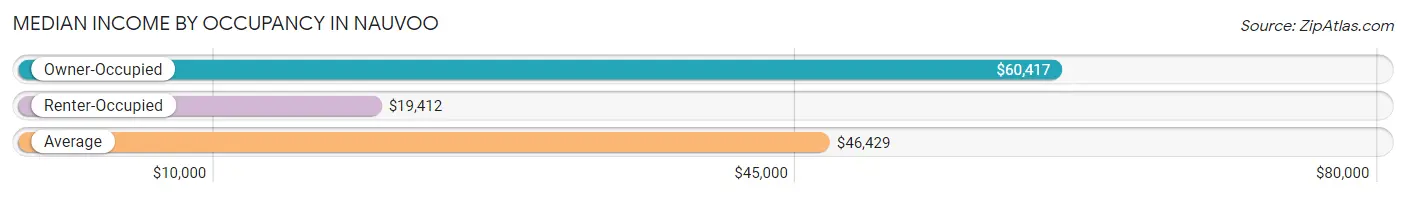
| Occupancy Type | # Households | Median Income |
| Owner-Occupied | 218 (73.7%) | $60,417 |
| Renter-Occupied | 78 (26.4%) | $19,412 |
| Average | 296 (100.0%) | $46,429 |
Occupancy by Householder Income Bracket in Nauvoo
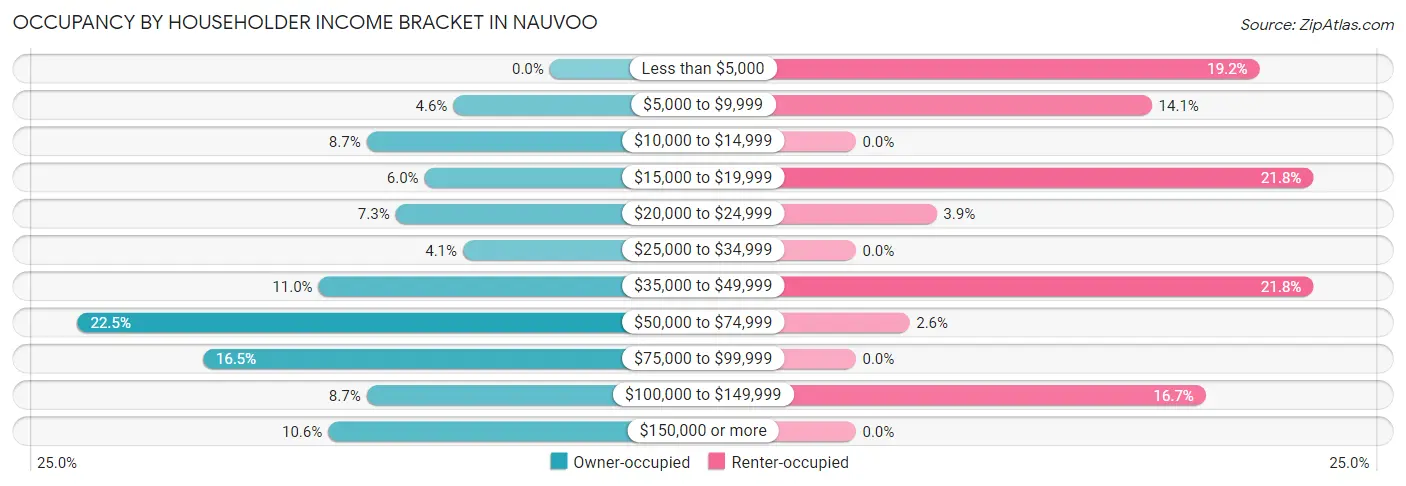
| Income Bracket | Owner-occupied | Renter-occupied |
| Less than $5,000 | 0 (0.0%) | 15 (19.2%) |
| $5,000 to $9,999 | 10 (4.6%) | 11 (14.1%) |
| $10,000 to $14,999 | 19 (8.7%) | 0 (0.0%) |
| $15,000 to $19,999 | 13 (6.0%) | 17 (21.8%) |
| $20,000 to $24,999 | 16 (7.3%) | 3 (3.8%) |
| $25,000 to $34,999 | 9 (4.1%) | 0 (0.0%) |
| $35,000 to $49,999 | 24 (11.0%) | 17 (21.8%) |
| $50,000 to $74,999 | 49 (22.5%) | 2 (2.6%) |
| $75,000 to $99,999 | 36 (16.5%) | 0 (0.0%) |
| $100,000 to $149,999 | 19 (8.7%) | 13 (16.7%) |
| $150,000 or more | 23 (10.5%) | 0 (0.0%) |
| Total | 218 (100.0%) | 78 (100.0%) |
Monthly Housing Cost Tiers in Nauvoo
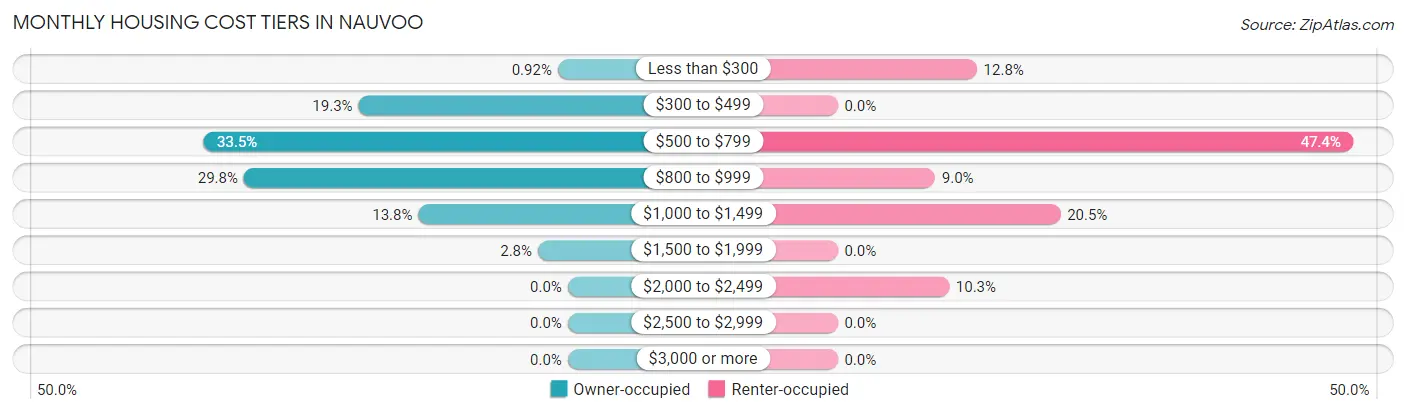
| Monthly Cost | Owner-occupied | Renter-occupied |
| Less than $300 | 2 (0.9%) | 10 (12.8%) |
| $300 to $499 | 42 (19.3%) | 0 (0.0%) |
| $500 to $799 | 73 (33.5%) | 37 (47.4%) |
| $800 to $999 | 65 (29.8%) | 7 (9.0%) |
| $1,000 to $1,499 | 30 (13.8%) | 16 (20.5%) |
| $1,500 to $1,999 | 6 (2.8%) | 0 (0.0%) |
| $2,000 to $2,499 | 0 (0.0%) | 8 (10.3%) |
| $2,500 to $2,999 | 0 (0.0%) | 0 (0.0%) |
| $3,000 or more | 0 (0.0%) | 0 (0.0%) |
| Total | 218 (100.0%) | 78 (100.0%) |
Physical Housing Characteristics in Nauvoo
Housing Structures in Nauvoo
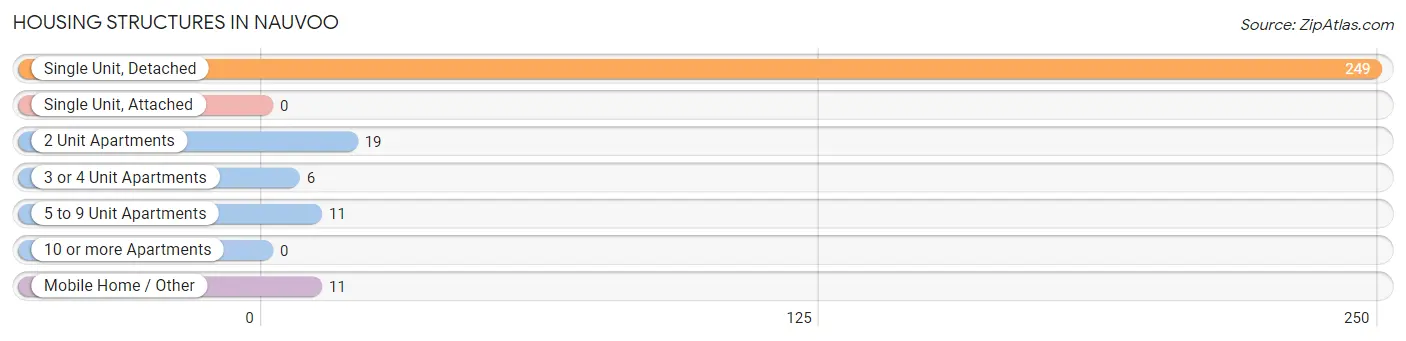
| Structure Type | # Housing Units | % Housing Units |
| Single Unit, Detached | 249 | 84.1% |
| Single Unit, Attached | 0 | 0.0% |
| 2 Unit Apartments | 19 | 6.4% |
| 3 or 4 Unit Apartments | 6 | 2.0% |
| 5 to 9 Unit Apartments | 11 | 3.7% |
| 10 or more Apartments | 0 | 0.0% |
| Mobile Home / Other | 11 | 3.7% |
| Total | 296 | 100.0% |
Housing Structures by Occupancy in Nauvoo
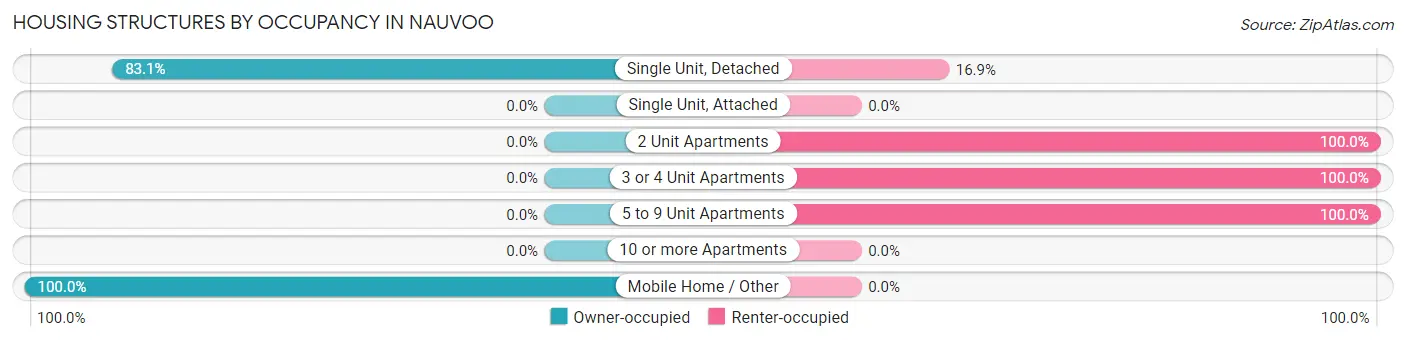
| Structure Type | Owner-occupied | Renter-occupied |
| Single Unit, Detached | 207 (83.1%) | 42 (16.9%) |
| Single Unit, Attached | 0 (0.0%) | 0 (0.0%) |
| 2 Unit Apartments | 0 (0.0%) | 19 (100.0%) |
| 3 or 4 Unit Apartments | 0 (0.0%) | 6 (100.0%) |
| 5 to 9 Unit Apartments | 0 (0.0%) | 11 (100.0%) |
| 10 or more Apartments | 0 (0.0%) | 0 (0.0%) |
| Mobile Home / Other | 11 (100.0%) | 0 (0.0%) |
| Total | 218 (73.7%) | 78 (26.4%) |
Housing Structures by Number of Rooms in Nauvoo
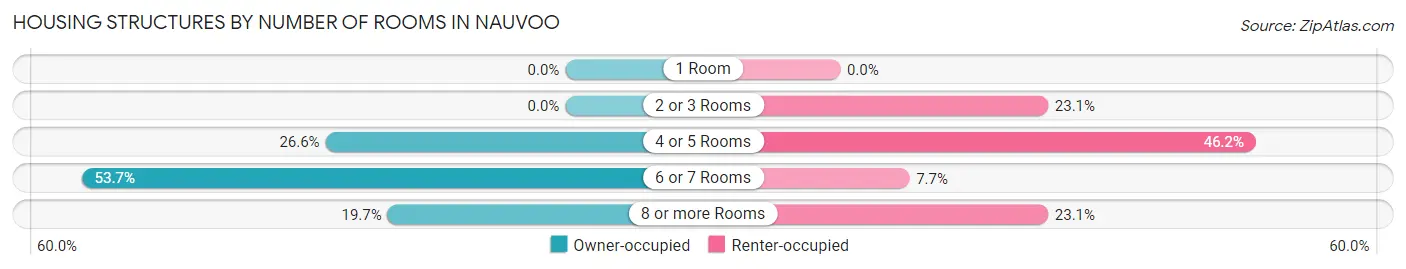
| Number of Rooms | Owner-occupied | Renter-occupied |
| 1 Room | 0 (0.0%) | 0 (0.0%) |
| 2 or 3 Rooms | 0 (0.0%) | 18 (23.1%) |
| 4 or 5 Rooms | 58 (26.6%) | 36 (46.2%) |
| 6 or 7 Rooms | 117 (53.7%) | 6 (7.7%) |
| 8 or more Rooms | 43 (19.7%) | 18 (23.1%) |
| Total | 218 (100.0%) | 78 (100.0%) |
Housing Structure by Heating Type in Nauvoo
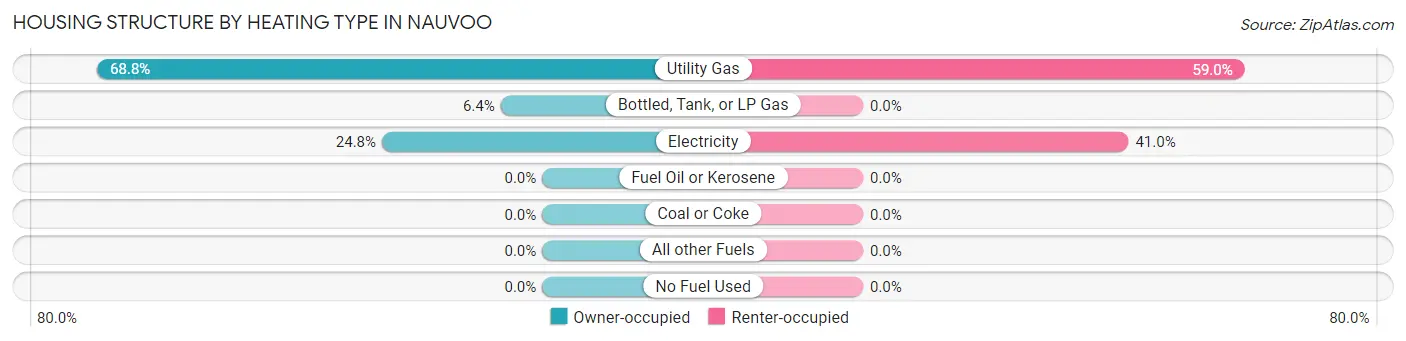
| Heating Type | Owner-occupied | Renter-occupied |
| Utility Gas | 150 (68.8%) | 46 (59.0%) |
| Bottled, Tank, or LP Gas | 14 (6.4%) | 0 (0.0%) |
| Electricity | 54 (24.8%) | 32 (41.0%) |
| Fuel Oil or Kerosene | 0 (0.0%) | 0 (0.0%) |
| Coal or Coke | 0 (0.0%) | 0 (0.0%) |
| All other Fuels | 0 (0.0%) | 0 (0.0%) |
| No Fuel Used | 0 (0.0%) | 0 (0.0%) |
| Total | 218 (100.0%) | 78 (100.0%) |
Household Vehicle Usage in Nauvoo
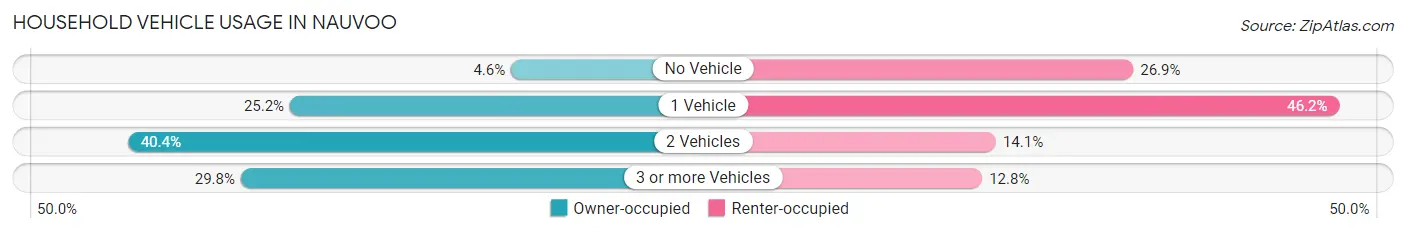
| Vehicles per Household | Owner-occupied | Renter-occupied |
| No Vehicle | 10 (4.6%) | 21 (26.9%) |
| 1 Vehicle | 55 (25.2%) | 36 (46.2%) |
| 2 Vehicles | 88 (40.4%) | 11 (14.1%) |
| 3 or more Vehicles | 65 (29.8%) | 10 (12.8%) |
| Total | 218 (100.0%) | 78 (100.0%) |
Real Estate & Mortgages in Nauvoo
Real Estate and Mortgage Overview in Nauvoo
| Characteristic | Without Mortgage | With Mortgage |
| Housing Units | 141 | 77 |
| Median Property Value | $117,700 | $112,500 |
| Median Household Income | $67,813 | $5 |
| Monthly Housing Costs | $613 | $0 |
| Real Estate Taxes | $2,932 | $0 |
Property Value by Mortgage Status in Nauvoo
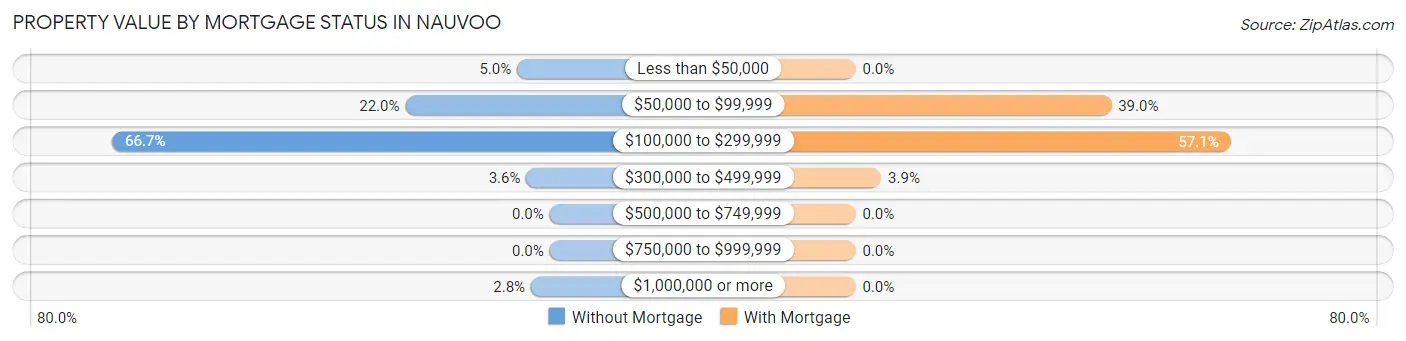
| Property Value | Without Mortgage | With Mortgage |
| Less than $50,000 | 7 (5.0%) | 0 (0.0%) |
| $50,000 to $99,999 | 31 (22.0%) | 30 (39.0%) |
| $100,000 to $299,999 | 94 (66.7%) | 44 (57.1%) |
| $300,000 to $499,999 | 5 (3.5%) | 3 (3.9%) |
| $500,000 to $749,999 | 0 (0.0%) | 0 (0.0%) |
| $750,000 to $999,999 | 0 (0.0%) | 0 (0.0%) |
| $1,000,000 or more | 4 (2.8%) | 0 (0.0%) |
| Total | 141 (100.0%) | 77 (100.0%) |
Household Income by Mortgage Status in Nauvoo
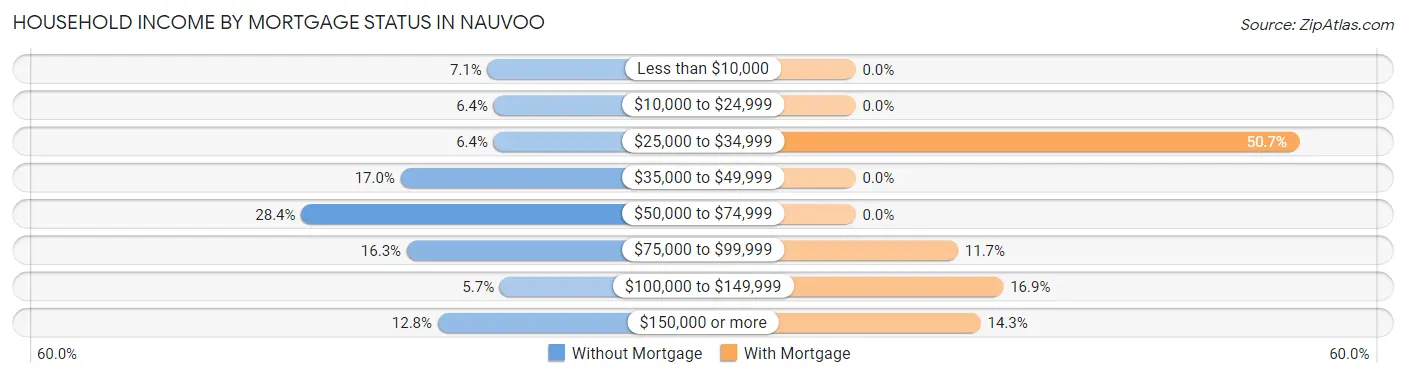
| Household Income | Without Mortgage | With Mortgage |
| Less than $10,000 | 10 (7.1%) | 0 (0.0%) |
| $10,000 to $24,999 | 9 (6.4%) | 0 (0.0%) |
| $25,000 to $34,999 | 9 (6.4%) | 39 (50.6%) |
| $35,000 to $49,999 | 24 (17.0%) | 0 (0.0%) |
| $50,000 to $74,999 | 40 (28.4%) | 0 (0.0%) |
| $75,000 to $99,999 | 23 (16.3%) | 9 (11.7%) |
| $100,000 to $149,999 | 8 (5.7%) | 13 (16.9%) |
| $150,000 or more | 18 (12.8%) | 11 (14.3%) |
| Total | 141 (100.0%) | 77 (100.0%) |
Property Value to Household Income Ratio in Nauvoo
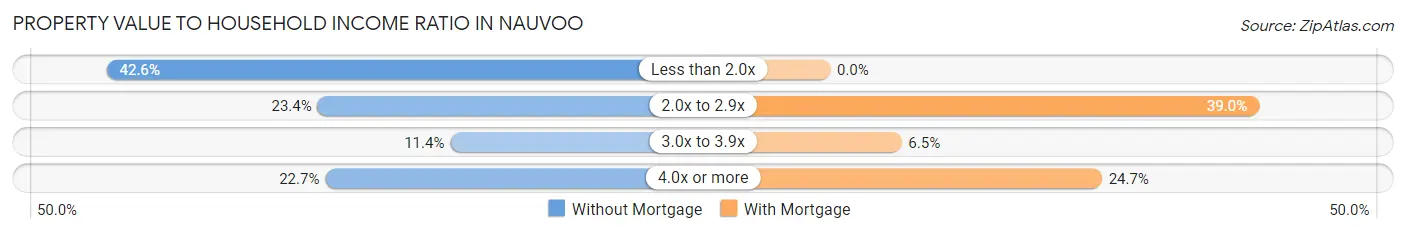
| Value-to-Income Ratio | Without Mortgage | With Mortgage |
| Less than 2.0x | 60 (42.5%) | 0 (0.0%) |
| 2.0x to 2.9x | 33 (23.4%) | 30 (39.0%) |
| 3.0x to 3.9x | 16 (11.4%) | 5 (6.5%) |
| 4.0x or more | 32 (22.7%) | 19 (24.7%) |
| Total | 141 (100.0%) | 77 (100.0%) |
Real Estate Taxes by Mortgage Status in Nauvoo
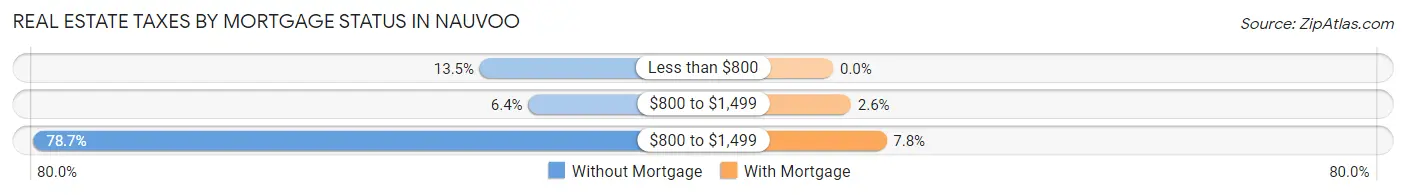
| Property Taxes | Without Mortgage | With Mortgage |
| Less than $800 | 19 (13.5%) | 0 (0.0%) |
| $800 to $1,499 | 9 (6.4%) | 2 (2.6%) |
| $800 to $1,499 | 111 (78.7%) | 6 (7.8%) |
| Total | 141 (100.0%) | 77 (100.0%) |
Health & Disability in Nauvoo
Health Insurance Coverage by Age in Nauvoo
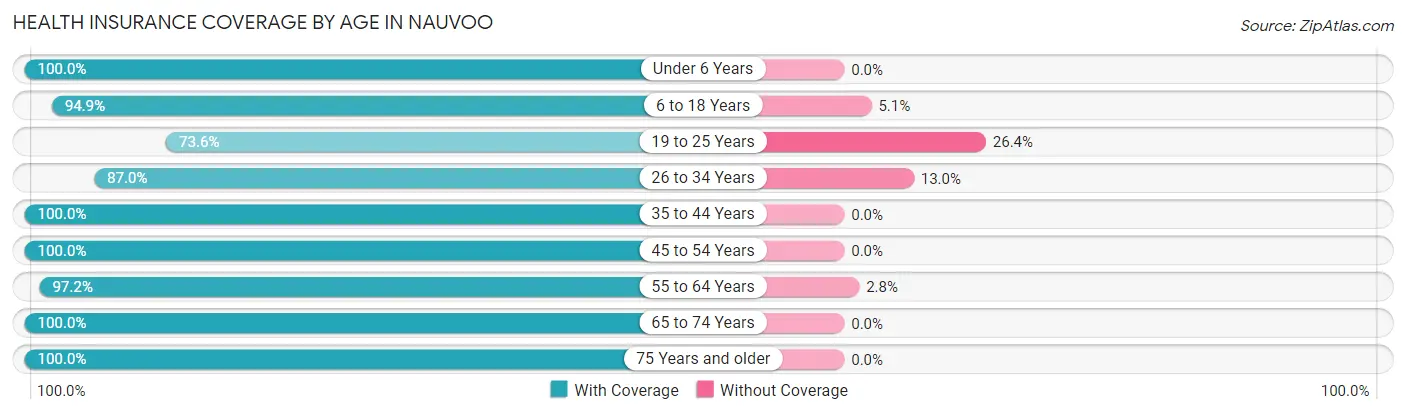
| Age Bracket | With Coverage | Without Coverage |
| Under 6 Years | 56 (100.0%) | 0 (0.0%) |
| 6 to 18 Years | 131 (94.9%) | 7 (5.1%) |
| 19 to 25 Years | 92 (73.6%) | 33 (26.4%) |
| 26 to 34 Years | 47 (87.0%) | 7 (13.0%) |
| 35 to 44 Years | 138 (100.0%) | 0 (0.0%) |
| 45 to 54 Years | 10 (100.0%) | 0 (0.0%) |
| 55 to 64 Years | 70 (97.2%) | 2 (2.8%) |
| 65 to 74 Years | 165 (100.0%) | 0 (0.0%) |
| 75 Years and older | 103 (100.0%) | 0 (0.0%) |
| Total | 812 (94.3%) | 49 (5.7%) |
Health Insurance Coverage by Citizenship Status in Nauvoo
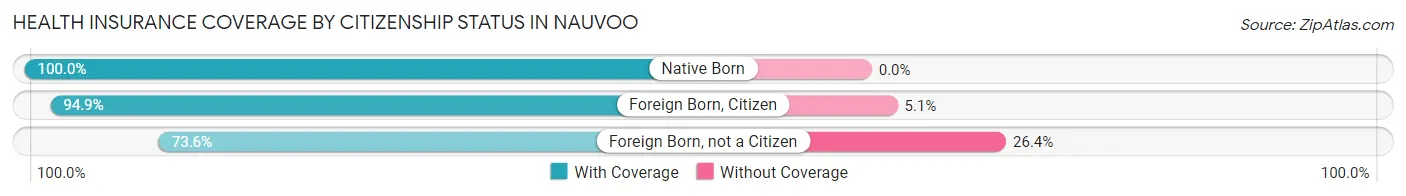
| Citizenship Status | With Coverage | Without Coverage |
| Native Born | 56 (100.0%) | 0 (0.0%) |
| Foreign Born, Citizen | 131 (94.9%) | 7 (5.1%) |
| Foreign Born, not a Citizen | 92 (73.6%) | 33 (26.4%) |
Health Insurance Coverage by Household Income in Nauvoo
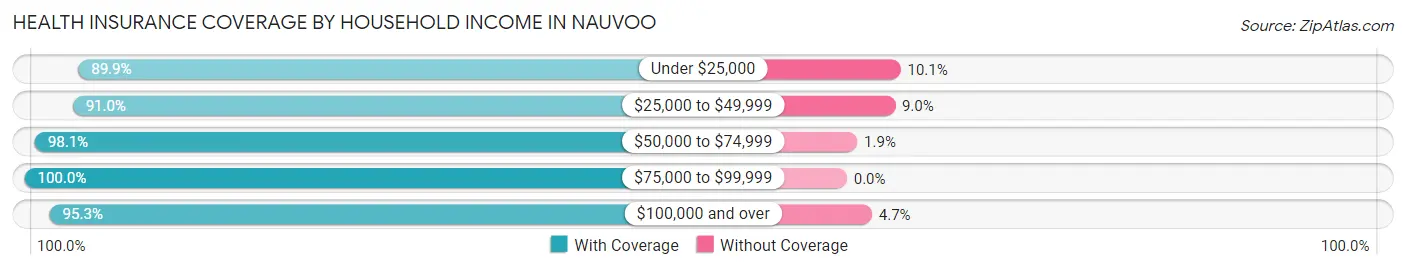
| Household Income | With Coverage | Without Coverage |
| Under $25,000 | 250 (89.9%) | 28 (10.1%) |
| $25,000 to $49,999 | 121 (91.0%) | 12 (9.0%) |
| $50,000 to $74,999 | 101 (98.1%) | 2 (1.9%) |
| $75,000 to $99,999 | 162 (100.0%) | 0 (0.0%) |
| $100,000 and over | 142 (95.3%) | 7 (4.7%) |
Public vs Private Health Insurance Coverage by Age in Nauvoo
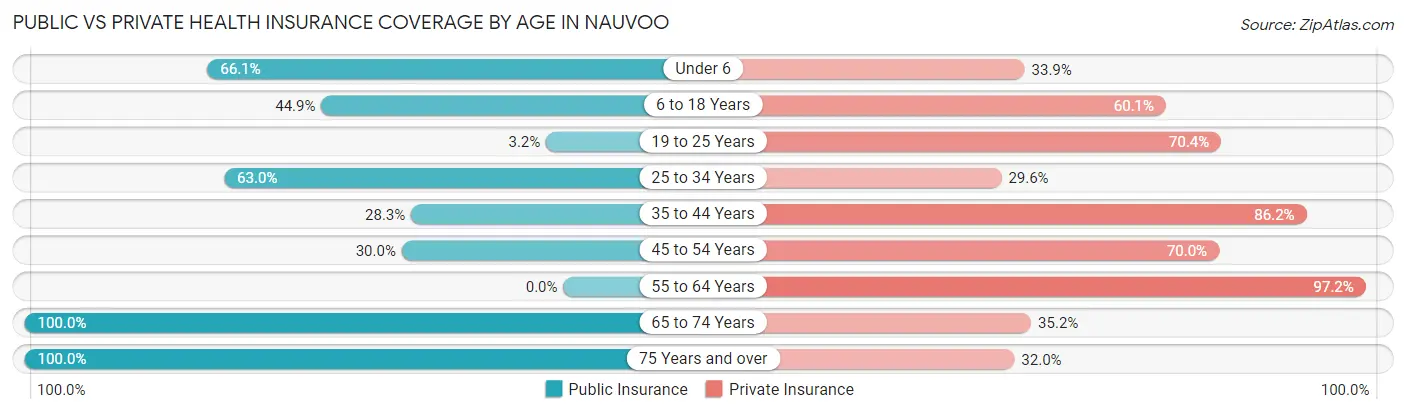
| Age Bracket | Public Insurance | Private Insurance |
| Under 6 | 37 (66.1%) | 19 (33.9%) |
| 6 to 18 Years | 62 (44.9%) | 83 (60.1%) |
| 19 to 25 Years | 4 (3.2%) | 88 (70.4%) |
| 25 to 34 Years | 34 (63.0%) | 16 (29.6%) |
| 35 to 44 Years | 39 (28.3%) | 119 (86.2%) |
| 45 to 54 Years | 3 (30.0%) | 7 (70.0%) |
| 55 to 64 Years | 0 (0.0%) | 70 (97.2%) |
| 65 to 74 Years | 165 (100.0%) | 58 (35.1%) |
| 75 Years and over | 103 (100.0%) | 33 (32.0%) |
| Total | 447 (51.9%) | 493 (57.3%) |
Disability Status by Sex by Age in Nauvoo
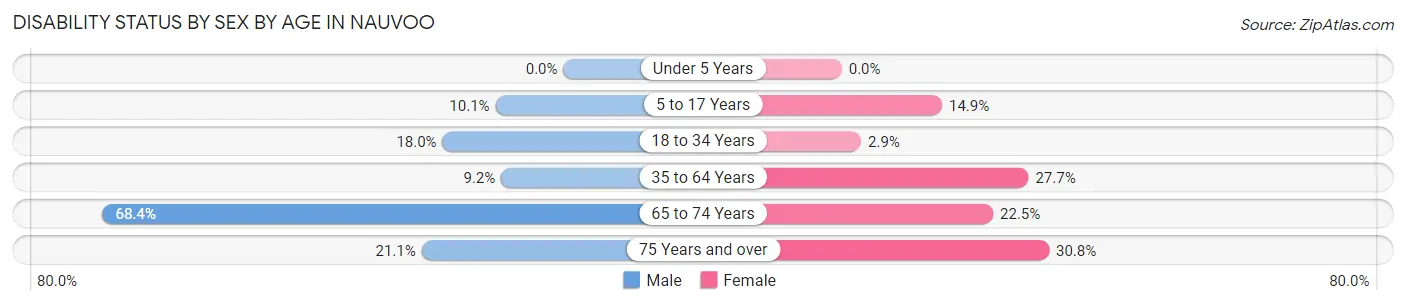
| Age Bracket | Male | Female |
| Under 5 Years | 0 (0.0%) | 0 (0.0%) |
| 5 to 17 Years | 11 (10.1%) | 7 (14.9%) |
| 18 to 34 Years | 14 (17.9%) | 3 (2.9%) |
| 35 to 64 Years | 11 (9.2%) | 28 (27.7%) |
| 65 to 74 Years | 52 (68.4%) | 20 (22.5%) |
| 75 Years and over | 8 (21.0%) | 20 (30.8%) |
Disability Class by Sex by Age in Nauvoo
Disability Class: Hearing Difficulty
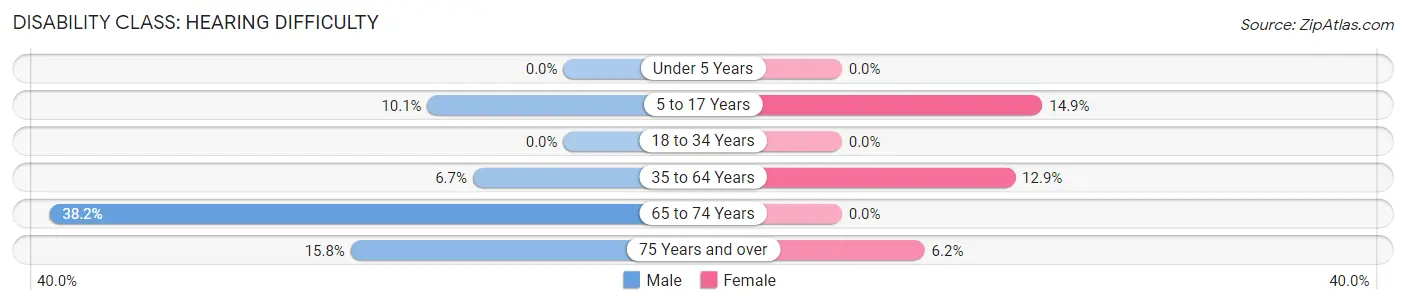
| Age Bracket | Male | Female |
| Under 5 Years | 0 (0.0%) | 0 (0.0%) |
| 5 to 17 Years | 11 (10.1%) | 7 (14.9%) |
| 18 to 34 Years | 0 (0.0%) | 0 (0.0%) |
| 35 to 64 Years | 8 (6.7%) | 13 (12.9%) |
| 65 to 74 Years | 29 (38.2%) | 0 (0.0%) |
| 75 Years and over | 6 (15.8%) | 4 (6.1%) |
Disability Class: Vision Difficulty
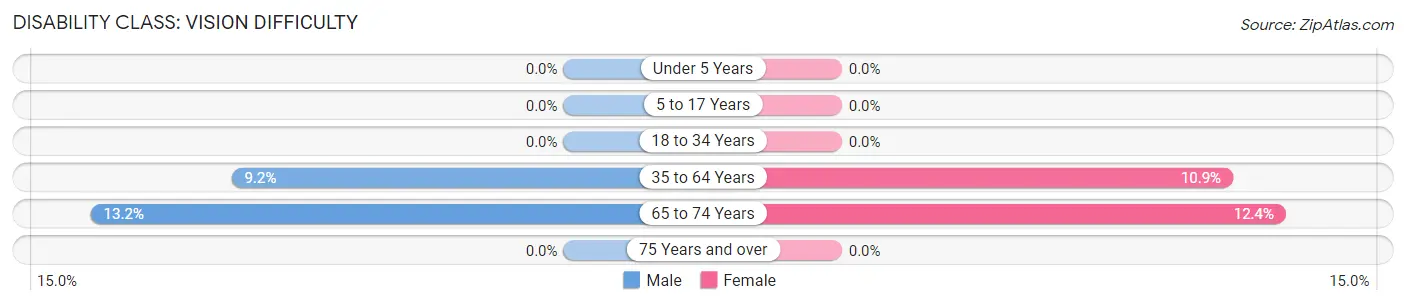
| Age Bracket | Male | Female |
| Under 5 Years | 0 (0.0%) | 0 (0.0%) |
| 5 to 17 Years | 0 (0.0%) | 0 (0.0%) |
| 18 to 34 Years | 0 (0.0%) | 0 (0.0%) |
| 35 to 64 Years | 11 (9.2%) | 11 (10.9%) |
| 65 to 74 Years | 10 (13.2%) | 11 (12.4%) |
| 75 Years and over | 0 (0.0%) | 0 (0.0%) |
Disability Class: Cognitive Difficulty
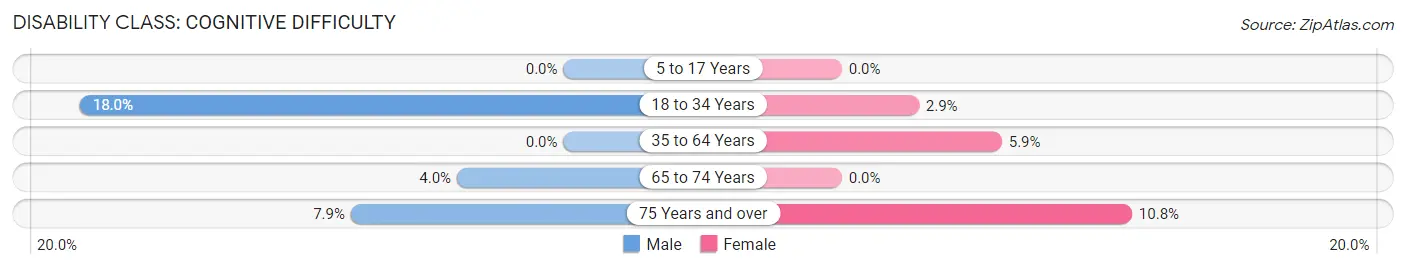
| Age Bracket | Male | Female |
| 5 to 17 Years | 0 (0.0%) | 0 (0.0%) |
| 18 to 34 Years | 14 (17.9%) | 3 (2.9%) |
| 35 to 64 Years | 0 (0.0%) | 6 (5.9%) |
| 65 to 74 Years | 3 (4.0%) | 0 (0.0%) |
| 75 Years and over | 3 (7.9%) | 7 (10.8%) |
Disability Class: Ambulatory Difficulty
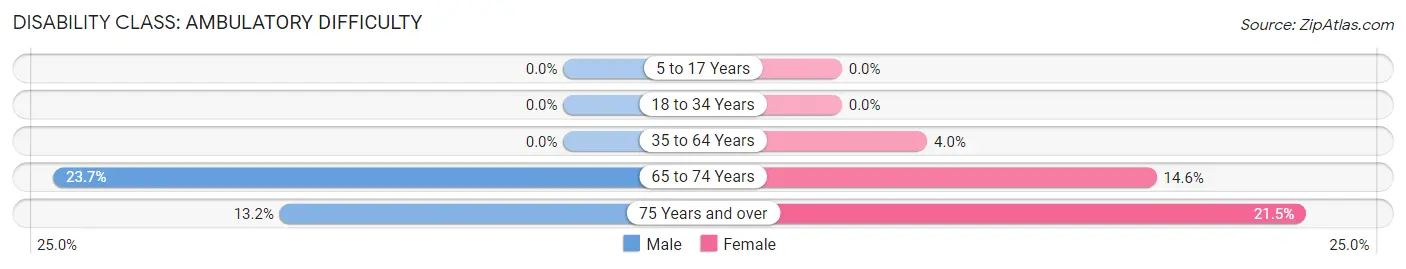
| Age Bracket | Male | Female |
| 5 to 17 Years | 0 (0.0%) | 0 (0.0%) |
| 18 to 34 Years | 0 (0.0%) | 0 (0.0%) |
| 35 to 64 Years | 0 (0.0%) | 4 (4.0%) |
| 65 to 74 Years | 18 (23.7%) | 13 (14.6%) |
| 75 Years and over | 5 (13.2%) | 14 (21.5%) |
Disability Class: Self-Care Difficulty
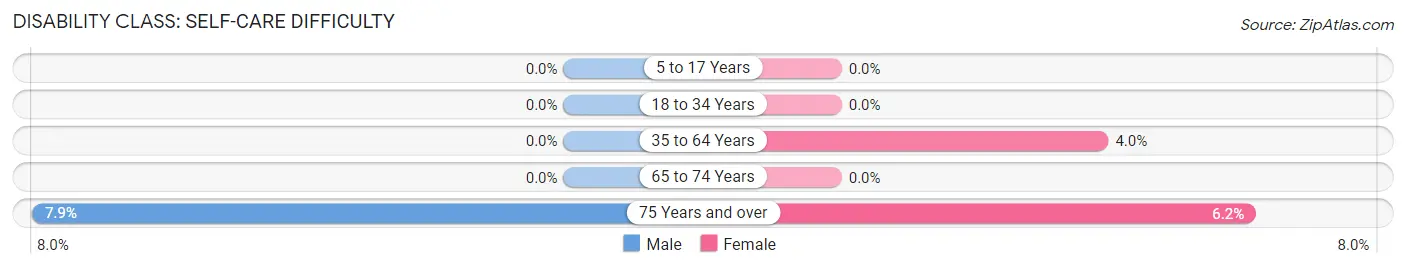
| Age Bracket | Male | Female |
| 5 to 17 Years | 0 (0.0%) | 0 (0.0%) |
| 18 to 34 Years | 0 (0.0%) | 0 (0.0%) |
| 35 to 64 Years | 0 (0.0%) | 4 (4.0%) |
| 65 to 74 Years | 0 (0.0%) | 0 (0.0%) |
| 75 Years and over | 3 (7.9%) | 4 (6.1%) |
Technology Access in Nauvoo
Computing Device Access in Nauvoo
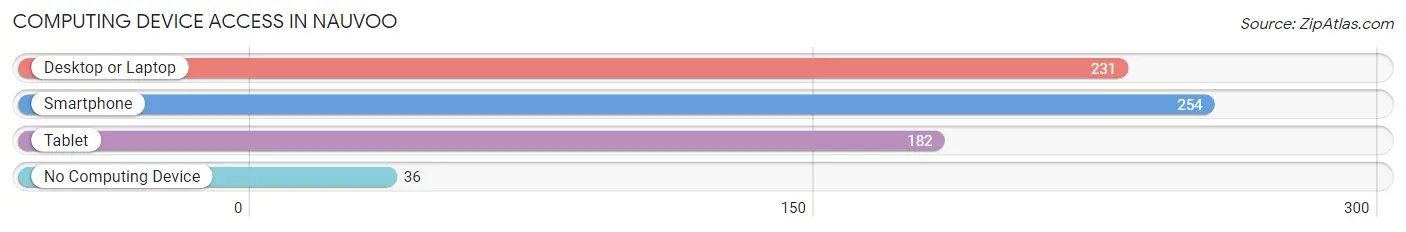
| Device Type | # Households | % Households |
| Desktop or Laptop | 231 | 78.0% |
| Smartphone | 254 | 85.8% |
| Tablet | 182 | 61.5% |
| No Computing Device | 36 | 12.2% |
| Total | 296 | 100.0% |
Internet Access in Nauvoo
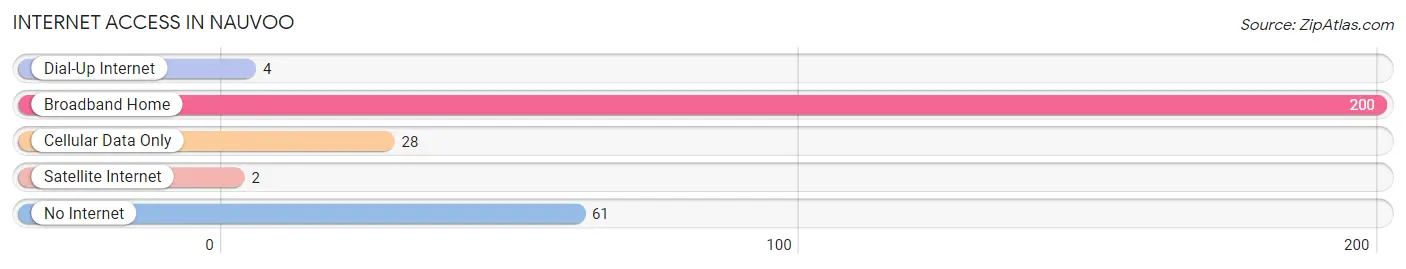
| Internet Type | # Households | % Households |
| Dial-Up Internet | 4 | 1.3% |
| Broadband Home | 200 | 67.6% |
| Cellular Data Only | 28 | 9.5% |
| Satellite Internet | 2 | 0.7% |
| No Internet | 61 | 20.6% |
| Total | 296 | 100.0% |
Nauvoo Summary
Nauvoo, Illinois is a small city located in Hancock County, Illinois, on the banks of the Mississippi River. It is best known as the site of the Mormon settlement of the 1840s and 1850s, and is now a popular tourist destination. The city has a population of 1,149 as of the 2010 census, and is part of the Keokuk-Hamilton Metropolitan Statistical Area.
History
Nauvoo was first settled in 1824 by a group of settlers from the nearby town of Commerce, Illinois. The settlers were led by Joseph Smith, Jr., the founder of the Church of Jesus Christ of Latter-day Saints (LDS Church). Smith and his followers established a settlement on the banks of the Mississippi River, which they named Nauvoo. The settlement quickly grew, and by 1839 it had become the largest city in Illinois.
The city was a major center of the LDS Church, and Smith and his followers built a temple there in 1841. The temple was destroyed by a mob in 1844, and Smith and his followers were forced to flee the city. The LDS Church was re-established in Utah in 1847, and the city of Nauvoo was abandoned.
In the late 19th century, the city was re-established by a group of Latter-day Saints who had returned to the area. The city was incorporated in 1849, and the Nauvoo Temple was rebuilt in 2002.
Geography
Nauvoo is located in Hancock County, Illinois, on the banks of the Mississippi River. The city has a total area of 1.2 square miles, all of which is land. The city is located about 90 miles southwest of Chicago, and about 30 miles north of the Quad Cities.
The city is situated on a bluff overlooking the Mississippi River, and is surrounded by rolling hills and farmland. The city is located in a humid continental climate zone, with hot, humid summers and cold, snowy winters.
Economy
Nauvoo's economy is largely based on tourism. The city is home to several historic sites, including the Nauvoo Temple, the Joseph Smith Historic Site, and the Nauvoo State Park. The city also hosts several annual festivals, including the Nauvoo Pageant, the Nauvoo Music Festival, and the Nauvoo Grape Festival.
The city is also home to several small businesses, including restaurants, shops, and bed and breakfasts. The city is also home to a number of manufacturing companies, including a furniture factory and a woodworking shop.
Demographics
As of the 2010 census, the city of Nauvoo had a population of 1,149. The racial makeup of the city was 97.2% White, 0.3% African American, 0.2% Native American, 0.2% Asian, 0.1% Pacific Islander, 0.7% from other races, and 1.3% from two or more races. Hispanic or Latino of any race were 1.7% of the population.
The median income for a household in the city was $37,500, and the median income for a family was $45,000. The per capita income for the city was $18,945. About 11.2% of families and 14.2% of the population were below the poverty line, including 18.2% of those under age 18 and 8.3% of those age 65 or over.
Common Questions
What is Per Capita Income in Nauvoo?
Per Capita income in Nauvoo is $24,065.
What is the Median Family Income in Nauvoo?
Median Family Income in Nauvoo is $60,000.
What is the Median Household income in Nauvoo?
Median Household Income in Nauvoo is $46,429.
What is Family Income Deficit in Nauvoo?
Family Income Deficit in Nauvoo is $9,343.
Families that are below poverty line in Nauvoo earn $9,343 less on average than the poverty threshold level.
What is Inequality or Gini Index in Nauvoo?
Inequality or Gini Index in Nauvoo is 0.49.
What is the Total Population of Nauvoo?
Total Population of Nauvoo is 861.
What is the Total Male Population of Nauvoo?
Total Male Population of Nauvoo is 433.
What is the Total Female Population of Nauvoo?
Total Female Population of Nauvoo is 428.
What is the Ratio of Males per 100 Females in Nauvoo?
There are 101.17 Males per 100 Females in Nauvoo.
What is the Ratio of Females per 100 Males in Nauvoo?
There are 98.85 Females per 100 Males in Nauvoo.
What is the Median Population Age in Nauvoo?
Median Population Age in Nauvoo is 40.2 Years.
What is the Average Family Size in Nauvoo
Average Family Size in Nauvoo is 3.2 People.
What is the Average Household Size in Nauvoo
Average Household Size in Nauvoo is 2.8 People.
How Large is the Labor Force in Nauvoo?
There are 292 People in the Labor Forcein in Nauvoo.
What is the Percentage of People in the Labor Force in Nauvoo?
42.5% of People are in the Labor Force in Nauvoo.
What is the Unemployment Rate in Nauvoo?
Unemployment Rate in Nauvoo is 2.4%.