Albion, IL Map & Demographics
Albion Map
Albion Overview
$24,866
PER CAPITA INCOME
$65,595
AVG FAMILY INCOME
$55,848
AVG HOUSEHOLD INCOME
38.3%
WAGE / INCOME GAP [ % ]
61.7¢/ $1
WAGE / INCOME GAP [ $ ]
0.38
INEQUALITY / GINI INDEX
2,136
TOTAL POPULATION
1,017
MALE POPULATION
1,119
FEMALE POPULATION
90.88
MALES / 100 FEMALES
110.03
FEMALES / 100 MALES
38.7
MEDIAN AGE
2.9
AVG FAMILY SIZE
2.4
AVG HOUSEHOLD SIZE
1,009
LABOR FORCE [ PEOPLE ]
60.5%
PERCENT IN LABOR FORCE
11.8%
UNEMPLOYMENT RATE
Albion Zip Codes
Albion Area Codes
Income in Albion
Income Overview in Albion
Per Capita Income in Albion is $24,866, while median incomes of families and households are $65,595 and $55,848 respectively.
| Characteristic | Number | Measure |
| Per Capita Income | 2,136 | $24,866 |
| Median Family Income | 590 | $65,595 |
| Mean Family Income | 590 | $69,318 |
| Median Household Income | 873 | $55,848 |
| Mean Household Income | 873 | $61,181 |
| Income Deficit | 590 | $0 |
| Wage / Income Gap (%) | 2,136 | 38.30% |
| Wage / Income Gap ($) | 2,136 | 61.70¢ per $1 |
| Gini / Inequality Index | 2,136 | 0.38 |
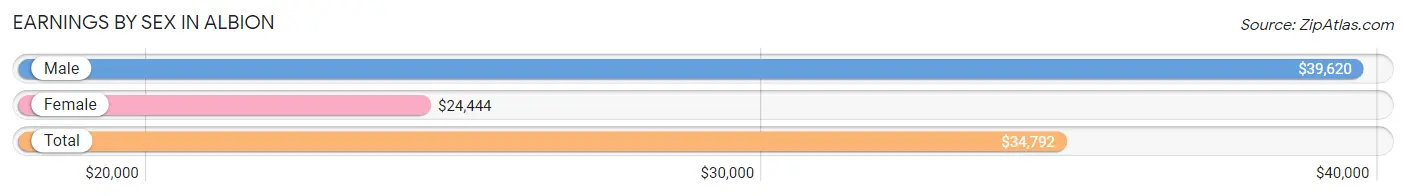
Earnings by Sex in Albion
Average Earnings in Albion are $34,792, $39,620 for men and $24,444 for women, a difference of 38.3%.
| Sex | Number | Average Earnings |
| Male | 571 (55.8%) | $39,620 |
| Female | 452 (44.2%) | $24,444 |
| Total | 1,023 (100.0%) | $34,792 |
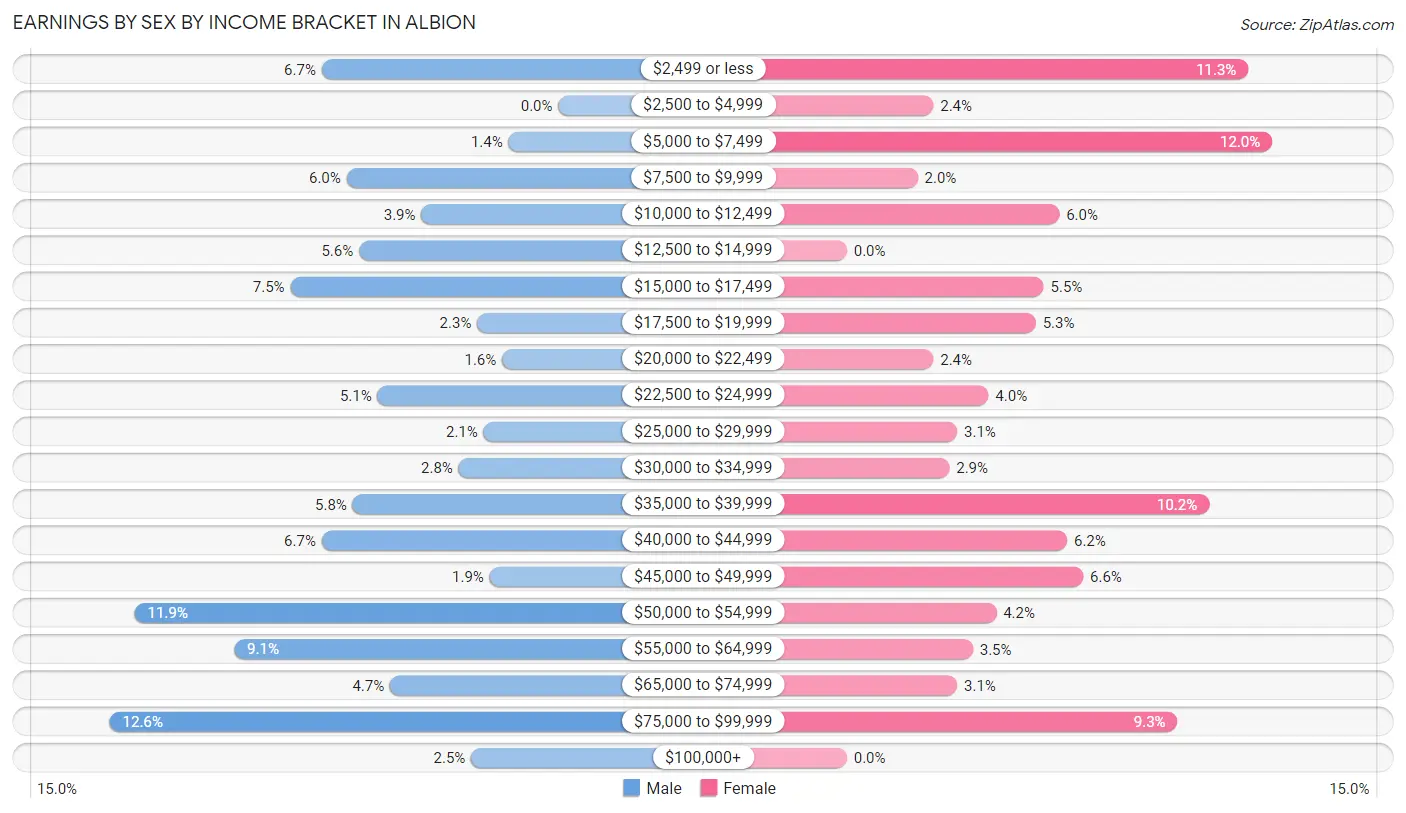
Earnings by Sex by Income Bracket in Albion
The most common earnings brackets in Albion are $75,000 to $99,999 for men (72 | 12.6%) and $5,000 to $7,499 for women (54 | 11.9%).
| Income | Male | Female |
| $2,499 or less | 38 (6.7%) | 51 (11.3%) |
| $2,500 to $4,999 | 0 (0.0%) | 11 (2.4%) |
| $5,000 to $7,499 | 8 (1.4%) | 54 (11.9%) |
| $7,500 to $9,999 | 34 (5.9%) | 9 (2.0%) |
| $10,000 to $12,499 | 22 (3.8%) | 27 (6.0%) |
| $12,500 to $14,999 | 32 (5.6%) | 0 (0.0%) |
| $15,000 to $17,499 | 43 (7.5%) | 25 (5.5%) |
| $17,500 to $19,999 | 13 (2.3%) | 24 (5.3%) |
| $20,000 to $22,499 | 9 (1.6%) | 11 (2.4%) |
| $22,500 to $24,999 | 29 (5.1%) | 18 (4.0%) |
| $25,000 to $29,999 | 12 (2.1%) | 14 (3.1%) |
| $30,000 to $34,999 | 16 (2.8%) | 13 (2.9%) |
| $35,000 to $39,999 | 33 (5.8%) | 46 (10.2%) |
| $40,000 to $44,999 | 38 (6.7%) | 28 (6.2%) |
| $45,000 to $49,999 | 11 (1.9%) | 30 (6.6%) |
| $50,000 to $54,999 | 68 (11.9%) | 19 (4.2%) |
| $55,000 to $64,999 | 52 (9.1%) | 16 (3.5%) |
| $65,000 to $74,999 | 27 (4.7%) | 14 (3.1%) |
| $75,000 to $99,999 | 72 (12.6%) | 42 (9.3%) |
| $100,000+ | 14 (2.5%) | 0 (0.0%) |
| Total | 571 (100.0%) | 452 (100.0%) |
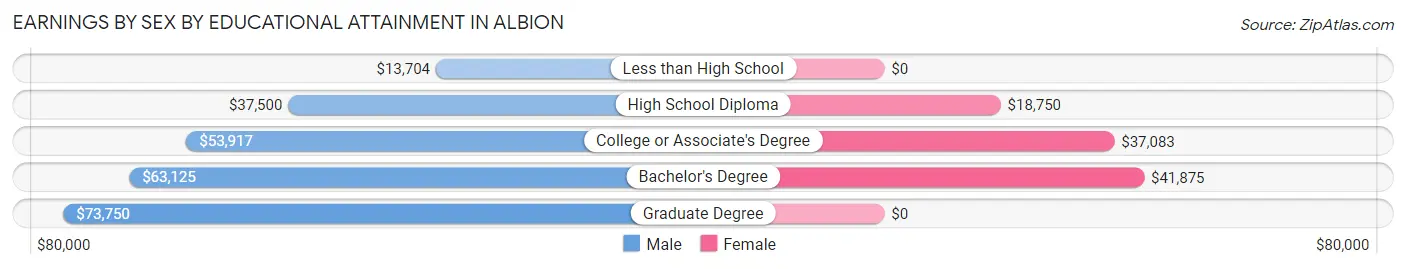
Earnings by Sex by Educational Attainment in Albion
Average earnings in Albion are $41,339 for men and $33,571 for women, a difference of 18.8%. Men with an educational attainment of graduate degree enjoy the highest average annual earnings of $73,750, while those with less than high school education earn the least with $13,704. Women with an educational attainment of bachelor's degree earn the most with the average annual earnings of $41,875, while those with high school diploma education have the smallest earnings of $18,750.
| Educational Attainment | Male Income | Female Income |
| Less than High School | $13,704 | $0 |
| High School Diploma | $37,500 | $18,750 |
| College or Associate's Degree | $53,917 | $37,083 |
| Bachelor's Degree | $63,125 | $41,875 |
| Graduate Degree | $73,750 | $0 |
| Total | $41,339 | $33,571 |
Family Income in Albion
Family Income Brackets in Albion
According to the Albion family income data, there are 145 families falling into the $50,000 to $74,999 income range, which is the most common income bracket and makes up 24.6% of all families. Conversely, the $200,000+ income bracket is the least frequent group with only 5 families (0.9%) belonging to this category.
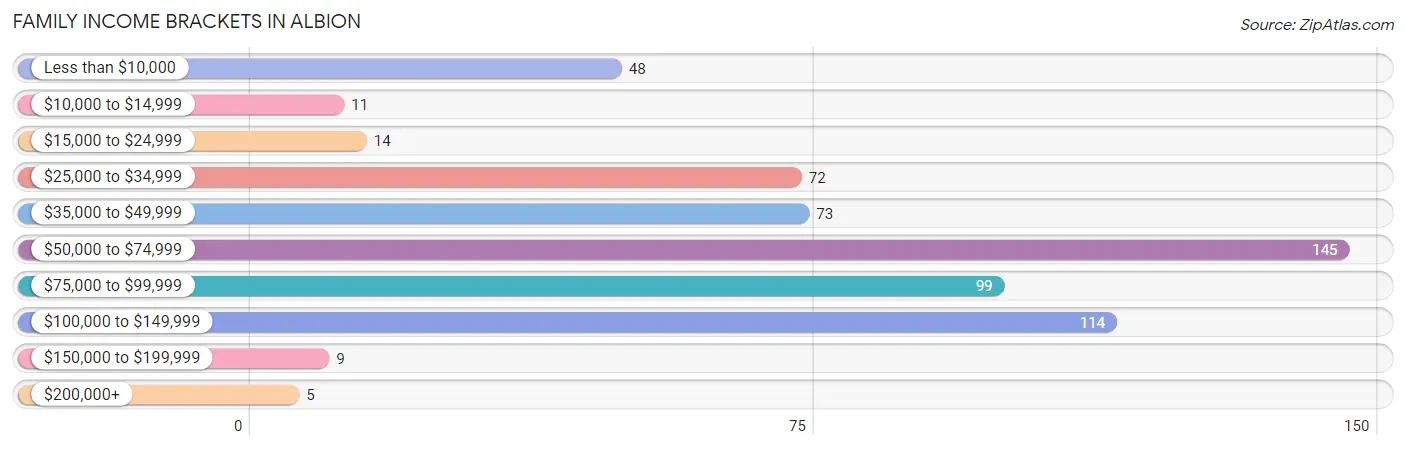
| Income Bracket | # Families | % Families |
| Less than $10,000 | 48 | 8.1% |
| $10,000 to $14,999 | 11 | 1.9% |
| $15,000 to $24,999 | 14 | 2.4% |
| $25,000 to $34,999 | 72 | 12.2% |
| $35,000 to $49,999 | 73 | 12.4% |
| $50,000 to $74,999 | 145 | 24.6% |
| $75,000 to $99,999 | 99 | 16.8% |
| $100,000 to $149,999 | 114 | 19.3% |
| $150,000 to $199,999 | 9 | 1.5% |
| $200,000+ | 5 | 0.8% |
Family Income by Famaliy Size in Albion
4-person families (114 | 19.3%) account for the highest median family income in Albion with $81,250 per family, while 2-person families (313 | 53.0%) have the highest median income of $33,476 per family member.
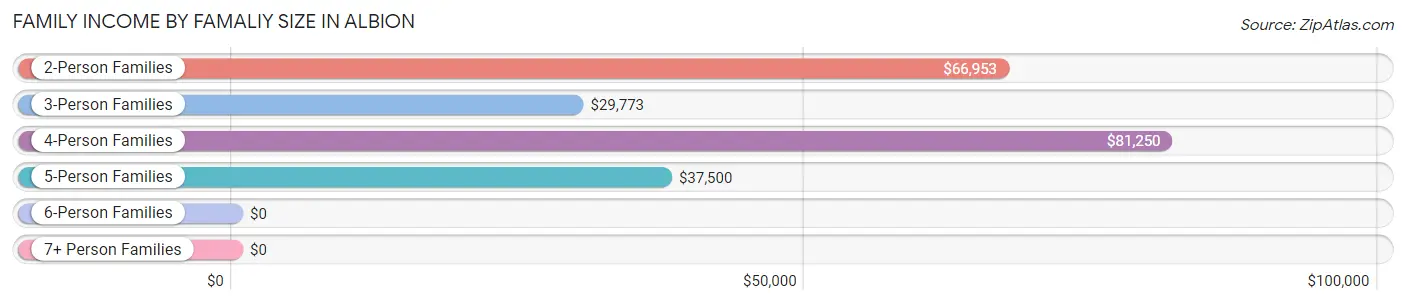
| Income Bracket | # Families | Median Income |
| 2-Person Families | 313 (53.0%) | $66,953 |
| 3-Person Families | 84 (14.2%) | $29,773 |
| 4-Person Families | 114 (19.3%) | $81,250 |
| 5-Person Families | 56 (9.5%) | $37,500 |
| 6-Person Families | 16 (2.7%) | $0 |
| 7+ Person Families | 7 (1.2%) | $0 |
| Total | 590 (100.0%) | $65,595 |
Family Income by Number of Earners in Albion
The median family income in Albion is $65,595, with families comprising 3+ earners (48) having the highest median family income of $110,588, while families with 1 earner (281) have the lowest median family income of $43,250, accounting for 8.1% and 47.6% of families, respectively.
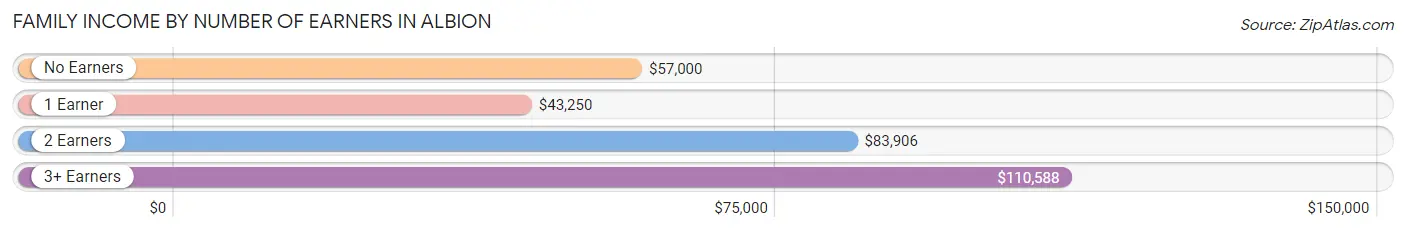
| Number of Earners | # Families | Median Income |
| No Earners | 80 (13.6%) | $57,000 |
| 1 Earner | 281 (47.6%) | $43,250 |
| 2 Earners | 181 (30.7%) | $83,906 |
| 3+ Earners | 48 (8.1%) | $110,588 |
| Total | 590 (100.0%) | $65,595 |
Household Income in Albion
Household Income Brackets in Albion
With 185 households falling in the category, the $50,000 to $74,999 income range is the most frequent in Albion, accounting for 21.2% of all households. In contrast, only 5 households (0.6%) fall into the $200,000+ income bracket, making it the least populous group.
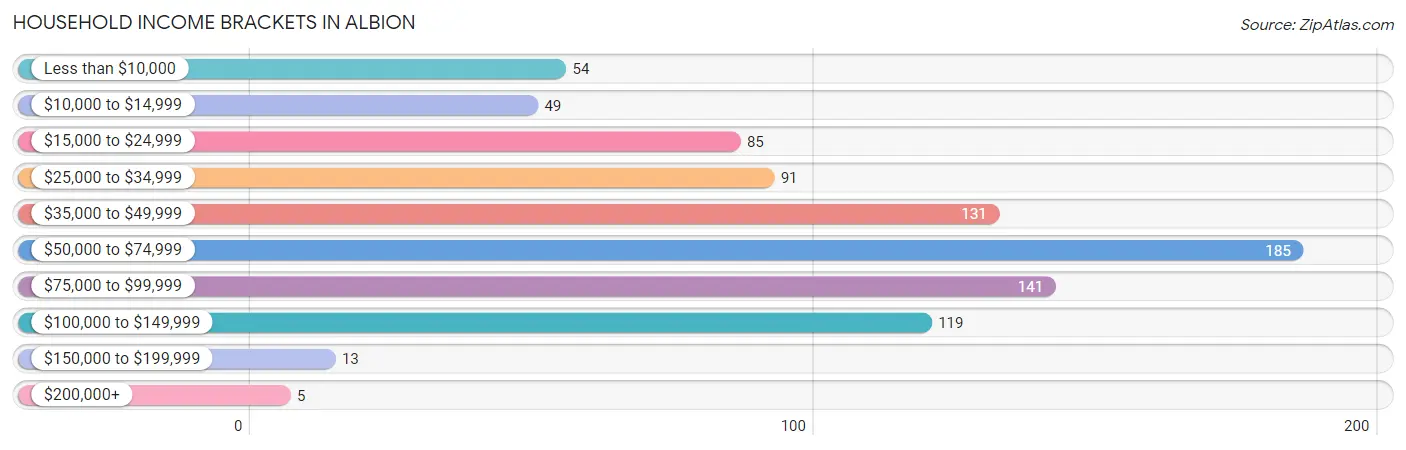
| Income Bracket | # Households | % Households |
| Less than $10,000 | 54 | 6.2% |
| $10,000 to $14,999 | 49 | 5.6% |
| $15,000 to $24,999 | 85 | 9.7% |
| $25,000 to $34,999 | 91 | 10.4% |
| $35,000 to $49,999 | 131 | 15.0% |
| $50,000 to $74,999 | 185 | 21.2% |
| $75,000 to $99,999 | 141 | 16.2% |
| $100,000 to $149,999 | 119 | 13.6% |
| $150,000 to $199,999 | 13 | 1.5% |
| $200,000+ | 5 | 0.6% |
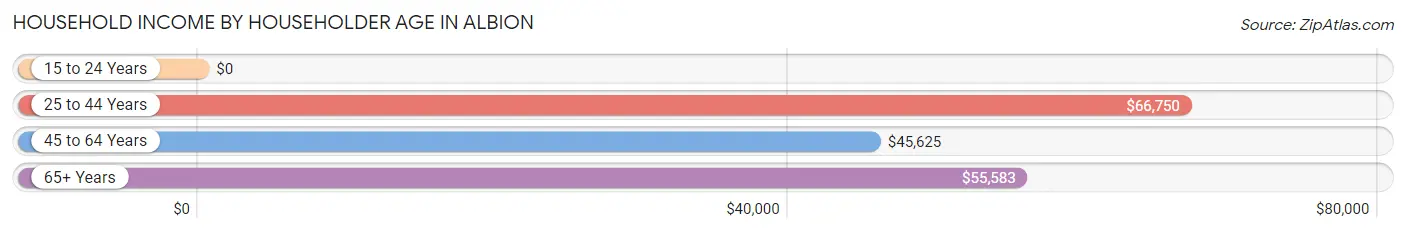
Household Income by Householder Age in Albion
The median household income in Albion is $55,848, with the highest median household income of $66,750 found in the 25 to 44 years age bracket for the primary householder. A total of 334 households (38.3%) fall into this category. Meanwhile, the 15 to 24 years age bracket for the primary householder has the lowest median household income of $0, with 19 households (2.2%) in this group.
| Income Bracket | # Households | Median Income |
| 15 to 24 Years | 19 (2.2%) | $0 |
| 25 to 44 Years | 334 (38.3%) | $66,750 |
| 45 to 64 Years | 321 (36.8%) | $45,625 |
| 65+ Years | 199 (22.8%) | $55,583 |
| Total | 873 (100.0%) | $55,848 |
Poverty in Albion
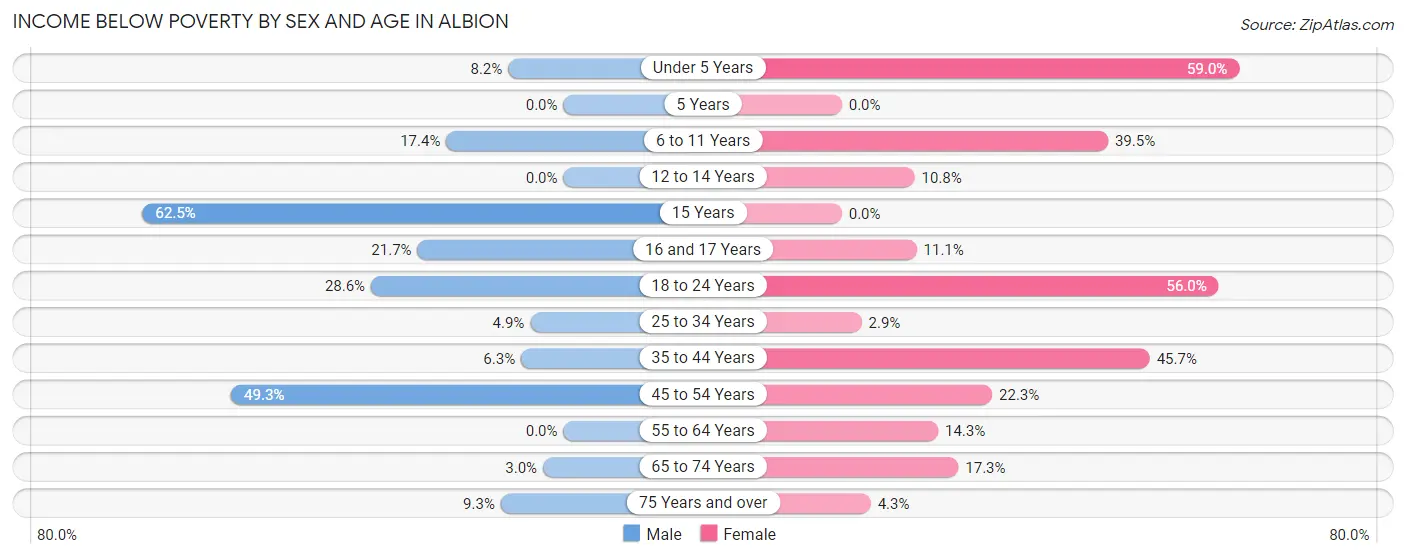
Income Below Poverty by Sex and Age in Albion
With 16.2% poverty level for males and 26.7% for females among the residents of Albion, 15 year old males and under 5 year old females are the most vulnerable to poverty, with 15 males (62.5%) and 59 females (59.0%) in their respective age groups living below the poverty level.
| Age Bracket | Male | Female |
| Under 5 Years | 5 (8.2%) | 59 (59.0%) |
| 5 Years | 0 (0.0%) | 0 (0.0%) |
| 6 to 11 Years | 12 (17.4%) | 34 (39.5%) |
| 12 to 14 Years | 0 (0.0%) | 4 (10.8%) |
| 15 Years | 15 (62.5%) | 0 (0.0%) |
| 16 and 17 Years | 13 (21.7%) | 7 (11.1%) |
| 18 to 24 Years | 24 (28.6%) | 47 (55.9%) |
| 25 to 34 Years | 6 (4.9%) | 3 (2.9%) |
| 35 to 44 Years | 9 (6.3%) | 75 (45.7%) |
| 45 to 54 Years | 72 (49.3%) | 25 (22.3%) |
| 55 to 64 Years | 0 (0.0%) | 18 (14.3%) |
| 65 to 74 Years | 3 (3.0%) | 18 (17.3%) |
| 75 Years and over | 4 (9.3%) | 3 (4.3%) |
| Total | 163 (16.2%) | 293 (26.7%) |
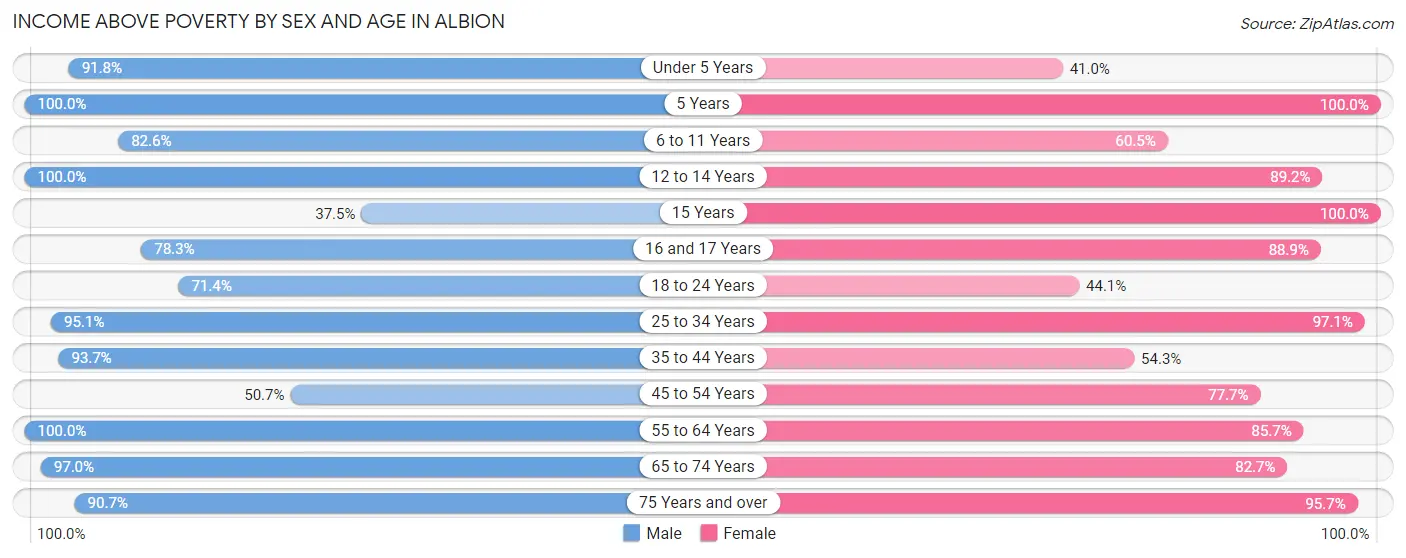
Income Above Poverty by Sex and Age in Albion
According to the poverty statistics in Albion, males aged 5 years and females aged 5 years are the age groups that are most secure financially, with 100.0% of males and 100.0% of females in these age groups living above the poverty line.
| Age Bracket | Male | Female |
| Under 5 Years | 56 (91.8%) | 41 (41.0%) |
| 5 Years | 11 (100.0%) | 44 (100.0%) |
| 6 to 11 Years | 57 (82.6%) | 52 (60.5%) |
| 12 to 14 Years | 23 (100.0%) | 33 (89.2%) |
| 15 Years | 9 (37.5%) | 5 (100.0%) |
| 16 and 17 Years | 47 (78.3%) | 56 (88.9%) |
| 18 to 24 Years | 60 (71.4%) | 37 (44.1%) |
| 25 to 34 Years | 116 (95.1%) | 99 (97.1%) |
| 35 to 44 Years | 134 (93.7%) | 89 (54.3%) |
| 45 to 54 Years | 74 (50.7%) | 87 (77.7%) |
| 55 to 64 Years | 124 (100.0%) | 108 (85.7%) |
| 65 to 74 Years | 96 (97.0%) | 86 (82.7%) |
| 75 Years and over | 39 (90.7%) | 67 (95.7%) |
| Total | 846 (83.9%) | 804 (73.3%) |
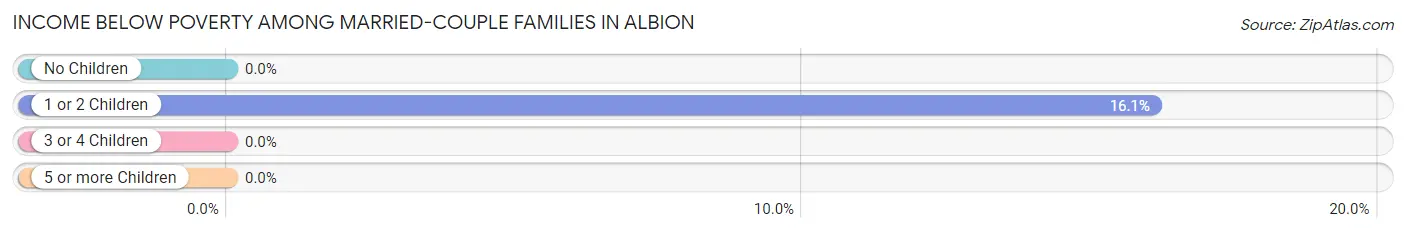
Income Below Poverty Among Married-Couple Families in Albion
The poverty statistics for married-couple families in Albion show that 5.8% or 23 of the total 398 families live below the poverty line. Families with 1 or 2 children have the highest poverty rate of 16.1%, comprising of 23 families. On the other hand, families with no children have the lowest poverty rate of 0.0%, which includes 0 families.
| Children | Above Poverty | Below Poverty |
| No Children | 218 (100.0%) | 0 (0.0%) |
| 1 or 2 Children | 120 (83.9%) | 23 (16.1%) |
| 3 or 4 Children | 30 (100.0%) | 0 (0.0%) |
| 5 or more Children | 7 (100.0%) | 0 (0.0%) |
| Total | 375 (94.2%) | 23 (5.8%) |
Income Below Poverty Among Single-Parent Households in Albion
According to the poverty data in Albion, 37.2% or 16 single-father households and 42.3% or 63 single-mother households are living below the poverty line. Among single-father households, those with no children have the highest poverty rate, with 10 households (100.0%) experiencing poverty. Likewise, among single-mother households, those with 1 or 2 children have the highest poverty rate, with 52 households (47.3%) falling below the poverty line.
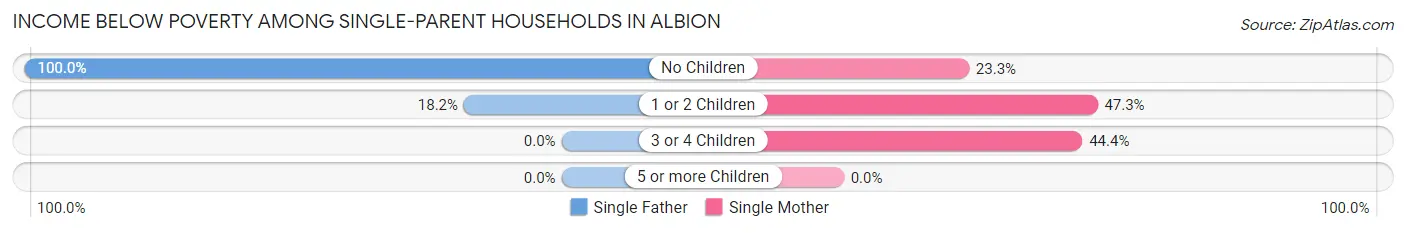
| Children | Single Father | Single Mother |
| No Children | 10 (100.0%) | 7 (23.3%) |
| 1 or 2 Children | 6 (18.2%) | 52 (47.3%) |
| 3 or 4 Children | 0 (0.0%) | 4 (44.4%) |
| 5 or more Children | 0 (0.0%) | 0 (0.0%) |
| Total | 16 (37.2%) | 63 (42.3%) |
Income Below Poverty Among Married-Couple vs Single-Parent Households in Albion
The poverty data for Albion shows that 23 of the married-couple family households (5.8%) and 79 of the single-parent households (41.1%) are living below the poverty level. Within the married-couple family households, those with 1 or 2 children have the highest poverty rate, with 23 households (16.1%) falling below the poverty line. Among the single-parent households, those with 3 or 4 children have the highest poverty rate, with 4 household (44.4%) living below poverty.
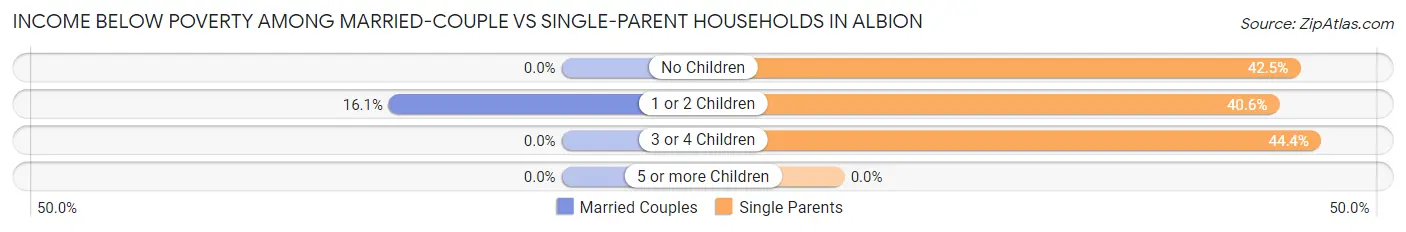
| Children | Married-Couple Families | Single-Parent Households |
| No Children | 0 (0.0%) | 17 (42.5%) |
| 1 or 2 Children | 23 (16.1%) | 58 (40.6%) |
| 3 or 4 Children | 0 (0.0%) | 4 (44.4%) |
| 5 or more Children | 0 (0.0%) | 0 (0.0%) |
| Total | 23 (5.8%) | 79 (41.1%) |
Race in Albion
The most populous races in Albion are White / Caucasian (2,050 | 96.0%), Hispanic or Latino (72 | 3.4%), and Native / Alaskan (36 | 1.7%).
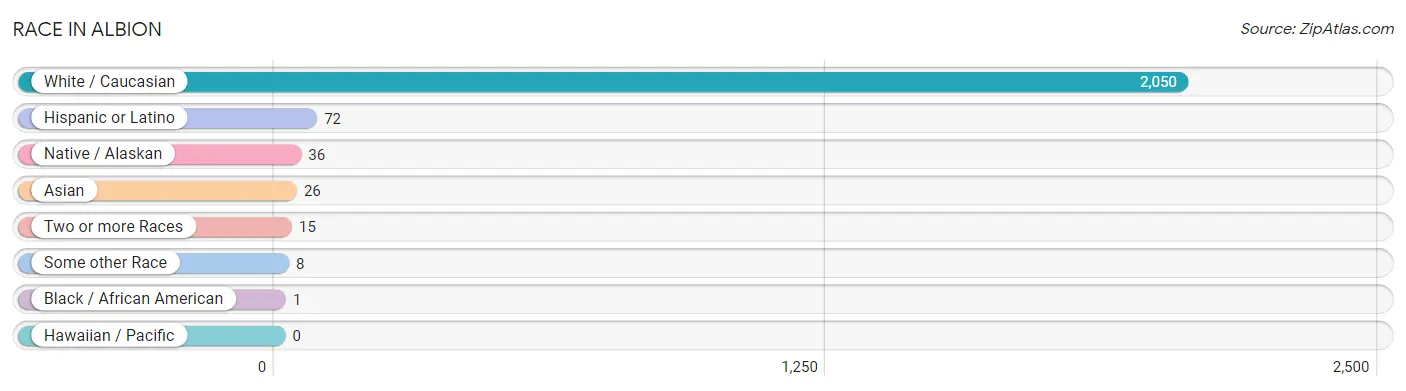
| Race | # Population | % Population |
| Asian | 26 | 1.2% |
| Black / African American | 1 | 0.1% |
| Hawaiian / Pacific | 0 | 0.0% |
| Hispanic or Latino | 72 | 3.4% |
| Native / Alaskan | 36 | 1.7% |
| White / Caucasian | 2,050 | 96.0% |
| Two or more Races | 15 | 0.7% |
| Some other Race | 8 | 0.4% |
| Total | 2,136 | 100.0% |
Ancestry in Albion
The most populous ancestries reported in Albion are English (334 | 15.6%), American (282 | 13.2%), German (204 | 9.6%), Irish (121 | 5.7%), and Scottish (62 | 2.9%), together accounting for 47.0% of all Albion residents.
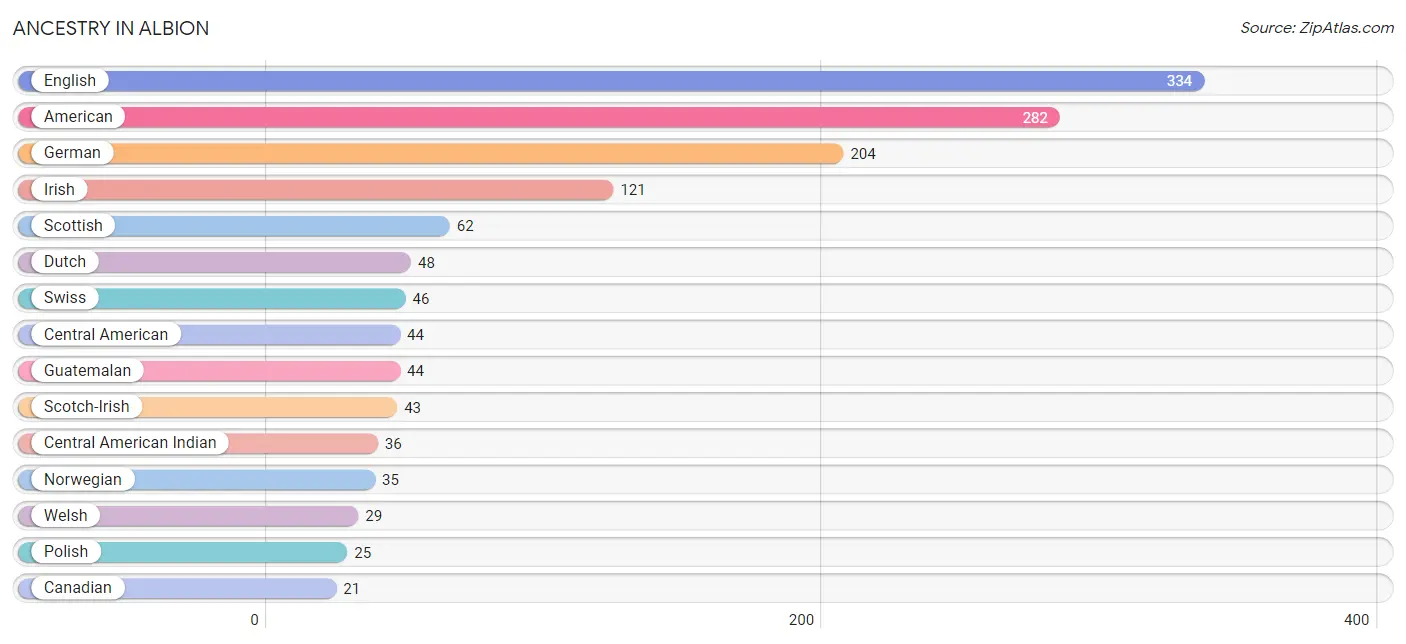
| Ancestry | # Population | % Population |
| American | 282 | 13.2% |
| Belgian | 7 | 0.3% |
| British | 10 | 0.5% |
| Burmese | 10 | 0.5% |
| Canadian | 21 | 1.0% |
| Central American | 44 | 2.1% |
| Central American Indian | 36 | 1.7% |
| Cherokee | 9 | 0.4% |
| Dominican | 11 | 0.5% |
| Dutch | 48 | 2.2% |
| English | 334 | 15.6% |
| French | 5 | 0.2% |
| French Canadian | 4 | 0.2% |
| German | 204 | 9.6% |
| Guatemalan | 44 | 2.1% |
| Indian (Asian) | 3 | 0.1% |
| Irish | 121 | 5.7% |
| Italian | 11 | 0.5% |
| Korean | 3 | 0.1% |
| Norwegian | 35 | 1.6% |
| Polish | 25 | 1.2% |
| Puerto Rican | 10 | 0.5% |
| Russian | 6 | 0.3% |
| Scotch-Irish | 43 | 2.0% |
| Scottish | 62 | 2.9% |
| Sri Lankan | 16 | 0.7% |
| Swedish | 14 | 0.7% |
| Swiss | 46 | 2.1% |
| Welsh | 29 | 1.4% |
| Yugoslavian | 6 | 0.3% | View All 30 Rows |
Immigrants in Albion
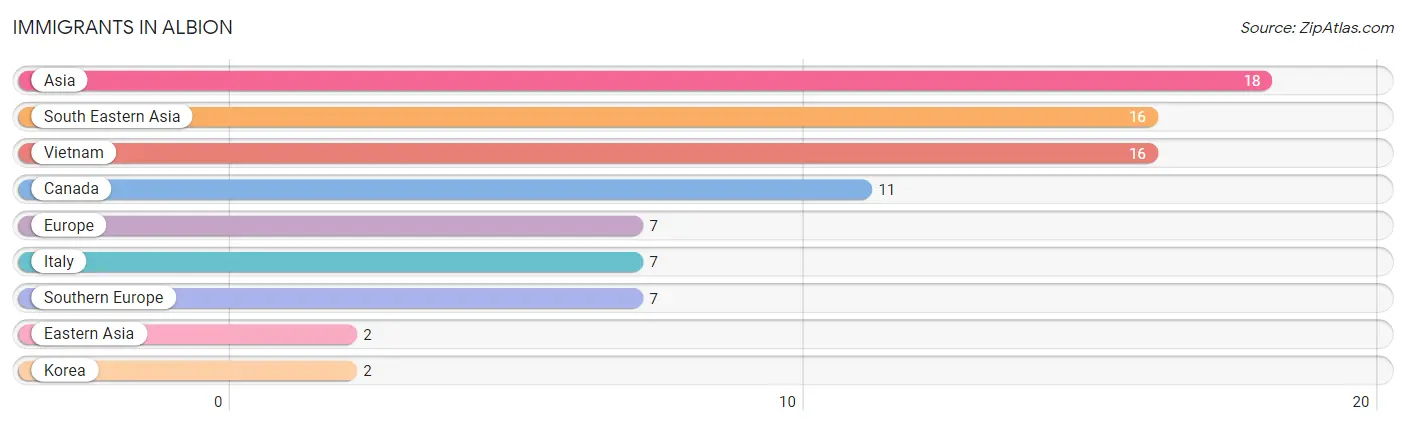
The most numerous immigrant groups reported in Albion came from Asia (18 | 0.8%), South Eastern Asia (16 | 0.7%), Vietnam (16 | 0.7%), Canada (11 | 0.5%), and Europe (7 | 0.3%), together accounting for 3.2% of all Albion residents.
| Immigration Origin | # Population | % Population |
| Asia | 18 | 0.8% |
| Canada | 11 | 0.5% |
| Eastern Asia | 2 | 0.1% |
| Europe | 7 | 0.3% |
| Italy | 7 | 0.3% |
| Korea | 2 | 0.1% |
| South Eastern Asia | 16 | 0.7% |
| Southern Europe | 7 | 0.3% |
| Vietnam | 16 | 0.7% | View All 9 Rows |
Sex and Age in Albion
Sex and Age in Albion
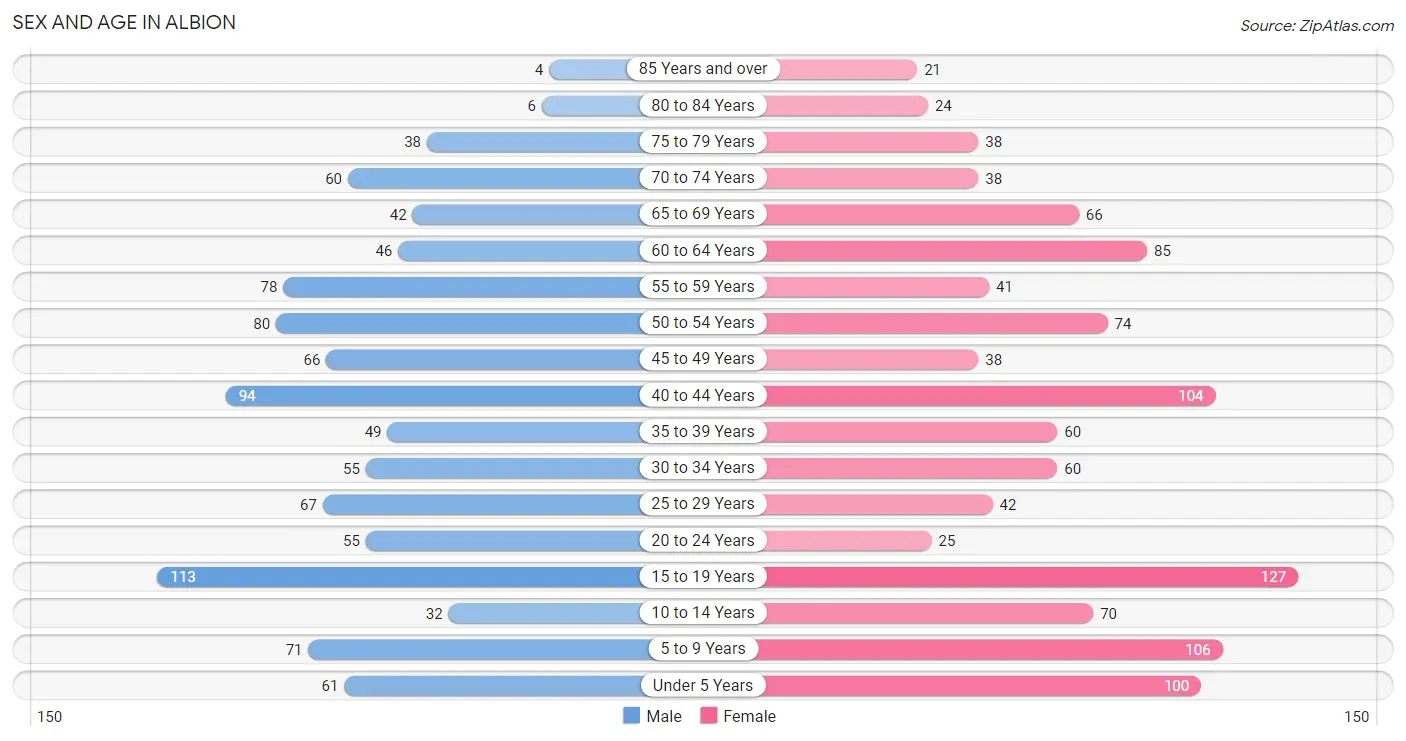
The most populous age groups in Albion are 15 to 19 Years (113 | 11.1%) for men and 15 to 19 Years (127 | 11.4%) for women.
| Age Bracket | Male | Female |
| Under 5 Years | 61 (6.0%) | 100 (8.9%) |
| 5 to 9 Years | 71 (7.0%) | 106 (9.5%) |
| 10 to 14 Years | 32 (3.2%) | 70 (6.3%) |
| 15 to 19 Years | 113 (11.1%) | 127 (11.4%) |
| 20 to 24 Years | 55 (5.4%) | 25 (2.2%) |
| 25 to 29 Years | 67 (6.6%) | 42 (3.7%) |
| 30 to 34 Years | 55 (5.4%) | 60 (5.4%) |
| 35 to 39 Years | 49 (4.8%) | 60 (5.4%) |
| 40 to 44 Years | 94 (9.2%) | 104 (9.3%) |
| 45 to 49 Years | 66 (6.5%) | 38 (3.4%) |
| 50 to 54 Years | 80 (7.9%) | 74 (6.6%) |
| 55 to 59 Years | 78 (7.7%) | 41 (3.7%) |
| 60 to 64 Years | 46 (4.5%) | 85 (7.6%) |
| 65 to 69 Years | 42 (4.1%) | 66 (5.9%) |
| 70 to 74 Years | 60 (5.9%) | 38 (3.4%) |
| 75 to 79 Years | 38 (3.7%) | 38 (3.4%) |
| 80 to 84 Years | 6 (0.6%) | 24 (2.1%) |
| 85 Years and over | 4 (0.4%) | 21 (1.9%) |
| Total | 1,017 (100.0%) | 1,119 (100.0%) |
Families and Households in Albion
Median Family Size in Albion
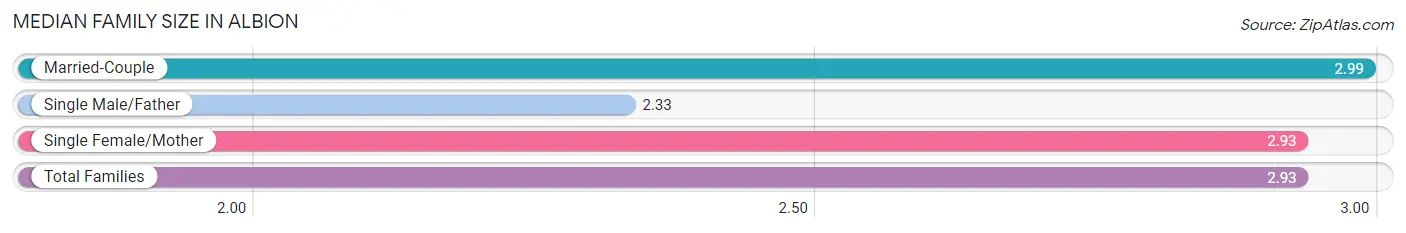
The median family size in Albion is 2.93 persons per family, with married-couple families (398 | 67.5%) accounting for the largest median family size of 2.99 persons per family. On the other hand, single male/father families (43 | 7.3%) represent the smallest median family size with 2.33 persons per family.
| Family Type | # Families | Family Size |
| Married-Couple | 398 (67.5%) | 2.99 |
| Single Male/Father | 43 (7.3%) | 2.33 |
| Single Female/Mother | 149 (25.3%) | 2.93 |
| Total Families | 590 (100.0%) | 2.93 |
Median Household Size in Albion
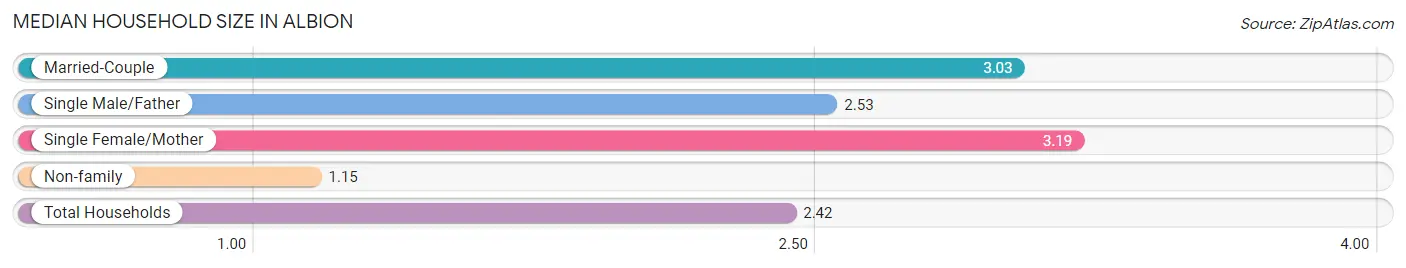
The median household size in Albion is 2.42 persons per household, with single female/mother households (149 | 17.1%) accounting for the largest median household size of 3.19 persons per household. non-family households (283 | 32.4%) represent the smallest median household size with 1.15 persons per household.
| Household Type | # Households | Household Size |
| Married-Couple | 398 (45.6%) | 3.03 |
| Single Male/Father | 43 (4.9%) | 2.53 |
| Single Female/Mother | 149 (17.1%) | 3.19 |
| Non-family | 283 (32.4%) | 1.15 |
| Total Households | 873 (100.0%) | 2.42 |
Household Size by Marriage Status in Albion
Out of a total of 873 households in Albion, 590 (67.6%) are family households, while 283 (32.4%) are nonfamily households. The most numerous type of family households are 2-person households, comprising 292, and the most common type of nonfamily households are 1-person households, comprising 244.
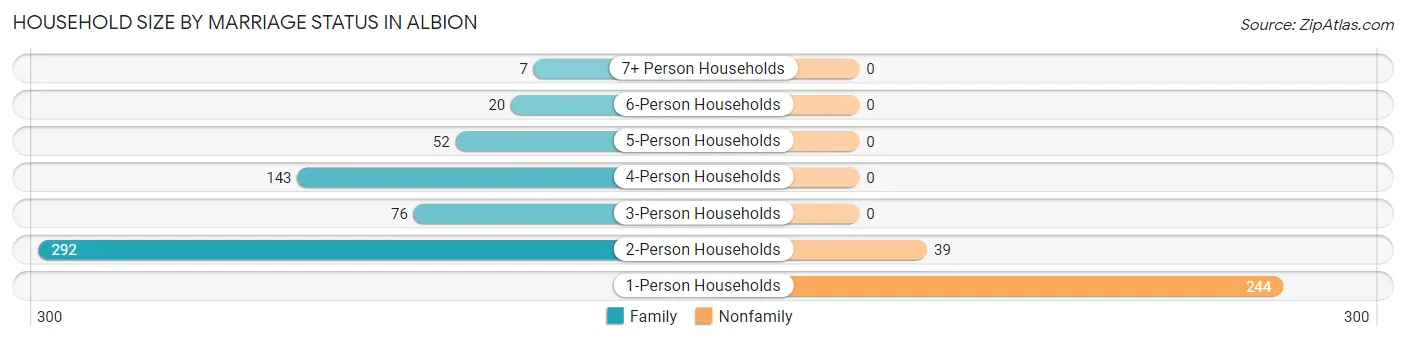
| Household Size | Family Households | Nonfamily Households |
| 1-Person Households | - | 244 (28.0%) |
| 2-Person Households | 292 (33.5%) | 39 (4.5%) |
| 3-Person Households | 76 (8.7%) | 0 (0.0%) |
| 4-Person Households | 143 (16.4%) | 0 (0.0%) |
| 5-Person Households | 52 (6.0%) | 0 (0.0%) |
| 6-Person Households | 20 (2.3%) | 0 (0.0%) |
| 7+ Person Households | 7 (0.8%) | 0 (0.0%) |
| Total | 590 (67.6%) | 283 (32.4%) |
Female Fertility in Albion
Fertility by Age in Albion
Average fertility rate in Albion is 104.0 births per 1,000 women. Women in the age bracket of 15 to 19 years have the highest fertility rate with 394.0 births per 1,000 women. Women in the age bracket of 15 to 19 years acount for 100.0% of all women with births.
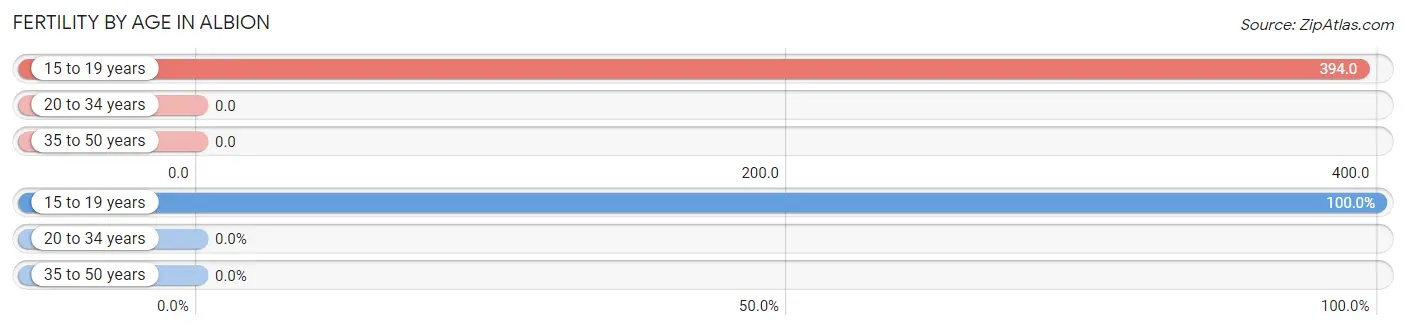
| Age Bracket | Women with Births | Births / 1,000 Women |
| 15 to 19 years | 50 (100.0%) | 394.0 |
| 20 to 34 years | 0 (0.0%) | 0.0 |
| 35 to 50 years | 0 (0.0%) | 0.0 |
| Total | 50 (100.0%) | 104.0 |
Fertility by Age by Marriage Status in Albion
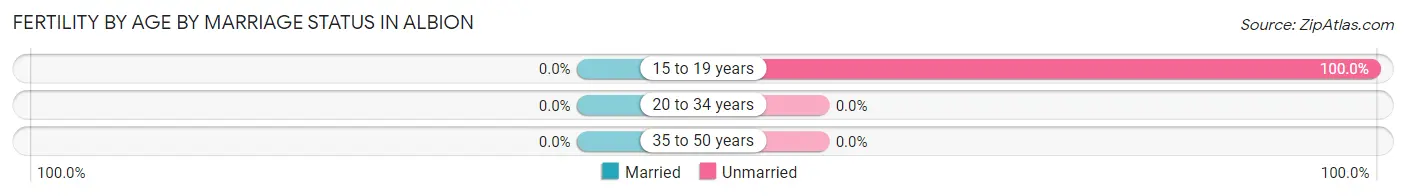
| Age Bracket | Married | Unmarried |
| 15 to 19 years | 0 (0.0%) | 50 (100.0%) |
| 20 to 34 years | 0 (0.0%) | 0 (0.0%) |
| 35 to 50 years | 0 (0.0%) | 0 (0.0%) |
| Total | 0 (0.0%) | 50 (100.0%) |
Fertility by Education in Albion
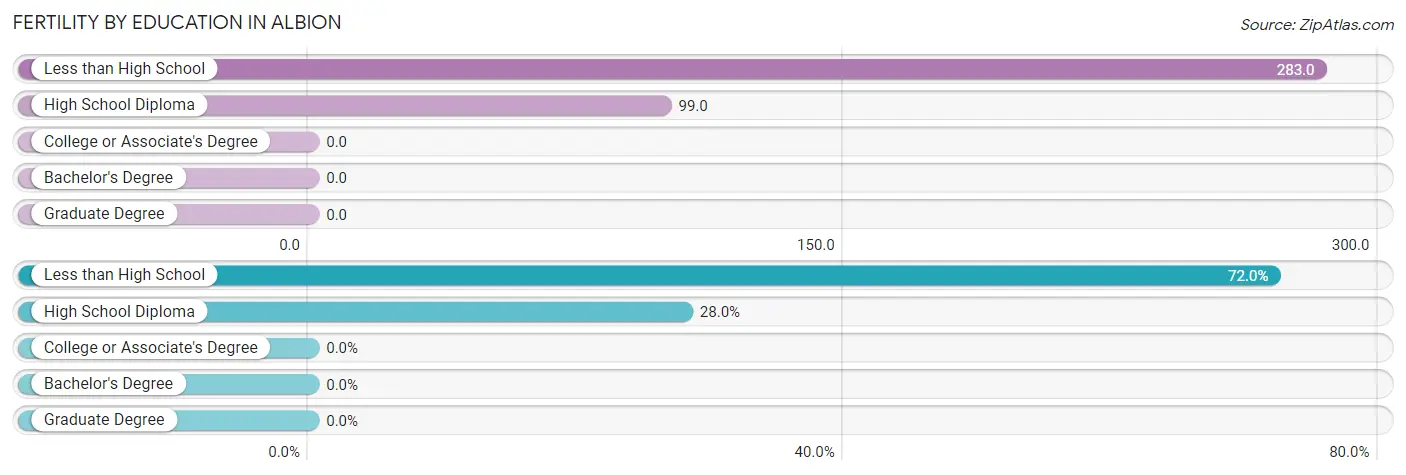
| Educational Attainment | Women with Births | Births / 1,000 Women |
| Less than High School | 36 (72.0%) | 283.0 |
| High School Diploma | 14 (28.0%) | 99.0 |
| College or Associate's Degree | 0 (0.0%) | 0.0 |
| Bachelor's Degree | 0 (0.0%) | 0.0 |
| Graduate Degree | 0 (0.0%) | 0.0 |
| Total | 50 (100.0%) | 104.0 |
Fertility by Education by Marriage Status in Albion
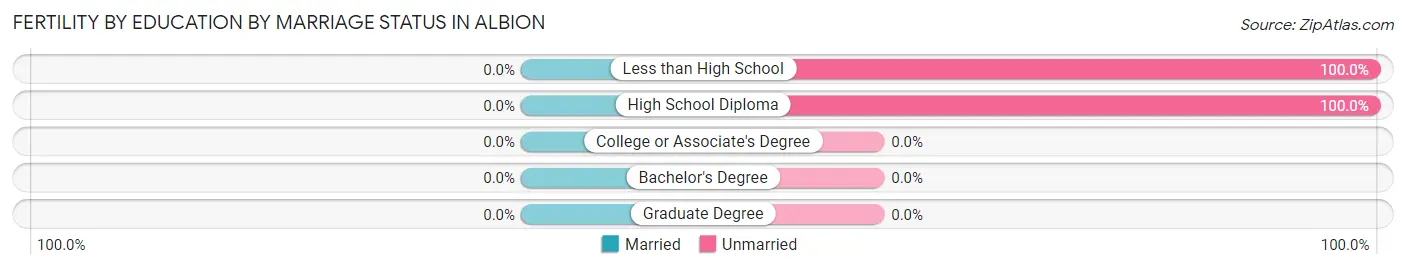
| Educational Attainment | Married | Unmarried |
| Less than High School | 0 (0.0%) | 36 (100.0%) |
| High School Diploma | 0 (0.0%) | 14 (100.0%) |
| College or Associate's Degree | 0 (0.0%) | 0 (0.0%) |
| Bachelor's Degree | 0 (0.0%) | 0 (0.0%) |
| Graduate Degree | 0 (0.0%) | 0 (0.0%) |
| Total | 0 (0.0%) | 50 (100.0%) |
Employment Characteristics in Albion
Employment by Class of Employer in Albion
Among the 882 employed individuals in Albion, private company employees (690 | 78.2%), state government employees (54 | 6.1%), and not-for-profit organizations (46 | 5.2%) make up the most common classes of employment.
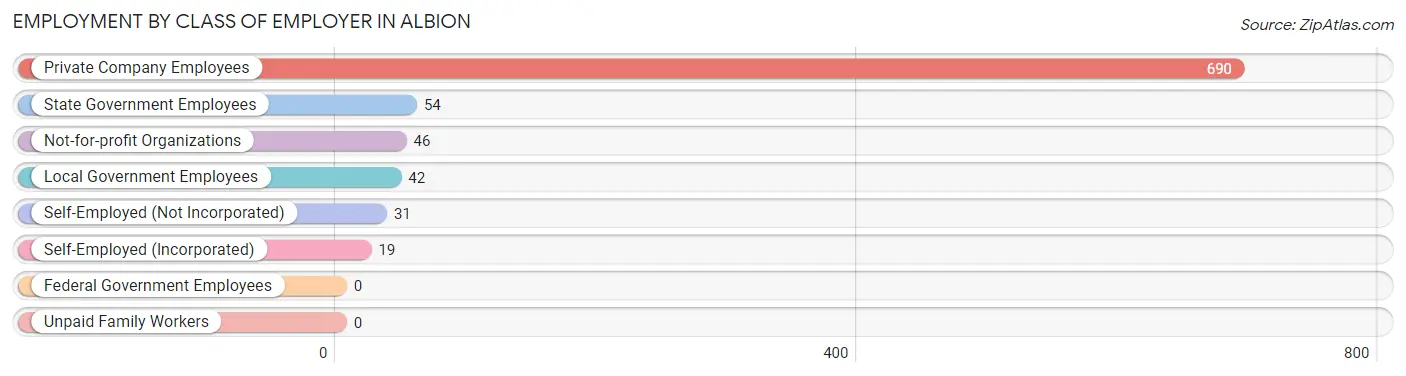
| Employer Class | # Employees | % Employees |
| Private Company Employees | 690 | 78.2% |
| Self-Employed (Incorporated) | 19 | 2.1% |
| Self-Employed (Not Incorporated) | 31 | 3.5% |
| Not-for-profit Organizations | 46 | 5.2% |
| Local Government Employees | 42 | 4.8% |
| State Government Employees | 54 | 6.1% |
| Federal Government Employees | 0 | 0.0% |
| Unpaid Family Workers | 0 | 0.0% |
| Total | 882 | 100.0% |
Employment Status by Age in Albion
According to the labor force statistics for Albion, out of the total population over 16 years of age (1,667), 60.5% or 1,009 individuals are in the labor force, with 11.8% or 119 of them unemployed. The age group with the highest labor force participation rate is 30 to 34 years, with 93.9% or 108 individuals in the labor force. Within the labor force, the 16 to 19 years age range has the highest percentage of unemployed individuals, with 66.3% or 61 of them being unemployed.
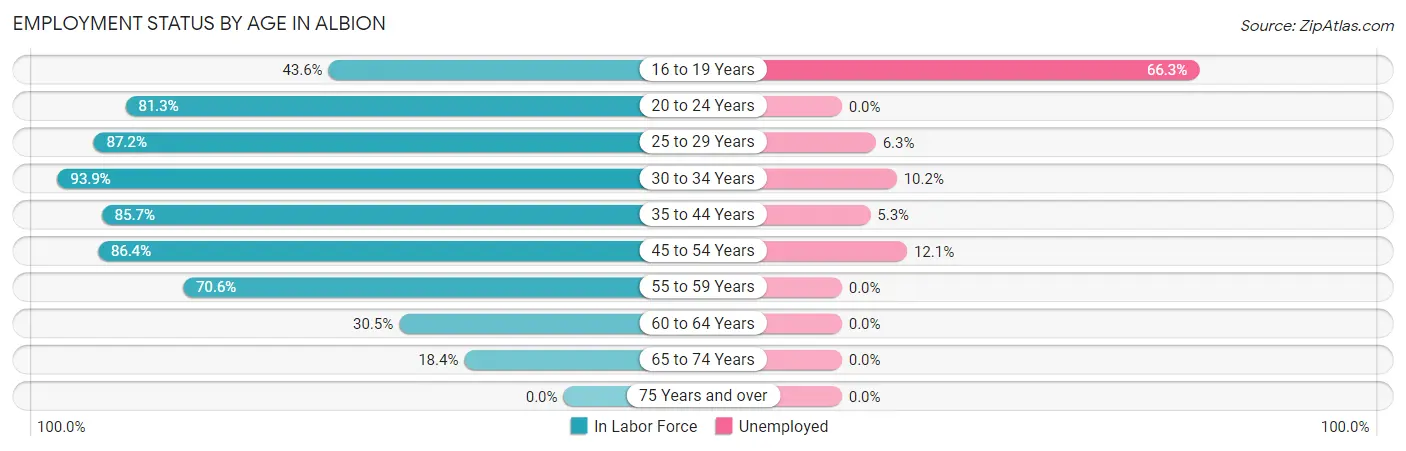
| Age Bracket | In Labor Force | Unemployed |
| 16 to 19 Years | 92 (43.6%) | 61 (66.3%) |
| 20 to 24 Years | 65 (81.3%) | 0 (0.0%) |
| 25 to 29 Years | 95 (87.2%) | 6 (6.3%) |
| 30 to 34 Years | 108 (93.9%) | 11 (10.2%) |
| 35 to 44 Years | 263 (85.7%) | 14 (5.3%) |
| 45 to 54 Years | 223 (86.4%) | 27 (12.1%) |
| 55 to 59 Years | 84 (70.6%) | 0 (0.0%) |
| 60 to 64 Years | 40 (30.5%) | 0 (0.0%) |
| 65 to 74 Years | 38 (18.4%) | 0 (0.0%) |
| 75 Years and over | 0 (0.0%) | 0 (0.0%) |
| Total | 1,009 (60.5%) | 119 (11.8%) |
Employment Status by Educational Attainment in Albion
According to labor force statistics for Albion, 78.2% of individuals (812) out of the total population between 25 and 64 years of age (1,039) are in the labor force, with 7.1% or 58 of them being unemployed. The group with the highest labor force participation rate are those with the educational attainment of less than high school, with 94.9% or 75 individuals in the labor force. Within the labor force, individuals with less than high school education have the highest percentage of unemployment, with 54.7% or 41 of them being unemployed.
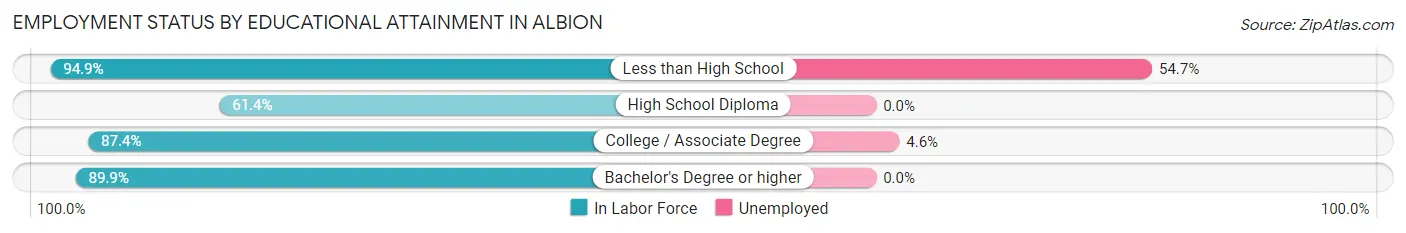
| Educational Attainment | In Labor Force | Unemployed |
| Less than High School | 75 (94.9%) | 43 (54.7%) |
| High School Diploma | 247 (61.4%) | 0 (0.0%) |
| College / Associate Degree | 366 (87.4%) | 19 (4.6%) |
| Bachelor's Degree or higher | 125 (89.9%) | 0 (0.0%) |
| Total | 812 (78.2%) | 74 (7.1%) |
Employment Occupations by Sex in Albion
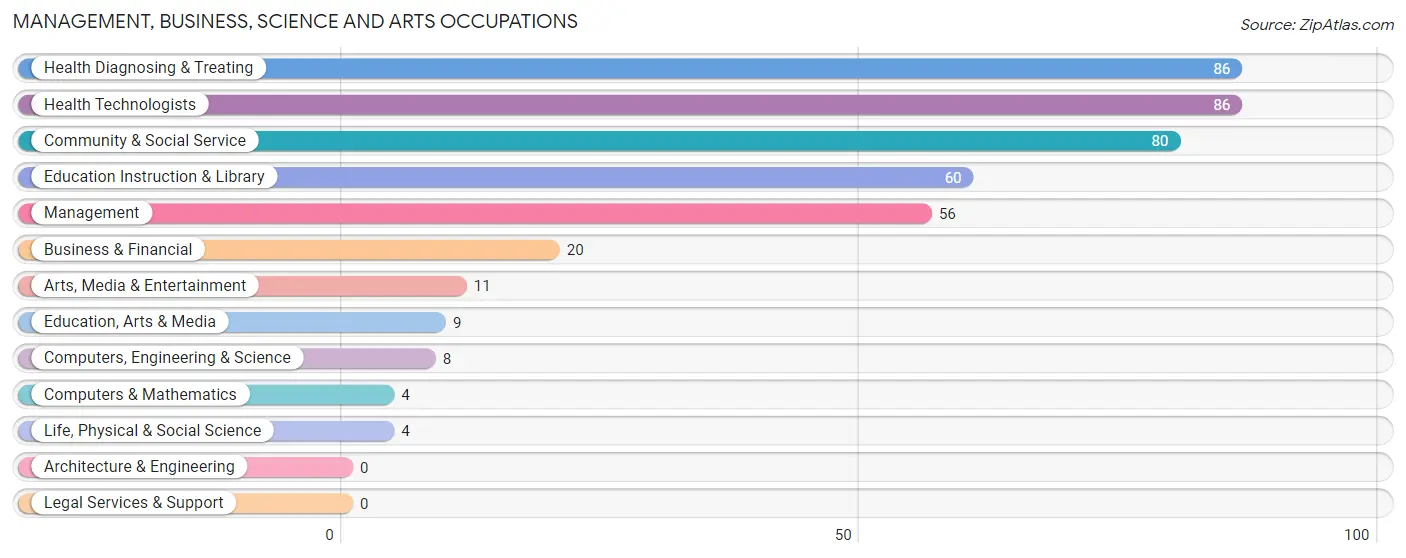
Management, Business, Science and Arts Occupations
The most common Management, Business, Science and Arts occupations in Albion are Health Diagnosing & Treating (86 | 9.7%), Health Technologists (86 | 9.7%), Community & Social Service (80 | 9.0%), Education Instruction & Library (60 | 6.8%), and Management (56 | 6.3%).
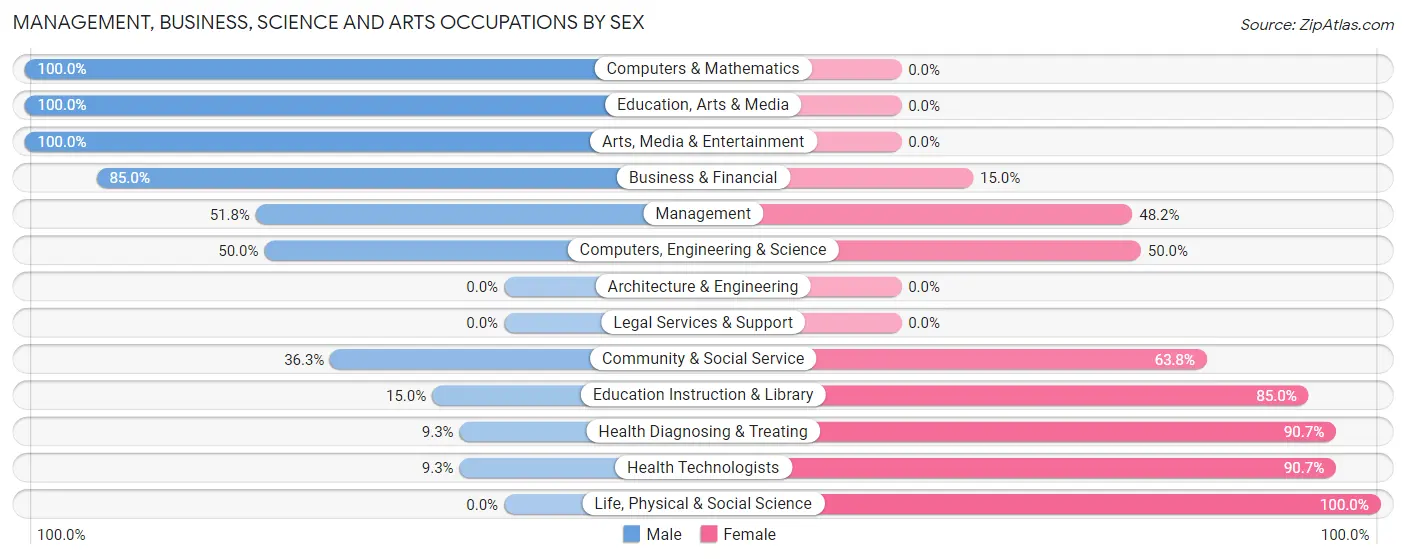
Management, Business, Science and Arts Occupations by Sex
Within the Management, Business, Science and Arts occupations in Albion, the most male-oriented occupations are Computers & Mathematics (100.0%), Education, Arts & Media (100.0%), and Arts, Media & Entertainment (100.0%), while the most female-oriented occupations are Life, Physical & Social Science (100.0%), Health Diagnosing & Treating (90.7%), and Health Technologists (90.7%).
| Occupation | Male | Female |
| Management | 29 (51.8%) | 27 (48.2%) |
| Business & Financial | 17 (85.0%) | 3 (15.0%) |
| Computers, Engineering & Science | 4 (50.0%) | 4 (50.0%) |
| Computers & Mathematics | 4 (100.0%) | 0 (0.0%) |
| Architecture & Engineering | 0 (0.0%) | 0 (0.0%) |
| Life, Physical & Social Science | 0 (0.0%) | 4 (100.0%) |
| Community & Social Service | 29 (36.2%) | 51 (63.7%) |
| Education, Arts & Media | 9 (100.0%) | 0 (0.0%) |
| Legal Services & Support | 0 (0.0%) | 0 (0.0%) |
| Education Instruction & Library | 9 (15.0%) | 51 (85.0%) |
| Arts, Media & Entertainment | 11 (100.0%) | 0 (0.0%) |
| Health Diagnosing & Treating | 8 (9.3%) | 78 (90.7%) |
| Health Technologists | 8 (9.3%) | 78 (90.7%) |
| Total (Category) | 87 (34.8%) | 163 (65.2%) |
| Total (Overall) | 480 (54.0%) | 409 (46.0%) |
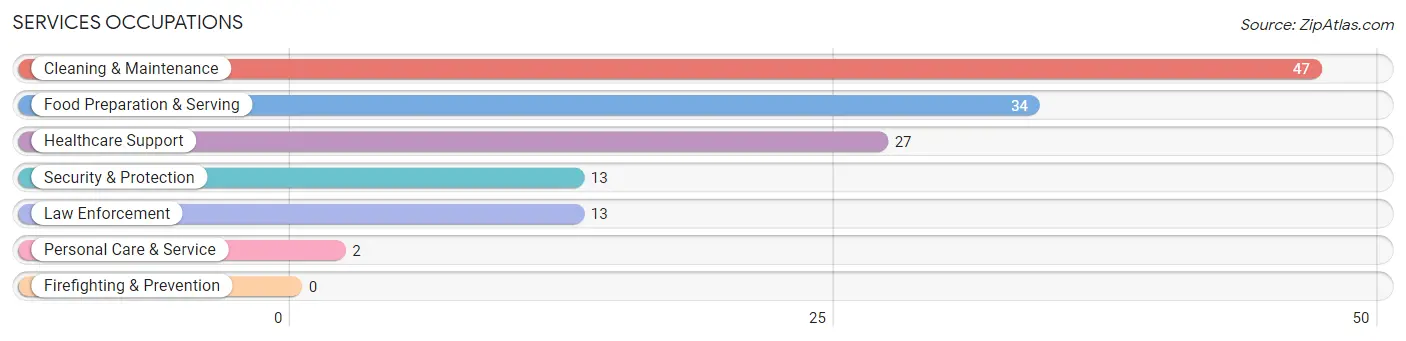
Services Occupations
The most common Services occupations in Albion are Cleaning & Maintenance (47 | 5.3%), Food Preparation & Serving (34 | 3.8%), Healthcare Support (27 | 3.0%), Security & Protection (13 | 1.5%), and Law Enforcement (13 | 1.5%).
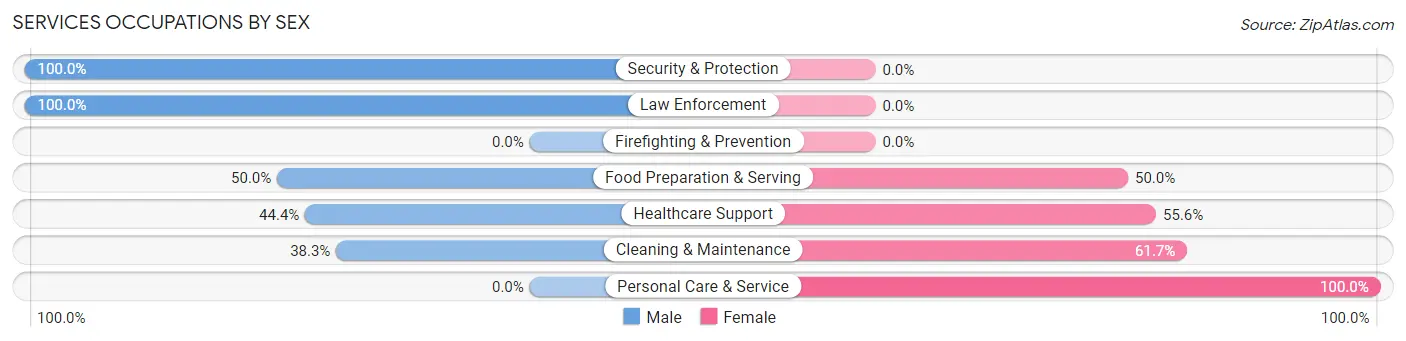
Services Occupations by Sex
Within the Services occupations in Albion, the most male-oriented occupations are Security & Protection (100.0%), Law Enforcement (100.0%), and Food Preparation & Serving (50.0%), while the most female-oriented occupations are Personal Care & Service (100.0%), Cleaning & Maintenance (61.7%), and Healthcare Support (55.6%).
| Occupation | Male | Female |
| Healthcare Support | 12 (44.4%) | 15 (55.6%) |
| Security & Protection | 13 (100.0%) | 0 (0.0%) |
| Firefighting & Prevention | 0 (0.0%) | 0 (0.0%) |
| Law Enforcement | 13 (100.0%) | 0 (0.0%) |
| Food Preparation & Serving | 17 (50.0%) | 17 (50.0%) |
| Cleaning & Maintenance | 18 (38.3%) | 29 (61.7%) |
| Personal Care & Service | 0 (0.0%) | 2 (100.0%) |
| Total (Category) | 60 (48.8%) | 63 (51.2%) |
| Total (Overall) | 480 (54.0%) | 409 (46.0%) |
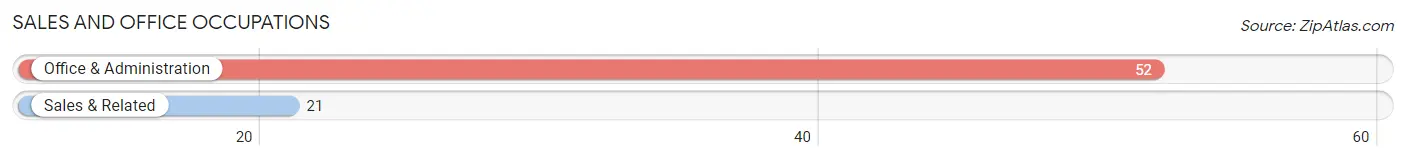
Sales and Office Occupations
The most common Sales and Office occupations in Albion are Office & Administration (52 | 5.9%), and Sales & Related (21 | 2.4%).
Sales and Office Occupations by Sex
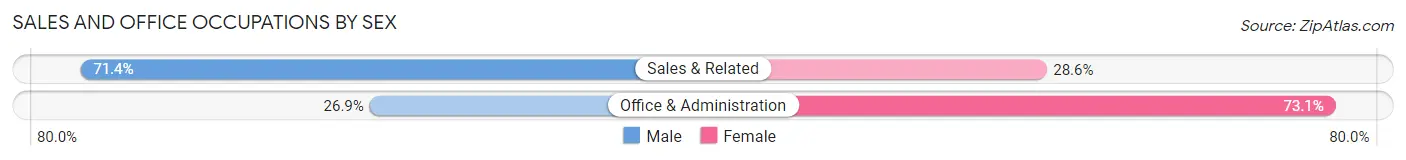
| Occupation | Male | Female |
| Sales & Related | 15 (71.4%) | 6 (28.6%) |
| Office & Administration | 14 (26.9%) | 38 (73.1%) |
| Total (Category) | 29 (39.7%) | 44 (60.3%) |
| Total (Overall) | 480 (54.0%) | 409 (46.0%) |
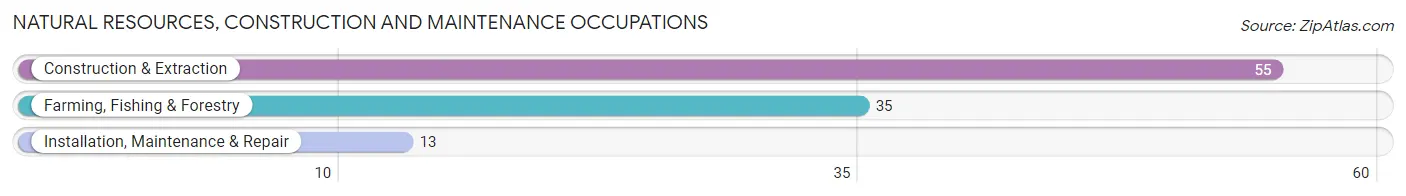
Natural Resources, Construction and Maintenance Occupations
The most common Natural Resources, Construction and Maintenance occupations in Albion are Construction & Extraction (55 | 6.2%), Farming, Fishing & Forestry (35 | 3.9%), and Installation, Maintenance & Repair (13 | 1.5%).
Natural Resources, Construction and Maintenance Occupations by Sex
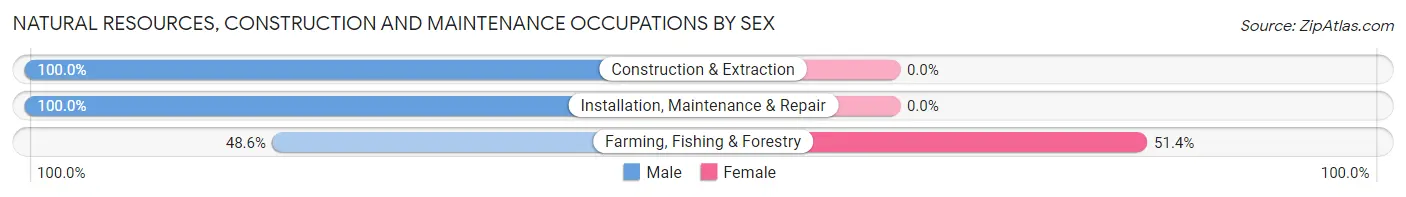
| Occupation | Male | Female |
| Farming, Fishing & Forestry | 17 (48.6%) | 18 (51.4%) |
| Construction & Extraction | 55 (100.0%) | 0 (0.0%) |
| Installation, Maintenance & Repair | 13 (100.0%) | 0 (0.0%) |
| Total (Category) | 85 (82.5%) | 18 (17.5%) |
| Total (Overall) | 480 (54.0%) | 409 (46.0%) |
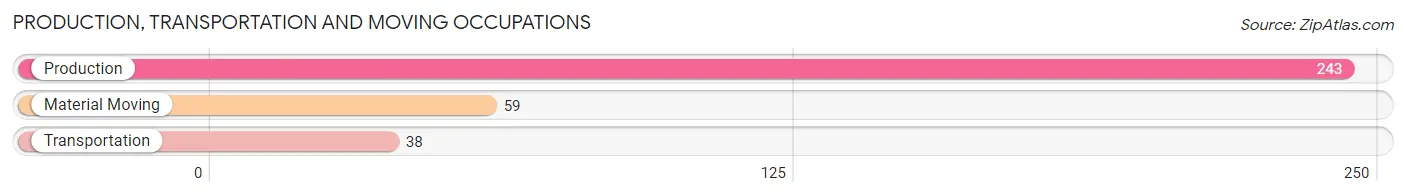
Production, Transportation and Moving Occupations
The most common Production, Transportation and Moving occupations in Albion are Production (243 | 27.3%), Material Moving (59 | 6.6%), and Transportation (38 | 4.3%).
Production, Transportation and Moving Occupations by Sex
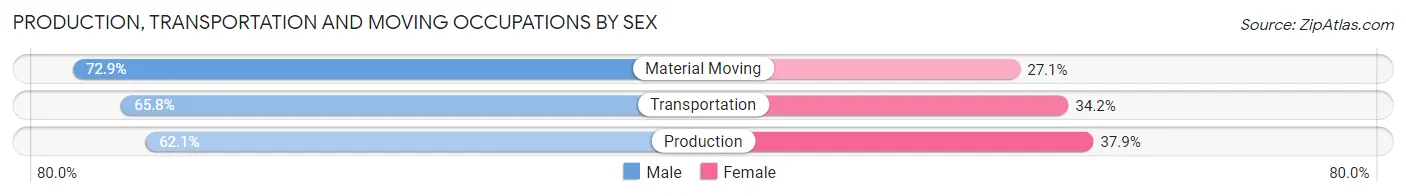
| Occupation | Male | Female |
| Production | 151 (62.1%) | 92 (37.9%) |
| Transportation | 25 (65.8%) | 13 (34.2%) |
| Material Moving | 43 (72.9%) | 16 (27.1%) |
| Total (Category) | 219 (64.4%) | 121 (35.6%) |
| Total (Overall) | 480 (54.0%) | 409 (46.0%) |
Employment Industries by Sex in Albion
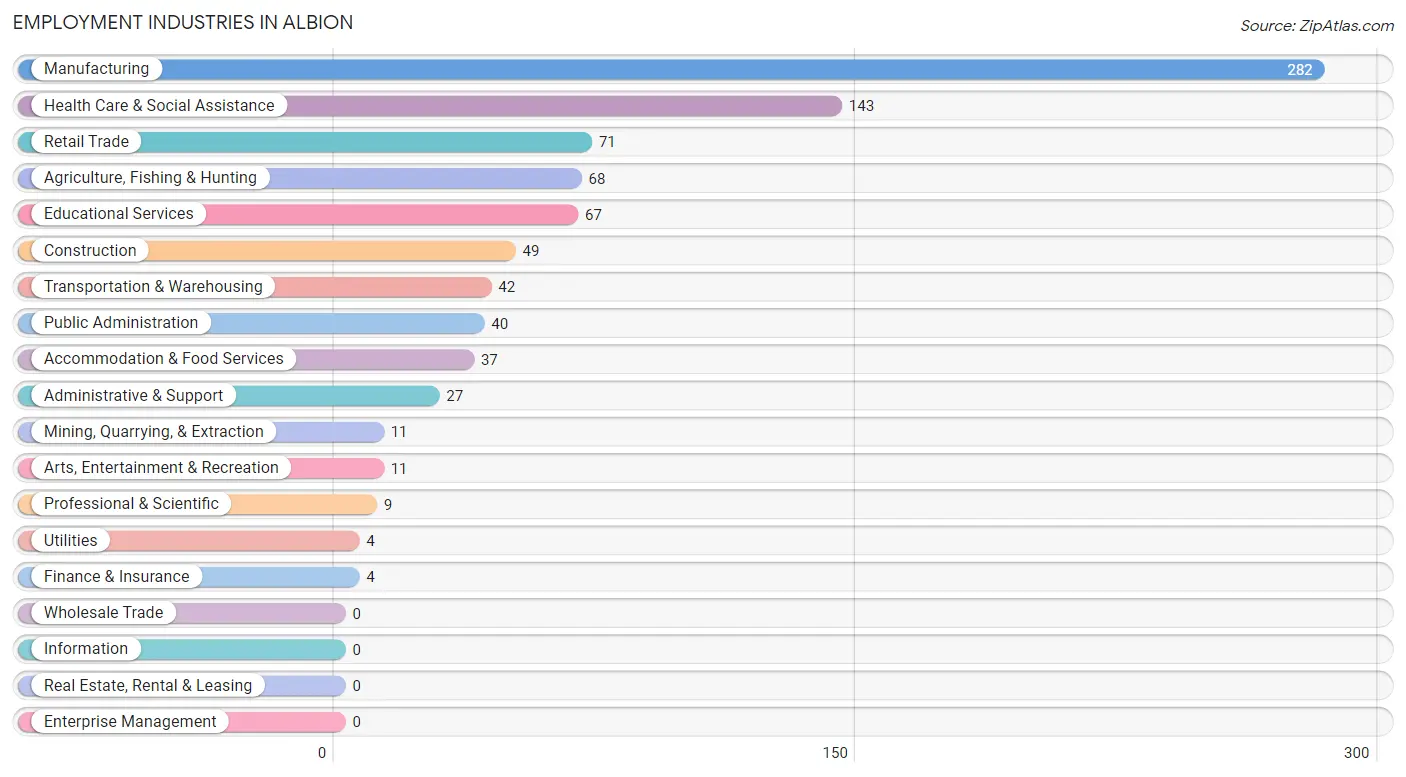
Employment Industries in Albion
The major employment industries in Albion include Manufacturing (282 | 31.7%), Health Care & Social Assistance (143 | 16.1%), Retail Trade (71 | 8.0%), Agriculture, Fishing & Hunting (68 | 7.6%), and Educational Services (67 | 7.5%).
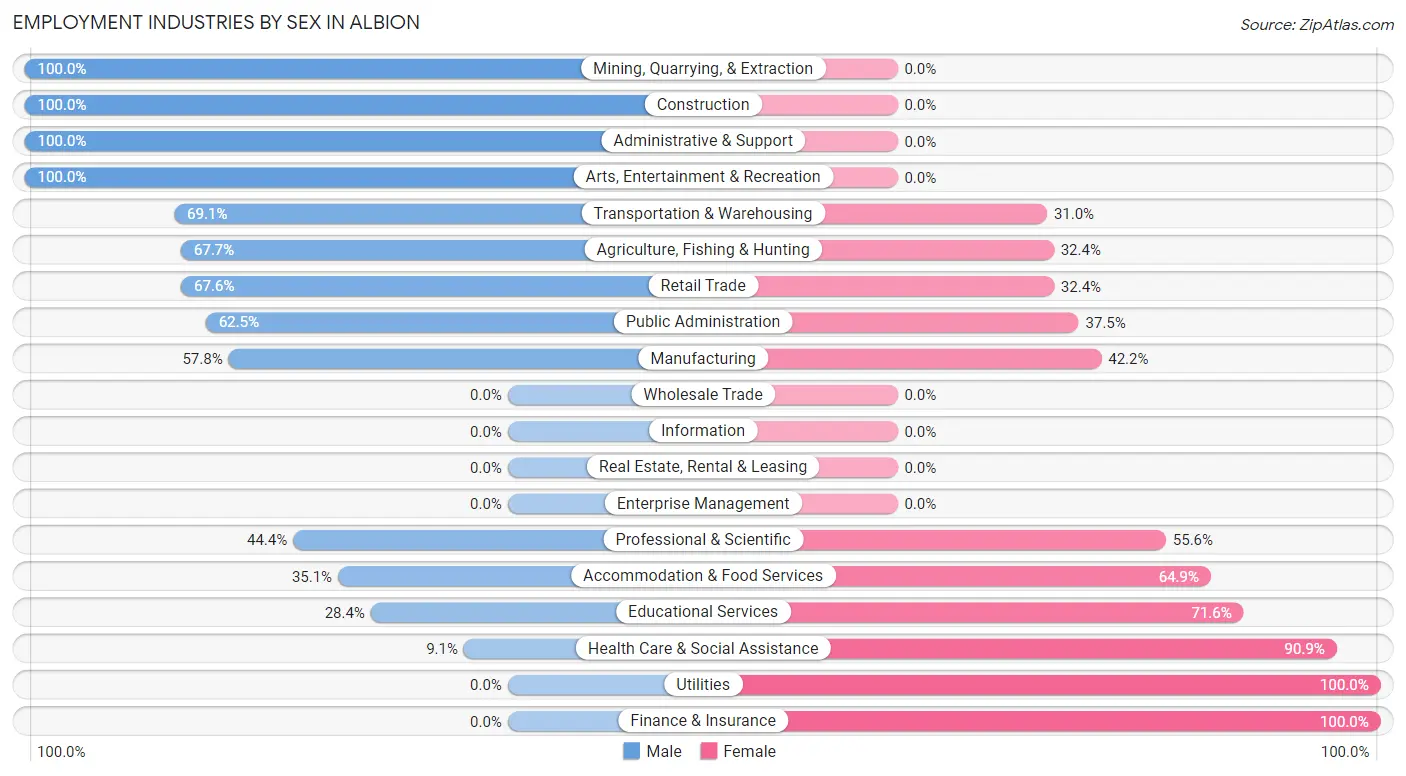
Employment Industries by Sex in Albion
The Albion industries that see more men than women are Mining, Quarrying, & Extraction (100.0%), Construction (100.0%), and Administrative & Support (100.0%), whereas the industries that tend to have a higher number of women are Utilities (100.0%), Finance & Insurance (100.0%), and Health Care & Social Assistance (90.9%).
| Industry | Male | Female |
| Agriculture, Fishing & Hunting | 46 (67.6%) | 22 (32.4%) |
| Mining, Quarrying, & Extraction | 11 (100.0%) | 0 (0.0%) |
| Construction | 49 (100.0%) | 0 (0.0%) |
| Manufacturing | 163 (57.8%) | 119 (42.2%) |
| Wholesale Trade | 0 (0.0%) | 0 (0.0%) |
| Retail Trade | 48 (67.6%) | 23 (32.4%) |
| Transportation & Warehousing | 29 (69.1%) | 13 (30.9%) |
| Utilities | 0 (0.0%) | 4 (100.0%) |
| Information | 0 (0.0%) | 0 (0.0%) |
| Finance & Insurance | 0 (0.0%) | 4 (100.0%) |
| Real Estate, Rental & Leasing | 0 (0.0%) | 0 (0.0%) |
| Professional & Scientific | 4 (44.4%) | 5 (55.6%) |
| Enterprise Management | 0 (0.0%) | 0 (0.0%) |
| Administrative & Support | 27 (100.0%) | 0 (0.0%) |
| Educational Services | 19 (28.4%) | 48 (71.6%) |
| Health Care & Social Assistance | 13 (9.1%) | 130 (90.9%) |
| Arts, Entertainment & Recreation | 11 (100.0%) | 0 (0.0%) |
| Accommodation & Food Services | 13 (35.1%) | 24 (64.9%) |
| Public Administration | 25 (62.5%) | 15 (37.5%) |
| Total | 480 (54.0%) | 409 (46.0%) |
Education in Albion
School Enrollment in Albion
The most common levels of schooling among the 493 students in Albion are high school (201 | 40.8%), elementary school (109 | 22.1%), and middle school (66 | 13.4%).
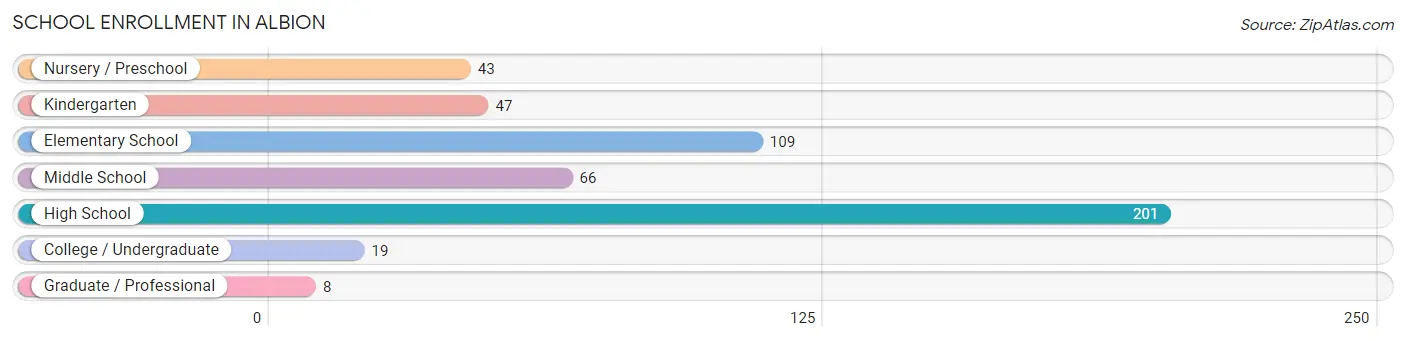
| School Level | # Students | % Students |
| Nursery / Preschool | 43 | 8.7% |
| Kindergarten | 47 | 9.5% |
| Elementary School | 109 | 22.1% |
| Middle School | 66 | 13.4% |
| High School | 201 | 40.8% |
| College / Undergraduate | 19 | 3.8% |
| Graduate / Professional | 8 | 1.6% |
| Total | 493 | 100.0% |
School Enrollment by Age by Funding Source in Albion
Out of a total of 493 students who are enrolled in schools in Albion, 19 (3.9%) attend a private institution, while the remaining 474 (96.1%) are enrolled in public schools. The age group of 35 years and over has the highest likelihood of being enrolled in private schools, with 8 (100.0% in the age bracket) enrolled. Conversely, the age group of 3 to 4 year olds has the lowest likelihood of being enrolled in a private school, with 20 (100.0% in the age bracket) attending a public institution.
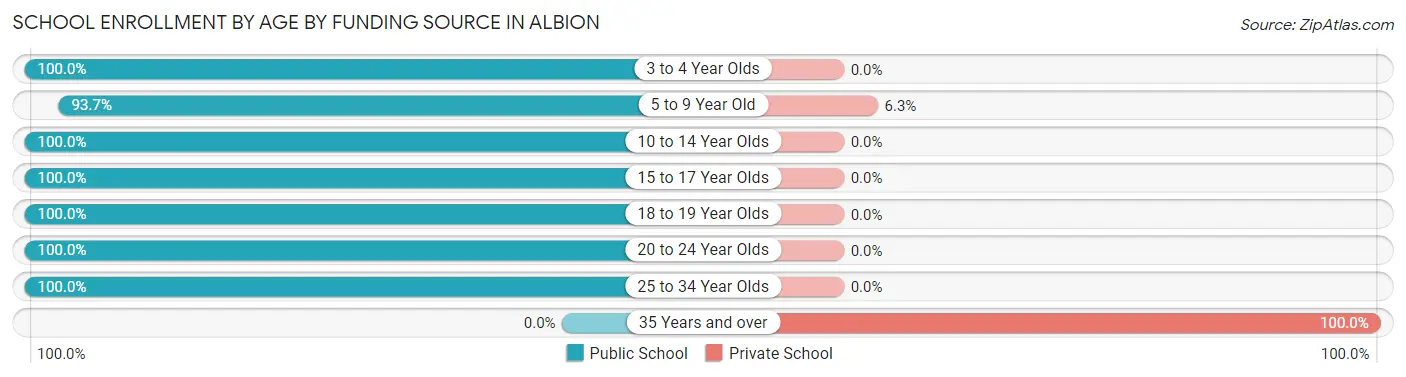
| Age Bracket | Public School | Private School |
| 3 to 4 Year Olds | 20 (100.0%) | 0 (0.0%) |
| 5 to 9 Year Old | 163 (93.7%) | 11 (6.3%) |
| 10 to 14 Year Olds | 99 (100.0%) | 0 (0.0%) |
| 15 to 17 Year Olds | 152 (100.0%) | 0 (0.0%) |
| 18 to 19 Year Olds | 21 (100.0%) | 0 (0.0%) |
| 20 to 24 Year Olds | 16 (100.0%) | 0 (0.0%) |
| 25 to 34 Year Olds | 3 (100.0%) | 0 (0.0%) |
| 35 Years and over | 0 (0.0%) | 8 (100.0%) |
| Total | 474 (96.1%) | 19 (3.9%) |
Educational Attainment by Field of Study in Albion
Education (108 | 51.4%), business (23 | 11.0%), liberal arts & history (22 | 10.5%), arts & humanities (12 | 5.7%), and bio, nature & agricultural (10 | 4.8%) are the most common fields of study among 210 individuals in Albion who have obtained a bachelor's degree or higher.
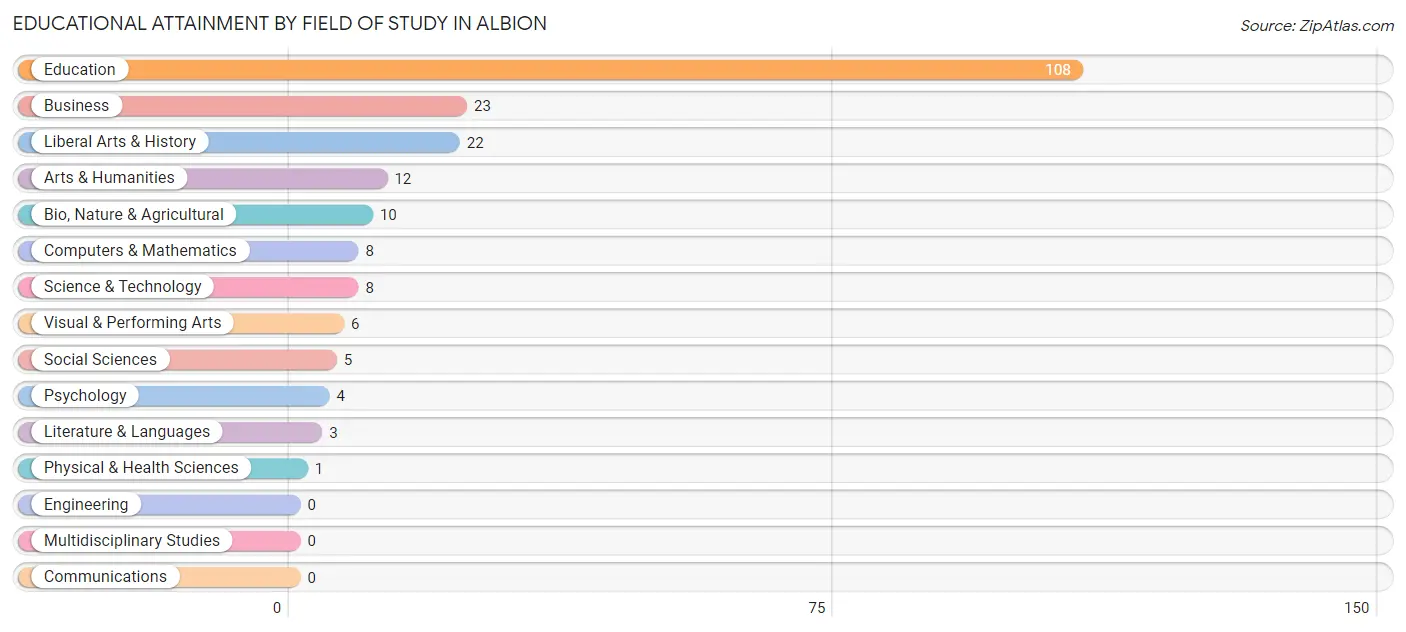
| Field of Study | # Graduates | % Graduates |
| Computers & Mathematics | 8 | 3.8% |
| Bio, Nature & Agricultural | 10 | 4.8% |
| Physical & Health Sciences | 1 | 0.5% |
| Psychology | 4 | 1.9% |
| Social Sciences | 5 | 2.4% |
| Engineering | 0 | 0.0% |
| Multidisciplinary Studies | 0 | 0.0% |
| Science & Technology | 8 | 3.8% |
| Business | 23 | 11.0% |
| Education | 108 | 51.4% |
| Literature & Languages | 3 | 1.4% |
| Liberal Arts & History | 22 | 10.5% |
| Visual & Performing Arts | 6 | 2.9% |
| Communications | 0 | 0.0% |
| Arts & Humanities | 12 | 5.7% |
| Total | 210 | 100.0% |
Transportation & Commute in Albion
Vehicle Availability by Sex in Albion
The most prevalent vehicle ownership categories in Albion are males with 2 vehicles (175, accounting for 36.5%) and females with 2 vehicles (134, making up 43.5%).
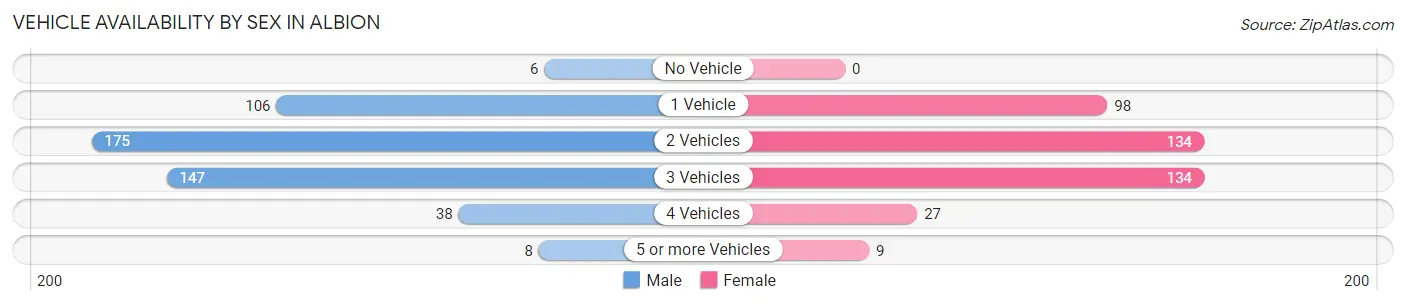
| Vehicles Available | Male | Female |
| No Vehicle | 6 (1.3%) | 0 (0.0%) |
| 1 Vehicle | 106 (22.1%) | 98 (24.4%) |
| 2 Vehicles | 175 (36.5%) | 134 (33.3%) |
| 3 Vehicles | 147 (30.6%) | 134 (33.3%) |
| 4 Vehicles | 38 (7.9%) | 27 (6.7%) |
| 5 or more Vehicles | 8 (1.7%) | 9 (2.2%) |
| Total | 480 (100.0%) | 402 (100.0%) |
Commute Time in Albion
The most frequently occuring commute durations in Albion are 5 to 9 minutes (242 commuters, 27.9%), less than 5 minutes (157 commuters, 18.1%), and 15 to 19 minutes (82 commuters, 9.5%).
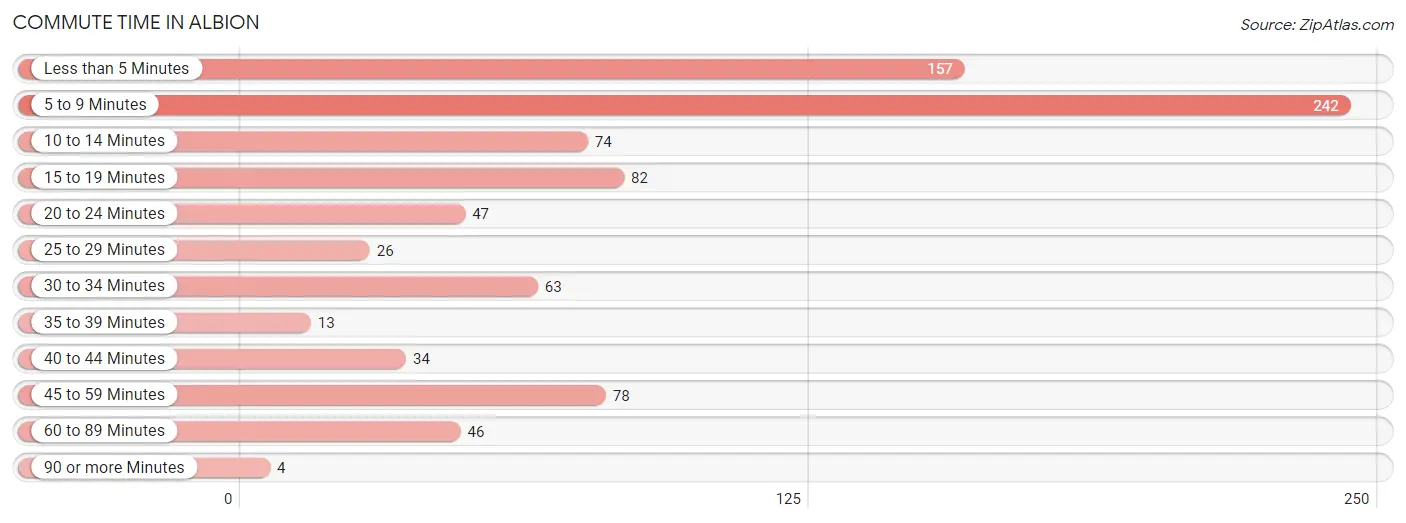
| Commute Time | # Commuters | % Commuters |
| Less than 5 Minutes | 157 | 18.1% |
| 5 to 9 Minutes | 242 | 27.9% |
| 10 to 14 Minutes | 74 | 8.6% |
| 15 to 19 Minutes | 82 | 9.5% |
| 20 to 24 Minutes | 47 | 5.4% |
| 25 to 29 Minutes | 26 | 3.0% |
| 30 to 34 Minutes | 63 | 7.3% |
| 35 to 39 Minutes | 13 | 1.5% |
| 40 to 44 Minutes | 34 | 3.9% |
| 45 to 59 Minutes | 78 | 9.0% |
| 60 to 89 Minutes | 46 | 5.3% |
| 90 or more Minutes | 4 | 0.5% |
Commute Time by Sex in Albion
The most common commute times in Albion are 5 to 9 minutes (137 commuters, 28.5%) for males and 5 to 9 minutes (105 commuters, 27.2%) for females.
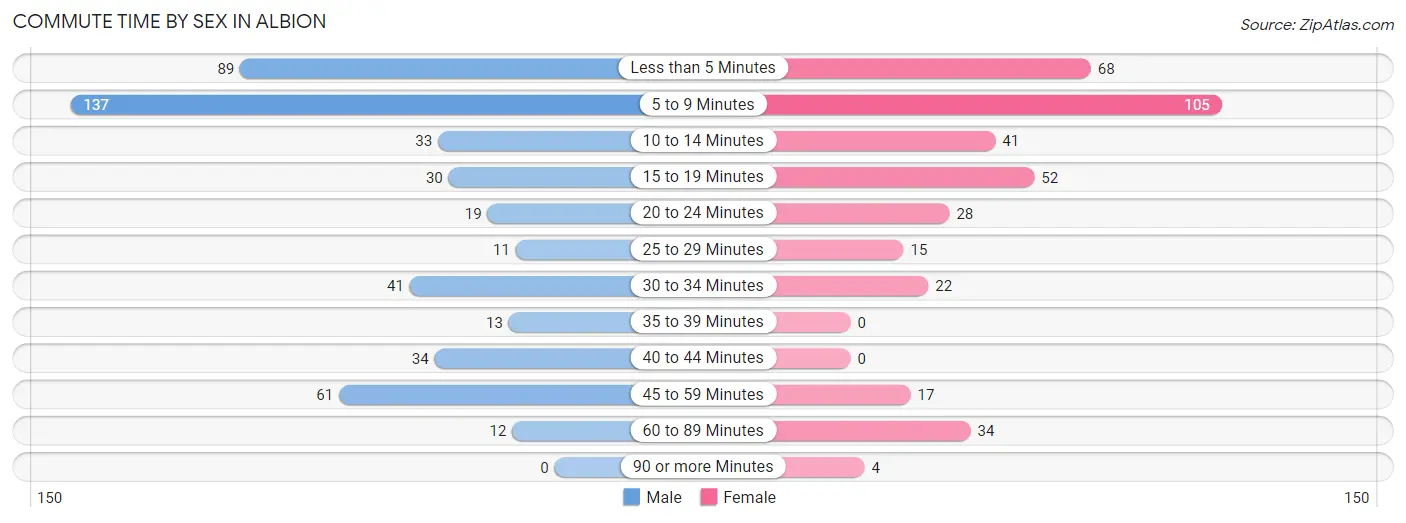
| Commute Time | Male | Female |
| Less than 5 Minutes | 89 (18.5%) | 68 (17.6%) |
| 5 to 9 Minutes | 137 (28.5%) | 105 (27.2%) |
| 10 to 14 Minutes | 33 (6.9%) | 41 (10.6%) |
| 15 to 19 Minutes | 30 (6.2%) | 52 (13.5%) |
| 20 to 24 Minutes | 19 (4.0%) | 28 (7.2%) |
| 25 to 29 Minutes | 11 (2.3%) | 15 (3.9%) |
| 30 to 34 Minutes | 41 (8.5%) | 22 (5.7%) |
| 35 to 39 Minutes | 13 (2.7%) | 0 (0.0%) |
| 40 to 44 Minutes | 34 (7.1%) | 0 (0.0%) |
| 45 to 59 Minutes | 61 (12.7%) | 17 (4.4%) |
| 60 to 89 Minutes | 12 (2.5%) | 34 (8.8%) |
| 90 or more Minutes | 0 (0.0%) | 4 (1.0%) |
Time of Departure to Work by Sex in Albion
The most frequent times of departure to work in Albion are 6:30 AM to 6:59 AM (115, 24.0%) for males and 4:00 PM to 11:59 PM (73, 18.9%) for females.
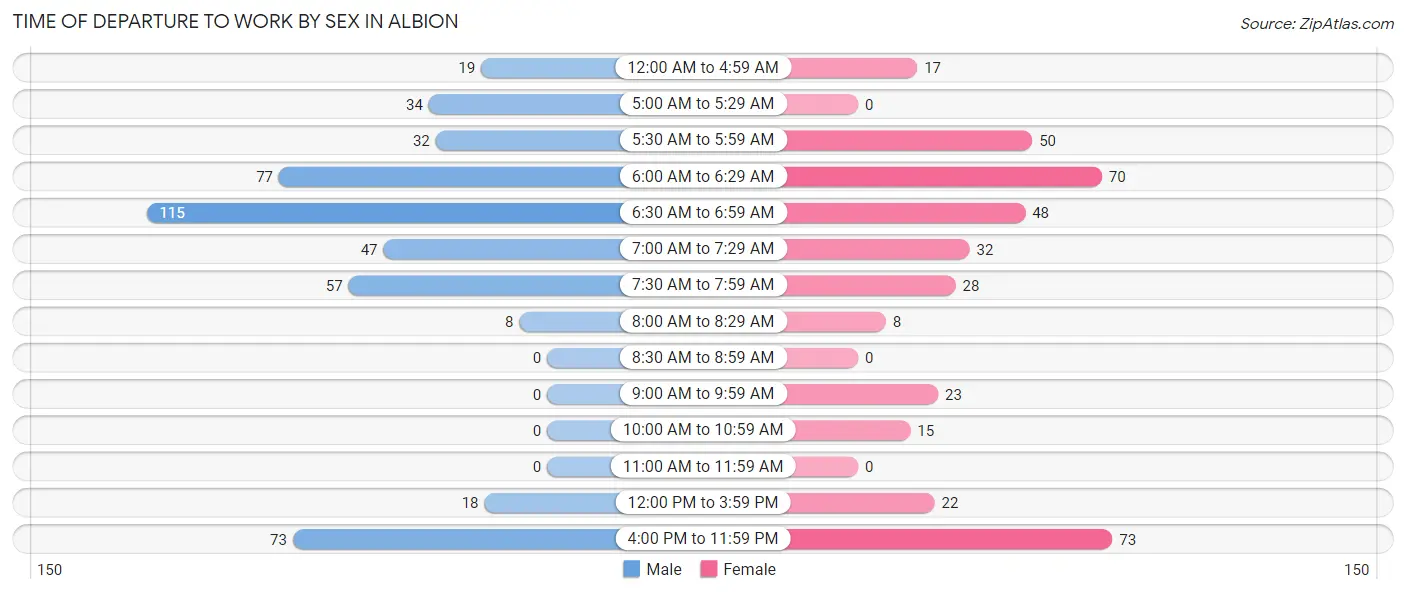
| Time of Departure | Male | Female |
| 12:00 AM to 4:59 AM | 19 (4.0%) | 17 (4.4%) |
| 5:00 AM to 5:29 AM | 34 (7.1%) | 0 (0.0%) |
| 5:30 AM to 5:59 AM | 32 (6.7%) | 50 (13.0%) |
| 6:00 AM to 6:29 AM | 77 (16.0%) | 70 (18.1%) |
| 6:30 AM to 6:59 AM | 115 (24.0%) | 48 (12.4%) |
| 7:00 AM to 7:29 AM | 47 (9.8%) | 32 (8.3%) |
| 7:30 AM to 7:59 AM | 57 (11.9%) | 28 (7.2%) |
| 8:00 AM to 8:29 AM | 8 (1.7%) | 8 (2.1%) |
| 8:30 AM to 8:59 AM | 0 (0.0%) | 0 (0.0%) |
| 9:00 AM to 9:59 AM | 0 (0.0%) | 23 (6.0%) |
| 10:00 AM to 10:59 AM | 0 (0.0%) | 15 (3.9%) |
| 11:00 AM to 11:59 AM | 0 (0.0%) | 0 (0.0%) |
| 12:00 PM to 3:59 PM | 18 (3.7%) | 22 (5.7%) |
| 4:00 PM to 11:59 PM | 73 (15.2%) | 73 (18.9%) |
| Total | 480 (100.0%) | 386 (100.0%) |
Housing Occupancy in Albion
Occupancy by Ownership in Albion
Of the total 873 dwellings in Albion, owner-occupied units account for 572 (65.5%), while renter-occupied units make up 301 (34.5%).
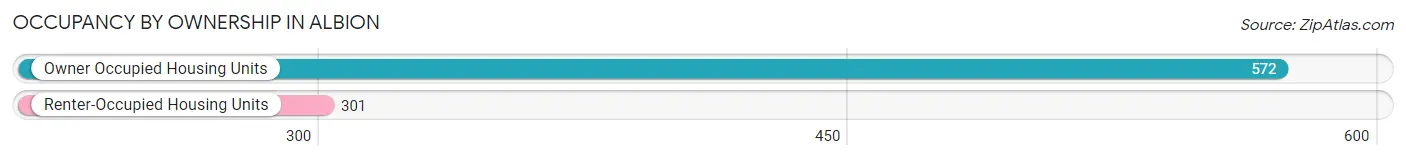
| Occupancy | # Housing Units | % Housing Units |
| Owner Occupied Housing Units | 572 | 65.5% |
| Renter-Occupied Housing Units | 301 | 34.5% |
| Total Occupied Housing Units | 873 | 100.0% |
Occupancy by Household Size in Albion
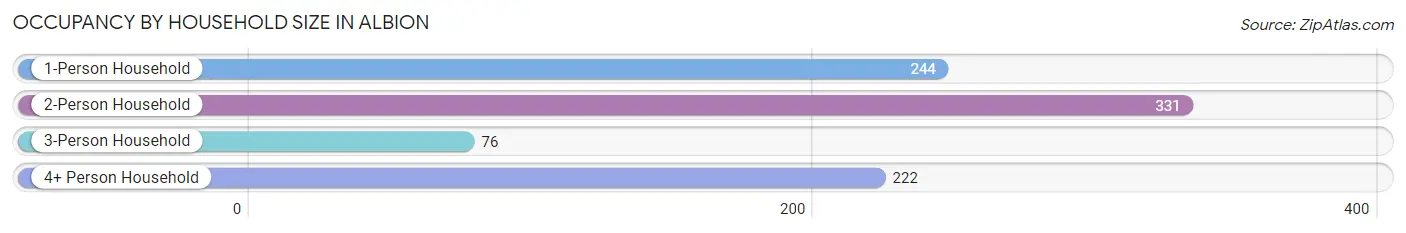
| Household Size | # Housing Units | % Housing Units |
| 1-Person Household | 244 | 28.0% |
| 2-Person Household | 331 | 37.9% |
| 3-Person Household | 76 | 8.7% |
| 4+ Person Household | 222 | 25.4% |
| Total Housing Units | 873 | 100.0% |
Occupancy by Ownership by Household Size in Albion
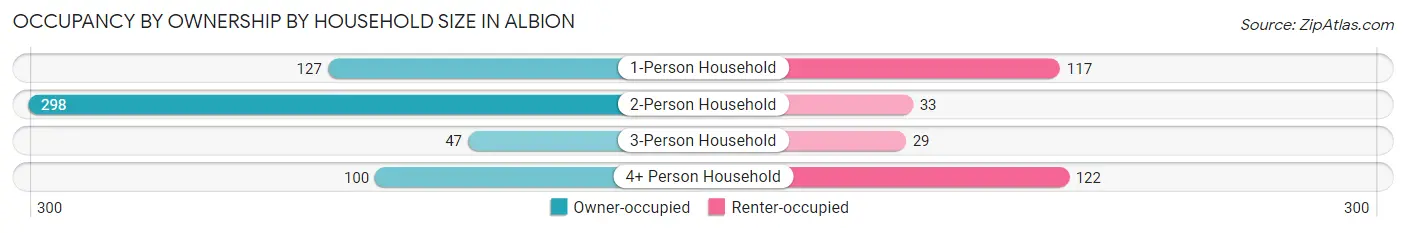
| Household Size | Owner-occupied | Renter-occupied |
| 1-Person Household | 127 (52.0%) | 117 (47.9%) |
| 2-Person Household | 298 (90.0%) | 33 (10.0%) |
| 3-Person Household | 47 (61.8%) | 29 (38.2%) |
| 4+ Person Household | 100 (45.1%) | 122 (54.9%) |
| Total Housing Units | 572 (65.5%) | 301 (34.5%) |
Occupancy by Educational Attainment in Albion
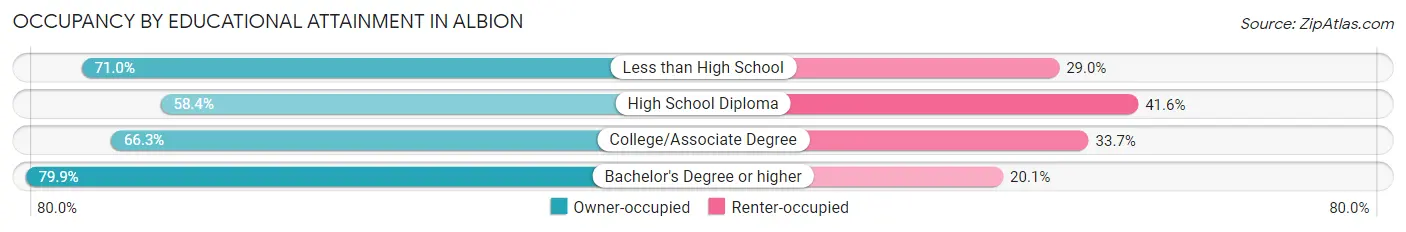
| Household Size | Owner-occupied | Renter-occupied |
| Less than High School | 22 (71.0%) | 9 (29.0%) |
| High School Diploma | 201 (58.4%) | 143 (41.6%) |
| College/Associate Degree | 238 (66.3%) | 121 (33.7%) |
| Bachelor's Degree or higher | 111 (79.9%) | 28 (20.1%) |
Occupancy by Age of Householder in Albion
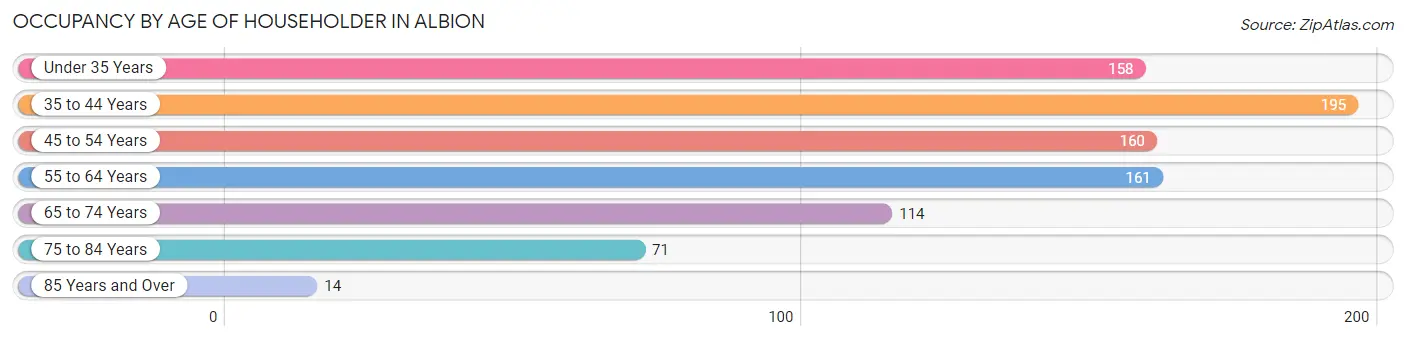
| Age Bracket | # Households | % Households |
| Under 35 Years | 158 | 18.1% |
| 35 to 44 Years | 195 | 22.3% |
| 45 to 54 Years | 160 | 18.3% |
| 55 to 64 Years | 161 | 18.4% |
| 65 to 74 Years | 114 | 13.1% |
| 75 to 84 Years | 71 | 8.1% |
| 85 Years and Over | 14 | 1.6% |
| Total | 873 | 100.0% |
Housing Finances in Albion
Median Income by Occupancy in Albion
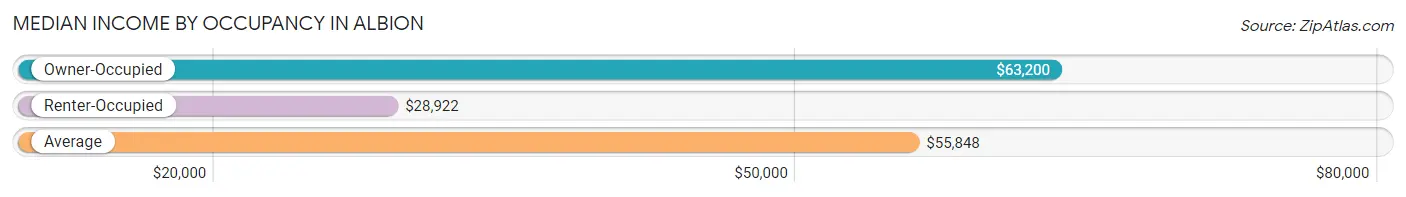
| Occupancy Type | # Households | Median Income |
| Owner-Occupied | 572 (65.5%) | $63,200 |
| Renter-Occupied | 301 (34.5%) | $28,922 |
| Average | 873 (100.0%) | $55,848 |
Occupancy by Householder Income Bracket in Albion
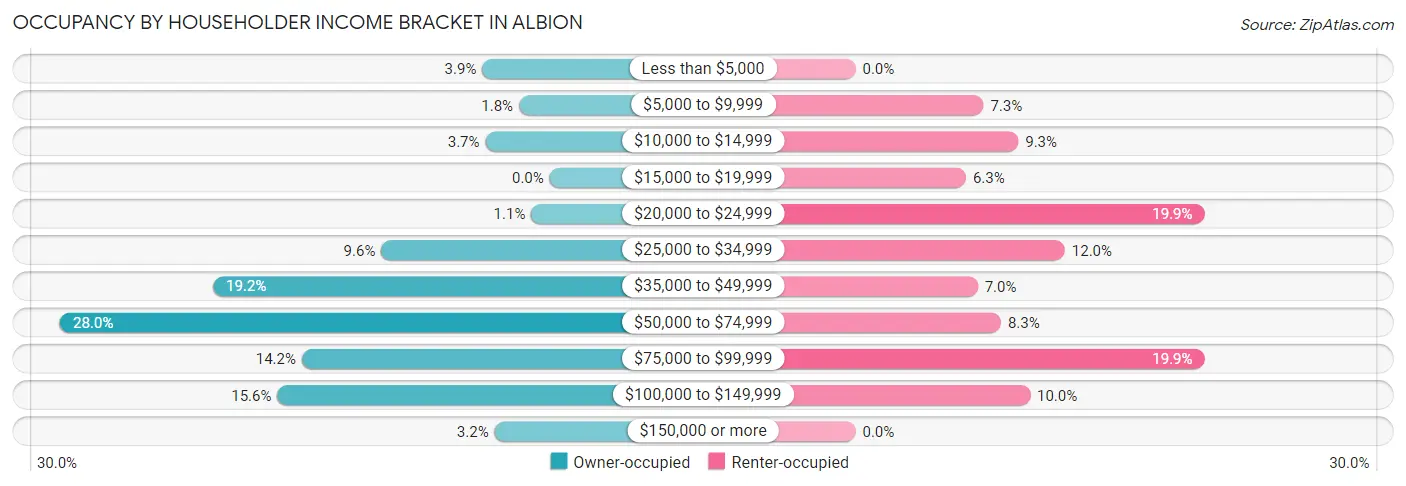
| Income Bracket | Owner-occupied | Renter-occupied |
| Less than $5,000 | 22 (3.8%) | 0 (0.0%) |
| $5,000 to $9,999 | 10 (1.8%) | 22 (7.3%) |
| $10,000 to $14,999 | 21 (3.7%) | 28 (9.3%) |
| $15,000 to $19,999 | 0 (0.0%) | 19 (6.3%) |
| $20,000 to $24,999 | 6 (1.1%) | 60 (19.9%) |
| $25,000 to $34,999 | 55 (9.6%) | 36 (12.0%) |
| $35,000 to $49,999 | 110 (19.2%) | 21 (7.0%) |
| $50,000 to $74,999 | 160 (28.0%) | 25 (8.3%) |
| $75,000 to $99,999 | 81 (14.2%) | 60 (19.9%) |
| $100,000 to $149,999 | 89 (15.6%) | 30 (10.0%) |
| $150,000 or more | 18 (3.2%) | 0 (0.0%) |
| Total | 572 (100.0%) | 301 (100.0%) |
Monthly Housing Cost Tiers in Albion
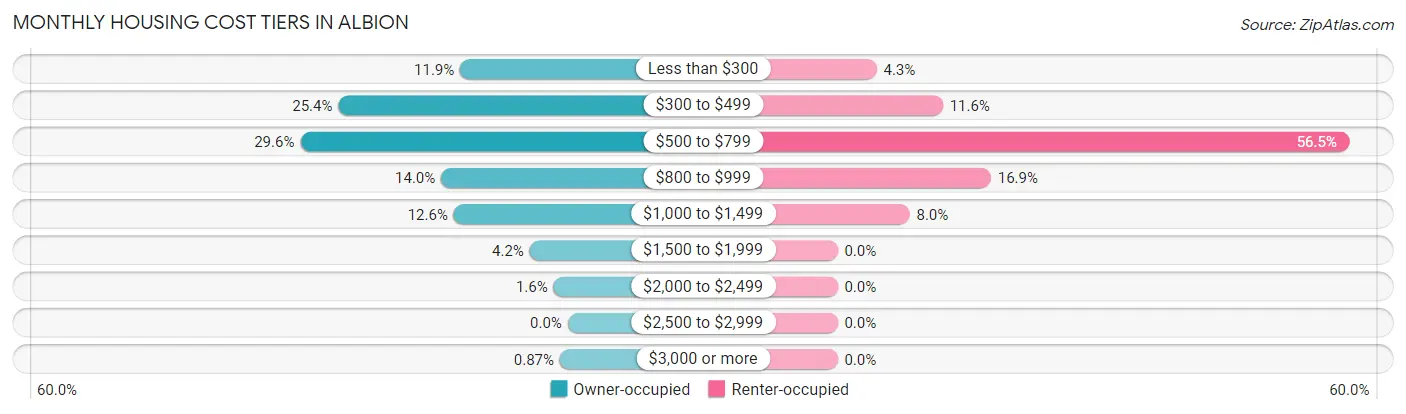
| Monthly Cost | Owner-occupied | Renter-occupied |
| Less than $300 | 68 (11.9%) | 13 (4.3%) |
| $300 to $499 | 145 (25.4%) | 35 (11.6%) |
| $500 to $799 | 169 (29.5%) | 170 (56.5%) |
| $800 to $999 | 80 (14.0%) | 51 (16.9%) |
| $1,000 to $1,499 | 72 (12.6%) | 24 (8.0%) |
| $1,500 to $1,999 | 24 (4.2%) | 0 (0.0%) |
| $2,000 to $2,499 | 9 (1.6%) | 0 (0.0%) |
| $2,500 to $2,999 | 0 (0.0%) | 0 (0.0%) |
| $3,000 or more | 5 (0.9%) | 0 (0.0%) |
| Total | 572 (100.0%) | 301 (100.0%) |
Physical Housing Characteristics in Albion
Housing Structures in Albion
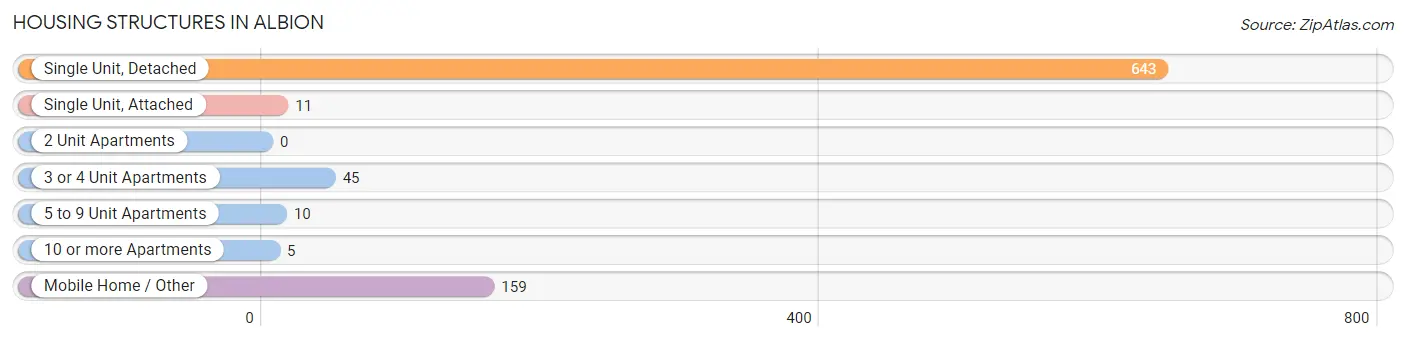
| Structure Type | # Housing Units | % Housing Units |
| Single Unit, Detached | 643 | 73.7% |
| Single Unit, Attached | 11 | 1.3% |
| 2 Unit Apartments | 0 | 0.0% |
| 3 or 4 Unit Apartments | 45 | 5.1% |
| 5 to 9 Unit Apartments | 10 | 1.1% |
| 10 or more Apartments | 5 | 0.6% |
| Mobile Home / Other | 159 | 18.2% |
| Total | 873 | 100.0% |
Housing Structures by Occupancy in Albion
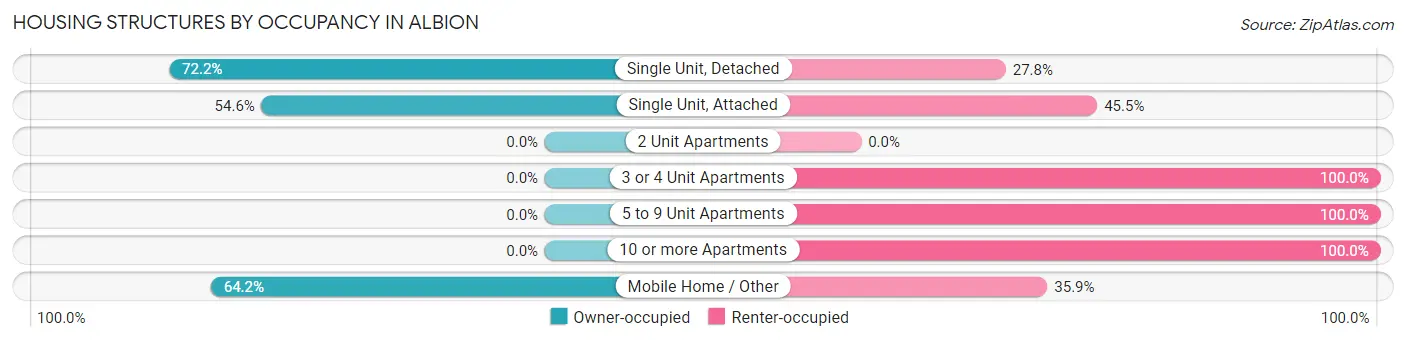
| Structure Type | Owner-occupied | Renter-occupied |
| Single Unit, Detached | 464 (72.2%) | 179 (27.8%) |
| Single Unit, Attached | 6 (54.5%) | 5 (45.5%) |
| 2 Unit Apartments | 0 (0.0%) | 0 (0.0%) |
| 3 or 4 Unit Apartments | 0 (0.0%) | 45 (100.0%) |
| 5 to 9 Unit Apartments | 0 (0.0%) | 10 (100.0%) |
| 10 or more Apartments | 0 (0.0%) | 5 (100.0%) |
| Mobile Home / Other | 102 (64.1%) | 57 (35.8%) |
| Total | 572 (65.5%) | 301 (34.5%) |
Housing Structures by Number of Rooms in Albion
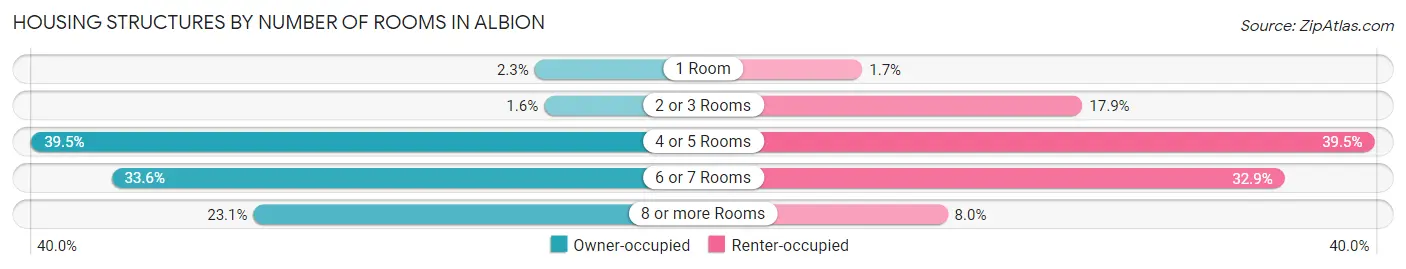
| Number of Rooms | Owner-occupied | Renter-occupied |
| 1 Room | 13 (2.3%) | 5 (1.7%) |
| 2 or 3 Rooms | 9 (1.6%) | 54 (17.9%) |
| 4 or 5 Rooms | 226 (39.5%) | 119 (39.5%) |
| 6 or 7 Rooms | 192 (33.6%) | 99 (32.9%) |
| 8 or more Rooms | 132 (23.1%) | 24 (8.0%) |
| Total | 572 (100.0%) | 301 (100.0%) |
Housing Structure by Heating Type in Albion
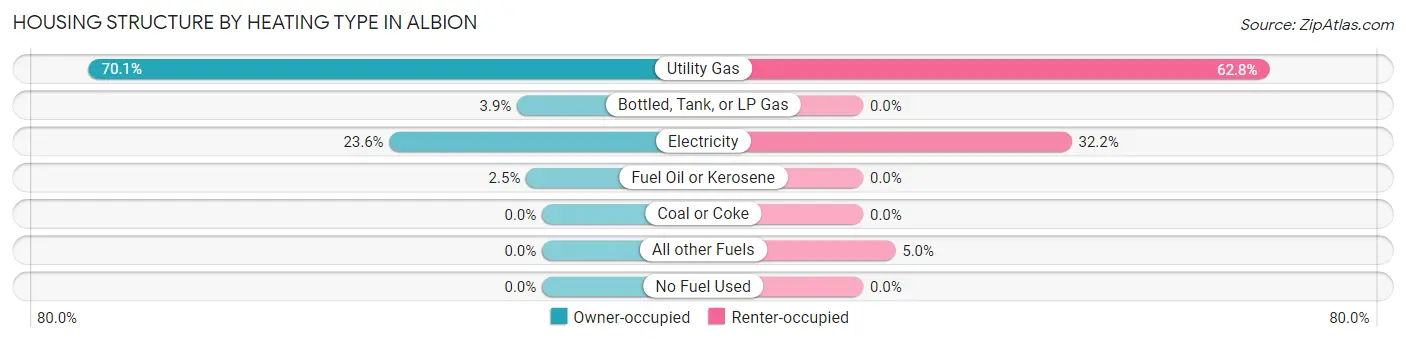
| Heating Type | Owner-occupied | Renter-occupied |
| Utility Gas | 401 (70.1%) | 189 (62.8%) |
| Bottled, Tank, or LP Gas | 22 (3.8%) | 0 (0.0%) |
| Electricity | 135 (23.6%) | 97 (32.2%) |
| Fuel Oil or Kerosene | 14 (2.5%) | 0 (0.0%) |
| Coal or Coke | 0 (0.0%) | 0 (0.0%) |
| All other Fuels | 0 (0.0%) | 15 (5.0%) |
| No Fuel Used | 0 (0.0%) | 0 (0.0%) |
| Total | 572 (100.0%) | 301 (100.0%) |
Household Vehicle Usage in Albion
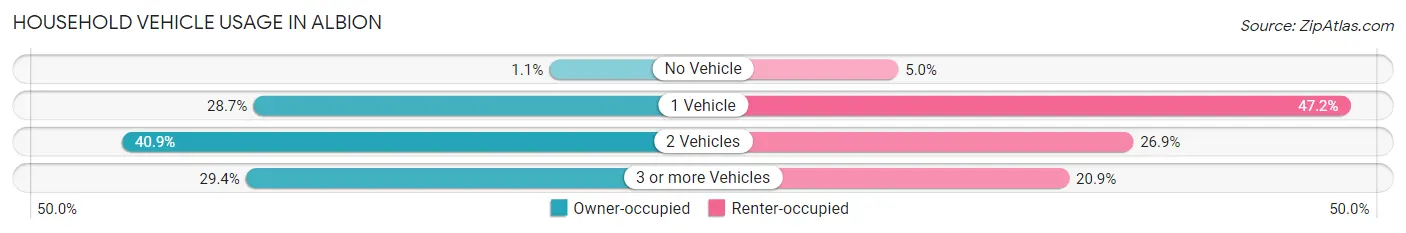
| Vehicles per Household | Owner-occupied | Renter-occupied |
| No Vehicle | 6 (1.1%) | 15 (5.0%) |
| 1 Vehicle | 164 (28.7%) | 142 (47.2%) |
| 2 Vehicles | 234 (40.9%) | 81 (26.9%) |
| 3 or more Vehicles | 168 (29.4%) | 63 (20.9%) |
| Total | 572 (100.0%) | 301 (100.0%) |
Real Estate & Mortgages in Albion
Real Estate and Mortgage Overview in Albion
| Characteristic | Without Mortgage | With Mortgage |
| Housing Units | 277 | 295 |
| Median Property Value | $93,100 | $95,200 |
| Median Household Income | $48,250 | $18 |
| Monthly Housing Costs | $378 | $5 |
| Real Estate Taxes | $1,235 | $10 |
Property Value by Mortgage Status in Albion
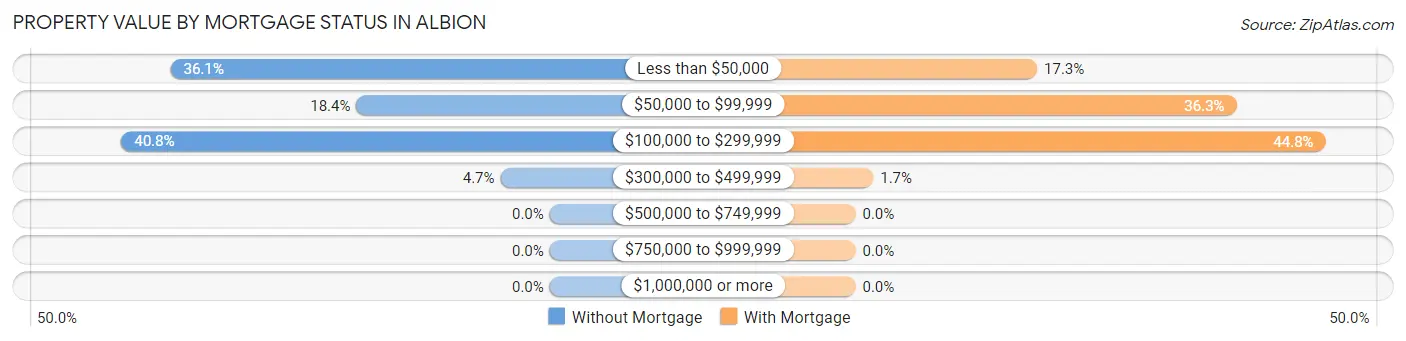
| Property Value | Without Mortgage | With Mortgage |
| Less than $50,000 | 100 (36.1%) | 51 (17.3%) |
| $50,000 to $99,999 | 51 (18.4%) | 107 (36.3%) |
| $100,000 to $299,999 | 113 (40.8%) | 132 (44.8%) |
| $300,000 to $499,999 | 13 (4.7%) | 5 (1.7%) |
| $500,000 to $749,999 | 0 (0.0%) | 0 (0.0%) |
| $750,000 to $999,999 | 0 (0.0%) | 0 (0.0%) |
| $1,000,000 or more | 0 (0.0%) | 0 (0.0%) |
| Total | 277 (100.0%) | 295 (100.0%) |
Household Income by Mortgage Status in Albion
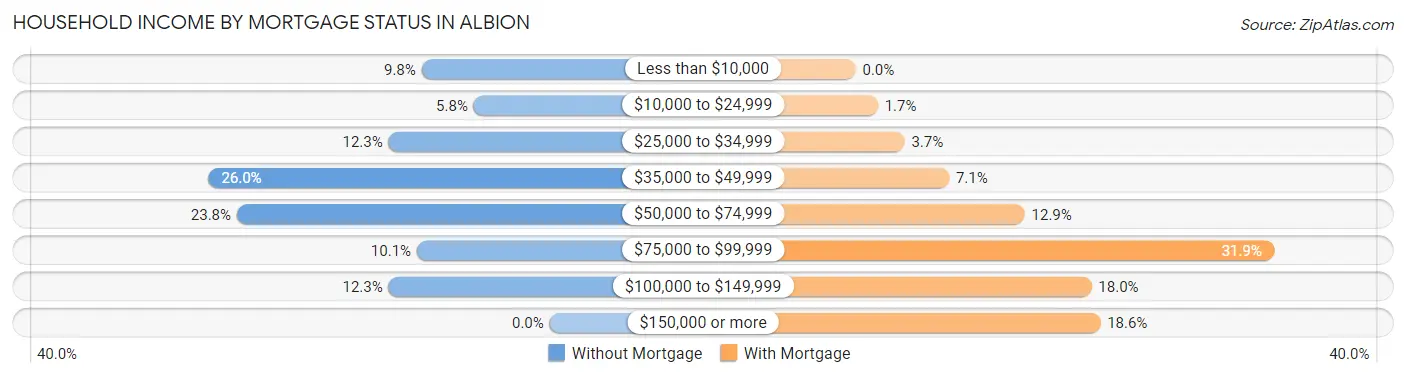
| Household Income | Without Mortgage | With Mortgage |
| Less than $10,000 | 27 (9.8%) | 0 (0.0%) |
| $10,000 to $24,999 | 16 (5.8%) | 5 (1.7%) |
| $25,000 to $34,999 | 34 (12.3%) | 11 (3.7%) |
| $35,000 to $49,999 | 72 (26.0%) | 21 (7.1%) |
| $50,000 to $74,999 | 66 (23.8%) | 38 (12.9%) |
| $75,000 to $99,999 | 28 (10.1%) | 94 (31.9%) |
| $100,000 to $149,999 | 34 (12.3%) | 53 (18.0%) |
| $150,000 or more | 0 (0.0%) | 55 (18.6%) |
| Total | 277 (100.0%) | 295 (100.0%) |
Property Value to Household Income Ratio in Albion
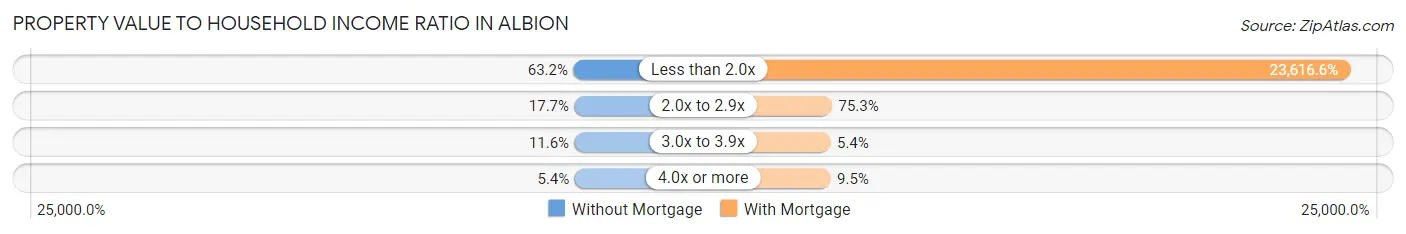
| Value-to-Income Ratio | Without Mortgage | With Mortgage |
| Less than 2.0x | 175 (63.2%) | 69,669 (23,616.6%) |
| 2.0x to 2.9x | 49 (17.7%) | 222 (75.2%) |
| 3.0x to 3.9x | 32 (11.6%) | 16 (5.4%) |
| 4.0x or more | 15 (5.4%) | 28 (9.5%) |
| Total | 277 (100.0%) | 295 (100.0%) |
Real Estate Taxes by Mortgage Status in Albion
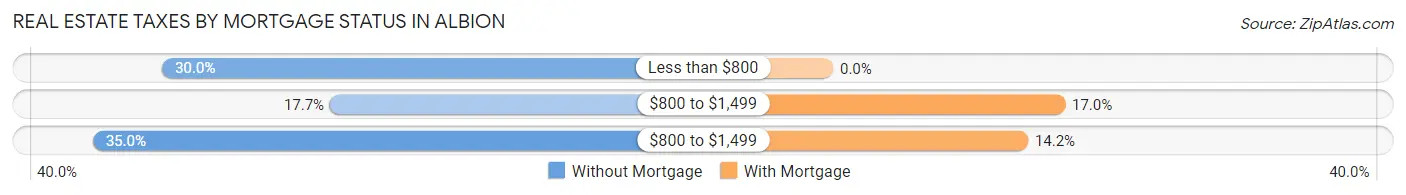
| Property Taxes | Without Mortgage | With Mortgage |
| Less than $800 | 83 (30.0%) | 0 (0.0%) |
| $800 to $1,499 | 49 (17.7%) | 50 (17.0%) |
| $800 to $1,499 | 97 (35.0%) | 42 (14.2%) |
| Total | 277 (100.0%) | 295 (100.0%) |
Health & Disability in Albion
Health Insurance Coverage by Age in Albion
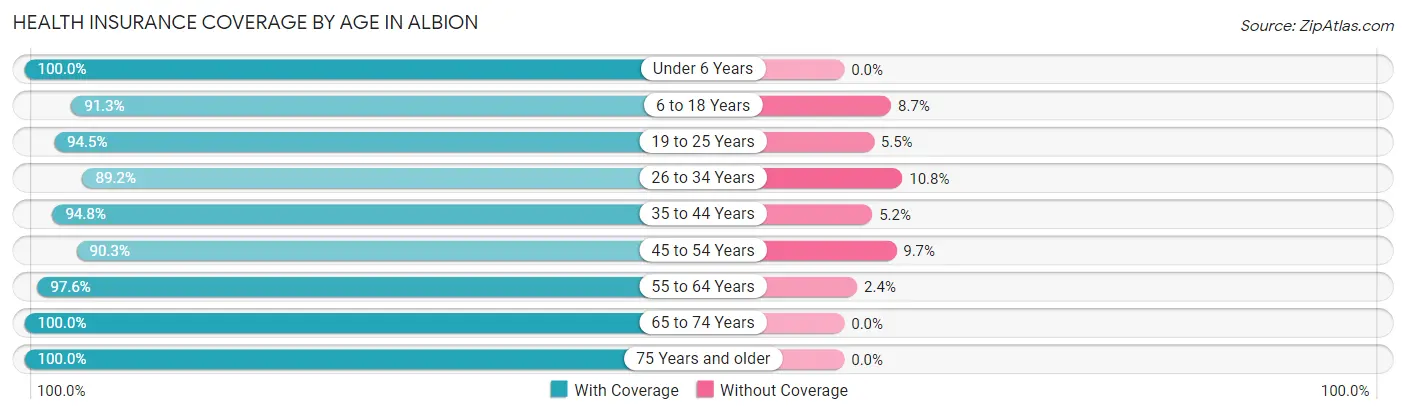
| Age Bracket | With Coverage | Without Coverage |
| Under 6 Years | 216 (100.0%) | 0 (0.0%) |
| 6 to 18 Years | 408 (91.3%) | 39 (8.7%) |
| 19 to 25 Years | 120 (94.5%) | 7 (5.5%) |
| 26 to 34 Years | 173 (89.2%) | 21 (10.8%) |
| 35 to 44 Years | 291 (94.8%) | 16 (5.2%) |
| 45 to 54 Years | 233 (90.3%) | 25 (9.7%) |
| 55 to 64 Years | 244 (97.6%) | 6 (2.4%) |
| 65 to 74 Years | 203 (100.0%) | 0 (0.0%) |
| 75 Years and older | 113 (100.0%) | 0 (0.0%) |
| Total | 2,001 (94.6%) | 114 (5.4%) |
Health Insurance Coverage by Citizenship Status in Albion
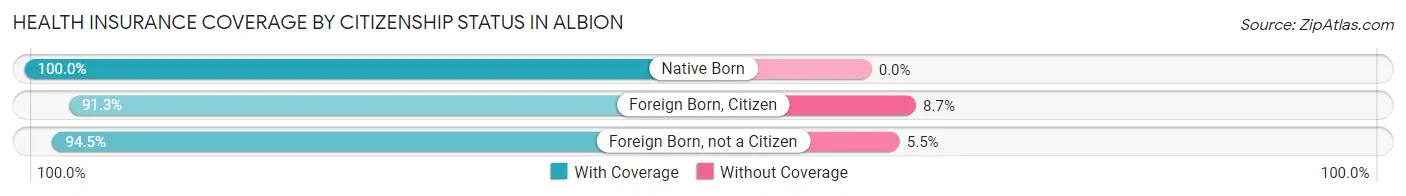
| Citizenship Status | With Coverage | Without Coverage |
| Native Born | 216 (100.0%) | 0 (0.0%) |
| Foreign Born, Citizen | 408 (91.3%) | 39 (8.7%) |
| Foreign Born, not a Citizen | 120 (94.5%) | 7 (5.5%) |
Health Insurance Coverage by Household Income in Albion
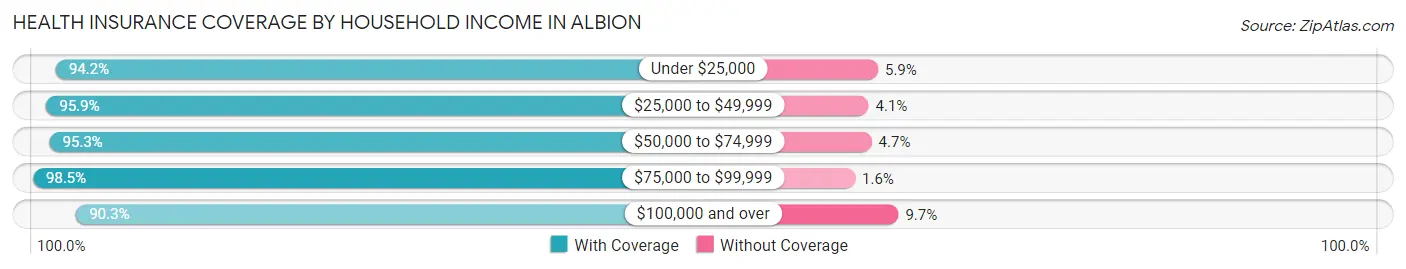
| Household Income | With Coverage | Without Coverage |
| Under $25,000 | 354 (94.2%) | 22 (5.9%) |
| $25,000 to $49,999 | 470 (95.9%) | 20 (4.1%) |
| $50,000 to $74,999 | 430 (95.3%) | 21 (4.7%) |
| $75,000 to $99,999 | 318 (98.5%) | 5 (1.5%) |
| $100,000 and over | 429 (90.3%) | 46 (9.7%) |
Public vs Private Health Insurance Coverage by Age in Albion
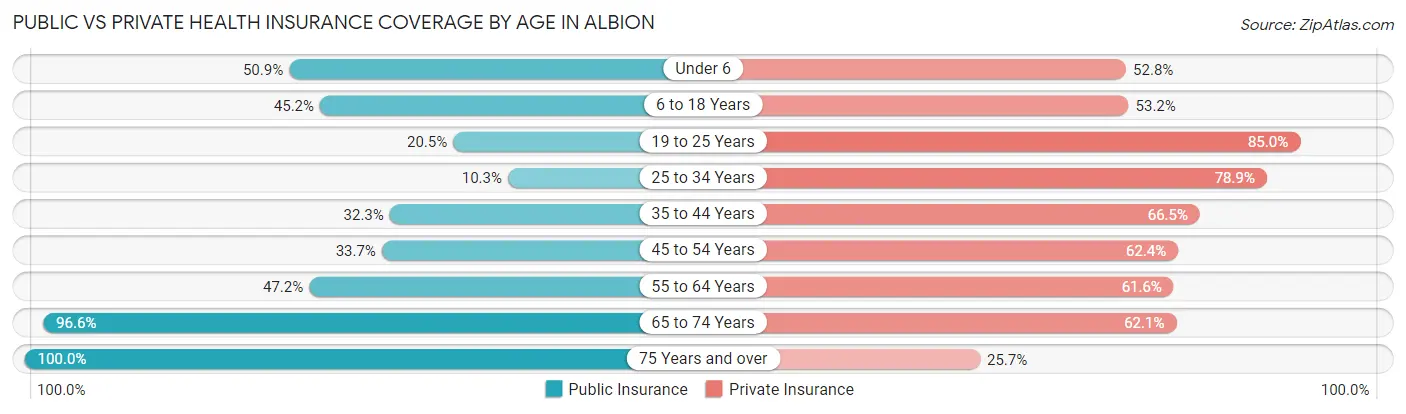
| Age Bracket | Public Insurance | Private Insurance |
| Under 6 | 110 (50.9%) | 114 (52.8%) |
| 6 to 18 Years | 202 (45.2%) | 238 (53.2%) |
| 19 to 25 Years | 26 (20.5%) | 108 (85.0%) |
| 25 to 34 Years | 20 (10.3%) | 153 (78.9%) |
| 35 to 44 Years | 99 (32.3%) | 204 (66.4%) |
| 45 to 54 Years | 87 (33.7%) | 161 (62.4%) |
| 55 to 64 Years | 118 (47.2%) | 154 (61.6%) |
| 65 to 74 Years | 196 (96.6%) | 126 (62.1%) |
| 75 Years and over | 113 (100.0%) | 29 (25.7%) |
| Total | 971 (45.9%) | 1,287 (60.9%) |
Disability Status by Sex by Age in Albion
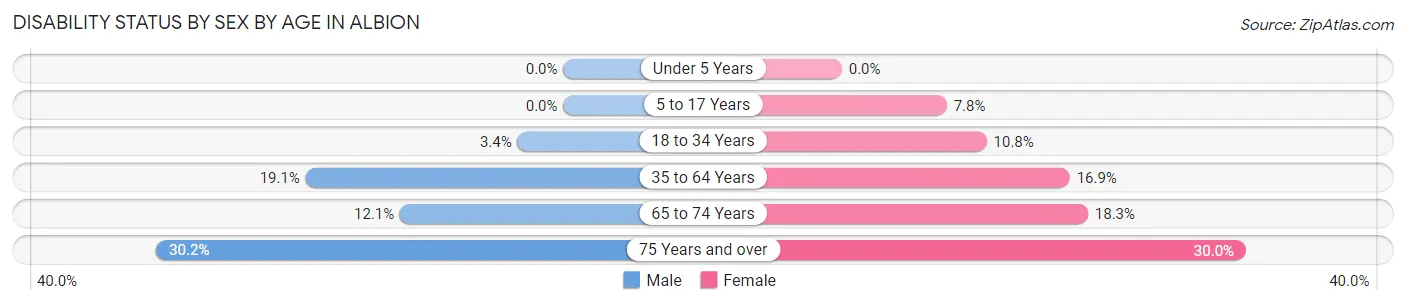
| Age Bracket | Male | Female |
| Under 5 Years | 0 (0.0%) | 0 (0.0%) |
| 5 to 17 Years | 0 (0.0%) | 19 (7.8%) |
| 18 to 34 Years | 7 (3.4%) | 20 (10.7%) |
| 35 to 64 Years | 79 (19.1%) | 68 (16.9%) |
| 65 to 74 Years | 12 (12.1%) | 19 (18.3%) |
| 75 Years and over | 13 (30.2%) | 21 (30.0%) |
Disability Class by Sex by Age in Albion
Disability Class: Hearing Difficulty
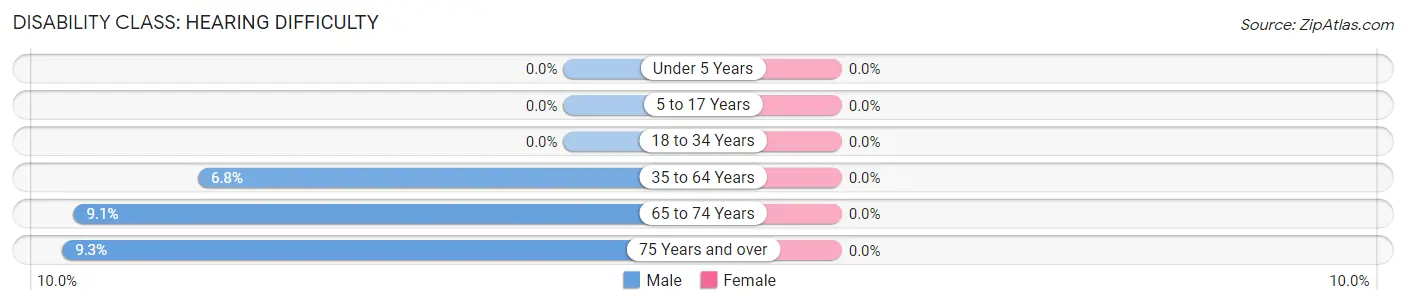
| Age Bracket | Male | Female |
| Under 5 Years | 0 (0.0%) | 0 (0.0%) |
| 5 to 17 Years | 0 (0.0%) | 0 (0.0%) |
| 18 to 34 Years | 0 (0.0%) | 0 (0.0%) |
| 35 to 64 Years | 28 (6.8%) | 0 (0.0%) |
| 65 to 74 Years | 9 (9.1%) | 0 (0.0%) |
| 75 Years and over | 4 (9.3%) | 0 (0.0%) |
Disability Class: Vision Difficulty
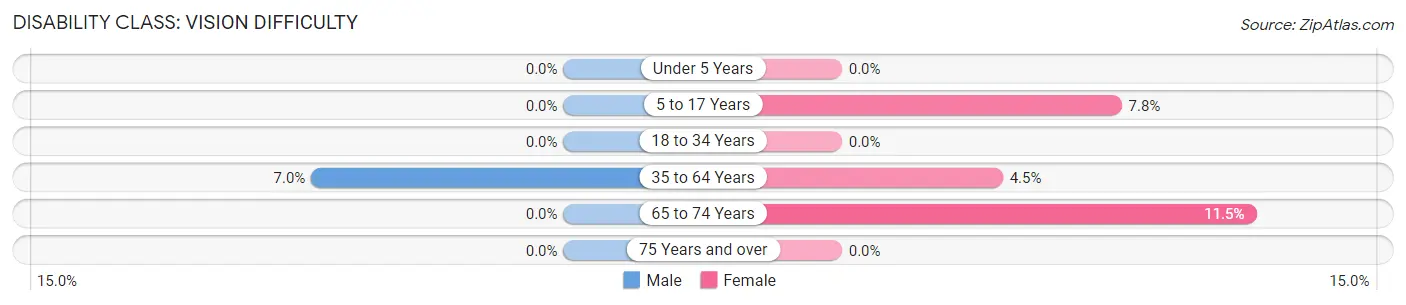
| Age Bracket | Male | Female |
| Under 5 Years | 0 (0.0%) | 0 (0.0%) |
| 5 to 17 Years | 0 (0.0%) | 19 (7.8%) |
| 18 to 34 Years | 0 (0.0%) | 0 (0.0%) |
| 35 to 64 Years | 29 (7.0%) | 18 (4.5%) |
| 65 to 74 Years | 0 (0.0%) | 12 (11.5%) |
| 75 Years and over | 0 (0.0%) | 0 (0.0%) |
Disability Class: Cognitive Difficulty
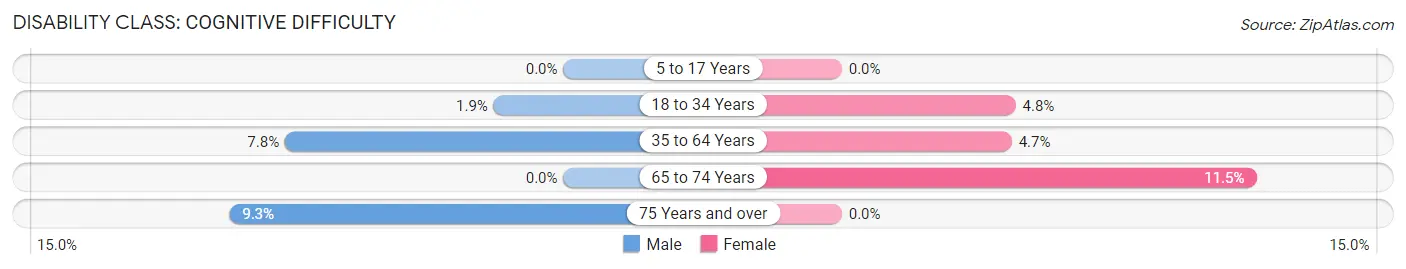
| Age Bracket | Male | Female |
| 5 to 17 Years | 0 (0.0%) | 0 (0.0%) |
| 18 to 34 Years | 4 (1.9%) | 9 (4.8%) |
| 35 to 64 Years | 32 (7.7%) | 19 (4.7%) |
| 65 to 74 Years | 0 (0.0%) | 12 (11.5%) |
| 75 Years and over | 4 (9.3%) | 0 (0.0%) |
Disability Class: Ambulatory Difficulty
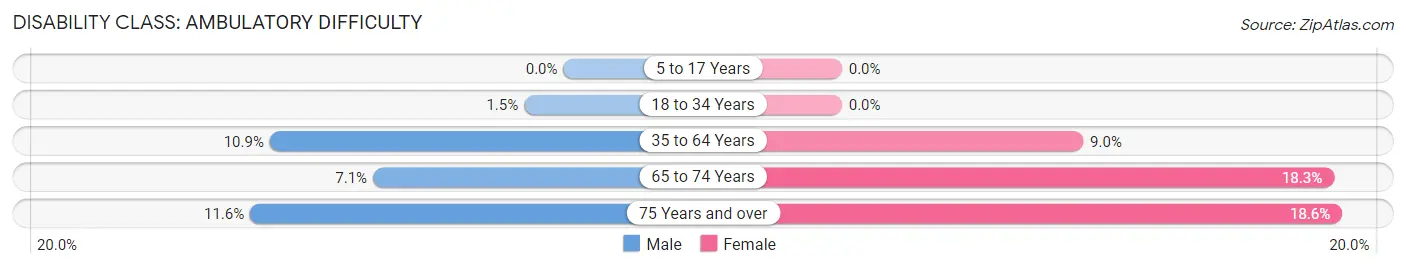
| Age Bracket | Male | Female |
| 5 to 17 Years | 0 (0.0%) | 0 (0.0%) |
| 18 to 34 Years | 3 (1.5%) | 0 (0.0%) |
| 35 to 64 Years | 45 (10.9%) | 36 (9.0%) |
| 65 to 74 Years | 7 (7.1%) | 19 (18.3%) |
| 75 Years and over | 5 (11.6%) | 13 (18.6%) |
Disability Class: Self-Care Difficulty
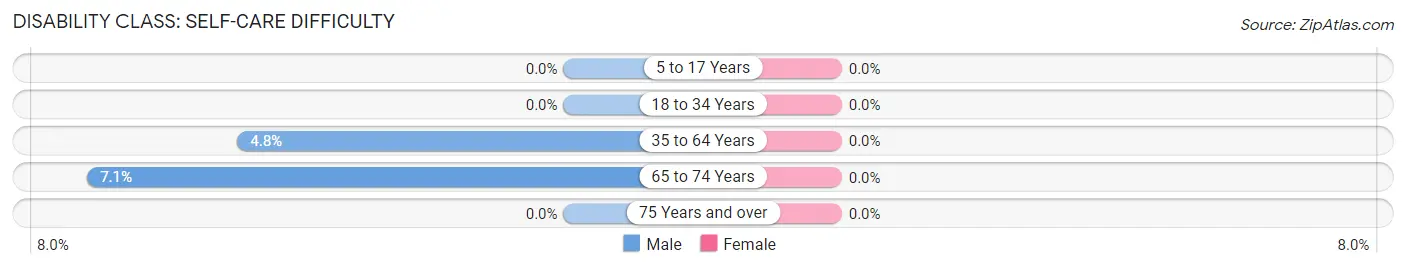
| Age Bracket | Male | Female |
| 5 to 17 Years | 0 (0.0%) | 0 (0.0%) |
| 18 to 34 Years | 0 (0.0%) | 0 (0.0%) |
| 35 to 64 Years | 20 (4.8%) | 0 (0.0%) |
| 65 to 74 Years | 7 (7.1%) | 0 (0.0%) |
| 75 Years and over | 0 (0.0%) | 0 (0.0%) |
Technology Access in Albion
Computing Device Access in Albion
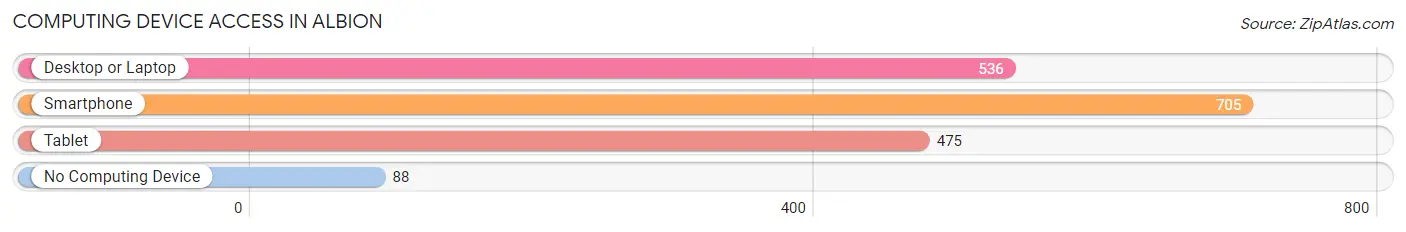
| Device Type | # Households | % Households |
| Desktop or Laptop | 536 | 61.4% |
| Smartphone | 705 | 80.8% |
| Tablet | 475 | 54.4% |
| No Computing Device | 88 | 10.1% |
| Total | 873 | 100.0% |
Internet Access in Albion
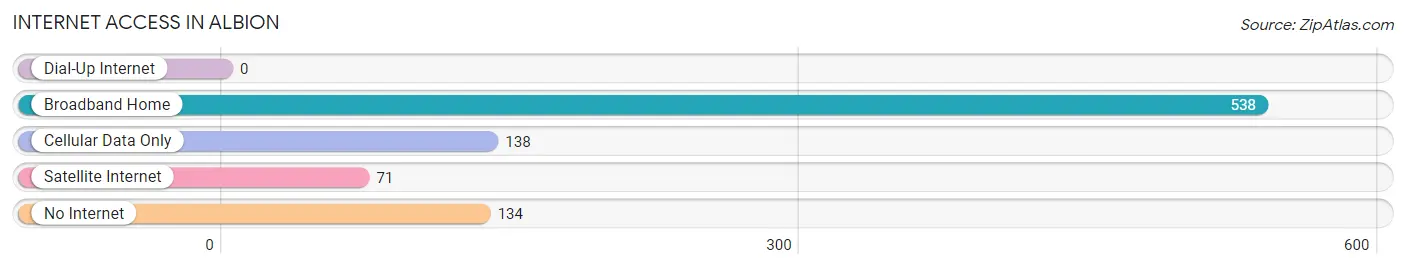
| Internet Type | # Households | % Households |
| Dial-Up Internet | 0 | 0.0% |
| Broadband Home | 538 | 61.6% |
| Cellular Data Only | 138 | 15.8% |
| Satellite Internet | 71 | 8.1% |
| No Internet | 134 | 15.3% |
| Total | 873 | 100.0% |
Albion Summary
Albion, Illinois is a small city located in Edwards County, in the southeastern part of the state. It is situated on the banks of the Wabash River, and is the county seat of Edwards County. The city has a population of approximately 2,500 people, and is part of the Mount Carmel-Albion-Fairfield metropolitan area.
History
Albion was founded in 1819 by a group of settlers from Kentucky, led by William and Mary Ann Smith. The city was named after the ancient city of Albion, which was located in England. The settlers chose the name because of its association with the legendary King Arthur. The city was incorporated in 1837, and was the first city in Edwards County.
In the early years, Albion was a small farming community, and the main industry was agriculture. The city was also home to a number of small businesses, including a sawmill, a gristmill, and a blacksmith shop.
In the late 19th century, the city began to grow and develop. The railroad arrived in 1883, and the city became a major shipping center for the region. The city also became a center for manufacturing, with several factories opening in the area.
Geography
Albion is located in southeastern Illinois, in Edwards County. The city is situated on the banks of the Wabash River, and is surrounded by rolling hills and farmland. The city is located approximately 50 miles south of Champaign, and about 100 miles east of St. Louis.
The climate in Albion is generally mild, with hot summers and cold winters. The average temperature in the summer is around 80 degrees Fahrenheit, and the average temperature in the winter is around 30 degrees Fahrenheit.
Economy
Albion’s economy is largely based on agriculture and manufacturing. The city is home to several large farms, and is a major producer of corn, soybeans, and wheat. The city is also home to several manufacturing companies, including a plastics factory, a metal fabrication plant, and a food processing plant.
The city is also home to several small businesses, including restaurants, retail stores, and service providers. The city is also home to a number of tourist attractions, including the Wabash River Museum and the Edwards County Historical Society.
Demographics
As of the 2010 census, the population of Albion was 2,500. The racial makeup of the city was 97.2% White, 0.8% African American, 0.4% Native American, 0.2% Asian, and 1.4% from other races. The median household income was $37,500, and the median family income was $45,000.
The city is home to a number of churches, including the First Baptist Church, the First United Methodist Church, and the Church of the Nazarene. The city is also home to a number of schools, including Albion Elementary School, Albion Middle School, and Albion High School.
Common Questions
What is Per Capita Income in Albion?
Per Capita income in Albion is $24,866.
What is the Median Family Income in Albion?
Median Family Income in Albion is $65,595.
What is the Median Household income in Albion?
Median Household Income in Albion is $55,848.
What is Income or Wage Gap in Albion?
Income or Wage Gap in Albion is 38.3%.
Women in Albion earn 61.7 cents for every dollar earned by a man.
What is Inequality or Gini Index in Albion?
Inequality or Gini Index in Albion is 0.38.
What is the Total Population of Albion?
Total Population of Albion is 2,136.
What is the Total Male Population of Albion?
Total Male Population of Albion is 1,017.
What is the Total Female Population of Albion?
Total Female Population of Albion is 1,119.
What is the Ratio of Males per 100 Females in Albion?
There are 90.88 Males per 100 Females in Albion.
What is the Ratio of Females per 100 Males in Albion?
There are 110.03 Females per 100 Males in Albion.
What is the Median Population Age in Albion?
Median Population Age in Albion is 38.7 Years.
What is the Average Family Size in Albion
Average Family Size in Albion is 2.9 People.
What is the Average Household Size in Albion
Average Household Size in Albion is 2.4 People.
How Large is the Labor Force in Albion?
There are 1,009 People in the Labor Forcein in Albion.
What is the Percentage of People in the Labor Force in Albion?
60.5% of People are in the Labor Force in Albion.
What is the Unemployment Rate in Albion?
Unemployment Rate in Albion is 11.8%.