Native/Alaskan vs Bermudan No Vehicles in Household
COMPARE
Native/Alaskan
Bermudan
No Vehicles in Household
No Vehicles in Household Comparison
Natives/Alaskans
Bermudans
10.5%
NO VEHICLES IN HOUSEHOLD
43.7/ 100
METRIC RATING
183rd/ 347
METRIC RANK
12.8%
NO VEHICLES IN HOUSEHOLD
0.1/ 100
METRIC RATING
272nd/ 347
METRIC RANK
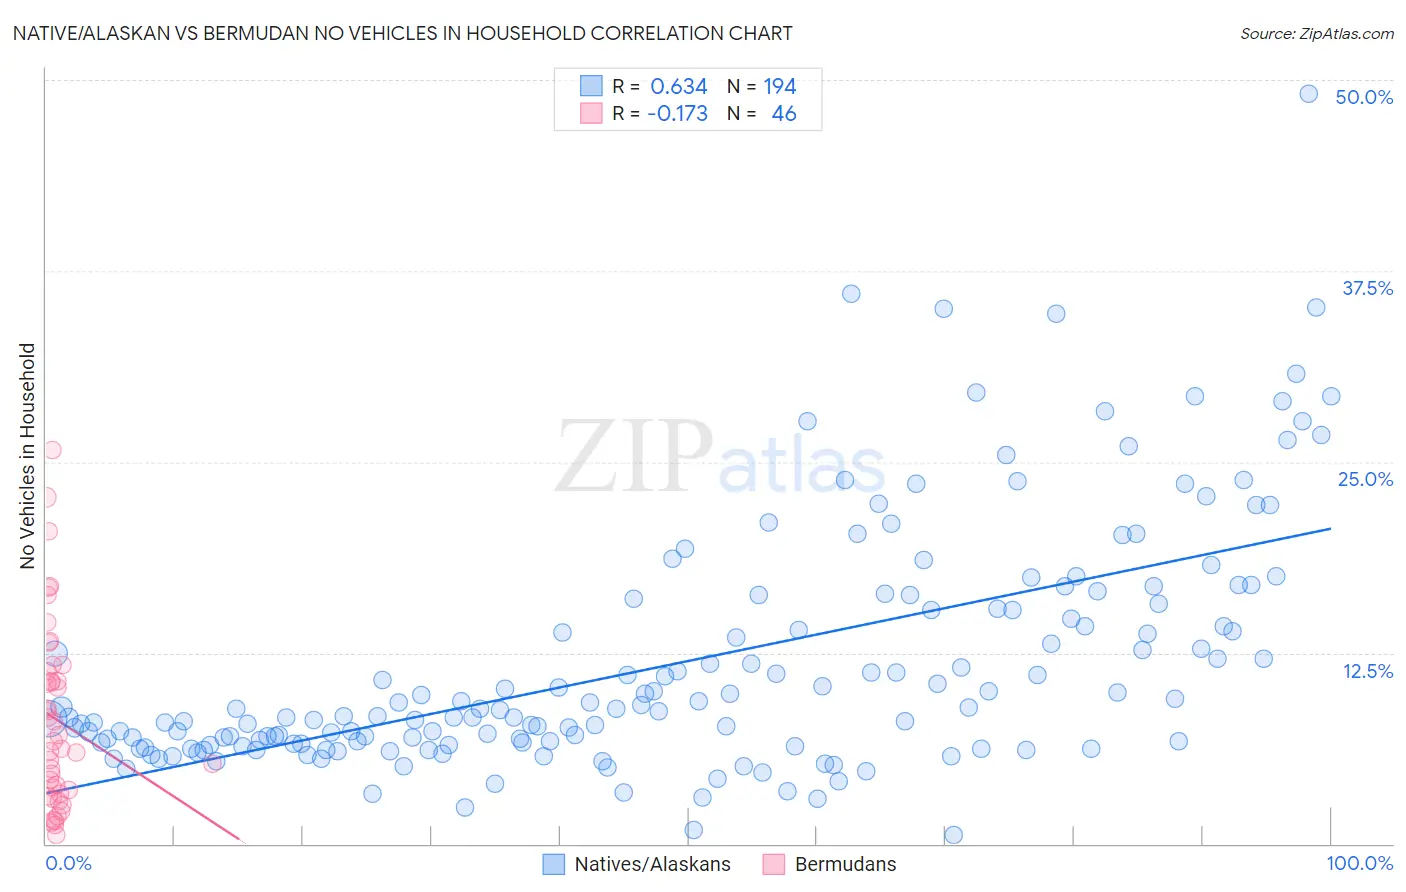
Native/Alaskan vs Bermudan No Vehicles in Household Correlation Chart
The statistical analysis conducted on geographies consisting of 510,438,252 people shows a significant positive correlation between the proportion of Natives/Alaskans and percentage of households with no vehicle available in the United States with a correlation coefficient (R) of 0.634 and weighted average of 10.5%. Similarly, the statistical analysis conducted on geographies consisting of 55,615,567 people shows a poor negative correlation between the proportion of Bermudans and percentage of households with no vehicle available in the United States with a correlation coefficient (R) of -0.173 and weighted average of 12.8%, a difference of 21.8%.
No Vehicles in Household Correlation Summary
| Measurement | Native/Alaskan | Bermudan |
| Minimum | 0.55% | 0.54% |
| Maximum | 49.1% | 25.8% |
| Range | 48.5% | 25.3% |
| Mean | 11.9% | 8.1% |
| Median | 8.8% | 6.5% |
| Interquartile 25% (IQ1) | 6.6% | 3.2% |
| Interquartile 75% (IQ3) | 15.3% | 11.3% |
| Interquartile Range (IQR) | 8.8% | 8.0% |
| Standard Deviation (Sample) | 7.9% | 6.0% |
| Standard Deviation (Population) | 7.9% | 6.0% |
Similar Demographics by No Vehicles in Household
Demographics Similar to Natives/Alaskans by No Vehicles in Household
In terms of no vehicles in household, the demographic groups most similar to Natives/Alaskans are Immigrants from Bulgaria (10.5%, a difference of 0.020%), Immigrants from Colombia (10.5%, a difference of 0.060%), Immigrants from Nepal (10.5%, a difference of 0.17%), Arab (10.5%, a difference of 0.22%), and South American (10.5%, a difference of 0.24%).
| Demographics | Rating | Rank | No Vehicles in Household |
| French American Indians | 49.1 /100 | #176 | Average 10.4% |
| Immigrants | El Salvador | 49.1 /100 | #177 | Average 10.4% |
| Immigrants | Ethiopia | 48.0 /100 | #178 | Average 10.4% |
| Ethiopians | 45.8 /100 | #179 | Average 10.5% |
| Arabs | 45.3 /100 | #180 | Average 10.5% |
| Immigrants | Colombia | 44.1 /100 | #181 | Average 10.5% |
| Immigrants | Bulgaria | 43.8 /100 | #182 | Average 10.5% |
| Natives/Alaskans | 43.7 /100 | #183 | Average 10.5% |
| Immigrants | Nepal | 42.4 /100 | #184 | Average 10.5% |
| South Americans | 41.9 /100 | #185 | Average 10.5% |
| German Russians | 40.6 /100 | #186 | Average 10.5% |
| Immigrants | Poland | 38.4 /100 | #187 | Fair 10.6% |
| Immigrants | Armenia | 37.5 /100 | #188 | Fair 10.6% |
| Immigrants | Eritrea | 36.3 /100 | #189 | Fair 10.6% |
| Immigrants | North Macedonia | 34.6 /100 | #190 | Fair 10.6% |
Demographics Similar to Bermudans by No Vehicles in Household
In terms of no vehicles in household, the demographic groups most similar to Bermudans are Immigrants from France (12.9%, a difference of 1.2%), Immigrants from Singapore (12.9%, a difference of 1.3%), Immigrants from Morocco (12.6%, a difference of 1.3%), Immigrants from Northern Africa (12.6%, a difference of 1.4%), and Immigrants from Albania (13.0%, a difference of 1.5%).
| Demographics | Rating | Rank | No Vehicles in Household |
| Africans | 0.4 /100 | #265 | Tragic 12.3% |
| Israelis | 0.3 /100 | #266 | Tragic 12.4% |
| Immigrants | Europe | 0.3 /100 | #267 | Tragic 12.5% |
| Immigrants | Africa | 0.2 /100 | #268 | Tragic 12.5% |
| Panamanians | 0.2 /100 | #269 | Tragic 12.5% |
| Immigrants | Northern Africa | 0.2 /100 | #270 | Tragic 12.6% |
| Immigrants | Morocco | 0.2 /100 | #271 | Tragic 12.6% |
| Bermudans | 0.1 /100 | #272 | Tragic 12.8% |
| Immigrants | France | 0.1 /100 | #273 | Tragic 12.9% |
| Immigrants | Singapore | 0.1 /100 | #274 | Tragic 12.9% |
| Immigrants | Albania | 0.1 /100 | #275 | Tragic 13.0% |
| Immigrants | Southern Europe | 0.1 /100 | #276 | Tragic 13.0% |
| Aleuts | 0.1 /100 | #277 | Tragic 13.0% |
| Immigrants | Croatia | 0.1 /100 | #278 | Tragic 13.0% |
| Mongolians | 0.0 /100 | #279 | Tragic 13.1% |