Immigrants from Russia vs Bermudan No Vehicles in Household
COMPARE
Immigrants from Russia
Bermudan
No Vehicles in Household
No Vehicles in Household Comparison
Immigrants from Russia
Bermudans
15.1%
NO VEHICLES IN HOUSEHOLD
0.0/ 100
METRIC RATING
304th/ 347
METRIC RANK
12.8%
NO VEHICLES IN HOUSEHOLD
0.1/ 100
METRIC RATING
272nd/ 347
METRIC RANK
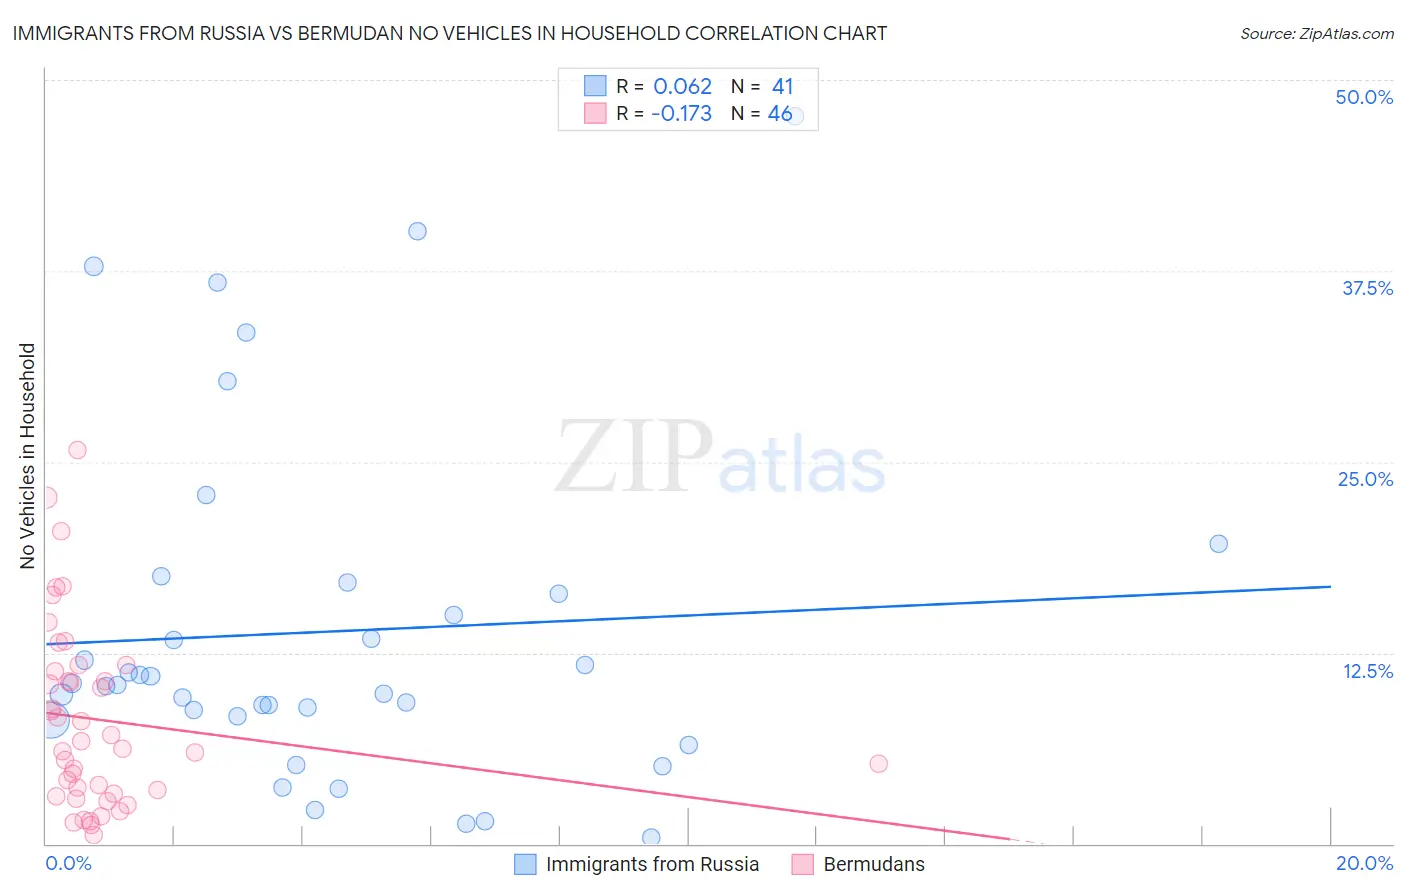
Immigrants from Russia vs Bermudan No Vehicles in Household Correlation Chart
The statistical analysis conducted on geographies consisting of 347,176,226 people shows a slight positive correlation between the proportion of Immigrants from Russia and percentage of households with no vehicle available in the United States with a correlation coefficient (R) of 0.062 and weighted average of 15.1%. Similarly, the statistical analysis conducted on geographies consisting of 55,615,567 people shows a poor negative correlation between the proportion of Bermudans and percentage of households with no vehicle available in the United States with a correlation coefficient (R) of -0.173 and weighted average of 12.8%, a difference of 18.1%.
No Vehicles in Household Correlation Summary
| Measurement | Immigrants from Russia | Bermudan |
| Minimum | 0.41% | 0.54% |
| Maximum | 47.6% | 25.8% |
| Range | 47.2% | 25.3% |
| Mean | 13.9% | 8.1% |
| Median | 10.4% | 6.5% |
| Interquartile 25% (IQ1) | 8.3% | 3.2% |
| Interquartile 75% (IQ3) | 16.7% | 11.3% |
| Interquartile Range (IQR) | 8.5% | 8.0% |
| Standard Deviation (Sample) | 11.3% | 6.0% |
| Standard Deviation (Population) | 11.1% | 6.0% |
Similar Demographics by No Vehicles in Household
Demographics Similar to Immigrants from Russia by No Vehicles in Household
In terms of no vehicles in household, the demographic groups most similar to Immigrants from Russia are Immigrants from China (15.2%, a difference of 0.38%), Immigrants from Western Africa (15.0%, a difference of 0.66%), Haitian (14.9%, a difference of 1.2%), Immigrants from Ukraine (14.9%, a difference of 1.7%), and Yuman (14.9%, a difference of 1.7%).
| Demographics | Rating | Rank | No Vehicles in Household |
| Immigrants | Panama | 0.0 /100 | #297 | Tragic 14.6% |
| Moroccans | 0.0 /100 | #298 | Tragic 14.7% |
| Immigrants | Greece | 0.0 /100 | #299 | Tragic 14.7% |
| Yuman | 0.0 /100 | #300 | Tragic 14.9% |
| Immigrants | Ukraine | 0.0 /100 | #301 | Tragic 14.9% |
| Haitians | 0.0 /100 | #302 | Tragic 14.9% |
| Immigrants | Western Africa | 0.0 /100 | #303 | Tragic 15.0% |
| Immigrants | Russia | 0.0 /100 | #304 | Tragic 15.1% |
| Immigrants | China | 0.0 /100 | #305 | Tragic 15.2% |
| Immigrants | Belize | 0.0 /100 | #306 | Tragic 15.4% |
| Immigrants | Haiti | 0.0 /100 | #307 | Tragic 15.4% |
| U.S. Virgin Islanders | 0.0 /100 | #308 | Tragic 15.4% |
| Puerto Ricans | 0.0 /100 | #309 | Tragic 15.5% |
| Cape Verdeans | 0.0 /100 | #310 | Tragic 15.6% |
| Immigrants | Israel | 0.0 /100 | #311 | Tragic 15.6% |
Demographics Similar to Bermudans by No Vehicles in Household
In terms of no vehicles in household, the demographic groups most similar to Bermudans are Immigrants from France (12.9%, a difference of 1.2%), Immigrants from Singapore (12.9%, a difference of 1.3%), Immigrants from Morocco (12.6%, a difference of 1.3%), Immigrants from Northern Africa (12.6%, a difference of 1.4%), and Immigrants from Albania (13.0%, a difference of 1.5%).
| Demographics | Rating | Rank | No Vehicles in Household |
| Africans | 0.4 /100 | #265 | Tragic 12.3% |
| Israelis | 0.3 /100 | #266 | Tragic 12.4% |
| Immigrants | Europe | 0.3 /100 | #267 | Tragic 12.5% |
| Immigrants | Africa | 0.2 /100 | #268 | Tragic 12.5% |
| Panamanians | 0.2 /100 | #269 | Tragic 12.5% |
| Immigrants | Northern Africa | 0.2 /100 | #270 | Tragic 12.6% |
| Immigrants | Morocco | 0.2 /100 | #271 | Tragic 12.6% |
| Bermudans | 0.1 /100 | #272 | Tragic 12.8% |
| Immigrants | France | 0.1 /100 | #273 | Tragic 12.9% |
| Immigrants | Singapore | 0.1 /100 | #274 | Tragic 12.9% |
| Immigrants | Albania | 0.1 /100 | #275 | Tragic 13.0% |
| Immigrants | Southern Europe | 0.1 /100 | #276 | Tragic 13.0% |
| Aleuts | 0.1 /100 | #277 | Tragic 13.0% |
| Immigrants | Croatia | 0.1 /100 | #278 | Tragic 13.0% |
| Mongolians | 0.0 /100 | #279 | Tragic 13.1% |