Native/Alaskan vs Yugoslavian No Vehicles in Household
COMPARE
Native/Alaskan
Yugoslavian
No Vehicles in Household
No Vehicles in Household Comparison
Natives/Alaskans
Yugoslavians
10.5%
NO VEHICLES IN HOUSEHOLD
43.7/ 100
METRIC RATING
183rd/ 347
METRIC RANK
9.0%
NO VEHICLES IN HOUSEHOLD
98.3/ 100
METRIC RATING
102nd/ 347
METRIC RANK
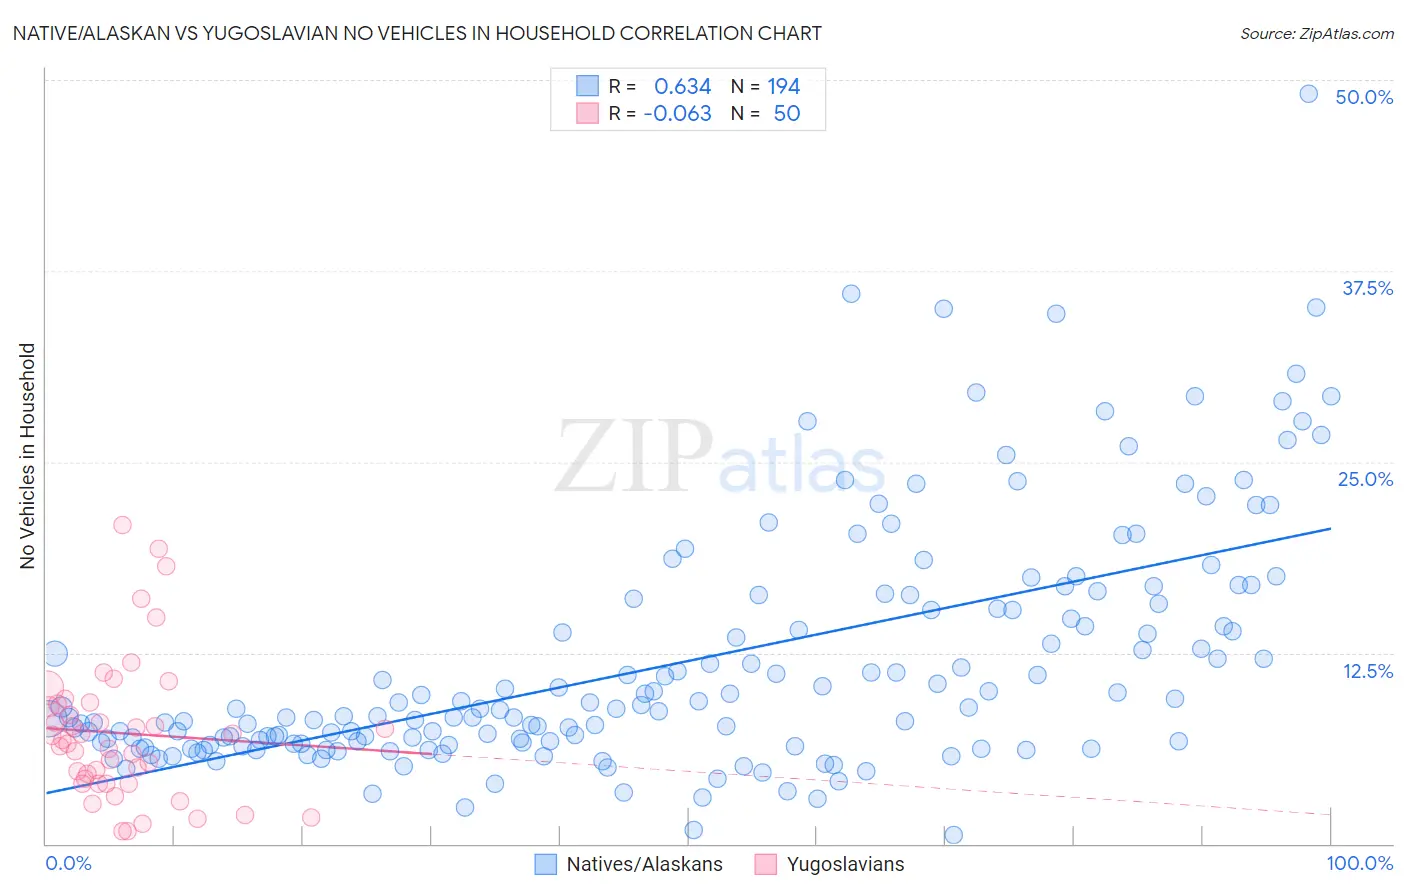
Native/Alaskan vs Yugoslavian No Vehicles in Household Correlation Chart
The statistical analysis conducted on geographies consisting of 510,438,252 people shows a significant positive correlation between the proportion of Natives/Alaskans and percentage of households with no vehicle available in the United States with a correlation coefficient (R) of 0.634 and weighted average of 10.5%. Similarly, the statistical analysis conducted on geographies consisting of 285,290,646 people shows a slight negative correlation between the proportion of Yugoslavians and percentage of households with no vehicle available in the United States with a correlation coefficient (R) of -0.063 and weighted average of 9.0%, a difference of 16.9%.
No Vehicles in Household Correlation Summary
| Measurement | Native/Alaskan | Yugoslavian |
| Minimum | 0.55% | 0.84% |
| Maximum | 49.1% | 20.9% |
| Range | 48.5% | 20.0% |
| Mean | 11.9% | 7.2% |
| Median | 8.8% | 6.7% |
| Interquartile 25% (IQ1) | 6.6% | 3.9% |
| Interquartile 75% (IQ3) | 15.3% | 9.1% |
| Interquartile Range (IQR) | 8.8% | 5.2% |
| Standard Deviation (Sample) | 7.9% | 4.6% |
| Standard Deviation (Population) | 7.9% | 4.5% |
Similar Demographics by No Vehicles in Household
Demographics Similar to Natives/Alaskans by No Vehicles in Household
In terms of no vehicles in household, the demographic groups most similar to Natives/Alaskans are Immigrants from Bulgaria (10.5%, a difference of 0.020%), Immigrants from Colombia (10.5%, a difference of 0.060%), Immigrants from Nepal (10.5%, a difference of 0.17%), Arab (10.5%, a difference of 0.22%), and South American (10.5%, a difference of 0.24%).
| Demographics | Rating | Rank | No Vehicles in Household |
| French American Indians | 49.1 /100 | #176 | Average 10.4% |
| Immigrants | El Salvador | 49.1 /100 | #177 | Average 10.4% |
| Immigrants | Ethiopia | 48.0 /100 | #178 | Average 10.4% |
| Ethiopians | 45.8 /100 | #179 | Average 10.5% |
| Arabs | 45.3 /100 | #180 | Average 10.5% |
| Immigrants | Colombia | 44.1 /100 | #181 | Average 10.5% |
| Immigrants | Bulgaria | 43.8 /100 | #182 | Average 10.5% |
| Natives/Alaskans | 43.7 /100 | #183 | Average 10.5% |
| Immigrants | Nepal | 42.4 /100 | #184 | Average 10.5% |
| South Americans | 41.9 /100 | #185 | Average 10.5% |
| German Russians | 40.6 /100 | #186 | Average 10.5% |
| Immigrants | Poland | 38.4 /100 | #187 | Fair 10.6% |
| Immigrants | Armenia | 37.5 /100 | #188 | Fair 10.6% |
| Immigrants | Eritrea | 36.3 /100 | #189 | Fair 10.6% |
| Immigrants | North Macedonia | 34.6 /100 | #190 | Fair 10.6% |
Demographics Similar to Yugoslavians by No Vehicles in Household
In terms of no vehicles in household, the demographic groups most similar to Yugoslavians are Seminole (9.0%, a difference of 0.0%), Pakistani (9.0%, a difference of 0.050%), Asian (9.0%, a difference of 0.080%), Bulgarian (9.0%, a difference of 0.27%), and Slavic (9.0%, a difference of 0.32%).
| Demographics | Rating | Rank | No Vehicles in Household |
| Potawatomi | 98.8 /100 | #95 | Exceptional 8.8% |
| Immigrants | Bolivia | 98.7 /100 | #96 | Exceptional 8.9% |
| Immigrants | Central America | 98.5 /100 | #97 | Exceptional 8.9% |
| Slavs | 98.4 /100 | #98 | Exceptional 9.0% |
| Bulgarians | 98.4 /100 | #99 | Exceptional 9.0% |
| Asians | 98.3 /100 | #100 | Exceptional 9.0% |
| Pakistanis | 98.3 /100 | #101 | Exceptional 9.0% |
| Yugoslavians | 98.3 /100 | #102 | Exceptional 9.0% |
| Seminole | 98.3 /100 | #103 | Exceptional 9.0% |
| Zimbabweans | 98.0 /100 | #104 | Exceptional 9.0% |
| Spanish Americans | 97.9 /100 | #105 | Exceptional 9.1% |
| Laotians | 97.8 /100 | #106 | Exceptional 9.1% |
| Hispanics or Latinos | 97.7 /100 | #107 | Exceptional 9.1% |
| Mexican American Indians | 97.6 /100 | #108 | Exceptional 9.1% |
| Maltese | 97.6 /100 | #109 | Exceptional 9.1% |