Native/Alaskan vs Crow No Vehicles in Household
COMPARE
Native/Alaskan
Crow
No Vehicles in Household
No Vehicles in Household Comparison
Natives/Alaskans
Crow
10.5%
NO VEHICLES IN HOUSEHOLD
43.7/ 100
METRIC RATING
183rd/ 347
METRIC RANK
11.0%
NO VEHICLES IN HOUSEHOLD
14.2/ 100
METRIC RATING
211th/ 347
METRIC RANK
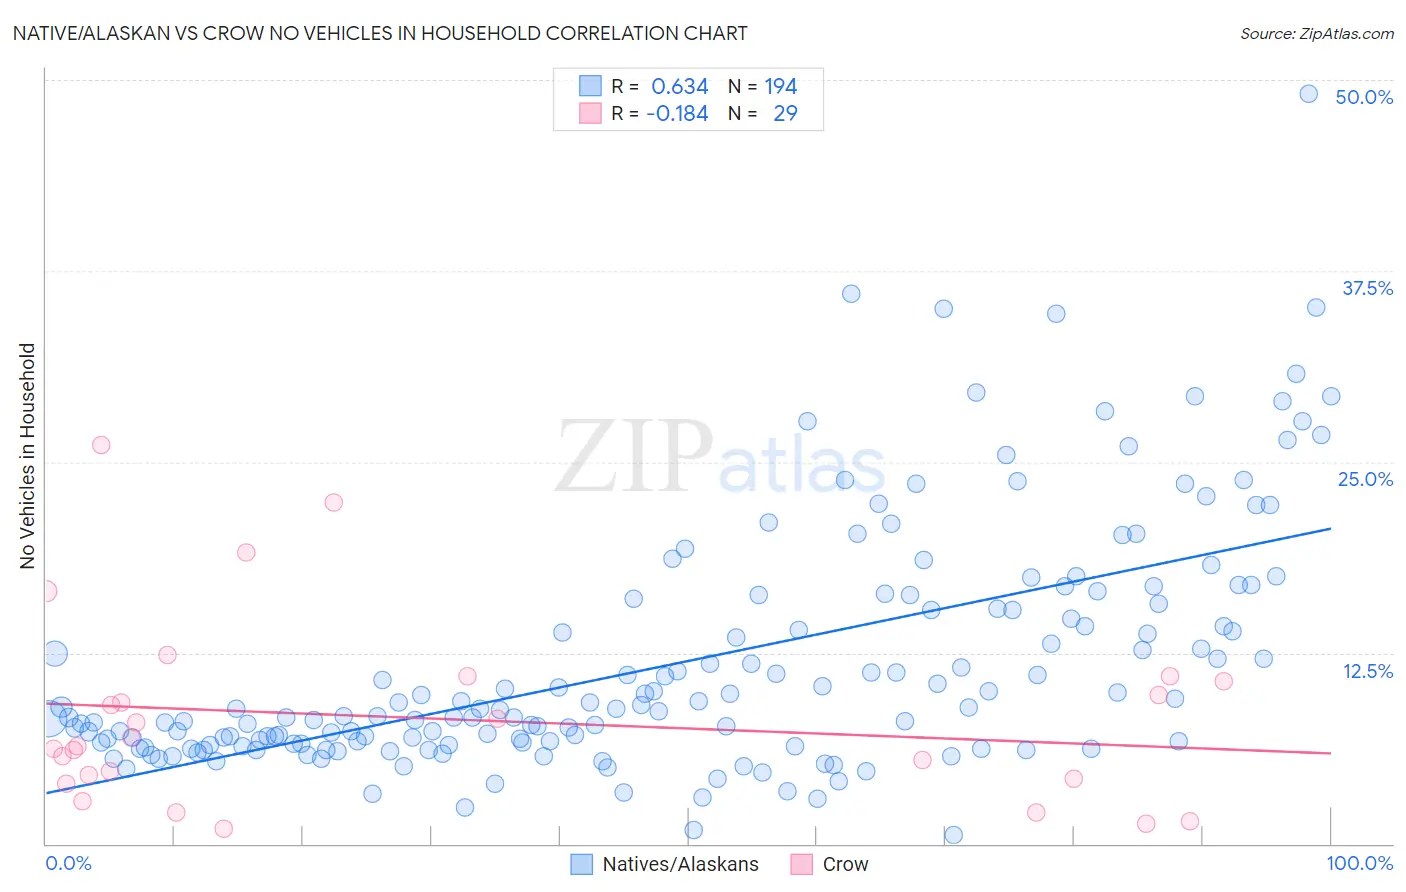
Native/Alaskan vs Crow No Vehicles in Household Correlation Chart
The statistical analysis conducted on geographies consisting of 510,438,252 people shows a significant positive correlation between the proportion of Natives/Alaskans and percentage of households with no vehicle available in the United States with a correlation coefficient (R) of 0.634 and weighted average of 10.5%. Similarly, the statistical analysis conducted on geographies consisting of 59,160,516 people shows a poor negative correlation between the proportion of Crow and percentage of households with no vehicle available in the United States with a correlation coefficient (R) of -0.184 and weighted average of 11.0%, a difference of 5.2%.
No Vehicles in Household Correlation Summary
| Measurement | Native/Alaskan | Crow |
| Minimum | 0.55% | 1.0% |
| Maximum | 49.1% | 26.1% |
| Range | 48.5% | 25.1% |
| Mean | 11.9% | 8.2% |
| Median | 8.8% | 6.4% |
| Interquartile 25% (IQ1) | 6.6% | 4.1% |
| Interquartile 75% (IQ3) | 15.3% | 10.8% |
| Interquartile Range (IQR) | 8.8% | 6.7% |
| Standard Deviation (Sample) | 7.9% | 6.2% |
| Standard Deviation (Population) | 7.9% | 6.1% |
Similar Demographics by No Vehicles in Household
Demographics Similar to Natives/Alaskans by No Vehicles in Household
In terms of no vehicles in household, the demographic groups most similar to Natives/Alaskans are Immigrants from Bulgaria (10.5%, a difference of 0.020%), Immigrants from Colombia (10.5%, a difference of 0.060%), Immigrants from Nepal (10.5%, a difference of 0.17%), Arab (10.5%, a difference of 0.22%), and South American (10.5%, a difference of 0.24%).
| Demographics | Rating | Rank | No Vehicles in Household |
| French American Indians | 49.1 /100 | #176 | Average 10.4% |
| Immigrants | El Salvador | 49.1 /100 | #177 | Average 10.4% |
| Immigrants | Ethiopia | 48.0 /100 | #178 | Average 10.4% |
| Ethiopians | 45.8 /100 | #179 | Average 10.5% |
| Arabs | 45.3 /100 | #180 | Average 10.5% |
| Immigrants | Colombia | 44.1 /100 | #181 | Average 10.5% |
| Immigrants | Bulgaria | 43.8 /100 | #182 | Average 10.5% |
| Natives/Alaskans | 43.7 /100 | #183 | Average 10.5% |
| Immigrants | Nepal | 42.4 /100 | #184 | Average 10.5% |
| South Americans | 41.9 /100 | #185 | Average 10.5% |
| German Russians | 40.6 /100 | #186 | Average 10.5% |
| Immigrants | Poland | 38.4 /100 | #187 | Fair 10.6% |
| Immigrants | Armenia | 37.5 /100 | #188 | Fair 10.6% |
| Immigrants | Eritrea | 36.3 /100 | #189 | Fair 10.6% |
| Immigrants | North Macedonia | 34.6 /100 | #190 | Fair 10.6% |
Demographics Similar to Crow by No Vehicles in Household
In terms of no vehicles in household, the demographic groups most similar to Crow are Immigrants from Western Asia (11.0%, a difference of 0.090%), Apache (11.0%, a difference of 0.16%), Pennsylvania German (11.0%, a difference of 0.33%), Immigrants from Italy (11.0%, a difference of 0.36%), and Sierra Leonean (11.0%, a difference of 0.37%).
| Demographics | Rating | Rank | No Vehicles in Household |
| Guatemalans | 16.1 /100 | #204 | Poor 11.0% |
| Immigrants | Chile | 15.9 /100 | #205 | Poor 11.0% |
| Somalis | 15.9 /100 | #206 | Poor 11.0% |
| Sierra Leoneans | 15.7 /100 | #207 | Poor 11.0% |
| Immigrants | Italy | 15.6 /100 | #208 | Poor 11.0% |
| Pennsylvania Germans | 15.5 /100 | #209 | Poor 11.0% |
| Apache | 14.8 /100 | #210 | Poor 11.0% |
| Crow | 14.2 /100 | #211 | Poor 11.0% |
| Immigrants | Western Asia | 13.9 /100 | #212 | Poor 11.0% |
| Immigrants | Hungary | 12.3 /100 | #213 | Poor 11.1% |
| Immigrants | Denmark | 12.1 /100 | #214 | Poor 11.1% |
| Immigrants | Sri Lanka | 10.6 /100 | #215 | Poor 11.2% |
| Immigrants | Argentina | 10.6 /100 | #216 | Poor 11.2% |
| Dutch West Indians | 10.2 /100 | #217 | Poor 11.2% |
| Immigrants | Guatemala | 10.0 /100 | #218 | Tragic 11.2% |