Native/Alaskan vs Chippewa No Vehicles in Household
COMPARE
Native/Alaskan
Chippewa
No Vehicles in Household
No Vehicles in Household Comparison
Natives/Alaskans
Chippewa
10.5%
NO VEHICLES IN HOUSEHOLD
43.7/ 100
METRIC RATING
183rd/ 347
METRIC RANK
9.4%
NO VEHICLES IN HOUSEHOLD
93.8/ 100
METRIC RATING
117th/ 347
METRIC RANK
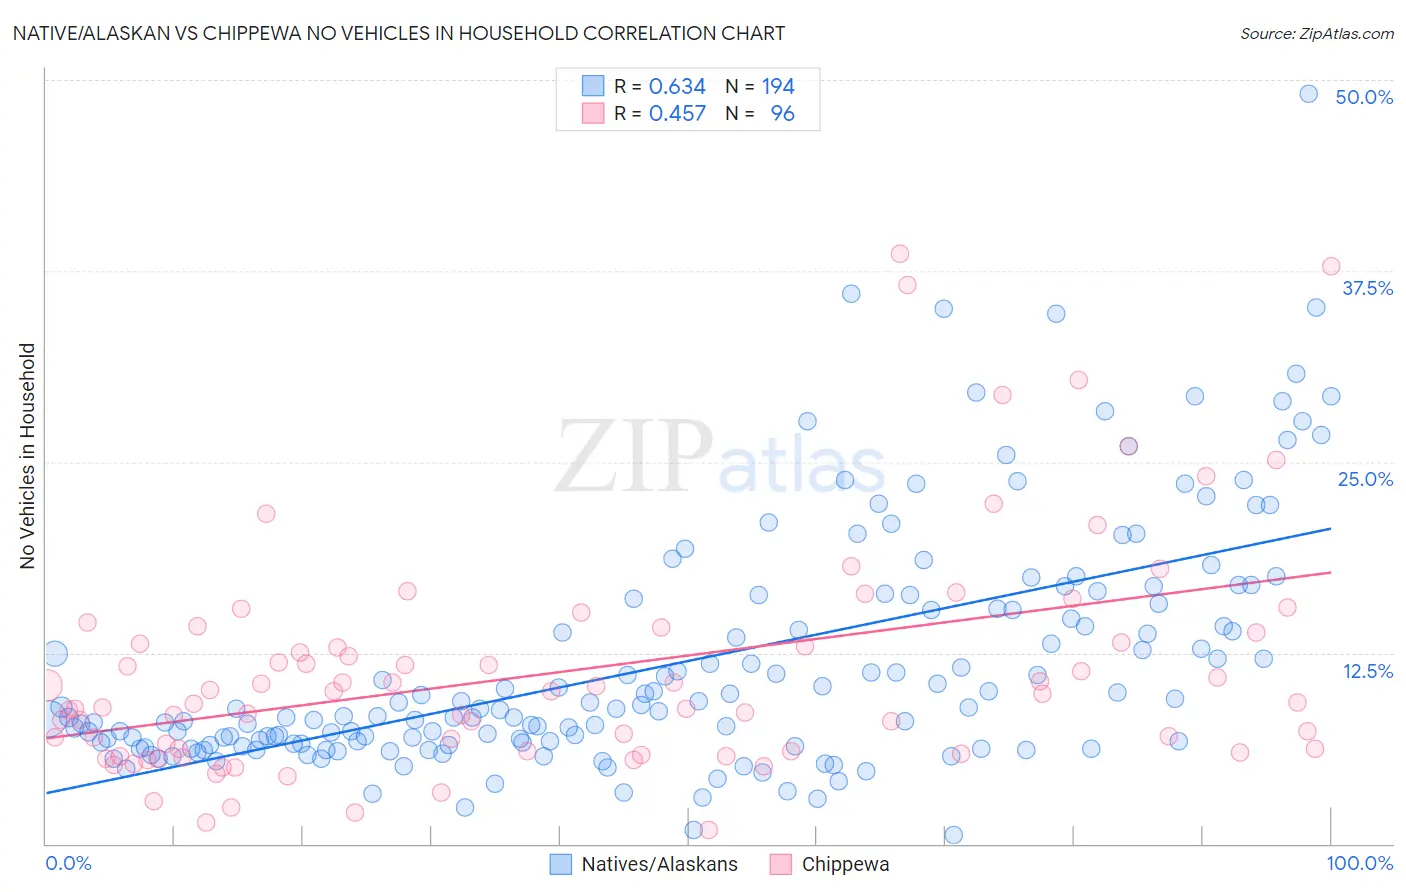
Native/Alaskan vs Chippewa No Vehicles in Household Correlation Chart
The statistical analysis conducted on geographies consisting of 510,438,252 people shows a significant positive correlation between the proportion of Natives/Alaskans and percentage of households with no vehicle available in the United States with a correlation coefficient (R) of 0.634 and weighted average of 10.5%. Similarly, the statistical analysis conducted on geographies consisting of 214,718,200 people shows a moderate positive correlation between the proportion of Chippewa and percentage of households with no vehicle available in the United States with a correlation coefficient (R) of 0.457 and weighted average of 9.4%, a difference of 11.1%.
No Vehicles in Household Correlation Summary
| Measurement | Native/Alaskan | Chippewa |
| Minimum | 0.55% | 0.88% |
| Maximum | 49.1% | 38.6% |
| Range | 48.5% | 37.7% |
| Mean | 11.9% | 11.3% |
| Median | 8.8% | 9.5% |
| Interquartile 25% (IQ1) | 6.6% | 6.0% |
| Interquartile 75% (IQ3) | 15.3% | 13.5% |
| Interquartile Range (IQR) | 8.8% | 7.5% |
| Standard Deviation (Sample) | 7.9% | 7.6% |
| Standard Deviation (Population) | 7.9% | 7.5% |
Similar Demographics by No Vehicles in Household
Demographics Similar to Natives/Alaskans by No Vehicles in Household
In terms of no vehicles in household, the demographic groups most similar to Natives/Alaskans are Immigrants from Bulgaria (10.5%, a difference of 0.020%), Immigrants from Colombia (10.5%, a difference of 0.060%), Immigrants from Nepal (10.5%, a difference of 0.17%), Arab (10.5%, a difference of 0.22%), and South American (10.5%, a difference of 0.24%).
| Demographics | Rating | Rank | No Vehicles in Household |
| French American Indians | 49.1 /100 | #176 | Average 10.4% |
| Immigrants | El Salvador | 49.1 /100 | #177 | Average 10.4% |
| Immigrants | Ethiopia | 48.0 /100 | #178 | Average 10.4% |
| Ethiopians | 45.8 /100 | #179 | Average 10.5% |
| Arabs | 45.3 /100 | #180 | Average 10.5% |
| Immigrants | Colombia | 44.1 /100 | #181 | Average 10.5% |
| Immigrants | Bulgaria | 43.8 /100 | #182 | Average 10.5% |
| Natives/Alaskans | 43.7 /100 | #183 | Average 10.5% |
| Immigrants | Nepal | 42.4 /100 | #184 | Average 10.5% |
| South Americans | 41.9 /100 | #185 | Average 10.5% |
| German Russians | 40.6 /100 | #186 | Average 10.5% |
| Immigrants | Poland | 38.4 /100 | #187 | Fair 10.6% |
| Immigrants | Armenia | 37.5 /100 | #188 | Fair 10.6% |
| Immigrants | Eritrea | 36.3 /100 | #189 | Fair 10.6% |
| Immigrants | North Macedonia | 34.6 /100 | #190 | Fair 10.6% |
Demographics Similar to Chippewa by No Vehicles in Household
In terms of no vehicles in household, the demographic groups most similar to Chippewa are Japanese (9.4%, a difference of 0.17%), Navajo (9.4%, a difference of 0.24%), Serbian (9.4%, a difference of 0.30%), Greek (9.5%, a difference of 0.55%), and Fijian (9.5%, a difference of 0.66%).
| Demographics | Rating | Rank | No Vehicles in Household |
| Delaware | 97.2 /100 | #110 | Exceptional 9.2% |
| Immigrants | Kuwait | 95.1 /100 | #111 | Exceptional 9.4% |
| Armenians | 95.0 /100 | #112 | Exceptional 9.4% |
| Immigrants | Netherlands | 94.8 /100 | #113 | Exceptional 9.4% |
| Serbians | 94.3 /100 | #114 | Exceptional 9.4% |
| Navajo | 94.2 /100 | #115 | Exceptional 9.4% |
| Japanese | 94.1 /100 | #116 | Exceptional 9.4% |
| Chippewa | 93.8 /100 | #117 | Exceptional 9.4% |
| Greeks | 92.9 /100 | #118 | Exceptional 9.5% |
| Fijians | 92.7 /100 | #119 | Exceptional 9.5% |
| Immigrants | Thailand | 92.6 /100 | #120 | Exceptional 9.5% |
| Puget Sound Salish | 92.4 /100 | #121 | Exceptional 9.5% |
| Costa Ricans | 92.3 /100 | #122 | Exceptional 9.5% |
| Blackfeet | 91.4 /100 | #123 | Exceptional 9.6% |
| Immigrants | Korea | 90.9 /100 | #124 | Exceptional 9.6% |