Laotian vs Bermudan No Vehicles in Household
COMPARE
Laotian
Bermudan
No Vehicles in Household
No Vehicles in Household Comparison
Laotians
Bermudans
9.1%
NO VEHICLES IN HOUSEHOLD
97.8/ 100
METRIC RATING
106th/ 347
METRIC RANK
12.8%
NO VEHICLES IN HOUSEHOLD
0.1/ 100
METRIC RATING
272nd/ 347
METRIC RANK
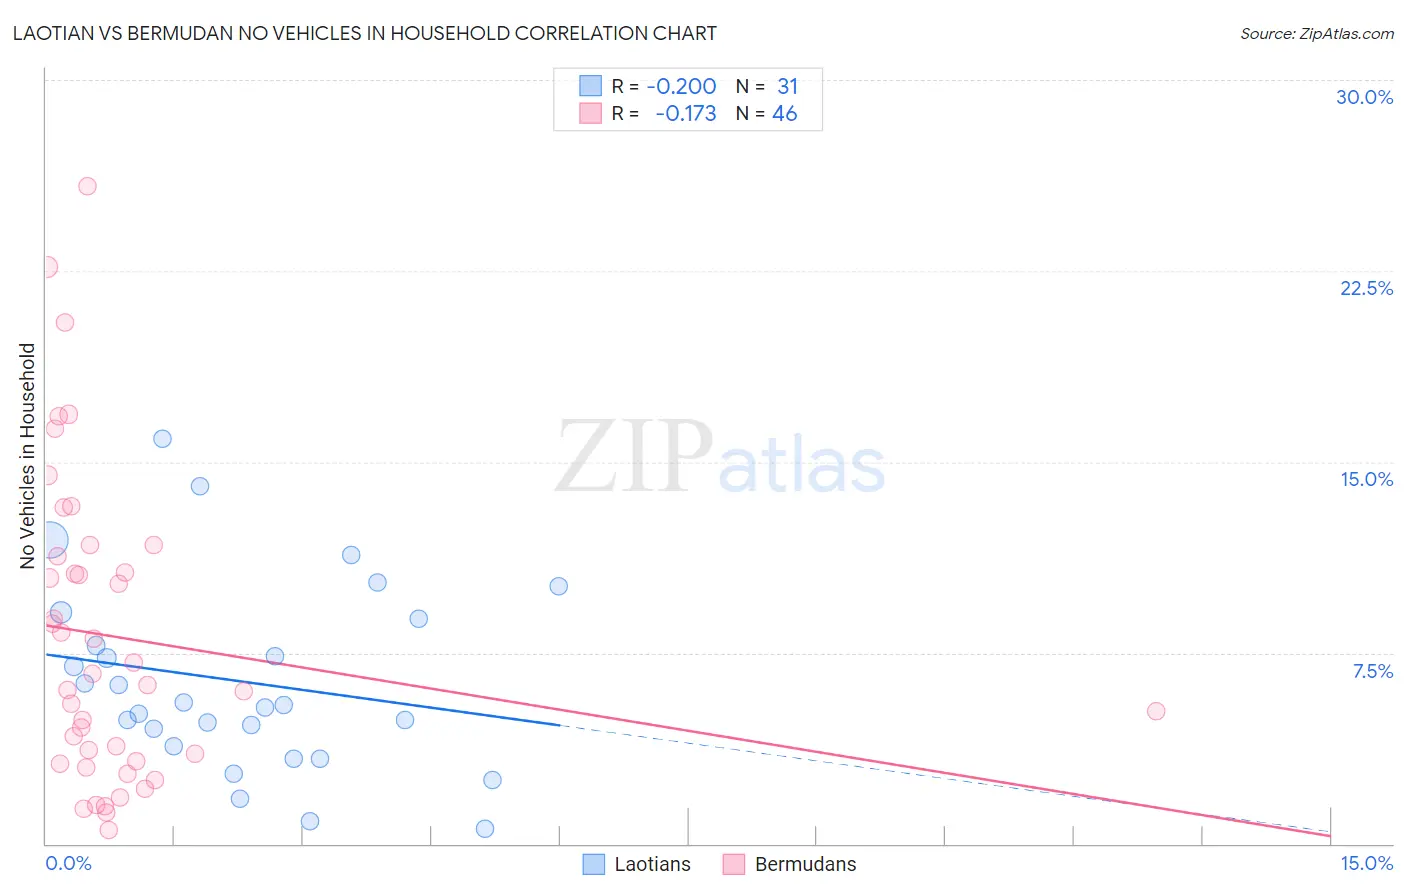
Laotian vs Bermudan No Vehicles in Household Correlation Chart
The statistical analysis conducted on geographies consisting of 224,346,725 people shows a poor negative correlation between the proportion of Laotians and percentage of households with no vehicle available in the United States with a correlation coefficient (R) of -0.200 and weighted average of 9.1%. Similarly, the statistical analysis conducted on geographies consisting of 55,615,567 people shows a poor negative correlation between the proportion of Bermudans and percentage of households with no vehicle available in the United States with a correlation coefficient (R) of -0.173 and weighted average of 12.8%, a difference of 41.1%.
No Vehicles in Household Correlation Summary
| Measurement | Laotian | Bermudan |
| Minimum | 0.59% | 0.54% |
| Maximum | 15.9% | 25.8% |
| Range | 15.3% | 25.3% |
| Mean | 6.4% | 8.1% |
| Median | 5.4% | 6.5% |
| Interquartile 25% (IQ1) | 3.8% | 3.2% |
| Interquartile 75% (IQ3) | 8.9% | 11.3% |
| Interquartile Range (IQR) | 5.0% | 8.0% |
| Standard Deviation (Sample) | 3.7% | 6.0% |
| Standard Deviation (Population) | 3.6% | 6.0% |
Similar Demographics by No Vehicles in Household
Demographics Similar to Laotians by No Vehicles in Household
In terms of no vehicles in household, the demographic groups most similar to Laotians are Spanish American (9.1%, a difference of 0.090%), Zimbabwean (9.0%, a difference of 0.25%), Hispanic or Latino (9.1%, a difference of 0.26%), Mexican American Indian (9.1%, a difference of 0.35%), and Maltese (9.1%, a difference of 0.48%).
| Demographics | Rating | Rank | No Vehicles in Household |
| Bulgarians | 98.4 /100 | #99 | Exceptional 9.0% |
| Asians | 98.3 /100 | #100 | Exceptional 9.0% |
| Pakistanis | 98.3 /100 | #101 | Exceptional 9.0% |
| Yugoslavians | 98.3 /100 | #102 | Exceptional 9.0% |
| Seminole | 98.3 /100 | #103 | Exceptional 9.0% |
| Zimbabweans | 98.0 /100 | #104 | Exceptional 9.0% |
| Spanish Americans | 97.9 /100 | #105 | Exceptional 9.1% |
| Laotians | 97.8 /100 | #106 | Exceptional 9.1% |
| Hispanics or Latinos | 97.7 /100 | #107 | Exceptional 9.1% |
| Mexican American Indians | 97.6 /100 | #108 | Exceptional 9.1% |
| Maltese | 97.6 /100 | #109 | Exceptional 9.1% |
| Delaware | 97.2 /100 | #110 | Exceptional 9.2% |
| Immigrants | Kuwait | 95.1 /100 | #111 | Exceptional 9.4% |
| Armenians | 95.0 /100 | #112 | Exceptional 9.4% |
| Immigrants | Netherlands | 94.8 /100 | #113 | Exceptional 9.4% |
Demographics Similar to Bermudans by No Vehicles in Household
In terms of no vehicles in household, the demographic groups most similar to Bermudans are Immigrants from France (12.9%, a difference of 1.2%), Immigrants from Singapore (12.9%, a difference of 1.3%), Immigrants from Morocco (12.6%, a difference of 1.3%), Immigrants from Northern Africa (12.6%, a difference of 1.4%), and Immigrants from Albania (13.0%, a difference of 1.5%).
| Demographics | Rating | Rank | No Vehicles in Household |
| Africans | 0.4 /100 | #265 | Tragic 12.3% |
| Israelis | 0.3 /100 | #266 | Tragic 12.4% |
| Immigrants | Europe | 0.3 /100 | #267 | Tragic 12.5% |
| Immigrants | Africa | 0.2 /100 | #268 | Tragic 12.5% |
| Panamanians | 0.2 /100 | #269 | Tragic 12.5% |
| Immigrants | Northern Africa | 0.2 /100 | #270 | Tragic 12.6% |
| Immigrants | Morocco | 0.2 /100 | #271 | Tragic 12.6% |
| Bermudans | 0.1 /100 | #272 | Tragic 12.8% |
| Immigrants | France | 0.1 /100 | #273 | Tragic 12.9% |
| Immigrants | Singapore | 0.1 /100 | #274 | Tragic 12.9% |
| Immigrants | Albania | 0.1 /100 | #275 | Tragic 13.0% |
| Immigrants | Southern Europe | 0.1 /100 | #276 | Tragic 13.0% |
| Aleuts | 0.1 /100 | #277 | Tragic 13.0% |
| Immigrants | Croatia | 0.1 /100 | #278 | Tragic 13.0% |
| Mongolians | 0.0 /100 | #279 | Tragic 13.1% |