Mongolian vs Bermudan No Vehicles in Household
COMPARE
Mongolian
Bermudan
No Vehicles in Household
No Vehicles in Household Comparison
Mongolians
Bermudans
13.1%
NO VEHICLES IN HOUSEHOLD
0.0/ 100
METRIC RATING
279th/ 347
METRIC RANK
12.8%
NO VEHICLES IN HOUSEHOLD
0.1/ 100
METRIC RATING
272nd/ 347
METRIC RANK
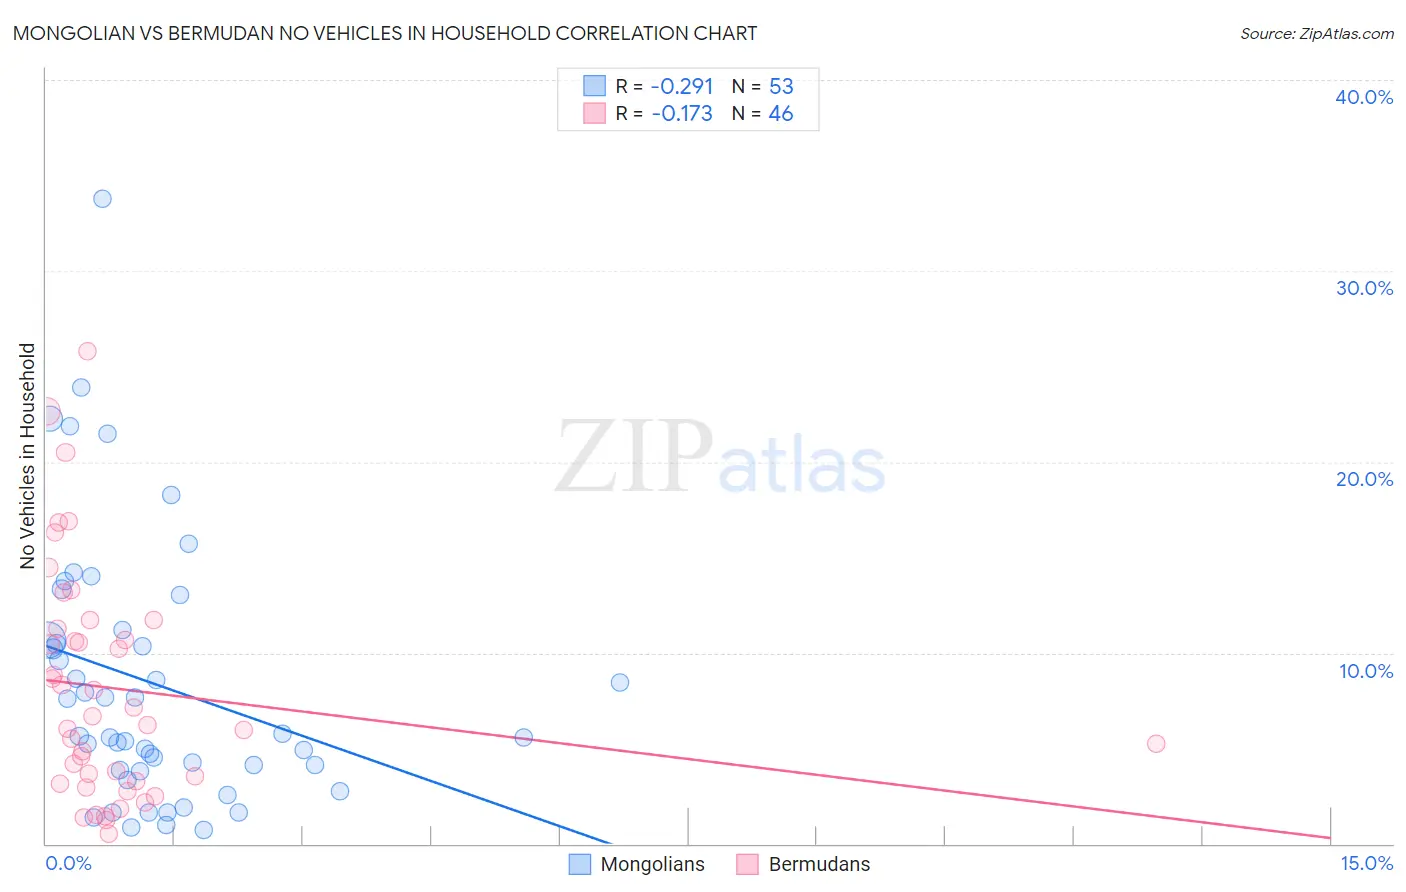
Mongolian vs Bermudan No Vehicles in Household Correlation Chart
The statistical analysis conducted on geographies consisting of 140,111,412 people shows a weak negative correlation between the proportion of Mongolians and percentage of households with no vehicle available in the United States with a correlation coefficient (R) of -0.291 and weighted average of 13.1%. Similarly, the statistical analysis conducted on geographies consisting of 55,615,567 people shows a poor negative correlation between the proportion of Bermudans and percentage of households with no vehicle available in the United States with a correlation coefficient (R) of -0.173 and weighted average of 12.8%, a difference of 2.6%.
No Vehicles in Household Correlation Summary
| Measurement | Mongolian | Bermudan |
| Minimum | 0.73% | 0.54% |
| Maximum | 33.8% | 25.8% |
| Range | 33.1% | 25.3% |
| Mean | 8.4% | 8.1% |
| Median | 5.6% | 6.5% |
| Interquartile 25% (IQ1) | 3.8% | 3.2% |
| Interquartile 75% (IQ3) | 11.0% | 11.3% |
| Interquartile Range (IQR) | 7.1% | 8.0% |
| Standard Deviation (Sample) | 6.9% | 6.0% |
| Standard Deviation (Population) | 6.9% | 6.0% |
Demographics Similar to Mongolians and Bermudans by No Vehicles in Household
In terms of no vehicles in household, the demographic groups most similar to Mongolians are Alsatian (13.2%, a difference of 0.27%), Immigrants from Croatia (13.0%, a difference of 0.69%), Aleut (13.0%, a difference of 0.73%), Immigrants from Southern Europe (13.0%, a difference of 0.81%), and Immigrants from Albania (13.0%, a difference of 1.2%). Similarly, the demographic groups most similar to Bermudans are Immigrants from France (12.9%, a difference of 1.2%), Immigrants from Singapore (12.9%, a difference of 1.3%), Immigrants from Morocco (12.6%, a difference of 1.3%), Immigrants from Northern Africa (12.6%, a difference of 1.4%), and Immigrants from Albania (13.0%, a difference of 1.5%).
| Demographics | Rating | Rank | No Vehicles in Household |
| Africans | 0.4 /100 | #265 | Tragic 12.3% |
| Israelis | 0.3 /100 | #266 | Tragic 12.4% |
| Immigrants | Europe | 0.3 /100 | #267 | Tragic 12.5% |
| Immigrants | Africa | 0.2 /100 | #268 | Tragic 12.5% |
| Panamanians | 0.2 /100 | #269 | Tragic 12.5% |
| Immigrants | Northern Africa | 0.2 /100 | #270 | Tragic 12.6% |
| Immigrants | Morocco | 0.2 /100 | #271 | Tragic 12.6% |
| Bermudans | 0.1 /100 | #272 | Tragic 12.8% |
| Immigrants | France | 0.1 /100 | #273 | Tragic 12.9% |
| Immigrants | Singapore | 0.1 /100 | #274 | Tragic 12.9% |
| Immigrants | Albania | 0.1 /100 | #275 | Tragic 13.0% |
| Immigrants | Southern Europe | 0.1 /100 | #276 | Tragic 13.0% |
| Aleuts | 0.1 /100 | #277 | Tragic 13.0% |
| Immigrants | Croatia | 0.1 /100 | #278 | Tragic 13.0% |
| Mongolians | 0.0 /100 | #279 | Tragic 13.1% |
| Alsatians | 0.0 /100 | #280 | Tragic 13.2% |
| Central American Indians | 0.0 /100 | #281 | Tragic 13.3% |
| Immigrants | Eastern Asia | 0.0 /100 | #282 | Tragic 13.5% |
| Immigrants | Kazakhstan | 0.0 /100 | #283 | Tragic 13.6% |
| Immigrants | Malaysia | 0.0 /100 | #284 | Tragic 13.6% |
| Immigrants | Eastern Europe | 0.0 /100 | #285 | Tragic 13.6% |