Cheyenne vs Bermudan No Vehicles in Household
COMPARE
Cheyenne
Bermudan
No Vehicles in Household
No Vehicles in Household Comparison
Cheyenne
Bermudans
11.7%
NO VEHICLES IN HOUSEHOLD
2.4/ 100
METRIC RATING
243rd/ 347
METRIC RANK
12.8%
NO VEHICLES IN HOUSEHOLD
0.1/ 100
METRIC RATING
272nd/ 347
METRIC RANK
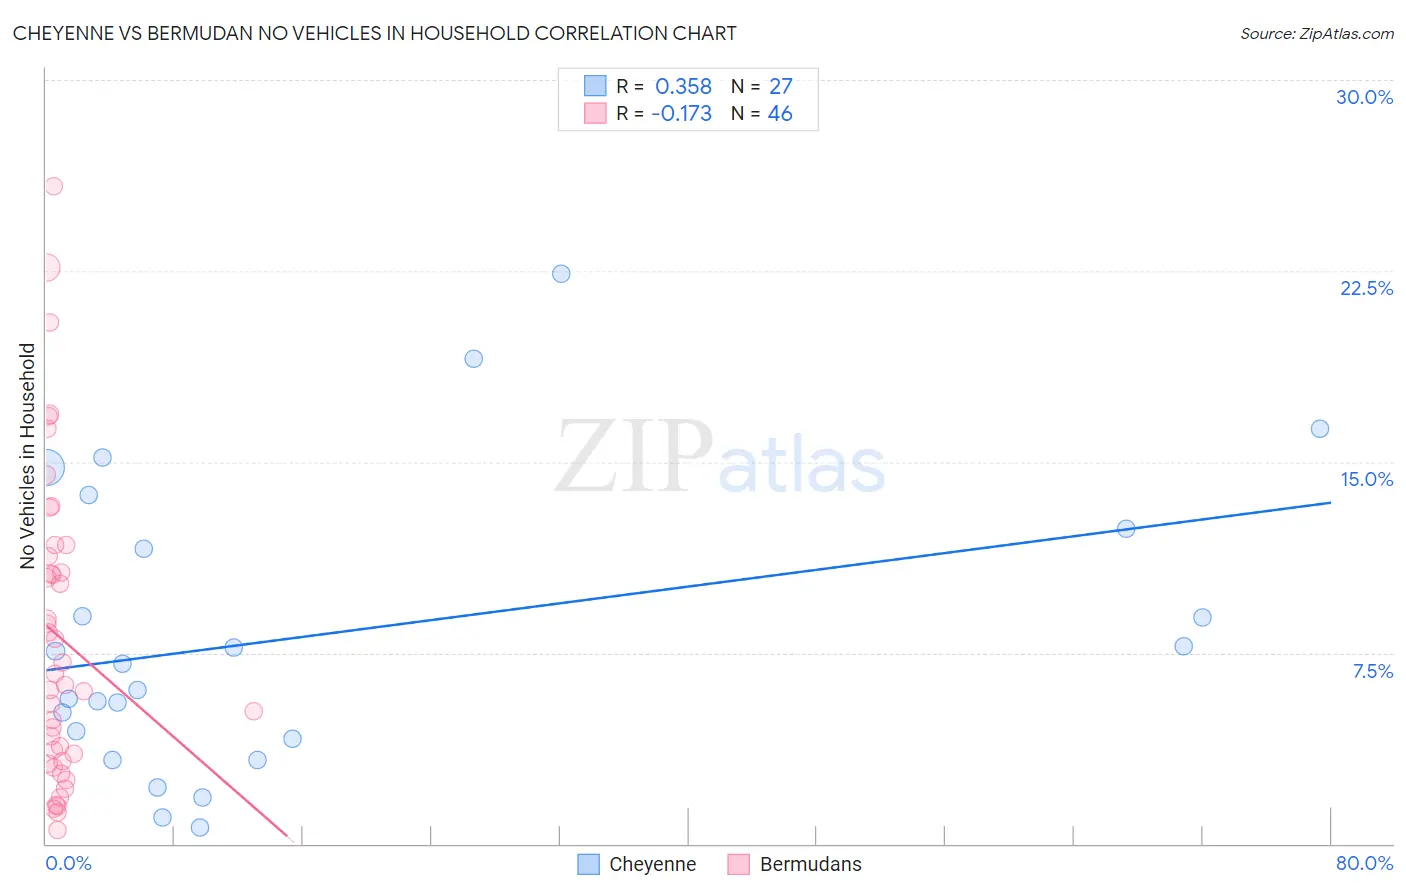
Cheyenne vs Bermudan No Vehicles in Household Correlation Chart
The statistical analysis conducted on geographies consisting of 80,645,180 people shows a mild positive correlation between the proportion of Cheyenne and percentage of households with no vehicle available in the United States with a correlation coefficient (R) of 0.358 and weighted average of 11.7%. Similarly, the statistical analysis conducted on geographies consisting of 55,615,567 people shows a poor negative correlation between the proportion of Bermudans and percentage of households with no vehicle available in the United States with a correlation coefficient (R) of -0.173 and weighted average of 12.8%, a difference of 9.1%.
No Vehicles in Household Correlation Summary
| Measurement | Cheyenne | Bermudan |
| Minimum | 0.64% | 0.54% |
| Maximum | 22.4% | 25.8% |
| Range | 21.7% | 25.3% |
| Mean | 8.2% | 8.1% |
| Median | 7.1% | 6.5% |
| Interquartile 25% (IQ1) | 4.1% | 3.2% |
| Interquartile 75% (IQ3) | 12.4% | 11.3% |
| Interquartile Range (IQR) | 8.3% | 8.0% |
| Standard Deviation (Sample) | 5.7% | 6.0% |
| Standard Deviation (Population) | 5.6% | 6.0% |
Similar Demographics by No Vehicles in Household
Demographics Similar to Cheyenne by No Vehicles in Household
In terms of no vehicles in household, the demographic groups most similar to Cheyenne are Immigrants from Portugal (11.7%, a difference of 0.18%), Turkish (11.7%, a difference of 0.33%), Immigrants from Honduras (11.8%, a difference of 0.37%), Eastern European (11.7%, a difference of 0.44%), and Immigrants (11.7%, a difference of 0.45%).
| Demographics | Rating | Rank | No Vehicles in Household |
| Cree | 3.5 /100 | #236 | Tragic 11.6% |
| Ute | 3.3 /100 | #237 | Tragic 11.6% |
| Russians | 3.2 /100 | #238 | Tragic 11.6% |
| Taiwanese | 2.8 /100 | #239 | Tragic 11.7% |
| Immigrants | Immigrants | 2.7 /100 | #240 | Tragic 11.7% |
| Eastern Europeans | 2.7 /100 | #241 | Tragic 11.7% |
| Turks | 2.6 /100 | #242 | Tragic 11.7% |
| Cheyenne | 2.4 /100 | #243 | Tragic 11.7% |
| Immigrants | Portugal | 2.2 /100 | #244 | Tragic 11.7% |
| Immigrants | Honduras | 2.1 /100 | #245 | Tragic 11.8% |
| Menominee | 2.0 /100 | #246 | Tragic 11.8% |
| Immigrants | Czechoslovakia | 2.0 /100 | #247 | Tragic 11.8% |
| Immigrants | Belgium | 1.9 /100 | #248 | Tragic 11.8% |
| Immigrants | Nigeria | 1.9 /100 | #249 | Tragic 11.8% |
| Paiute | 1.8 /100 | #250 | Tragic 11.8% |
Demographics Similar to Bermudans by No Vehicles in Household
In terms of no vehicles in household, the demographic groups most similar to Bermudans are Immigrants from France (12.9%, a difference of 1.2%), Immigrants from Singapore (12.9%, a difference of 1.3%), Immigrants from Morocco (12.6%, a difference of 1.3%), Immigrants from Northern Africa (12.6%, a difference of 1.4%), and Immigrants from Albania (13.0%, a difference of 1.5%).
| Demographics | Rating | Rank | No Vehicles in Household |
| Africans | 0.4 /100 | #265 | Tragic 12.3% |
| Israelis | 0.3 /100 | #266 | Tragic 12.4% |
| Immigrants | Europe | 0.3 /100 | #267 | Tragic 12.5% |
| Immigrants | Africa | 0.2 /100 | #268 | Tragic 12.5% |
| Panamanians | 0.2 /100 | #269 | Tragic 12.5% |
| Immigrants | Northern Africa | 0.2 /100 | #270 | Tragic 12.6% |
| Immigrants | Morocco | 0.2 /100 | #271 | Tragic 12.6% |
| Bermudans | 0.1 /100 | #272 | Tragic 12.8% |
| Immigrants | France | 0.1 /100 | #273 | Tragic 12.9% |
| Immigrants | Singapore | 0.1 /100 | #274 | Tragic 12.9% |
| Immigrants | Albania | 0.1 /100 | #275 | Tragic 13.0% |
| Immigrants | Southern Europe | 0.1 /100 | #276 | Tragic 13.0% |
| Aleuts | 0.1 /100 | #277 | Tragic 13.0% |
| Immigrants | Croatia | 0.1 /100 | #278 | Tragic 13.0% |
| Mongolians | 0.0 /100 | #279 | Tragic 13.1% |