Native/Alaskan vs Belgian No Vehicles in Household
COMPARE
Native/Alaskan
Belgian
No Vehicles in Household
No Vehicles in Household Comparison
Natives/Alaskans
Belgians
10.5%
NO VEHICLES IN HOUSEHOLD
43.7/ 100
METRIC RATING
183rd/ 347
METRIC RANK
8.0%
NO VEHICLES IN HOUSEHOLD
99.9/ 100
METRIC RATING
50th/ 347
METRIC RANK
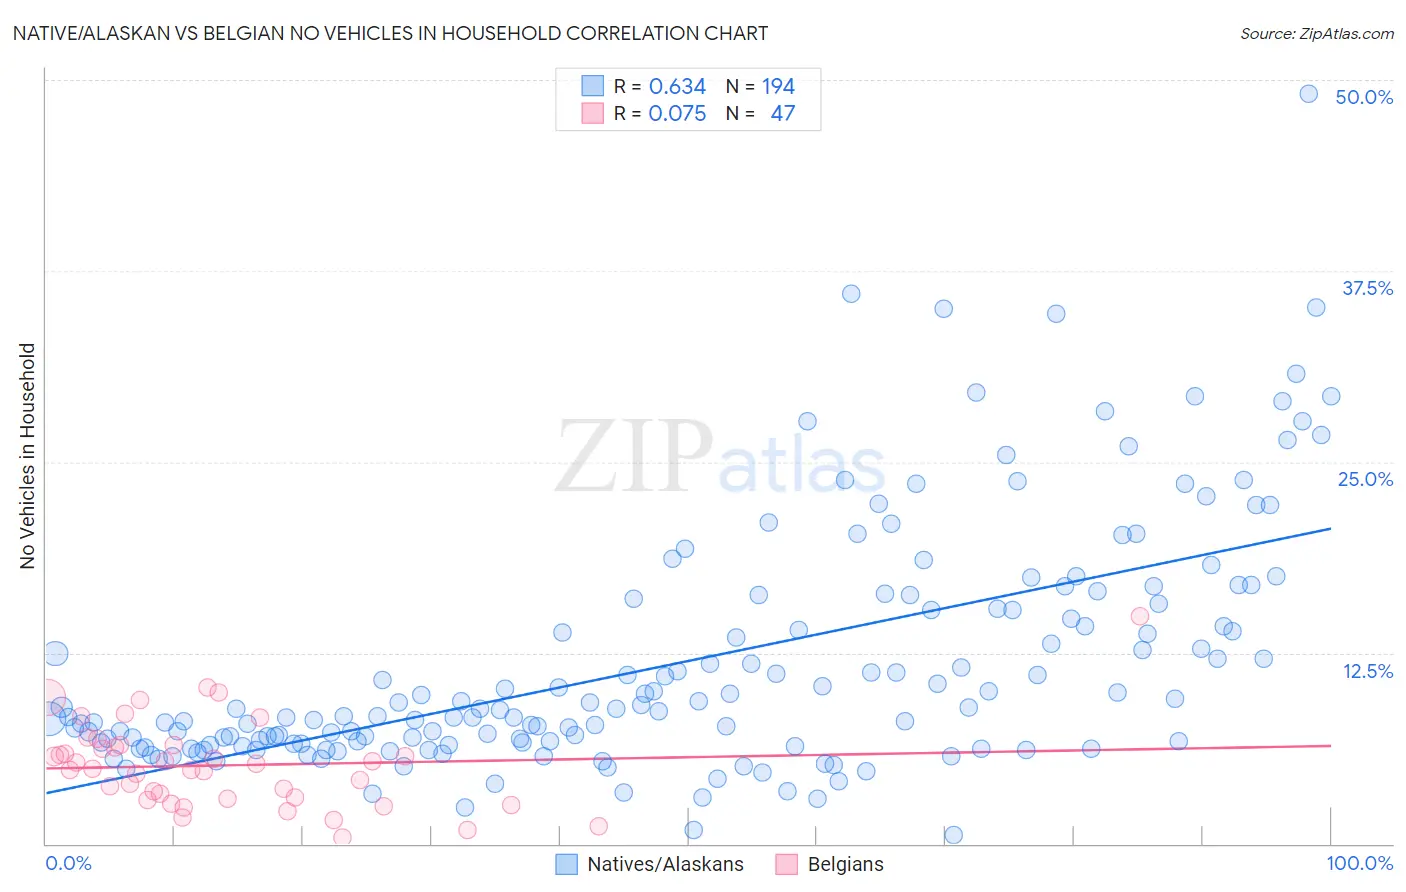
Native/Alaskan vs Belgian No Vehicles in Household Correlation Chart
The statistical analysis conducted on geographies consisting of 510,438,252 people shows a significant positive correlation between the proportion of Natives/Alaskans and percentage of households with no vehicle available in the United States with a correlation coefficient (R) of 0.634 and weighted average of 10.5%. Similarly, the statistical analysis conducted on geographies consisting of 355,082,936 people shows a slight positive correlation between the proportion of Belgians and percentage of households with no vehicle available in the United States with a correlation coefficient (R) of 0.075 and weighted average of 8.0%, a difference of 31.4%.
No Vehicles in Household Correlation Summary
| Measurement | Native/Alaskan | Belgian |
| Minimum | 0.55% | 0.40% |
| Maximum | 49.1% | 14.9% |
| Range | 48.5% | 14.5% |
| Mean | 11.9% | 5.1% |
| Median | 8.8% | 4.9% |
| Interquartile 25% (IQ1) | 6.6% | 2.9% |
| Interquartile 75% (IQ3) | 15.3% | 6.4% |
| Interquartile Range (IQR) | 8.8% | 3.5% |
| Standard Deviation (Sample) | 7.9% | 2.8% |
| Standard Deviation (Population) | 7.9% | 2.8% |
Similar Demographics by No Vehicles in Household
Demographics Similar to Natives/Alaskans by No Vehicles in Household
In terms of no vehicles in household, the demographic groups most similar to Natives/Alaskans are Immigrants from Bulgaria (10.5%, a difference of 0.020%), Immigrants from Colombia (10.5%, a difference of 0.060%), Immigrants from Nepal (10.5%, a difference of 0.17%), Arab (10.5%, a difference of 0.22%), and South American (10.5%, a difference of 0.24%).
| Demographics | Rating | Rank | No Vehicles in Household |
| French American Indians | 49.1 /100 | #176 | Average 10.4% |
| Immigrants | El Salvador | 49.1 /100 | #177 | Average 10.4% |
| Immigrants | Ethiopia | 48.0 /100 | #178 | Average 10.4% |
| Ethiopians | 45.8 /100 | #179 | Average 10.5% |
| Arabs | 45.3 /100 | #180 | Average 10.5% |
| Immigrants | Colombia | 44.1 /100 | #181 | Average 10.5% |
| Immigrants | Bulgaria | 43.8 /100 | #182 | Average 10.5% |
| Natives/Alaskans | 43.7 /100 | #183 | Average 10.5% |
| Immigrants | Nepal | 42.4 /100 | #184 | Average 10.5% |
| South Americans | 41.9 /100 | #185 | Average 10.5% |
| German Russians | 40.6 /100 | #186 | Average 10.5% |
| Immigrants | Poland | 38.4 /100 | #187 | Fair 10.6% |
| Immigrants | Armenia | 37.5 /100 | #188 | Fair 10.6% |
| Immigrants | Eritrea | 36.3 /100 | #189 | Fair 10.6% |
| Immigrants | North Macedonia | 34.6 /100 | #190 | Fair 10.6% |
Demographics Similar to Belgians by No Vehicles in Household
In terms of no vehicles in household, the demographic groups most similar to Belgians are Guamanian/Chamorro (8.0%, a difference of 0.070%), Korean (8.0%, a difference of 0.10%), Afghan (8.0%, a difference of 0.25%), Hawaiian (8.0%, a difference of 0.68%), and Slovene (8.0%, a difference of 0.68%).
| Demographics | Rating | Rank | No Vehicles in Household |
| Chickasaw | 99.9 /100 | #43 | Exceptional 7.9% |
| Choctaw | 99.9 /100 | #44 | Exceptional 7.9% |
| Immigrants | Nonimmigrants | 99.9 /100 | #45 | Exceptional 7.9% |
| Spanish | 99.9 /100 | #46 | Exceptional 7.9% |
| Northern Europeans | 99.9 /100 | #47 | Exceptional 7.9% |
| Afghans | 99.9 /100 | #48 | Exceptional 8.0% |
| Guamanians/Chamorros | 99.9 /100 | #49 | Exceptional 8.0% |
| Belgians | 99.9 /100 | #50 | Exceptional 8.0% |
| Koreans | 99.9 /100 | #51 | Exceptional 8.0% |
| Hawaiians | 99.9 /100 | #52 | Exceptional 8.0% |
| Slovenes | 99.9 /100 | #53 | Exceptional 8.0% |
| Immigrants | Venezuela | 99.9 /100 | #54 | Exceptional 8.1% |
| Celtics | 99.9 /100 | #55 | Exceptional 8.1% |
| Immigrants | Afghanistan | 99.9 /100 | #56 | Exceptional 8.1% |
| Venezuelans | 99.8 /100 | #57 | Exceptional 8.1% |