Native/Alaskan vs Ukrainian No Vehicles in Household
COMPARE
Native/Alaskan
Ukrainian
No Vehicles in Household
No Vehicles in Household Comparison
Natives/Alaskans
Ukrainians
10.5%
NO VEHICLES IN HOUSEHOLD
43.7/ 100
METRIC RATING
183rd/ 347
METRIC RANK
10.7%
NO VEHICLES IN HOUSEHOLD
28.0/ 100
METRIC RATING
193rd/ 347
METRIC RANK
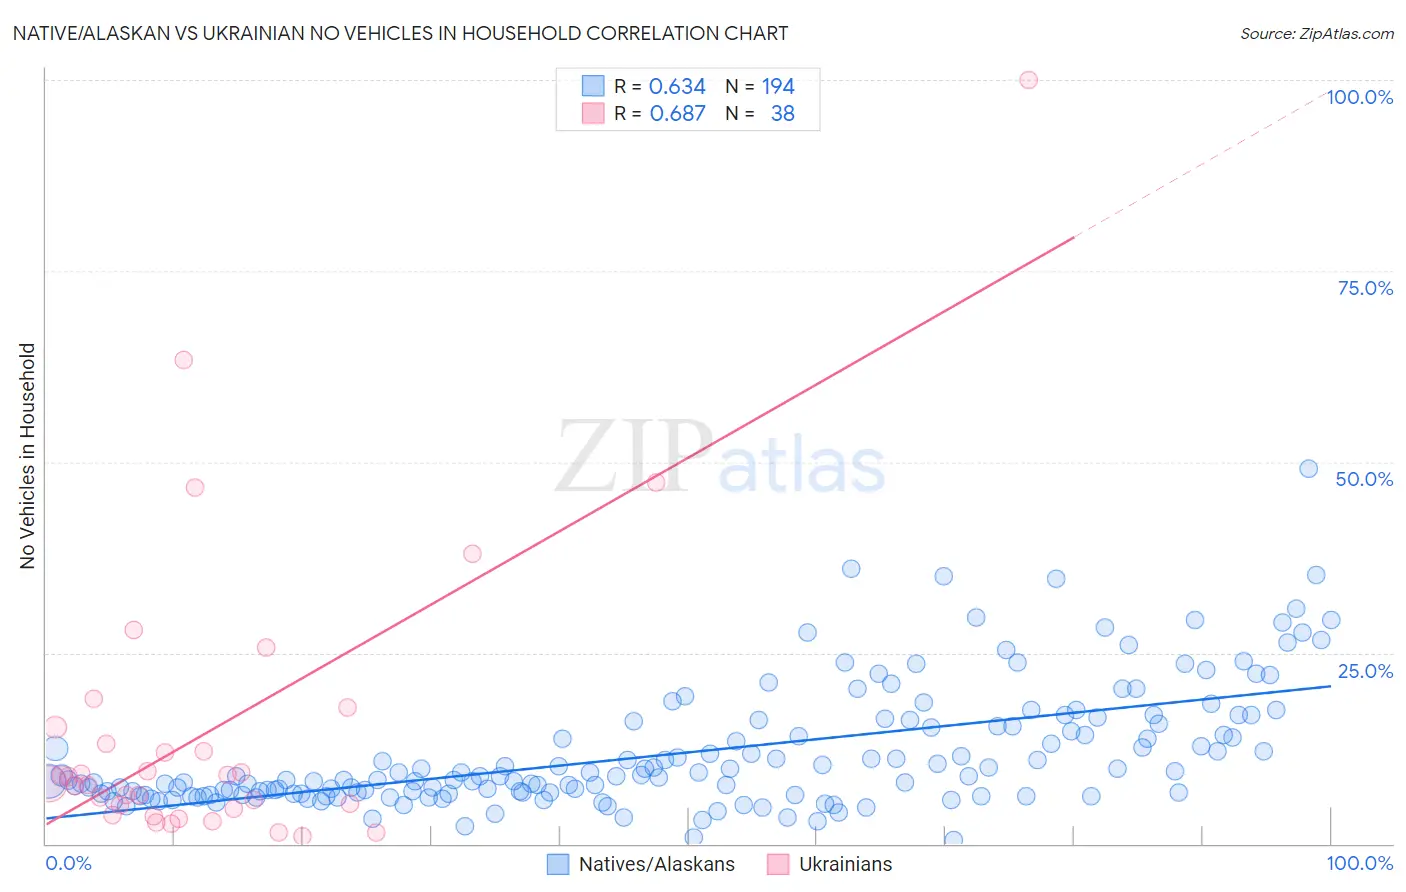
Native/Alaskan vs Ukrainian No Vehicles in Household Correlation Chart
The statistical analysis conducted on geographies consisting of 510,438,252 people shows a significant positive correlation between the proportion of Natives/Alaskans and percentage of households with no vehicle available in the United States with a correlation coefficient (R) of 0.634 and weighted average of 10.5%. Similarly, the statistical analysis conducted on geographies consisting of 446,891,229 people shows a significant positive correlation between the proportion of Ukrainians and percentage of households with no vehicle available in the United States with a correlation coefficient (R) of 0.687 and weighted average of 10.7%, a difference of 2.3%.
No Vehicles in Household Correlation Summary
| Measurement | Native/Alaskan | Ukrainian |
| Minimum | 0.55% | 1.0% |
| Maximum | 49.1% | 100.0% |
| Range | 48.5% | 99.0% |
| Mean | 11.9% | 15.2% |
| Median | 8.8% | 8.3% |
| Interquartile 25% (IQ1) | 6.6% | 4.6% |
| Interquartile 75% (IQ3) | 15.3% | 15.2% |
| Interquartile Range (IQR) | 8.8% | 10.7% |
| Standard Deviation (Sample) | 7.9% | 20.0% |
| Standard Deviation (Population) | 7.9% | 19.8% |
Demographics Similar to Natives/Alaskans and Ukrainians by No Vehicles in Household
In terms of no vehicles in household, the demographic groups most similar to Natives/Alaskans are Immigrants from Bulgaria (10.5%, a difference of 0.020%), Immigrants from Colombia (10.5%, a difference of 0.060%), Immigrants from Nepal (10.5%, a difference of 0.17%), Arab (10.5%, a difference of 0.22%), and South American (10.5%, a difference of 0.24%). Similarly, the demographic groups most similar to Ukrainians are Pueblo (10.8%, a difference of 0.17%), Immigrants from Brazil (10.8%, a difference of 0.29%), Central American (10.8%, a difference of 0.63%), Carpatho Rusyn (10.7%, a difference of 0.64%), and Shoshone (10.8%, a difference of 0.67%).
| Demographics | Rating | Rank | No Vehicles in Household |
| Immigrants | Ethiopia | 48.0 /100 | #178 | Average 10.4% |
| Ethiopians | 45.8 /100 | #179 | Average 10.5% |
| Arabs | 45.3 /100 | #180 | Average 10.5% |
| Immigrants | Colombia | 44.1 /100 | #181 | Average 10.5% |
| Immigrants | Bulgaria | 43.8 /100 | #182 | Average 10.5% |
| Natives/Alaskans | 43.7 /100 | #183 | Average 10.5% |
| Immigrants | Nepal | 42.4 /100 | #184 | Average 10.5% |
| South Americans | 41.9 /100 | #185 | Average 10.5% |
| German Russians | 40.6 /100 | #186 | Average 10.5% |
| Immigrants | Poland | 38.4 /100 | #187 | Fair 10.6% |
| Immigrants | Armenia | 37.5 /100 | #188 | Fair 10.6% |
| Immigrants | Eritrea | 36.3 /100 | #189 | Fair 10.6% |
| Immigrants | North Macedonia | 34.6 /100 | #190 | Fair 10.6% |
| Immigrants | Northern Europe | 33.1 /100 | #191 | Fair 10.7% |
| Carpatho Rusyns | 32.1 /100 | #192 | Fair 10.7% |
| Ukrainians | 28.0 /100 | #193 | Fair 10.7% |
| Pueblo | 27.0 /100 | #194 | Fair 10.8% |
| Immigrants | Brazil | 26.3 /100 | #195 | Fair 10.8% |
| Central Americans | 24.3 /100 | #196 | Fair 10.8% |
| Shoshone | 24.1 /100 | #197 | Fair 10.8% |
| Immigrants | Sweden | 22.9 /100 | #198 | Fair 10.8% |