Native/Alaskan vs Immigrants from Uruguay No Vehicles in Household
COMPARE
Native/Alaskan
Immigrants from Uruguay
No Vehicles in Household
No Vehicles in Household Comparison
Natives/Alaskans
Immigrants from Uruguay
10.5%
NO VEHICLES IN HOUSEHOLD
43.7/ 100
METRIC RATING
183rd/ 347
METRIC RANK
11.9%
NO VEHICLES IN HOUSEHOLD
1.3/ 100
METRIC RATING
254th/ 347
METRIC RANK
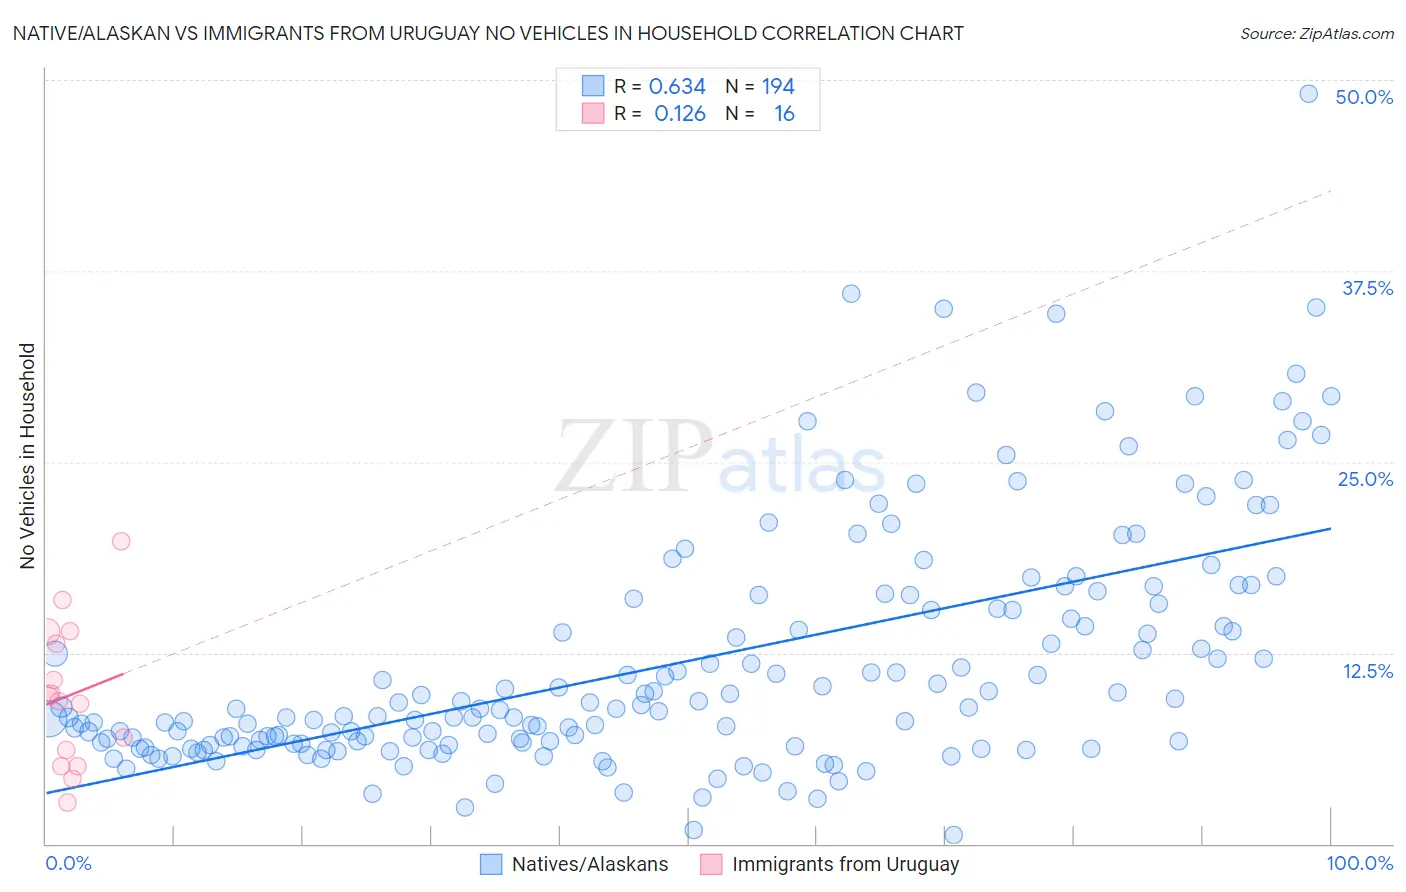
Native/Alaskan vs Immigrants from Uruguay No Vehicles in Household Correlation Chart
The statistical analysis conducted on geographies consisting of 510,438,252 people shows a significant positive correlation between the proportion of Natives/Alaskans and percentage of households with no vehicle available in the United States with a correlation coefficient (R) of 0.634 and weighted average of 10.5%. Similarly, the statistical analysis conducted on geographies consisting of 133,161,139 people shows a poor positive correlation between the proportion of Immigrants from Uruguay and percentage of households with no vehicle available in the United States with a correlation coefficient (R) of 0.126 and weighted average of 11.9%, a difference of 13.7%.
No Vehicles in Household Correlation Summary
| Measurement | Native/Alaskan | Immigrants from Uruguay |
| Minimum | 0.55% | 2.7% |
| Maximum | 49.1% | 19.8% |
| Range | 48.5% | 17.2% |
| Mean | 11.9% | 9.7% |
| Median | 8.8% | 9.5% |
| Interquartile 25% (IQ1) | 6.6% | 5.6% |
| Interquartile 75% (IQ3) | 15.3% | 13.5% |
| Interquartile Range (IQR) | 8.8% | 7.9% |
| Standard Deviation (Sample) | 7.9% | 4.7% |
| Standard Deviation (Population) | 7.9% | 4.6% |
Similar Demographics by No Vehicles in Household
Demographics Similar to Natives/Alaskans by No Vehicles in Household
In terms of no vehicles in household, the demographic groups most similar to Natives/Alaskans are Immigrants from Bulgaria (10.5%, a difference of 0.020%), Immigrants from Colombia (10.5%, a difference of 0.060%), Immigrants from Nepal (10.5%, a difference of 0.17%), Arab (10.5%, a difference of 0.22%), and South American (10.5%, a difference of 0.24%).
| Demographics | Rating | Rank | No Vehicles in Household |
| French American Indians | 49.1 /100 | #176 | Average 10.4% |
| Immigrants | El Salvador | 49.1 /100 | #177 | Average 10.4% |
| Immigrants | Ethiopia | 48.0 /100 | #178 | Average 10.4% |
| Ethiopians | 45.8 /100 | #179 | Average 10.5% |
| Arabs | 45.3 /100 | #180 | Average 10.5% |
| Immigrants | Colombia | 44.1 /100 | #181 | Average 10.5% |
| Immigrants | Bulgaria | 43.8 /100 | #182 | Average 10.5% |
| Natives/Alaskans | 43.7 /100 | #183 | Average 10.5% |
| Immigrants | Nepal | 42.4 /100 | #184 | Average 10.5% |
| South Americans | 41.9 /100 | #185 | Average 10.5% |
| German Russians | 40.6 /100 | #186 | Average 10.5% |
| Immigrants | Poland | 38.4 /100 | #187 | Fair 10.6% |
| Immigrants | Armenia | 37.5 /100 | #188 | Fair 10.6% |
| Immigrants | Eritrea | 36.3 /100 | #189 | Fair 10.6% |
| Immigrants | North Macedonia | 34.6 /100 | #190 | Fair 10.6% |
Demographics Similar to Immigrants from Uruguay by No Vehicles in Household
In terms of no vehicles in household, the demographic groups most similar to Immigrants from Uruguay are Honduran (12.0%, a difference of 0.27%), Egyptian (11.9%, a difference of 0.32%), Liberian (12.0%, a difference of 0.32%), Immigrants from Serbia (11.9%, a difference of 0.39%), and Black/African American (11.9%, a difference of 0.65%).
| Demographics | Rating | Rank | No Vehicles in Household |
| Immigrants | Czechoslovakia | 2.0 /100 | #247 | Tragic 11.8% |
| Immigrants | Belgium | 1.9 /100 | #248 | Tragic 11.8% |
| Immigrants | Nigeria | 1.9 /100 | #249 | Tragic 11.8% |
| Paiute | 1.8 /100 | #250 | Tragic 11.8% |
| Blacks/African Americans | 1.6 /100 | #251 | Tragic 11.9% |
| Immigrants | Serbia | 1.5 /100 | #252 | Tragic 11.9% |
| Egyptians | 1.4 /100 | #253 | Tragic 11.9% |
| Immigrants | Uruguay | 1.3 /100 | #254 | Tragic 11.9% |
| Hondurans | 1.2 /100 | #255 | Tragic 12.0% |
| Liberians | 1.2 /100 | #256 | Tragic 12.0% |
| Nigerians | 0.9 /100 | #257 | Tragic 12.1% |
| South American Indians | 0.9 /100 | #258 | Tragic 12.1% |
| Immigrants | Latvia | 0.8 /100 | #259 | Tragic 12.1% |
| Macedonians | 0.7 /100 | #260 | Tragic 12.2% |
| Sub-Saharan Africans | 0.6 /100 | #261 | Tragic 12.2% |