U.S. Virgin Islander vs Bermudan No Vehicles in Household
COMPARE
U.S. Virgin Islander
Bermudan
No Vehicles in Household
No Vehicles in Household Comparison
U.S. Virgin Islanders
Bermudans
15.4%
NO VEHICLES IN HOUSEHOLD
0.0/ 100
METRIC RATING
308th/ 347
METRIC RANK
12.8%
NO VEHICLES IN HOUSEHOLD
0.1/ 100
METRIC RATING
272nd/ 347
METRIC RANK
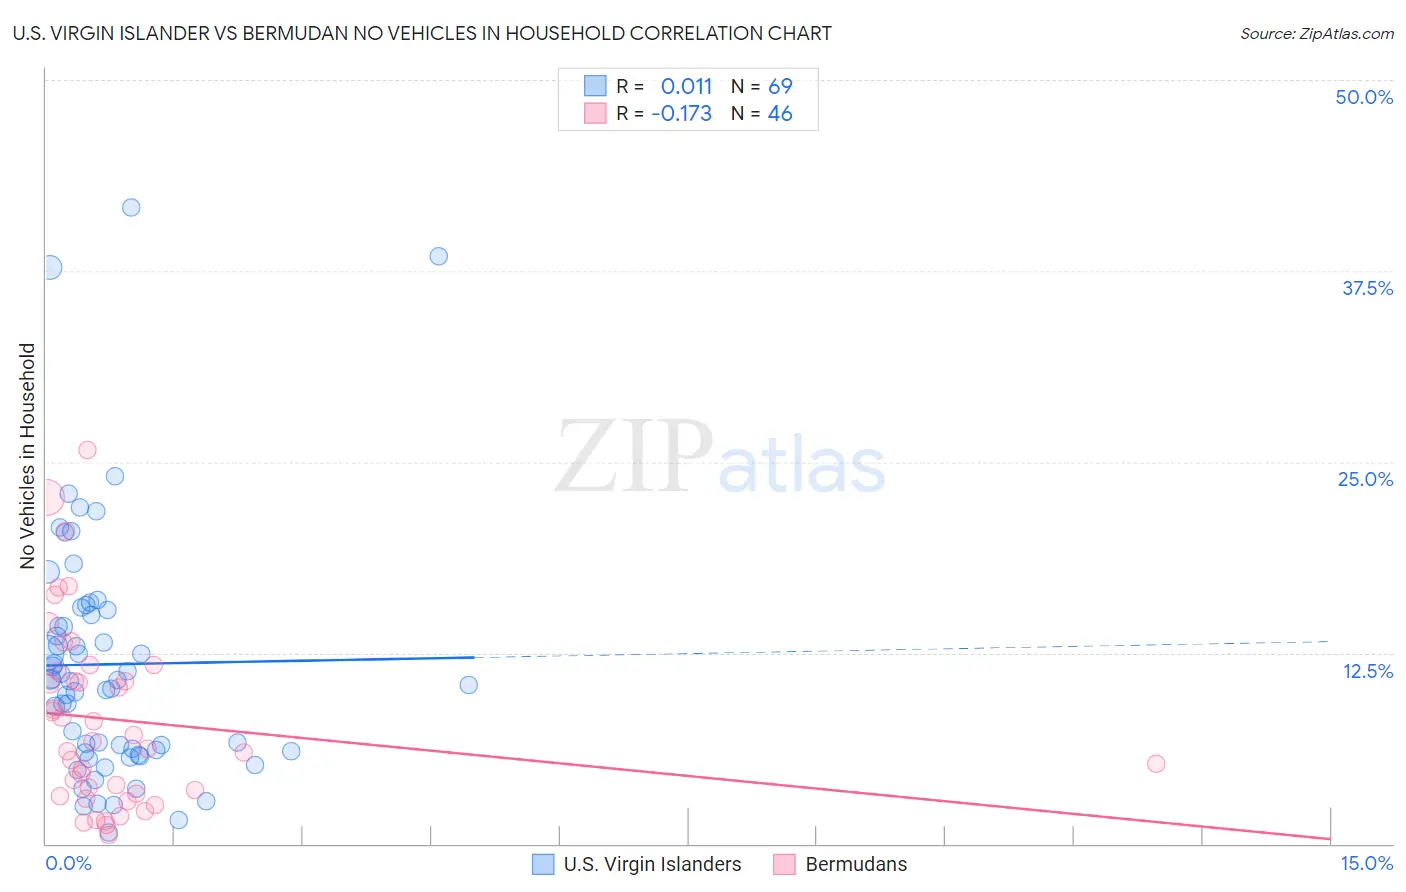
U.S. Virgin Islander vs Bermudan No Vehicles in Household Correlation Chart
The statistical analysis conducted on geographies consisting of 87,426,886 people shows no correlation between the proportion of U.S. Virgin Islanders and percentage of households with no vehicle available in the United States with a correlation coefficient (R) of 0.011 and weighted average of 15.4%. Similarly, the statistical analysis conducted on geographies consisting of 55,615,567 people shows a poor negative correlation between the proportion of Bermudans and percentage of households with no vehicle available in the United States with a correlation coefficient (R) of -0.173 and weighted average of 12.8%, a difference of 20.3%.
No Vehicles in Household Correlation Summary
| Measurement | U.S. Virgin Islander | Bermudan |
| Minimum | 0.71% | 0.54% |
| Maximum | 41.7% | 25.8% |
| Range | 41.0% | 25.3% |
| Mean | 11.7% | 8.1% |
| Median | 10.6% | 6.5% |
| Interquartile 25% (IQ1) | 6.0% | 3.2% |
| Interquartile 75% (IQ3) | 15.1% | 11.3% |
| Interquartile Range (IQR) | 9.1% | 8.0% |
| Standard Deviation (Sample) | 8.2% | 6.0% |
| Standard Deviation (Population) | 8.1% | 6.0% |
Similar Demographics by No Vehicles in Household
Demographics Similar to U.S. Virgin Islanders by No Vehicles in Household
In terms of no vehicles in household, the demographic groups most similar to U.S. Virgin Islanders are Immigrants from Haiti (15.4%, a difference of 0.030%), Immigrants from Belize (15.4%, a difference of 0.17%), Puerto Rican (15.5%, a difference of 0.65%), Cape Verdean (15.6%, a difference of 1.2%), and Immigrants from Israel (15.6%, a difference of 1.2%).
| Demographics | Rating | Rank | No Vehicles in Household |
| Immigrants | Ukraine | 0.0 /100 | #301 | Tragic 14.9% |
| Haitians | 0.0 /100 | #302 | Tragic 14.9% |
| Immigrants | Western Africa | 0.0 /100 | #303 | Tragic 15.0% |
| Immigrants | Russia | 0.0 /100 | #304 | Tragic 15.1% |
| Immigrants | China | 0.0 /100 | #305 | Tragic 15.2% |
| Immigrants | Belize | 0.0 /100 | #306 | Tragic 15.4% |
| Immigrants | Haiti | 0.0 /100 | #307 | Tragic 15.4% |
| U.S. Virgin Islanders | 0.0 /100 | #308 | Tragic 15.4% |
| Puerto Ricans | 0.0 /100 | #309 | Tragic 15.5% |
| Cape Verdeans | 0.0 /100 | #310 | Tragic 15.6% |
| Immigrants | Israel | 0.0 /100 | #311 | Tragic 15.6% |
| Alaskan Athabascans | 0.0 /100 | #312 | Tragic 15.6% |
| Tohono O'odham | 0.0 /100 | #313 | Tragic 15.6% |
| Albanians | 0.0 /100 | #314 | Tragic 15.6% |
| Cypriots | 0.0 /100 | #315 | Tragic 15.7% |
Demographics Similar to Bermudans by No Vehicles in Household
In terms of no vehicles in household, the demographic groups most similar to Bermudans are Immigrants from France (12.9%, a difference of 1.2%), Immigrants from Singapore (12.9%, a difference of 1.3%), Immigrants from Morocco (12.6%, a difference of 1.3%), Immigrants from Northern Africa (12.6%, a difference of 1.4%), and Immigrants from Albania (13.0%, a difference of 1.5%).
| Demographics | Rating | Rank | No Vehicles in Household |
| Africans | 0.4 /100 | #265 | Tragic 12.3% |
| Israelis | 0.3 /100 | #266 | Tragic 12.4% |
| Immigrants | Europe | 0.3 /100 | #267 | Tragic 12.5% |
| Immigrants | Africa | 0.2 /100 | #268 | Tragic 12.5% |
| Panamanians | 0.2 /100 | #269 | Tragic 12.5% |
| Immigrants | Northern Africa | 0.2 /100 | #270 | Tragic 12.6% |
| Immigrants | Morocco | 0.2 /100 | #271 | Tragic 12.6% |
| Bermudans | 0.1 /100 | #272 | Tragic 12.8% |
| Immigrants | France | 0.1 /100 | #273 | Tragic 12.9% |
| Immigrants | Singapore | 0.1 /100 | #274 | Tragic 12.9% |
| Immigrants | Albania | 0.1 /100 | #275 | Tragic 13.0% |
| Immigrants | Southern Europe | 0.1 /100 | #276 | Tragic 13.0% |
| Aleuts | 0.1 /100 | #277 | Tragic 13.0% |
| Immigrants | Croatia | 0.1 /100 | #278 | Tragic 13.0% |
| Mongolians | 0.0 /100 | #279 | Tragic 13.1% |