Native/Alaskan vs Tsimshian No Vehicles in Household
COMPARE
Native/Alaskan
Tsimshian
No Vehicles in Household
No Vehicles in Household Comparison
Natives/Alaskans
Tsimshian
10.5%
NO VEHICLES IN HOUSEHOLD
43.7/ 100
METRIC RATING
183rd/ 347
METRIC RANK
8.6%
NO VEHICLES IN HOUSEHOLD
99.4/ 100
METRIC RATING
81st/ 347
METRIC RANK
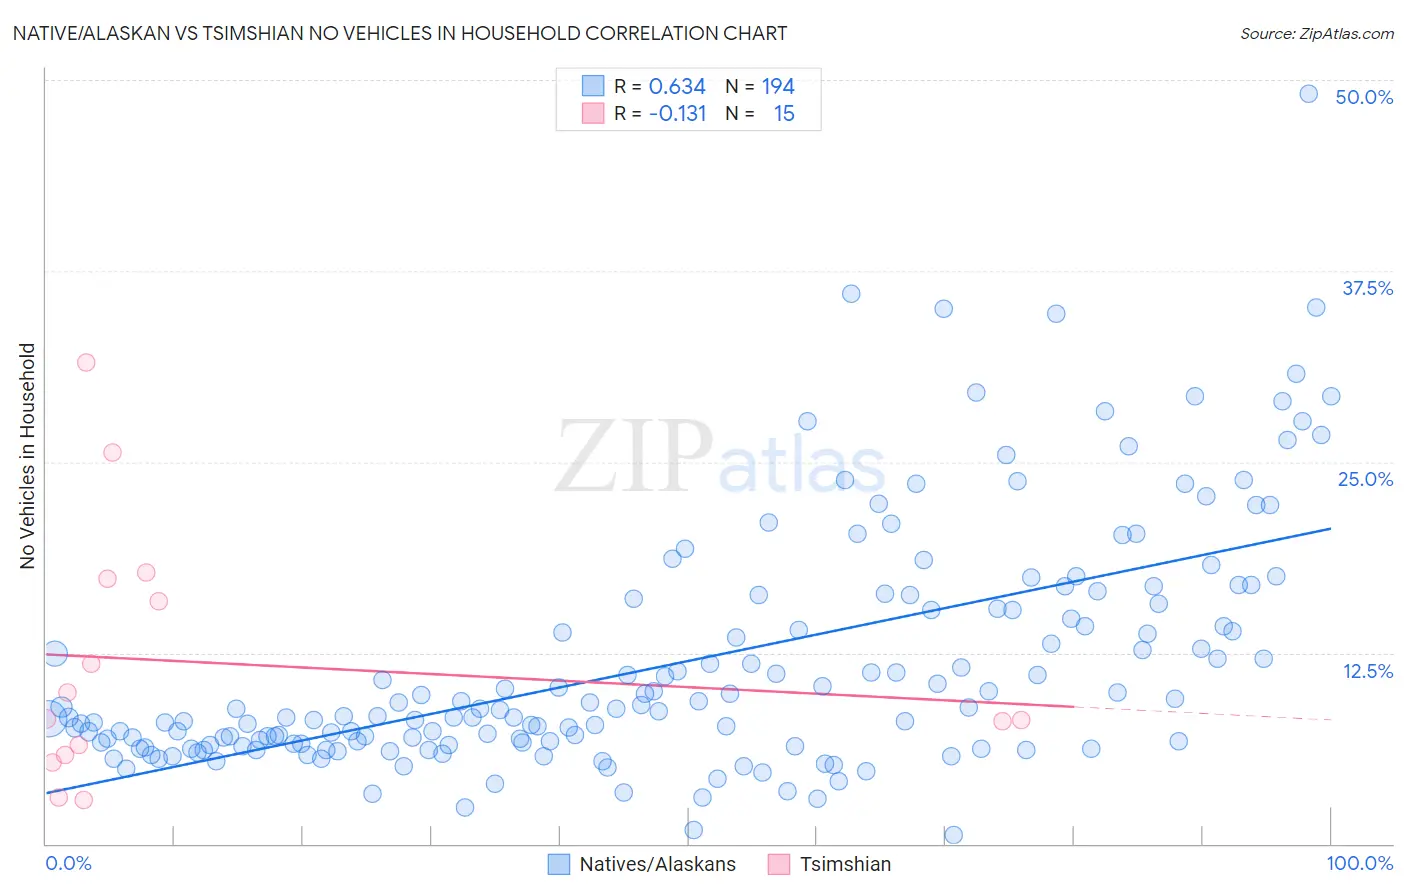
Native/Alaskan vs Tsimshian No Vehicles in Household Correlation Chart
The statistical analysis conducted on geographies consisting of 510,438,252 people shows a significant positive correlation between the proportion of Natives/Alaskans and percentage of households with no vehicle available in the United States with a correlation coefficient (R) of 0.634 and weighted average of 10.5%. Similarly, the statistical analysis conducted on geographies consisting of 15,626,179 people shows a poor negative correlation between the proportion of Tsimshian and percentage of households with no vehicle available in the United States with a correlation coefficient (R) of -0.131 and weighted average of 8.6%, a difference of 22.2%.
No Vehicles in Household Correlation Summary
| Measurement | Native/Alaskan | Tsimshian |
| Minimum | 0.55% | 2.8% |
| Maximum | 49.1% | 31.5% |
| Range | 48.5% | 28.6% |
| Mean | 11.9% | 11.8% |
| Median | 8.8% | 8.2% |
| Interquartile 25% (IQ1) | 6.6% | 5.8% |
| Interquartile 75% (IQ3) | 15.3% | 17.3% |
| Interquartile Range (IQR) | 8.8% | 11.5% |
| Standard Deviation (Sample) | 7.9% | 8.3% |
| Standard Deviation (Population) | 7.9% | 8.0% |
Similar Demographics by No Vehicles in Household
Demographics Similar to Natives/Alaskans by No Vehicles in Household
In terms of no vehicles in household, the demographic groups most similar to Natives/Alaskans are Immigrants from Bulgaria (10.5%, a difference of 0.020%), Immigrants from Colombia (10.5%, a difference of 0.060%), Immigrants from Nepal (10.5%, a difference of 0.17%), Arab (10.5%, a difference of 0.22%), and South American (10.5%, a difference of 0.24%).
| Demographics | Rating | Rank | No Vehicles in Household |
| French American Indians | 49.1 /100 | #176 | Average 10.4% |
| Immigrants | El Salvador | 49.1 /100 | #177 | Average 10.4% |
| Immigrants | Ethiopia | 48.0 /100 | #178 | Average 10.4% |
| Ethiopians | 45.8 /100 | #179 | Average 10.5% |
| Arabs | 45.3 /100 | #180 | Average 10.5% |
| Immigrants | Colombia | 44.1 /100 | #181 | Average 10.5% |
| Immigrants | Bulgaria | 43.8 /100 | #182 | Average 10.5% |
| Natives/Alaskans | 43.7 /100 | #183 | Average 10.5% |
| Immigrants | Nepal | 42.4 /100 | #184 | Average 10.5% |
| South Americans | 41.9 /100 | #185 | Average 10.5% |
| German Russians | 40.6 /100 | #186 | Average 10.5% |
| Immigrants | Poland | 38.4 /100 | #187 | Fair 10.6% |
| Immigrants | Armenia | 37.5 /100 | #188 | Fair 10.6% |
| Immigrants | Eritrea | 36.3 /100 | #189 | Fair 10.6% |
| Immigrants | North Macedonia | 34.6 /100 | #190 | Fair 10.6% |
Demographics Similar to Tsimshian by No Vehicles in Household
In terms of no vehicles in household, the demographic groups most similar to Tsimshian are Bolivian (8.6%, a difference of 0.050%), Immigrants from South Eastern Asia (8.6%, a difference of 0.13%), Portuguese (8.6%, a difference of 0.20%), Immigrants from South Central Asia (8.6%, a difference of 0.26%), and Iranian (8.6%, a difference of 0.38%).
| Demographics | Rating | Rank | No Vehicles in Household |
| Cubans | 99.5 /100 | #74 | Exceptional 8.5% |
| Jordanians | 99.5 /100 | #75 | Exceptional 8.5% |
| Immigrants | Philippines | 99.5 /100 | #76 | Exceptional 8.5% |
| Iranians | 99.5 /100 | #77 | Exceptional 8.6% |
| Immigrants | South Central Asia | 99.5 /100 | #78 | Exceptional 8.6% |
| Portuguese | 99.5 /100 | #79 | Exceptional 8.6% |
| Bolivians | 99.4 /100 | #80 | Exceptional 8.6% |
| Tsimshian | 99.4 /100 | #81 | Exceptional 8.6% |
| Immigrants | South Eastern Asia | 99.4 /100 | #82 | Exceptional 8.6% |
| Italians | 99.4 /100 | #83 | Exceptional 8.6% |
| Immigrants | Jordan | 99.3 /100 | #84 | Exceptional 8.7% |
| Lebanese | 99.3 /100 | #85 | Exceptional 8.7% |
| Bangladeshis | 99.3 /100 | #86 | Exceptional 8.7% |
| Immigrants | England | 99.2 /100 | #87 | Exceptional 8.7% |
| Osage | 99.2 /100 | #88 | Exceptional 8.7% |