Native/Alaskan vs Bermudan Unemployment Among Seniors over 65 years
COMPARE
Native/Alaskan
Bermudan
Unemployment Among Seniors over 65 years
Unemployment Among Seniors over 65 years Comparison
Natives/Alaskans
Bermudans
5.8%
UNEMPLOYMENT AMONG SENIORS OVER 65 YEARS
0.0/ 100
METRIC RATING
322nd/ 347
METRIC RANK
5.9%
UNEMPLOYMENT AMONG SENIORS OVER 65 YEARS
0.0/ 100
METRIC RATING
327th/ 347
METRIC RANK
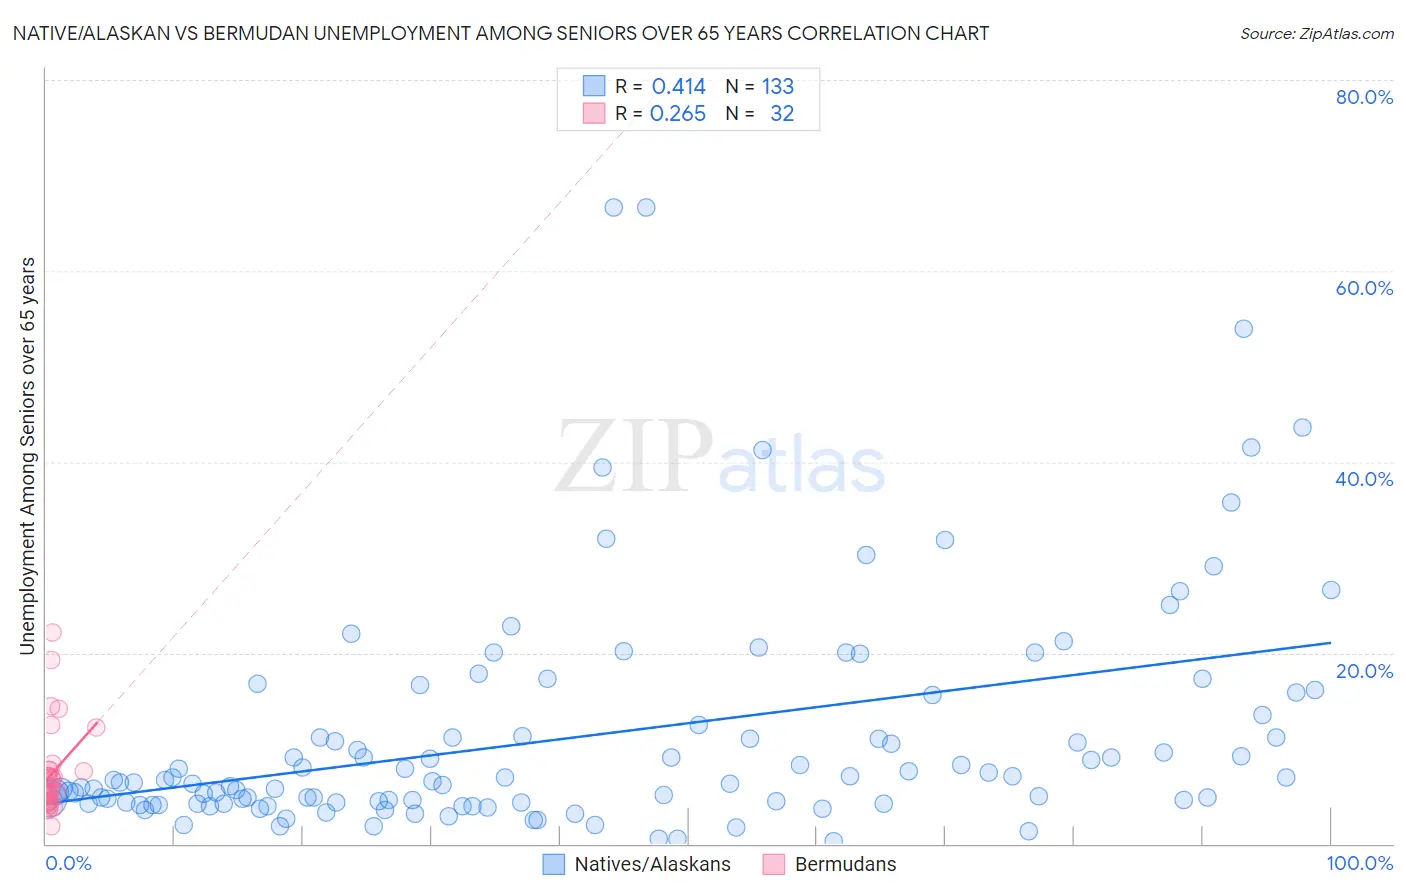
Native/Alaskan vs Bermudan Unemployment Among Seniors over 65 years Correlation Chart
The statistical analysis conducted on geographies consisting of 433,164,375 people shows a moderate positive correlation between the proportion of Natives/Alaskans and unemployment rate amomg seniors over the age of 65 in the United States with a correlation coefficient (R) of 0.414 and weighted average of 5.8%. Similarly, the statistical analysis conducted on geographies consisting of 54,539,220 people shows a weak positive correlation between the proportion of Bermudans and unemployment rate amomg seniors over the age of 65 in the United States with a correlation coefficient (R) of 0.265 and weighted average of 5.9%, a difference of 2.0%.
Unemployment Among Seniors over 65 years Correlation Summary
| Measurement | Native/Alaskan | Bermudan |
| Minimum | 0.30% | 1.8% |
| Maximum | 66.6% | 22.1% |
| Range | 66.3% | 20.3% |
| Mean | 11.3% | 7.5% |
| Median | 6.5% | 5.9% |
| Interquartile 25% (IQ1) | 4.3% | 4.4% |
| Interquartile 75% (IQ3) | 12.9% | 7.7% |
| Interquartile Range (IQR) | 8.7% | 3.3% |
| Standard Deviation (Sample) | 12.1% | 4.6% |
| Standard Deviation (Population) | 12.0% | 4.5% |
Demographics Similar to Natives/Alaskans and Bermudans by Unemployment Among Seniors over 65 years
In terms of unemployment among seniors over 65 years, the demographic groups most similar to Natives/Alaskans are British West Indian (5.8%, a difference of 0.080%), Immigrants from Dominica (5.8%, a difference of 0.34%), Yuman (5.8%, a difference of 0.51%), Immigrants from Mexico (5.7%, a difference of 0.72%), and Immigrants from Bangladesh (5.7%, a difference of 0.88%). Similarly, the demographic groups most similar to Bermudans are Shoshone (5.9%, a difference of 0.48%), Puerto Rican (5.9%, a difference of 0.53%), Inupiat (5.8%, a difference of 0.91%), Dominican (6.0%, a difference of 1.3%), and Immigrants from Portugal (6.0%, a difference of 1.3%).
| Demographics | Rating | Rank | Unemployment Among Seniors over 65 years |
| Delaware | 0.0 /100 | #314 | Tragic 5.7% |
| Immigrants | El Salvador | 0.0 /100 | #315 | Tragic 5.7% |
| Immigrants | Central America | 0.0 /100 | #316 | Tragic 5.7% |
| Immigrants | Bahamas | 0.0 /100 | #317 | Tragic 5.7% |
| Vietnamese | 0.0 /100 | #318 | Tragic 5.7% |
| Immigrants | Bangladesh | 0.0 /100 | #319 | Tragic 5.7% |
| Immigrants | Mexico | 0.0 /100 | #320 | Tragic 5.7% |
| British West Indians | 0.0 /100 | #321 | Tragic 5.8% |
| Natives/Alaskans | 0.0 /100 | #322 | Tragic 5.8% |
| Immigrants | Dominica | 0.0 /100 | #323 | Tragic 5.8% |
| Yuman | 0.0 /100 | #324 | Tragic 5.8% |
| Inupiat | 0.0 /100 | #325 | Tragic 5.8% |
| Shoshone | 0.0 /100 | #326 | Tragic 5.9% |
| Bermudans | 0.0 /100 | #327 | Tragic 5.9% |
| Puerto Ricans | 0.0 /100 | #328 | Tragic 5.9% |
| Dominicans | 0.0 /100 | #329 | Tragic 6.0% |
| Immigrants | Portugal | 0.0 /100 | #330 | Tragic 6.0% |
| Taiwanese | 0.0 /100 | #331 | Tragic 6.0% |
| Aleuts | 0.0 /100 | #332 | Tragic 6.0% |
| Immigrants | Dominican Republic | 0.0 /100 | #333 | Tragic 6.0% |
| Tohono O'odham | 0.0 /100 | #334 | Tragic 6.1% |