Immigrants from Colombia vs Bermudan No Vehicles in Household
COMPARE
Immigrants from Colombia
Bermudan
No Vehicles in Household
No Vehicles in Household Comparison
Immigrants from Colombia
Bermudans
10.5%
NO VEHICLES IN HOUSEHOLD
44.1/ 100
METRIC RATING
181st/ 347
METRIC RANK
12.8%
NO VEHICLES IN HOUSEHOLD
0.1/ 100
METRIC RATING
272nd/ 347
METRIC RANK
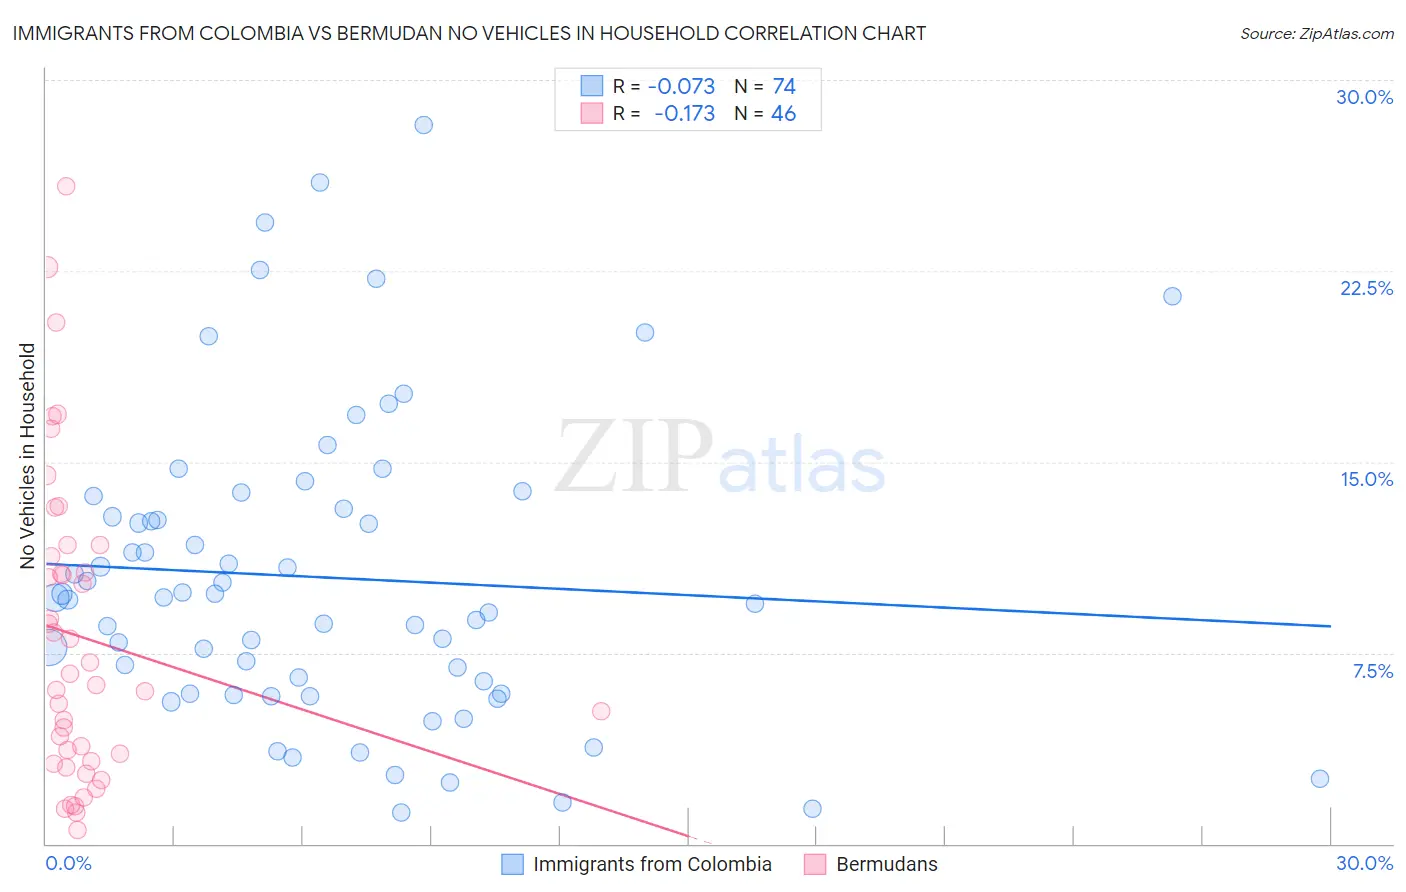
Immigrants from Colombia vs Bermudan No Vehicles in Household Correlation Chart
The statistical analysis conducted on geographies consisting of 362,333,216 people shows a slight negative correlation between the proportion of Immigrants from Colombia and percentage of households with no vehicle available in the United States with a correlation coefficient (R) of -0.073 and weighted average of 10.5%. Similarly, the statistical analysis conducted on geographies consisting of 55,615,567 people shows a poor negative correlation between the proportion of Bermudans and percentage of households with no vehicle available in the United States with a correlation coefficient (R) of -0.173 and weighted average of 12.8%, a difference of 21.9%.
No Vehicles in Household Correlation Summary
| Measurement | Immigrants from Colombia | Bermudan |
| Minimum | 1.2% | 0.54% |
| Maximum | 28.2% | 25.8% |
| Range | 27.0% | 25.3% |
| Mean | 10.5% | 8.1% |
| Median | 9.7% | 6.5% |
| Interquartile 25% (IQ1) | 5.9% | 3.2% |
| Interquartile 75% (IQ3) | 13.1% | 11.3% |
| Interquartile Range (IQR) | 7.2% | 8.0% |
| Standard Deviation (Sample) | 5.9% | 6.0% |
| Standard Deviation (Population) | 5.9% | 6.0% |
Similar Demographics by No Vehicles in Household
Demographics Similar to Immigrants from Colombia by No Vehicles in Household
In terms of no vehicles in household, the demographic groups most similar to Immigrants from Colombia are Immigrants from Bulgaria (10.5%, a difference of 0.040%), Native/Alaskan (10.5%, a difference of 0.060%), Arab (10.5%, a difference of 0.16%), Ethiopian (10.5%, a difference of 0.22%), and Immigrants from Nepal (10.5%, a difference of 0.23%).
| Demographics | Rating | Rank | No Vehicles in Household |
| Immigrants | Sudan | 50.0 /100 | #174 | Average 10.4% |
| Immigrants | Burma/Myanmar | 49.1 /100 | #175 | Average 10.4% |
| French American Indians | 49.1 /100 | #176 | Average 10.4% |
| Immigrants | El Salvador | 49.1 /100 | #177 | Average 10.4% |
| Immigrants | Ethiopia | 48.0 /100 | #178 | Average 10.4% |
| Ethiopians | 45.8 /100 | #179 | Average 10.5% |
| Arabs | 45.3 /100 | #180 | Average 10.5% |
| Immigrants | Colombia | 44.1 /100 | #181 | Average 10.5% |
| Immigrants | Bulgaria | 43.8 /100 | #182 | Average 10.5% |
| Natives/Alaskans | 43.7 /100 | #183 | Average 10.5% |
| Immigrants | Nepal | 42.4 /100 | #184 | Average 10.5% |
| South Americans | 41.9 /100 | #185 | Average 10.5% |
| German Russians | 40.6 /100 | #186 | Average 10.5% |
| Immigrants | Poland | 38.4 /100 | #187 | Fair 10.6% |
| Immigrants | Armenia | 37.5 /100 | #188 | Fair 10.6% |
Demographics Similar to Bermudans by No Vehicles in Household
In terms of no vehicles in household, the demographic groups most similar to Bermudans are Immigrants from France (12.9%, a difference of 1.2%), Immigrants from Singapore (12.9%, a difference of 1.3%), Immigrants from Morocco (12.6%, a difference of 1.3%), Immigrants from Northern Africa (12.6%, a difference of 1.4%), and Immigrants from Albania (13.0%, a difference of 1.5%).
| Demographics | Rating | Rank | No Vehicles in Household |
| Africans | 0.4 /100 | #265 | Tragic 12.3% |
| Israelis | 0.3 /100 | #266 | Tragic 12.4% |
| Immigrants | Europe | 0.3 /100 | #267 | Tragic 12.5% |
| Immigrants | Africa | 0.2 /100 | #268 | Tragic 12.5% |
| Panamanians | 0.2 /100 | #269 | Tragic 12.5% |
| Immigrants | Northern Africa | 0.2 /100 | #270 | Tragic 12.6% |
| Immigrants | Morocco | 0.2 /100 | #271 | Tragic 12.6% |
| Bermudans | 0.1 /100 | #272 | Tragic 12.8% |
| Immigrants | France | 0.1 /100 | #273 | Tragic 12.9% |
| Immigrants | Singapore | 0.1 /100 | #274 | Tragic 12.9% |
| Immigrants | Albania | 0.1 /100 | #275 | Tragic 13.0% |
| Immigrants | Southern Europe | 0.1 /100 | #276 | Tragic 13.0% |
| Aleuts | 0.1 /100 | #277 | Tragic 13.0% |
| Immigrants | Croatia | 0.1 /100 | #278 | Tragic 13.0% |
| Mongolians | 0.0 /100 | #279 | Tragic 13.1% |