Native/Alaskan vs West Indian No Vehicles in Household
COMPARE
Native/Alaskan
West Indian
No Vehicles in Household
No Vehicles in Household Comparison
Natives/Alaskans
West Indians
10.5%
NO VEHICLES IN HOUSEHOLD
43.7/ 100
METRIC RATING
183rd/ 347
METRIC RANK
23.7%
NO VEHICLES IN HOUSEHOLD
0.0/ 100
METRIC RATING
330th/ 347
METRIC RANK
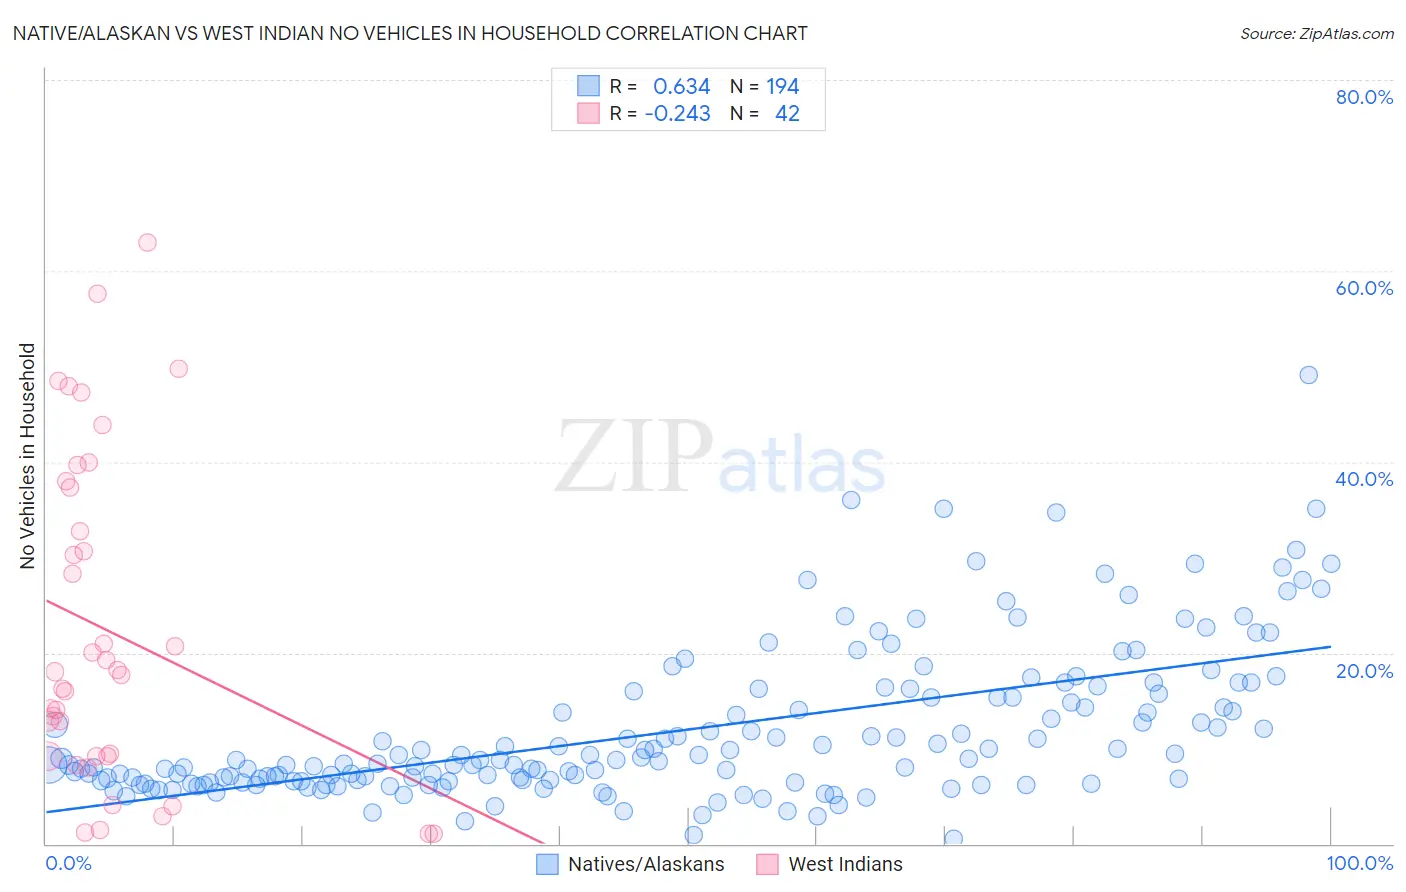
Native/Alaskan vs West Indian No Vehicles in Household Correlation Chart
The statistical analysis conducted on geographies consisting of 510,438,252 people shows a significant positive correlation between the proportion of Natives/Alaskans and percentage of households with no vehicle available in the United States with a correlation coefficient (R) of 0.634 and weighted average of 10.5%. Similarly, the statistical analysis conducted on geographies consisting of 253,703,061 people shows a weak negative correlation between the proportion of West Indians and percentage of households with no vehicle available in the United States with a correlation coefficient (R) of -0.243 and weighted average of 23.7%, a difference of 125.9%.
No Vehicles in Household Correlation Summary
| Measurement | Native/Alaskan | West Indian |
| Minimum | 0.55% | 1.0% |
| Maximum | 49.1% | 63.0% |
| Range | 48.5% | 62.0% |
| Mean | 11.9% | 22.3% |
| Median | 8.8% | 17.9% |
| Interquartile 25% (IQ1) | 6.6% | 9.2% |
| Interquartile 75% (IQ3) | 15.3% | 37.3% |
| Interquartile Range (IQR) | 8.8% | 28.1% |
| Standard Deviation (Sample) | 7.9% | 17.0% |
| Standard Deviation (Population) | 7.9% | 16.8% |
Similar Demographics by No Vehicles in Household
Demographics Similar to Natives/Alaskans by No Vehicles in Household
In terms of no vehicles in household, the demographic groups most similar to Natives/Alaskans are Immigrants from Bulgaria (10.5%, a difference of 0.020%), Immigrants from Colombia (10.5%, a difference of 0.060%), Immigrants from Nepal (10.5%, a difference of 0.17%), Arab (10.5%, a difference of 0.22%), and South American (10.5%, a difference of 0.24%).
| Demographics | Rating | Rank | No Vehicles in Household |
| French American Indians | 49.1 /100 | #176 | Average 10.4% |
| Immigrants | El Salvador | 49.1 /100 | #177 | Average 10.4% |
| Immigrants | Ethiopia | 48.0 /100 | #178 | Average 10.4% |
| Ethiopians | 45.8 /100 | #179 | Average 10.5% |
| Arabs | 45.3 /100 | #180 | Average 10.5% |
| Immigrants | Colombia | 44.1 /100 | #181 | Average 10.5% |
| Immigrants | Bulgaria | 43.8 /100 | #182 | Average 10.5% |
| Natives/Alaskans | 43.7 /100 | #183 | Average 10.5% |
| Immigrants | Nepal | 42.4 /100 | #184 | Average 10.5% |
| South Americans | 41.9 /100 | #185 | Average 10.5% |
| German Russians | 40.6 /100 | #186 | Average 10.5% |
| Immigrants | Poland | 38.4 /100 | #187 | Fair 10.6% |
| Immigrants | Armenia | 37.5 /100 | #188 | Fair 10.6% |
| Immigrants | Eritrea | 36.3 /100 | #189 | Fair 10.6% |
| Immigrants | North Macedonia | 34.6 /100 | #190 | Fair 10.6% |
Demographics Similar to West Indians by No Vehicles in Household
In terms of no vehicles in household, the demographic groups most similar to West Indians are Trinidadian and Tobagonian (23.7%, a difference of 0.18%), Immigrants from Ecuador (23.8%, a difference of 0.51%), Immigrants from Trinidad and Tobago (24.6%, a difference of 3.9%), Ecuadorian (22.8%, a difference of 4.2%), and Immigrants from Dominica (22.2%, a difference of 6.6%).
| Demographics | Rating | Rank | No Vehicles in Household |
| Immigrants | Yemen | 0.0 /100 | #323 | Tragic 19.5% |
| Immigrants | Caribbean | 0.0 /100 | #324 | Tragic 19.6% |
| Senegalese | 0.0 /100 | #325 | Tragic 19.8% |
| Immigrants | West Indies | 0.0 /100 | #326 | Tragic 20.5% |
| Immigrants | Senegal | 0.0 /100 | #327 | Tragic 21.1% |
| Immigrants | Dominica | 0.0 /100 | #328 | Tragic 22.2% |
| Ecuadorians | 0.0 /100 | #329 | Tragic 22.8% |
| West Indians | 0.0 /100 | #330 | Tragic 23.7% |
| Trinidadians and Tobagonians | 0.0 /100 | #331 | Tragic 23.7% |
| Immigrants | Ecuador | 0.0 /100 | #332 | Tragic 23.8% |
| Immigrants | Trinidad and Tobago | 0.0 /100 | #333 | Tragic 24.6% |
| Immigrants | Bangladesh | 0.0 /100 | #334 | Tragic 25.8% |
| Barbadians | 0.0 /100 | #335 | Tragic 26.1% |
| Vietnamese | 0.0 /100 | #336 | Tragic 26.2% |
| Immigrants | Uzbekistan | 0.0 /100 | #337 | Tragic 26.7% |