Native/Alaskan vs Immigrants from Ireland No Vehicles in Household
COMPARE
Native/Alaskan
Immigrants from Ireland
No Vehicles in Household
No Vehicles in Household Comparison
Natives/Alaskans
Immigrants from Ireland
10.5%
NO VEHICLES IN HOUSEHOLD
43.7/ 100
METRIC RATING
183rd/ 347
METRIC RANK
13.7%
NO VEHICLES IN HOUSEHOLD
0.0/ 100
METRIC RATING
287th/ 347
METRIC RANK
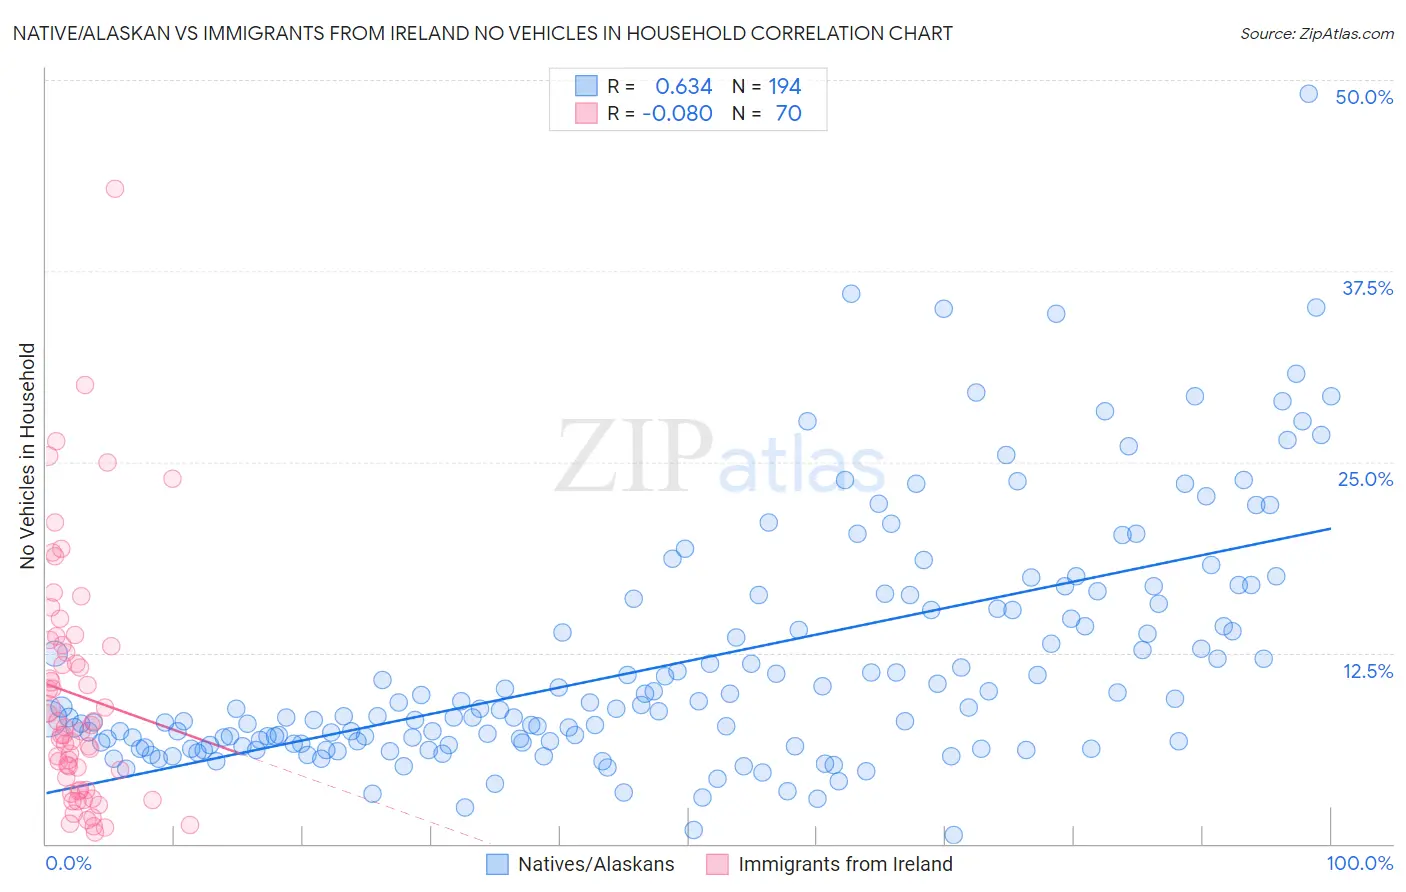
Native/Alaskan vs Immigrants from Ireland No Vehicles in Household Correlation Chart
The statistical analysis conducted on geographies consisting of 510,438,252 people shows a significant positive correlation between the proportion of Natives/Alaskans and percentage of households with no vehicle available in the United States with a correlation coefficient (R) of 0.634 and weighted average of 10.5%. Similarly, the statistical analysis conducted on geographies consisting of 240,526,628 people shows a slight negative correlation between the proportion of Immigrants from Ireland and percentage of households with no vehicle available in the United States with a correlation coefficient (R) of -0.080 and weighted average of 13.7%, a difference of 30.7%.
No Vehicles in Household Correlation Summary
| Measurement | Native/Alaskan | Immigrants from Ireland |
| Minimum | 0.55% | 0.75% |
| Maximum | 49.1% | 42.9% |
| Range | 48.5% | 42.1% |
| Mean | 11.9% | 9.7% |
| Median | 8.8% | 7.5% |
| Interquartile 25% (IQ1) | 6.6% | 3.5% |
| Interquartile 75% (IQ3) | 15.3% | 13.0% |
| Interquartile Range (IQR) | 8.8% | 9.5% |
| Standard Deviation (Sample) | 7.9% | 8.0% |
| Standard Deviation (Population) | 7.9% | 7.9% |
Similar Demographics by No Vehicles in Household
Demographics Similar to Natives/Alaskans by No Vehicles in Household
In terms of no vehicles in household, the demographic groups most similar to Natives/Alaskans are Immigrants from Bulgaria (10.5%, a difference of 0.020%), Immigrants from Colombia (10.5%, a difference of 0.060%), Immigrants from Nepal (10.5%, a difference of 0.17%), Arab (10.5%, a difference of 0.22%), and South American (10.5%, a difference of 0.24%).
| Demographics | Rating | Rank | No Vehicles in Household |
| French American Indians | 49.1 /100 | #176 | Average 10.4% |
| Immigrants | El Salvador | 49.1 /100 | #177 | Average 10.4% |
| Immigrants | Ethiopia | 48.0 /100 | #178 | Average 10.4% |
| Ethiopians | 45.8 /100 | #179 | Average 10.5% |
| Arabs | 45.3 /100 | #180 | Average 10.5% |
| Immigrants | Colombia | 44.1 /100 | #181 | Average 10.5% |
| Immigrants | Bulgaria | 43.8 /100 | #182 | Average 10.5% |
| Natives/Alaskans | 43.7 /100 | #183 | Average 10.5% |
| Immigrants | Nepal | 42.4 /100 | #184 | Average 10.5% |
| South Americans | 41.9 /100 | #185 | Average 10.5% |
| German Russians | 40.6 /100 | #186 | Average 10.5% |
| Immigrants | Poland | 38.4 /100 | #187 | Fair 10.6% |
| Immigrants | Armenia | 37.5 /100 | #188 | Fair 10.6% |
| Immigrants | Eritrea | 36.3 /100 | #189 | Fair 10.6% |
| Immigrants | North Macedonia | 34.6 /100 | #190 | Fair 10.6% |
Demographics Similar to Immigrants from Ireland by No Vehicles in Household
In terms of no vehicles in household, the demographic groups most similar to Immigrants from Ireland are Hopi (13.7%, a difference of 0.13%), Colville (13.7%, a difference of 0.21%), Immigrants from Australia (13.8%, a difference of 0.80%), Immigrants from Eastern Europe (13.6%, a difference of 0.87%), and Immigrants from Malaysia (13.6%, a difference of 0.92%).
| Demographics | Rating | Rank | No Vehicles in Household |
| Alsatians | 0.0 /100 | #280 | Tragic 13.2% |
| Central American Indians | 0.0 /100 | #281 | Tragic 13.3% |
| Immigrants | Eastern Asia | 0.0 /100 | #282 | Tragic 13.5% |
| Immigrants | Kazakhstan | 0.0 /100 | #283 | Tragic 13.6% |
| Immigrants | Malaysia | 0.0 /100 | #284 | Tragic 13.6% |
| Immigrants | Eastern Europe | 0.0 /100 | #285 | Tragic 13.6% |
| Colville | 0.0 /100 | #286 | Tragic 13.7% |
| Immigrants | Ireland | 0.0 /100 | #287 | Tragic 13.7% |
| Hopi | 0.0 /100 | #288 | Tragic 13.7% |
| Immigrants | Australia | 0.0 /100 | #289 | Tragic 13.8% |
| Indians (Asian) | 0.0 /100 | #290 | Tragic 14.1% |
| Okinawans | 0.0 /100 | #291 | Tragic 14.1% |
| Pima | 0.0 /100 | #292 | Tragic 14.1% |
| Immigrants | Jamaica | 0.0 /100 | #293 | Tragic 14.2% |
| Belizeans | 0.0 /100 | #294 | Tragic 14.3% |