Native/Alaskan vs Immigrants from Congo No Vehicles in Household
COMPARE
Native/Alaskan
Immigrants from Congo
No Vehicles in Household
No Vehicles in Household Comparison
Natives/Alaskans
Immigrants from Congo
10.5%
NO VEHICLES IN HOUSEHOLD
43.7/ 100
METRIC RATING
183rd/ 347
METRIC RANK
10.1%
NO VEHICLES IN HOUSEHOLD
73.0/ 100
METRIC RATING
152nd/ 347
METRIC RANK
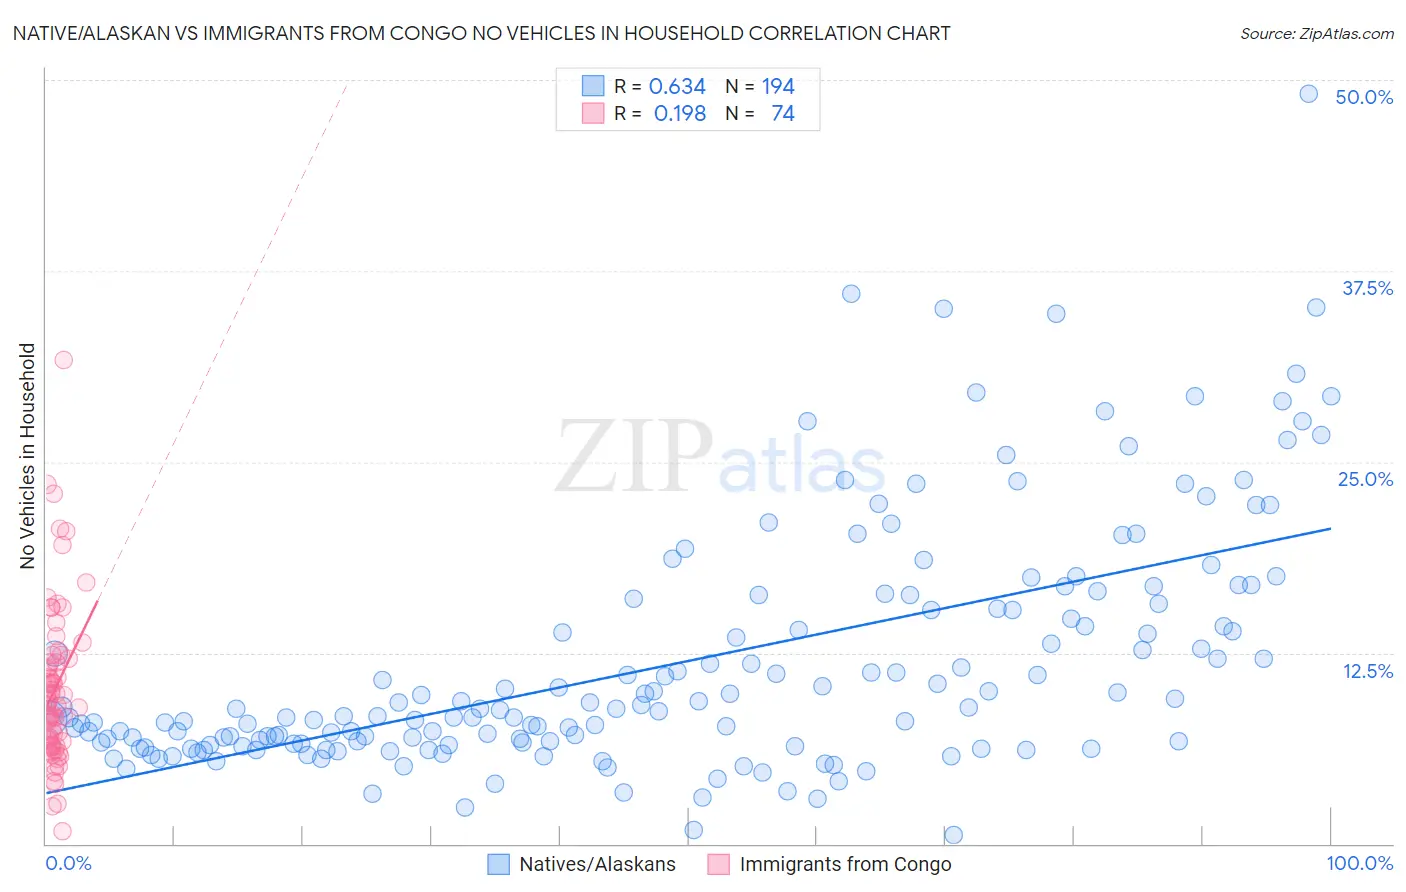
Native/Alaskan vs Immigrants from Congo No Vehicles in Household Correlation Chart
The statistical analysis conducted on geographies consisting of 510,438,252 people shows a significant positive correlation between the proportion of Natives/Alaskans and percentage of households with no vehicle available in the United States with a correlation coefficient (R) of 0.634 and weighted average of 10.5%. Similarly, the statistical analysis conducted on geographies consisting of 92,060,649 people shows a poor positive correlation between the proportion of Immigrants from Congo and percentage of households with no vehicle available in the United States with a correlation coefficient (R) of 0.198 and weighted average of 10.1%, a difference of 4.4%.
No Vehicles in Household Correlation Summary
| Measurement | Native/Alaskan | Immigrants from Congo |
| Minimum | 0.55% | 0.81% |
| Maximum | 49.1% | 31.7% |
| Range | 48.5% | 30.9% |
| Mean | 11.9% | 10.2% |
| Median | 8.8% | 9.2% |
| Interquartile 25% (IQ1) | 6.6% | 6.5% |
| Interquartile 75% (IQ3) | 15.3% | 12.1% |
| Interquartile Range (IQR) | 8.8% | 5.7% |
| Standard Deviation (Sample) | 7.9% | 5.3% |
| Standard Deviation (Population) | 7.9% | 5.2% |
Similar Demographics by No Vehicles in Household
Demographics Similar to Natives/Alaskans by No Vehicles in Household
In terms of no vehicles in household, the demographic groups most similar to Natives/Alaskans are Immigrants from Bulgaria (10.5%, a difference of 0.020%), Immigrants from Colombia (10.5%, a difference of 0.060%), Immigrants from Nepal (10.5%, a difference of 0.17%), Arab (10.5%, a difference of 0.22%), and South American (10.5%, a difference of 0.24%).
| Demographics | Rating | Rank | No Vehicles in Household |
| French American Indians | 49.1 /100 | #176 | Average 10.4% |
| Immigrants | El Salvador | 49.1 /100 | #177 | Average 10.4% |
| Immigrants | Ethiopia | 48.0 /100 | #178 | Average 10.4% |
| Ethiopians | 45.8 /100 | #179 | Average 10.5% |
| Arabs | 45.3 /100 | #180 | Average 10.5% |
| Immigrants | Colombia | 44.1 /100 | #181 | Average 10.5% |
| Immigrants | Bulgaria | 43.8 /100 | #182 | Average 10.5% |
| Natives/Alaskans | 43.7 /100 | #183 | Average 10.5% |
| Immigrants | Nepal | 42.4 /100 | #184 | Average 10.5% |
| South Americans | 41.9 /100 | #185 | Average 10.5% |
| German Russians | 40.6 /100 | #186 | Average 10.5% |
| Immigrants | Poland | 38.4 /100 | #187 | Fair 10.6% |
| Immigrants | Armenia | 37.5 /100 | #188 | Fair 10.6% |
| Immigrants | Eritrea | 36.3 /100 | #189 | Fair 10.6% |
| Immigrants | North Macedonia | 34.6 /100 | #190 | Fair 10.6% |
Demographics Similar to Immigrants from Congo by No Vehicles in Household
In terms of no vehicles in household, the demographic groups most similar to Immigrants from Congo are Tlingit-Haida (10.1%, a difference of 0.090%), Sioux (10.1%, a difference of 0.11%), Salvadoran (10.1%, a difference of 0.12%), Immigrants from Eastern Africa (10.0%, a difference of 0.14%), and Colombian (10.0%, a difference of 0.15%).
| Demographics | Rating | Rank | No Vehicles in Household |
| Bahamians | 81.0 /100 | #145 | Excellent 9.9% |
| Hungarians | 80.0 /100 | #146 | Excellent 9.9% |
| Immigrants | Nicaragua | 79.8 /100 | #147 | Good 9.9% |
| Immigrants | Bosnia and Herzegovina | 79.1 /100 | #148 | Good 9.9% |
| Immigrants | Uganda | 76.1 /100 | #149 | Good 10.0% |
| Colombians | 73.9 /100 | #150 | Good 10.0% |
| Immigrants | Eastern Africa | 73.8 /100 | #151 | Good 10.0% |
| Immigrants | Congo | 73.0 /100 | #152 | Good 10.1% |
| Tlingit-Haida | 72.5 /100 | #153 | Good 10.1% |
| Sioux | 72.4 /100 | #154 | Good 10.1% |
| Salvadorans | 72.4 /100 | #155 | Good 10.1% |
| Immigrants | Micronesia | 70.9 /100 | #156 | Good 10.1% |
| Australians | 70.6 /100 | #157 | Good 10.1% |
| Spanish American Indians | 70.2 /100 | #158 | Good 10.1% |
| Immigrants | Indonesia | 69.3 /100 | #159 | Good 10.1% |