Native/Alaskan vs Bermudan Poverty
COMPARE
Native/Alaskan
Bermudan
Poverty
Poverty Comparison
Natives/Alaskans
Bermudans
18.1%
POVERTY
0.0/ 100
METRIC RATING
332nd/ 347
METRIC RANK
13.3%
POVERTY
3.7/ 100
METRIC RATING
214th/ 347
METRIC RANK
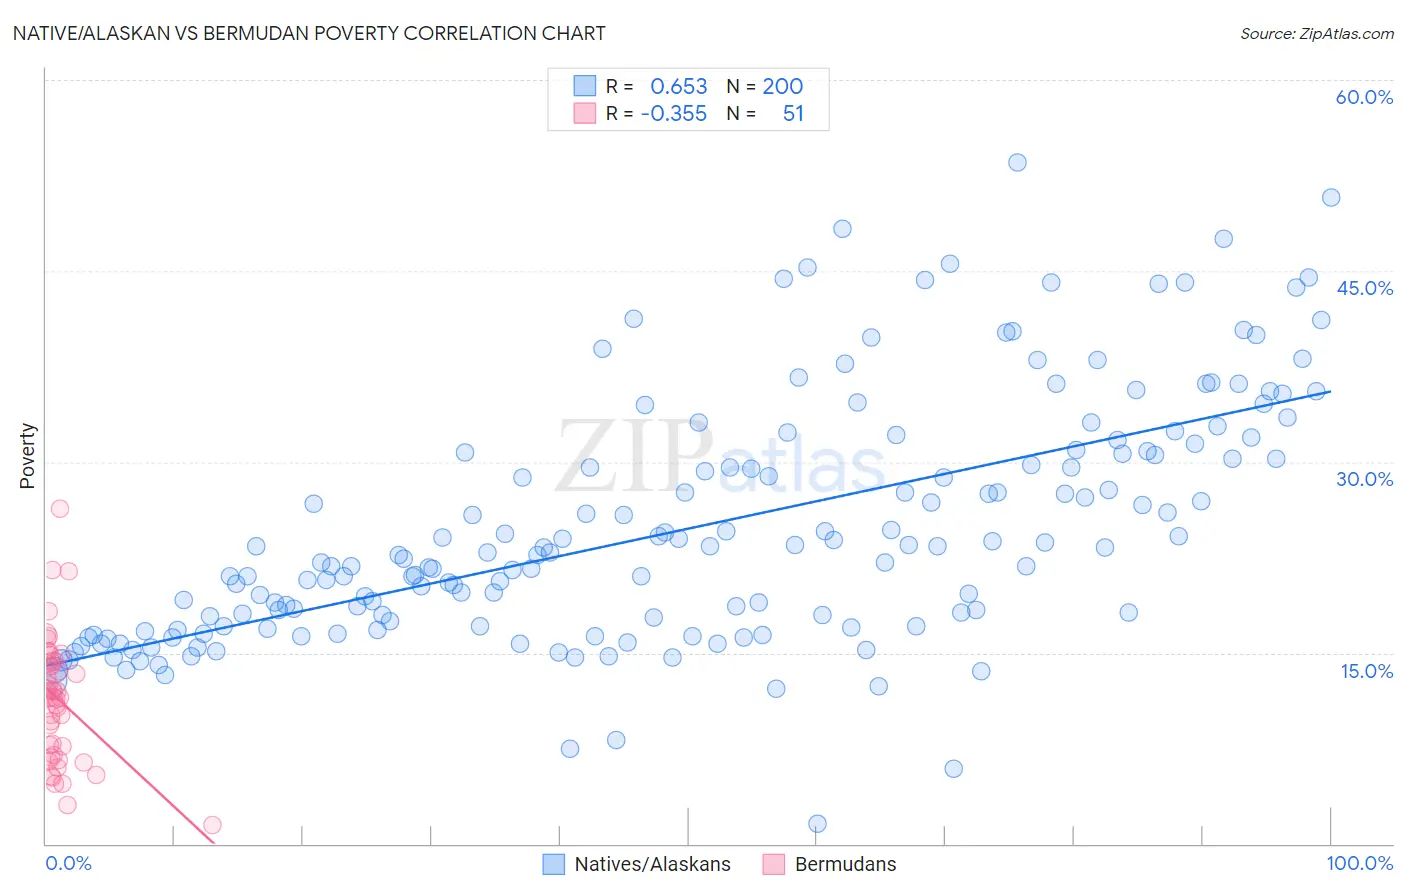
Native/Alaskan vs Bermudan Poverty Correlation Chart
The statistical analysis conducted on geographies consisting of 512,638,915 people shows a significant positive correlation between the proportion of Natives/Alaskans and poverty level in the United States with a correlation coefficient (R) of 0.653 and weighted average of 18.1%. Similarly, the statistical analysis conducted on geographies consisting of 55,716,155 people shows a mild negative correlation between the proportion of Bermudans and poverty level in the United States with a correlation coefficient (R) of -0.355 and weighted average of 13.3%, a difference of 35.9%.
Poverty Correlation Summary
| Measurement | Native/Alaskan | Bermudan |
| Minimum | 1.6% | 1.5% |
| Maximum | 53.5% | 26.3% |
| Range | 51.9% | 24.9% |
| Mean | 24.8% | 11.3% |
| Median | 22.8% | 11.5% |
| Interquartile 25% (IQ1) | 17.1% | 7.0% |
| Interquartile 75% (IQ3) | 30.7% | 14.3% |
| Interquartile Range (IQR) | 13.6% | 7.3% |
| Standard Deviation (Sample) | 9.6% | 4.9% |
| Standard Deviation (Population) | 9.5% | 4.9% |
Similar Demographics by Poverty
Demographics Similar to Natives/Alaskans by Poverty
In terms of poverty, the demographic groups most similar to Natives/Alaskans are Immigrants from Dominican Republic (17.8%, a difference of 1.4%), Houma (18.4%, a difference of 2.0%), Apache (18.4%, a difference of 2.0%), Dominican (17.6%, a difference of 2.4%), and Black/African American (17.3%, a difference of 4.7%).
| Demographics | Rating | Rank | Poverty |
| Central American Indians | 0.0 /100 | #325 | Tragic 16.7% |
| Paiute | 0.0 /100 | #326 | Tragic 16.7% |
| Kiowa | 0.0 /100 | #327 | Tragic 16.8% |
| Ute | 0.0 /100 | #328 | Tragic 16.9% |
| Blacks/African Americans | 0.0 /100 | #329 | Tragic 17.3% |
| Dominicans | 0.0 /100 | #330 | Tragic 17.6% |
| Immigrants | Dominican Republic | 0.0 /100 | #331 | Tragic 17.8% |
| Natives/Alaskans | 0.0 /100 | #332 | Tragic 18.1% |
| Houma | 0.0 /100 | #333 | Tragic 18.4% |
| Apache | 0.0 /100 | #334 | Tragic 18.4% |
| Cheyenne | 0.0 /100 | #335 | Tragic 18.9% |
| Pueblo | 0.0 /100 | #336 | Tragic 19.4% |
| Sioux | 0.0 /100 | #337 | Tragic 19.8% |
| Yuman | 0.0 /100 | #338 | Tragic 20.2% |
| Crow | 0.0 /100 | #339 | Tragic 20.7% |
Demographics Similar to Bermudans by Poverty
In terms of poverty, the demographic groups most similar to Bermudans are Immigrants from Panama (13.3%, a difference of 0.25%), Japanese (13.3%, a difference of 0.26%), Nonimmigrants (13.3%, a difference of 0.26%), Immigrants from Uzbekistan (13.3%, a difference of 0.30%), and Immigrants from Thailand (13.3%, a difference of 0.36%).
| Demographics | Rating | Rank | Poverty |
| Panamanians | 6.6 /100 | #207 | Tragic 13.1% |
| Ugandans | 6.2 /100 | #208 | Tragic 13.1% |
| Malaysians | 6.1 /100 | #209 | Tragic 13.1% |
| Immigrants | Azores | 6.1 /100 | #210 | Tragic 13.1% |
| Moroccans | 5.2 /100 | #211 | Tragic 13.2% |
| Immigrants | Immigrants | 4.3 /100 | #212 | Tragic 13.2% |
| Immigrants | Panama | 4.1 /100 | #213 | Tragic 13.3% |
| Bermudans | 3.7 /100 | #214 | Tragic 13.3% |
| Japanese | 3.3 /100 | #215 | Tragic 13.3% |
| Immigrants | Nonimmigrants | 3.3 /100 | #216 | Tragic 13.3% |
| Immigrants | Uzbekistan | 3.2 /100 | #217 | Tragic 13.3% |
| Immigrants | Thailand | 3.1 /100 | #218 | Tragic 13.3% |
| Immigrants | Cambodia | 3.0 /100 | #219 | Tragic 13.4% |
| Americans | 2.9 /100 | #220 | Tragic 13.4% |
| Alsatians | 2.6 /100 | #221 | Tragic 13.4% |