Black/African American vs Bermudan No Vehicles in Household
COMPARE
Black/African American
Bermudan
No Vehicles in Household
No Vehicles in Household Comparison
Blacks/African Americans
Bermudans
11.9%
NO VEHICLES IN HOUSEHOLD
1.6/ 100
METRIC RATING
251st/ 347
METRIC RANK
12.8%
NO VEHICLES IN HOUSEHOLD
0.1/ 100
METRIC RATING
272nd/ 347
METRIC RANK
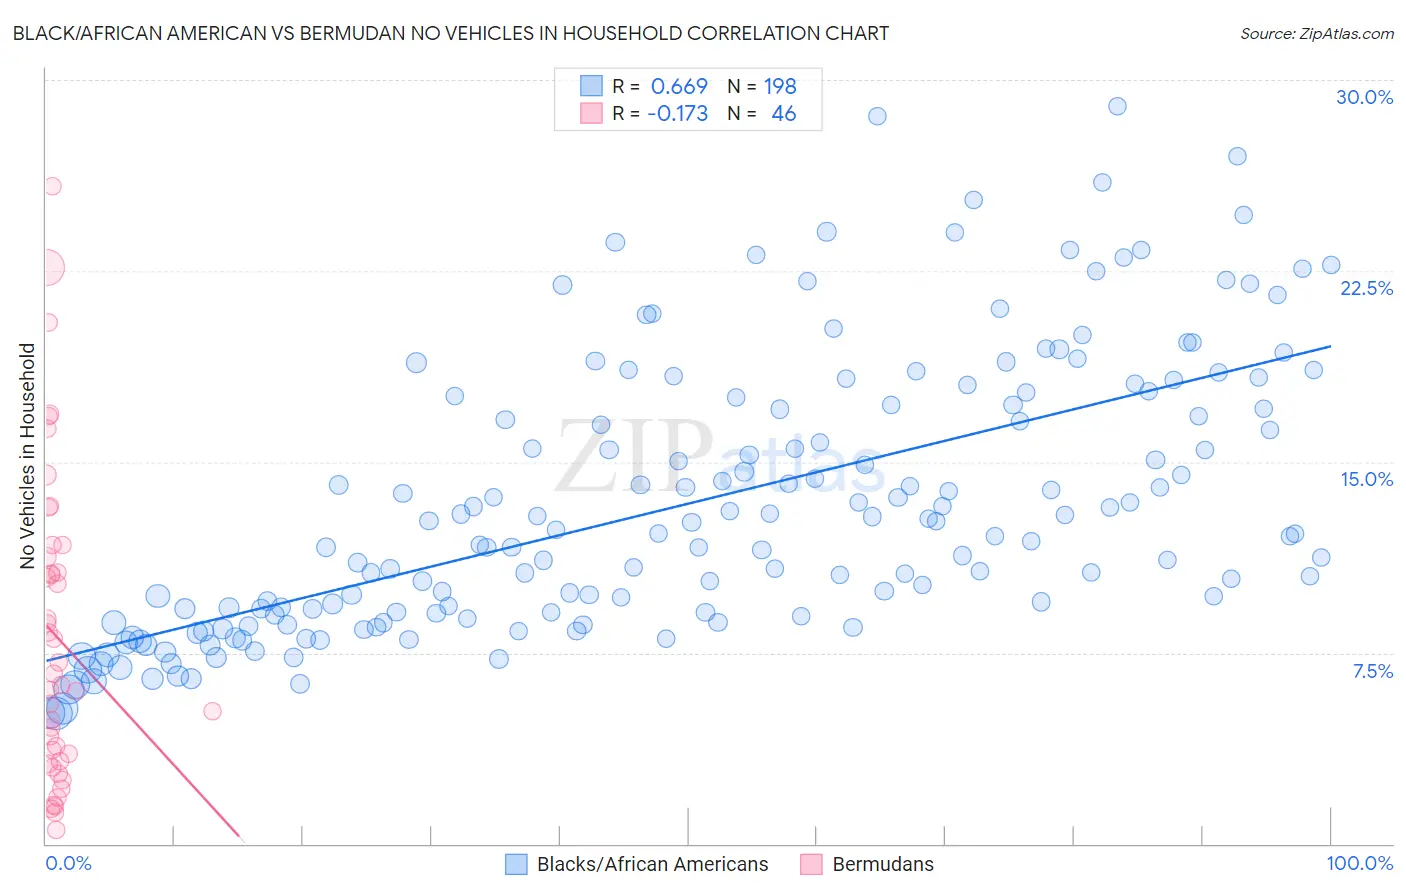
Black/African American vs Bermudan No Vehicles in Household Correlation Chart
The statistical analysis conducted on geographies consisting of 549,724,013 people shows a significant positive correlation between the proportion of Blacks/African Americans and percentage of households with no vehicle available in the United States with a correlation coefficient (R) of 0.669 and weighted average of 11.9%. Similarly, the statistical analysis conducted on geographies consisting of 55,615,567 people shows a poor negative correlation between the proportion of Bermudans and percentage of households with no vehicle available in the United States with a correlation coefficient (R) of -0.173 and weighted average of 12.8%, a difference of 7.8%.
No Vehicles in Household Correlation Summary
| Measurement | Black/African American | Bermudan |
| Minimum | 5.1% | 0.54% |
| Maximum | 29.0% | 25.8% |
| Range | 23.8% | 25.3% |
| Mean | 13.4% | 8.1% |
| Median | 12.2% | 6.5% |
| Interquartile 25% (IQ1) | 9.1% | 3.2% |
| Interquartile 75% (IQ3) | 17.3% | 11.3% |
| Interquartile Range (IQR) | 8.2% | 8.0% |
| Standard Deviation (Sample) | 5.4% | 6.0% |
| Standard Deviation (Population) | 5.3% | 6.0% |
Similar Demographics by No Vehicles in Household
Demographics Similar to Blacks/African Americans by No Vehicles in Household
In terms of no vehicles in household, the demographic groups most similar to Blacks/African Americans are Immigrants from Serbia (11.9%, a difference of 0.25%), Egyptian (11.9%, a difference of 0.32%), Paiute (11.8%, a difference of 0.35%), Immigrants from Nigeria (11.8%, a difference of 0.57%), and Immigrants from Belgium (11.8%, a difference of 0.60%).
| Demographics | Rating | Rank | No Vehicles in Household |
| Immigrants | Portugal | 2.2 /100 | #244 | Tragic 11.7% |
| Immigrants | Honduras | 2.1 /100 | #245 | Tragic 11.8% |
| Menominee | 2.0 /100 | #246 | Tragic 11.8% |
| Immigrants | Czechoslovakia | 2.0 /100 | #247 | Tragic 11.8% |
| Immigrants | Belgium | 1.9 /100 | #248 | Tragic 11.8% |
| Immigrants | Nigeria | 1.9 /100 | #249 | Tragic 11.8% |
| Paiute | 1.8 /100 | #250 | Tragic 11.8% |
| Blacks/African Americans | 1.6 /100 | #251 | Tragic 11.9% |
| Immigrants | Serbia | 1.5 /100 | #252 | Tragic 11.9% |
| Egyptians | 1.4 /100 | #253 | Tragic 11.9% |
| Immigrants | Uruguay | 1.3 /100 | #254 | Tragic 11.9% |
| Hondurans | 1.2 /100 | #255 | Tragic 12.0% |
| Liberians | 1.2 /100 | #256 | Tragic 12.0% |
| Nigerians | 0.9 /100 | #257 | Tragic 12.1% |
| South American Indians | 0.9 /100 | #258 | Tragic 12.1% |
Demographics Similar to Bermudans by No Vehicles in Household
In terms of no vehicles in household, the demographic groups most similar to Bermudans are Immigrants from France (12.9%, a difference of 1.2%), Immigrants from Singapore (12.9%, a difference of 1.3%), Immigrants from Morocco (12.6%, a difference of 1.3%), Immigrants from Northern Africa (12.6%, a difference of 1.4%), and Immigrants from Albania (13.0%, a difference of 1.5%).
| Demographics | Rating | Rank | No Vehicles in Household |
| Africans | 0.4 /100 | #265 | Tragic 12.3% |
| Israelis | 0.3 /100 | #266 | Tragic 12.4% |
| Immigrants | Europe | 0.3 /100 | #267 | Tragic 12.5% |
| Immigrants | Africa | 0.2 /100 | #268 | Tragic 12.5% |
| Panamanians | 0.2 /100 | #269 | Tragic 12.5% |
| Immigrants | Northern Africa | 0.2 /100 | #270 | Tragic 12.6% |
| Immigrants | Morocco | 0.2 /100 | #271 | Tragic 12.6% |
| Bermudans | 0.1 /100 | #272 | Tragic 12.8% |
| Immigrants | France | 0.1 /100 | #273 | Tragic 12.9% |
| Immigrants | Singapore | 0.1 /100 | #274 | Tragic 12.9% |
| Immigrants | Albania | 0.1 /100 | #275 | Tragic 13.0% |
| Immigrants | Southern Europe | 0.1 /100 | #276 | Tragic 13.0% |
| Aleuts | 0.1 /100 | #277 | Tragic 13.0% |
| Immigrants | Croatia | 0.1 /100 | #278 | Tragic 13.0% |
| Mongolians | 0.0 /100 | #279 | Tragic 13.1% |