Immigrants from Pakistan vs Russian 3 or more Vehicles in Household
COMPARE
Immigrants from Pakistan
Russian
3 or more Vehicles in Household
3 or more Vehicles in Household Comparison
Immigrants from Pakistan
Russians
19.8%
3 OR MORE VEHICLES IN HOUSEHOLD
68.2/ 100
METRIC RATING
159th/ 347
METRIC RANK
18.8%
3 OR MORE VEHICLES IN HOUSEHOLD
14.2/ 100
METRIC RATING
205th/ 347
METRIC RANK
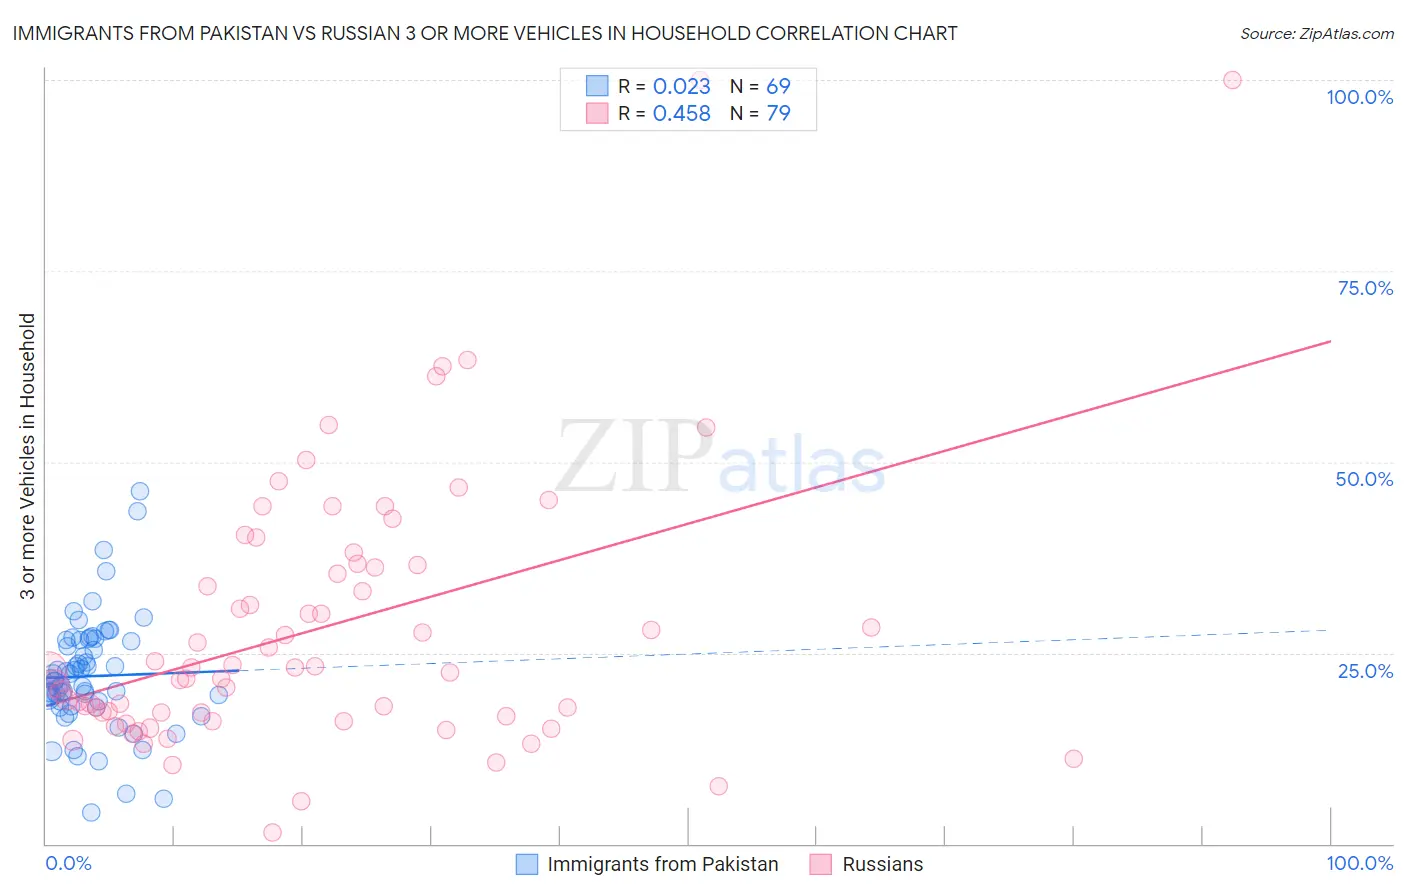
Immigrants from Pakistan vs Russian 3 or more Vehicles in Household Correlation Chart
The statistical analysis conducted on geographies consisting of 283,714,957 people shows no correlation between the proportion of Immigrants from Pakistan and percentage of households with 3 or more vehicles available in the United States with a correlation coefficient (R) of 0.023 and weighted average of 19.8%. Similarly, the statistical analysis conducted on geographies consisting of 511,489,860 people shows a moderate positive correlation between the proportion of Russians and percentage of households with 3 or more vehicles available in the United States with a correlation coefficient (R) of 0.458 and weighted average of 18.8%, a difference of 5.0%.
3 or more Vehicles in Household Correlation Summary
| Measurement | Immigrants from Pakistan | Russian |
| Minimum | 4.0% | 1.4% |
| Maximum | 46.2% | 100.0% |
| Range | 42.1% | 98.6% |
| Mean | 21.9% | 28.3% |
| Median | 21.3% | 22.8% |
| Interquartile 25% (IQ1) | 18.3% | 16.7% |
| Interquartile 75% (IQ3) | 26.6% | 36.5% |
| Interquartile Range (IQR) | 8.3% | 19.9% |
| Standard Deviation (Sample) | 7.5% | 18.0% |
| Standard Deviation (Population) | 7.5% | 17.9% |
Similar Demographics by 3 or more Vehicles in Household
Demographics Similar to Immigrants from Pakistan by 3 or more Vehicles in Household
In terms of 3 or more vehicles in household, the demographic groups most similar to Immigrants from Pakistan are Armenian (19.8%, a difference of 0.050%), Immigrants from Lebanon (19.8%, a difference of 0.050%), Hungarian (19.8%, a difference of 0.21%), Immigrants from Guatemala (19.7%, a difference of 0.22%), and Thai (19.8%, a difference of 0.26%).
| Demographics | Rating | Rank | 3 or more Vehicles in Household |
| Lebanese | 79.8 /100 | #152 | Good 20.0% |
| Yuman | 75.6 /100 | #153 | Good 19.9% |
| Immigrants | Jordan | 75.0 /100 | #154 | Good 19.9% |
| Tlingit-Haida | 73.4 /100 | #155 | Good 19.9% |
| Thais | 71.1 /100 | #156 | Good 19.8% |
| Hungarians | 70.5 /100 | #157 | Good 19.8% |
| Armenians | 68.8 /100 | #158 | Good 19.8% |
| Immigrants | Pakistan | 68.2 /100 | #159 | Good 19.8% |
| Immigrants | Lebanon | 67.6 /100 | #160 | Good 19.8% |
| Immigrants | Guatemala | 65.6 /100 | #161 | Good 19.7% |
| Estonians | 63.2 /100 | #162 | Good 19.7% |
| Chileans | 63.0 /100 | #163 | Good 19.7% |
| Yugoslavians | 62.9 /100 | #164 | Good 19.7% |
| Immigrants | Costa Rica | 61.9 /100 | #165 | Good 19.7% |
| Immigrants | Cameroon | 60.9 /100 | #166 | Good 19.7% |
Demographics Similar to Russians by 3 or more Vehicles in Household
In terms of 3 or more vehicles in household, the demographic groups most similar to Russians are Immigrants from Eastern Asia (18.8%, a difference of 0.010%), Immigrants from Romania (18.9%, a difference of 0.070%), Immigrants from Chile (18.8%, a difference of 0.090%), Tohono O'odham (18.9%, a difference of 0.10%), and Immigrants from Burma/Myanmar (18.8%, a difference of 0.10%).
| Demographics | Rating | Rank | 3 or more Vehicles in Household |
| Egyptians | 19.5 /100 | #198 | Poor 19.0% |
| Immigrants | Norway | 19.0 /100 | #199 | Poor 19.0% |
| Argentineans | 18.2 /100 | #200 | Poor 18.9% |
| Arabs | 17.7 /100 | #201 | Poor 18.9% |
| Immigrants | Austria | 15.4 /100 | #202 | Poor 18.9% |
| Tohono O'odham | 14.8 /100 | #203 | Poor 18.9% |
| Immigrants | Romania | 14.6 /100 | #204 | Poor 18.9% |
| Russians | 14.2 /100 | #205 | Poor 18.8% |
| Immigrants | Eastern Asia | 14.1 /100 | #206 | Poor 18.8% |
| Immigrants | Chile | 13.6 /100 | #207 | Poor 18.8% |
| Immigrants | Burma/Myanmar | 13.6 /100 | #208 | Poor 18.8% |
| Immigrants | Egypt | 13.5 /100 | #209 | Poor 18.8% |
| Bulgarians | 13.1 /100 | #210 | Poor 18.8% |
| Immigrants | Kenya | 12.4 /100 | #211 | Poor 18.8% |
| Panamanians | 11.6 /100 | #212 | Poor 18.8% |