Immigrants from Pakistan vs Immigrants from Philippines 3 or more Vehicles in Household
COMPARE
Immigrants from Pakistan
Immigrants from Philippines
3 or more Vehicles in Household
3 or more Vehicles in Household Comparison
Immigrants from Pakistan
Immigrants from Philippines
19.8%
3 OR MORE VEHICLES IN HOUSEHOLD
68.2/ 100
METRIC RATING
159th/ 347
METRIC RANK
23.8%
3 OR MORE VEHICLES IN HOUSEHOLD
100.0/ 100
METRIC RATING
22nd/ 347
METRIC RANK
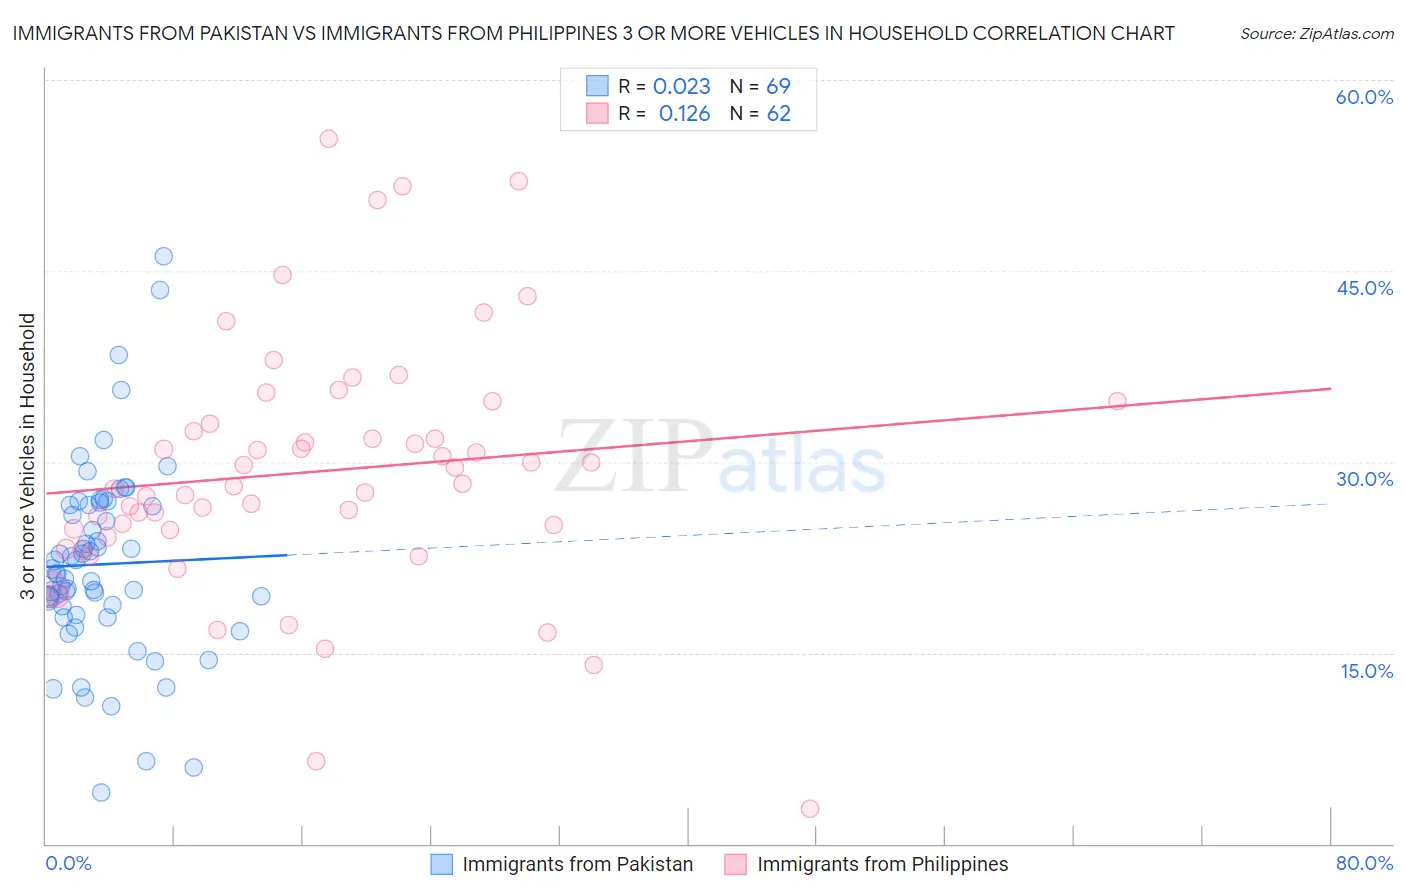
Immigrants from Pakistan vs Immigrants from Philippines 3 or more Vehicles in Household Correlation Chart
The statistical analysis conducted on geographies consisting of 283,714,957 people shows no correlation between the proportion of Immigrants from Pakistan and percentage of households with 3 or more vehicles available in the United States with a correlation coefficient (R) of 0.023 and weighted average of 19.8%. Similarly, the statistical analysis conducted on geographies consisting of 470,874,140 people shows a poor positive correlation between the proportion of Immigrants from Philippines and percentage of households with 3 or more vehicles available in the United States with a correlation coefficient (R) of 0.126 and weighted average of 23.8%, a difference of 20.1%.
3 or more Vehicles in Household Correlation Summary
| Measurement | Immigrants from Pakistan | Immigrants from Philippines |
| Minimum | 4.0% | 2.7% |
| Maximum | 46.2% | 55.4% |
| Range | 42.1% | 52.7% |
| Mean | 21.9% | 29.2% |
| Median | 21.3% | 28.2% |
| Interquartile 25% (IQ1) | 18.3% | 24.6% |
| Interquartile 75% (IQ3) | 26.6% | 33.0% |
| Interquartile Range (IQR) | 8.3% | 8.4% |
| Standard Deviation (Sample) | 7.5% | 9.9% |
| Standard Deviation (Population) | 7.5% | 9.8% |
Similar Demographics by 3 or more Vehicles in Household
Demographics Similar to Immigrants from Pakistan by 3 or more Vehicles in Household
In terms of 3 or more vehicles in household, the demographic groups most similar to Immigrants from Pakistan are Armenian (19.8%, a difference of 0.050%), Immigrants from Lebanon (19.8%, a difference of 0.050%), Hungarian (19.8%, a difference of 0.21%), Immigrants from Guatemala (19.7%, a difference of 0.22%), and Thai (19.8%, a difference of 0.26%).
| Demographics | Rating | Rank | 3 or more Vehicles in Household |
| Lebanese | 79.8 /100 | #152 | Good 20.0% |
| Yuman | 75.6 /100 | #153 | Good 19.9% |
| Immigrants | Jordan | 75.0 /100 | #154 | Good 19.9% |
| Tlingit-Haida | 73.4 /100 | #155 | Good 19.9% |
| Thais | 71.1 /100 | #156 | Good 19.8% |
| Hungarians | 70.5 /100 | #157 | Good 19.8% |
| Armenians | 68.8 /100 | #158 | Good 19.8% |
| Immigrants | Pakistan | 68.2 /100 | #159 | Good 19.8% |
| Immigrants | Lebanon | 67.6 /100 | #160 | Good 19.8% |
| Immigrants | Guatemala | 65.6 /100 | #161 | Good 19.7% |
| Estonians | 63.2 /100 | #162 | Good 19.7% |
| Chileans | 63.0 /100 | #163 | Good 19.7% |
| Yugoslavians | 62.9 /100 | #164 | Good 19.7% |
| Immigrants | Costa Rica | 61.9 /100 | #165 | Good 19.7% |
| Immigrants | Cameroon | 60.9 /100 | #166 | Good 19.7% |
Demographics Similar to Immigrants from Philippines by 3 or more Vehicles in Household
In terms of 3 or more vehicles in household, the demographic groups most similar to Immigrants from Philippines are Immigrants from Vietnam (23.8%, a difference of 0.060%), Paiute (23.8%, a difference of 0.18%), Chinese (23.9%, a difference of 0.47%), Norwegian (23.9%, a difference of 0.51%), and Scandinavian (23.6%, a difference of 0.59%).
| Demographics | Rating | Rank | 3 or more Vehicles in Household |
| Hawaiians | 100.0 /100 | #15 | Exceptional 24.3% |
| Basques | 100.0 /100 | #16 | Exceptional 24.3% |
| Koreans | 100.0 /100 | #17 | Exceptional 24.1% |
| Norwegians | 100.0 /100 | #18 | Exceptional 23.9% |
| Chinese | 100.0 /100 | #19 | Exceptional 23.9% |
| Paiute | 100.0 /100 | #20 | Exceptional 23.8% |
| Immigrants | Vietnam | 100.0 /100 | #21 | Exceptional 23.8% |
| Immigrants | Philippines | 100.0 /100 | #22 | Exceptional 23.8% |
| Scandinavians | 100.0 /100 | #23 | Exceptional 23.6% |
| Sri Lankans | 100.0 /100 | #24 | Exceptional 23.6% |
| Immigrants | Central America | 100.0 /100 | #25 | Exceptional 23.4% |
| Mexican American Indians | 100.0 /100 | #26 | Exceptional 23.3% |
| Guamanians/Chamorros | 100.0 /100 | #27 | Exceptional 23.2% |
| Lumbee | 100.0 /100 | #28 | Exceptional 23.1% |
| Spanish | 100.0 /100 | #29 | Exceptional 23.1% |