Immigrants from Pakistan vs Lithuanian 3 or more Vehicles in Household
COMPARE
Immigrants from Pakistan
Lithuanian
3 or more Vehicles in Household
3 or more Vehicles in Household Comparison
Immigrants from Pakistan
Lithuanians
19.8%
3 OR MORE VEHICLES IN HOUSEHOLD
68.2/ 100
METRIC RATING
159th/ 347
METRIC RANK
20.1%
3 OR MORE VEHICLES IN HOUSEHOLD
84.4/ 100
METRIC RATING
143rd/ 347
METRIC RANK
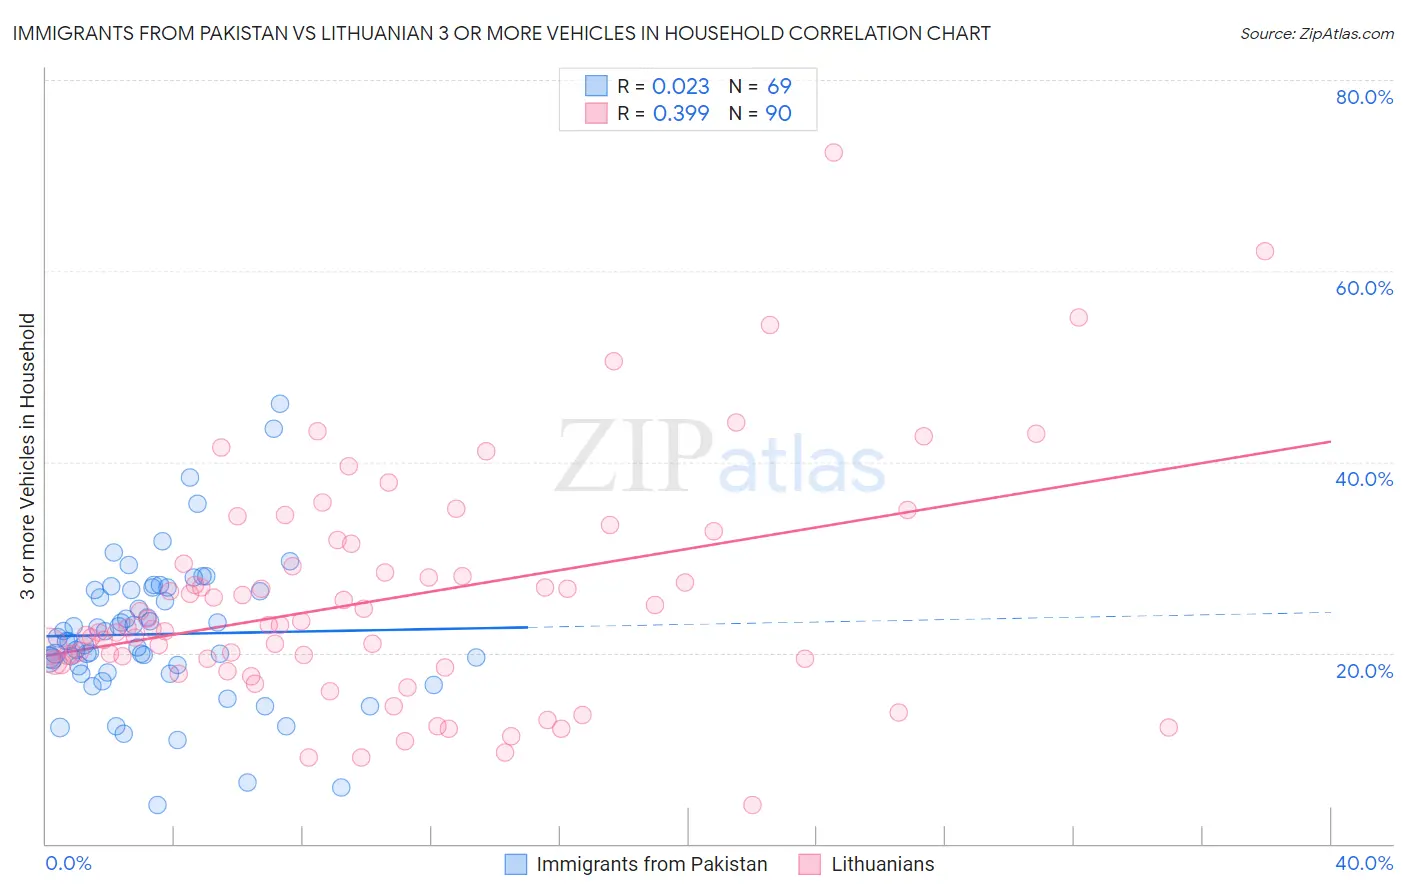
Immigrants from Pakistan vs Lithuanian 3 or more Vehicles in Household Correlation Chart
The statistical analysis conducted on geographies consisting of 283,714,957 people shows no correlation between the proportion of Immigrants from Pakistan and percentage of households with 3 or more vehicles available in the United States with a correlation coefficient (R) of 0.023 and weighted average of 19.8%. Similarly, the statistical analysis conducted on geographies consisting of 421,577,251 people shows a mild positive correlation between the proportion of Lithuanians and percentage of households with 3 or more vehicles available in the United States with a correlation coefficient (R) of 0.399 and weighted average of 20.1%, a difference of 1.7%.
3 or more Vehicles in Household Correlation Summary
| Measurement | Immigrants from Pakistan | Lithuanian |
| Minimum | 4.0% | 4.1% |
| Maximum | 46.2% | 72.4% |
| Range | 42.1% | 68.4% |
| Mean | 21.9% | 25.6% |
| Median | 21.3% | 22.8% |
| Interquartile 25% (IQ1) | 18.3% | 19.0% |
| Interquartile 75% (IQ3) | 26.6% | 29.4% |
| Interquartile Range (IQR) | 8.3% | 10.4% |
| Standard Deviation (Sample) | 7.5% | 12.0% |
| Standard Deviation (Population) | 7.5% | 11.9% |
Demographics Similar to Immigrants from Pakistan and Lithuanians by 3 or more Vehicles in Household
In terms of 3 or more vehicles in household, the demographic groups most similar to Immigrants from Pakistan are Armenian (19.8%, a difference of 0.050%), Immigrants from Lebanon (19.8%, a difference of 0.050%), Hungarian (19.8%, a difference of 0.21%), Immigrants from Guatemala (19.7%, a difference of 0.22%), and Thai (19.8%, a difference of 0.26%). Similarly, the demographic groups most similar to Lithuanians are Jordanian (20.1%, a difference of 0.0%), Iranian (20.1%, a difference of 0.050%), Palestinian (20.1%, a difference of 0.060%), Ottawa (20.1%, a difference of 0.070%), and Australian (20.1%, a difference of 0.11%).
| Demographics | Rating | Rank | 3 or more Vehicles in Household |
| Ottawa | 84.9 /100 | #141 | Excellent 20.1% |
| Jordanians | 84.4 /100 | #142 | Excellent 20.1% |
| Lithuanians | 84.4 /100 | #143 | Excellent 20.1% |
| Iranians | 84.0 /100 | #144 | Excellent 20.1% |
| Palestinians | 83.9 /100 | #145 | Excellent 20.1% |
| Australians | 83.6 /100 | #146 | Excellent 20.1% |
| Slovaks | 83.0 /100 | #147 | Excellent 20.1% |
| Guatemalans | 82.6 /100 | #148 | Excellent 20.1% |
| Immigrants | Iran | 80.9 /100 | #149 | Excellent 20.0% |
| Immigrants | Immigrants | 80.8 /100 | #150 | Excellent 20.0% |
| Taiwanese | 80.6 /100 | #151 | Excellent 20.0% |
| Lebanese | 79.8 /100 | #152 | Good 20.0% |
| Yuman | 75.6 /100 | #153 | Good 19.9% |
| Immigrants | Jordan | 75.0 /100 | #154 | Good 19.9% |
| Tlingit-Haida | 73.4 /100 | #155 | Good 19.9% |
| Thais | 71.1 /100 | #156 | Good 19.8% |
| Hungarians | 70.5 /100 | #157 | Good 19.8% |
| Armenians | 68.8 /100 | #158 | Good 19.8% |
| Immigrants | Pakistan | 68.2 /100 | #159 | Good 19.8% |
| Immigrants | Lebanon | 67.6 /100 | #160 | Good 19.8% |
| Immigrants | Guatemala | 65.6 /100 | #161 | Good 19.7% |