Immigrants from Pakistan vs Immigrants from Syria 3 or more Vehicles in Household
COMPARE
Immigrants from Pakistan
Immigrants from Syria
3 or more Vehicles in Household
3 or more Vehicles in Household Comparison
Immigrants from Pakistan
Immigrants from Syria
19.8%
3 OR MORE VEHICLES IN HOUSEHOLD
68.2/ 100
METRIC RATING
159th/ 347
METRIC RANK
19.4%
3 OR MORE VEHICLES IN HOUSEHOLD
40.3/ 100
METRIC RATING
178th/ 347
METRIC RANK
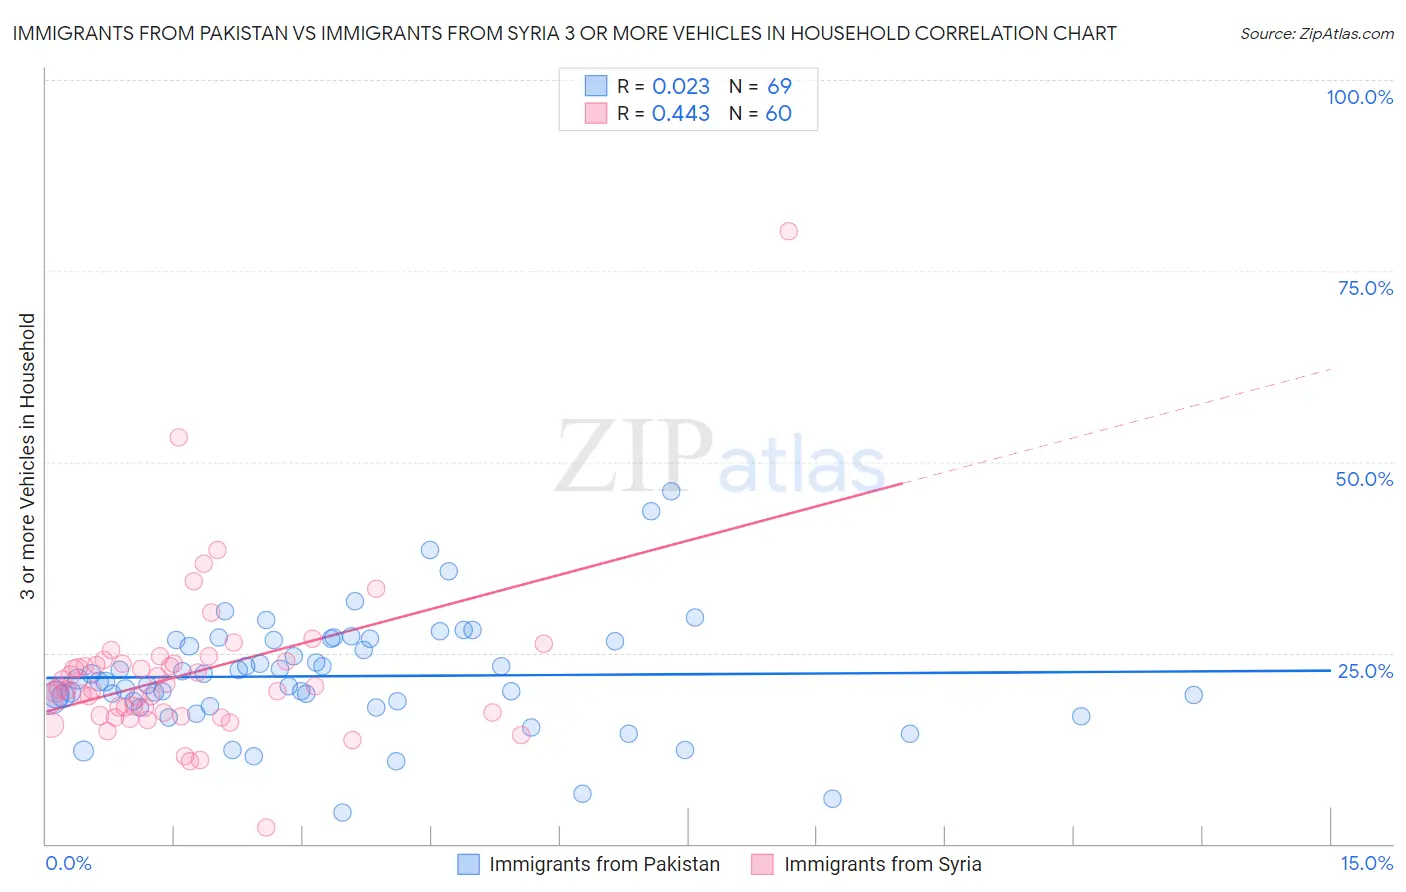
Immigrants from Pakistan vs Immigrants from Syria 3 or more Vehicles in Household Correlation Chart
The statistical analysis conducted on geographies consisting of 283,714,957 people shows no correlation between the proportion of Immigrants from Pakistan and percentage of households with 3 or more vehicles available in the United States with a correlation coefficient (R) of 0.023 and weighted average of 19.8%. Similarly, the statistical analysis conducted on geographies consisting of 174,111,368 people shows a moderate positive correlation between the proportion of Immigrants from Syria and percentage of households with 3 or more vehicles available in the United States with a correlation coefficient (R) of 0.443 and weighted average of 19.4%, a difference of 2.2%.
3 or more Vehicles in Household Correlation Summary
| Measurement | Immigrants from Pakistan | Immigrants from Syria |
| Minimum | 4.0% | 2.1% |
| Maximum | 46.2% | 80.2% |
| Range | 42.1% | 78.1% |
| Mean | 21.9% | 22.3% |
| Median | 21.3% | 20.3% |
| Interquartile 25% (IQ1) | 18.3% | 17.0% |
| Interquartile 75% (IQ3) | 26.6% | 23.7% |
| Interquartile Range (IQR) | 8.3% | 6.7% |
| Standard Deviation (Sample) | 7.5% | 10.6% |
| Standard Deviation (Population) | 7.5% | 10.5% |
Demographics Similar to Immigrants from Pakistan and Immigrants from Syria by 3 or more Vehicles in Household
In terms of 3 or more vehicles in household, the demographic groups most similar to Immigrants from Pakistan are Armenian (19.8%, a difference of 0.050%), Immigrants from Lebanon (19.8%, a difference of 0.050%), Immigrants from Guatemala (19.7%, a difference of 0.22%), Estonian (19.7%, a difference of 0.41%), and Chilean (19.7%, a difference of 0.43%). Similarly, the demographic groups most similar to Immigrants from Syria are Immigrants from Peru (19.4%, a difference of 0.070%), Iroquois (19.4%, a difference of 0.45%), Syrian (19.5%, a difference of 0.52%), Immigrants from South Africa (19.5%, a difference of 0.75%), and Immigrants from Northern Europe (19.5%, a difference of 0.77%).
| Demographics | Rating | Rank | 3 or more Vehicles in Household |
| Armenians | 68.8 /100 | #158 | Good 19.8% |
| Immigrants | Pakistan | 68.2 /100 | #159 | Good 19.8% |
| Immigrants | Lebanon | 67.6 /100 | #160 | Good 19.8% |
| Immigrants | Guatemala | 65.6 /100 | #161 | Good 19.7% |
| Estonians | 63.2 /100 | #162 | Good 19.7% |
| Chileans | 63.0 /100 | #163 | Good 19.7% |
| Yugoslavians | 62.9 /100 | #164 | Good 19.7% |
| Immigrants | Costa Rica | 61.9 /100 | #165 | Good 19.7% |
| Immigrants | Cameroon | 60.9 /100 | #166 | Good 19.7% |
| Ukrainians | 58.9 /100 | #167 | Average 19.6% |
| Peruvians | 58.8 /100 | #168 | Average 19.6% |
| Immigrants | Denmark | 57.6 /100 | #169 | Average 19.6% |
| Iraqis | 56.0 /100 | #170 | Average 19.6% |
| Immigrants | Western Europe | 53.2 /100 | #171 | Average 19.5% |
| Kiowa | 50.9 /100 | #172 | Average 19.5% |
| Immigrants | Northern Europe | 50.2 /100 | #173 | Average 19.5% |
| Immigrants | South Africa | 50.0 /100 | #174 | Average 19.5% |
| Syrians | 47.0 /100 | #175 | Average 19.5% |
| Iroquois | 46.0 /100 | #176 | Average 19.4% |
| Immigrants | Peru | 41.1 /100 | #177 | Average 19.4% |
| Immigrants | Syria | 40.3 /100 | #178 | Average 19.4% |