Immigrants from Pakistan vs Alaskan Athabascan 3 or more Vehicles in Household
COMPARE
Immigrants from Pakistan
Alaskan Athabascan
3 or more Vehicles in Household
3 or more Vehicles in Household Comparison
Immigrants from Pakistan
Alaskan Athabascans
19.8%
3 OR MORE VEHICLES IN HOUSEHOLD
68.2/ 100
METRIC RATING
159th/ 347
METRIC RANK
21.9%
3 OR MORE VEHICLES IN HOUSEHOLD
99.9/ 100
METRIC RATING
67th/ 347
METRIC RANK
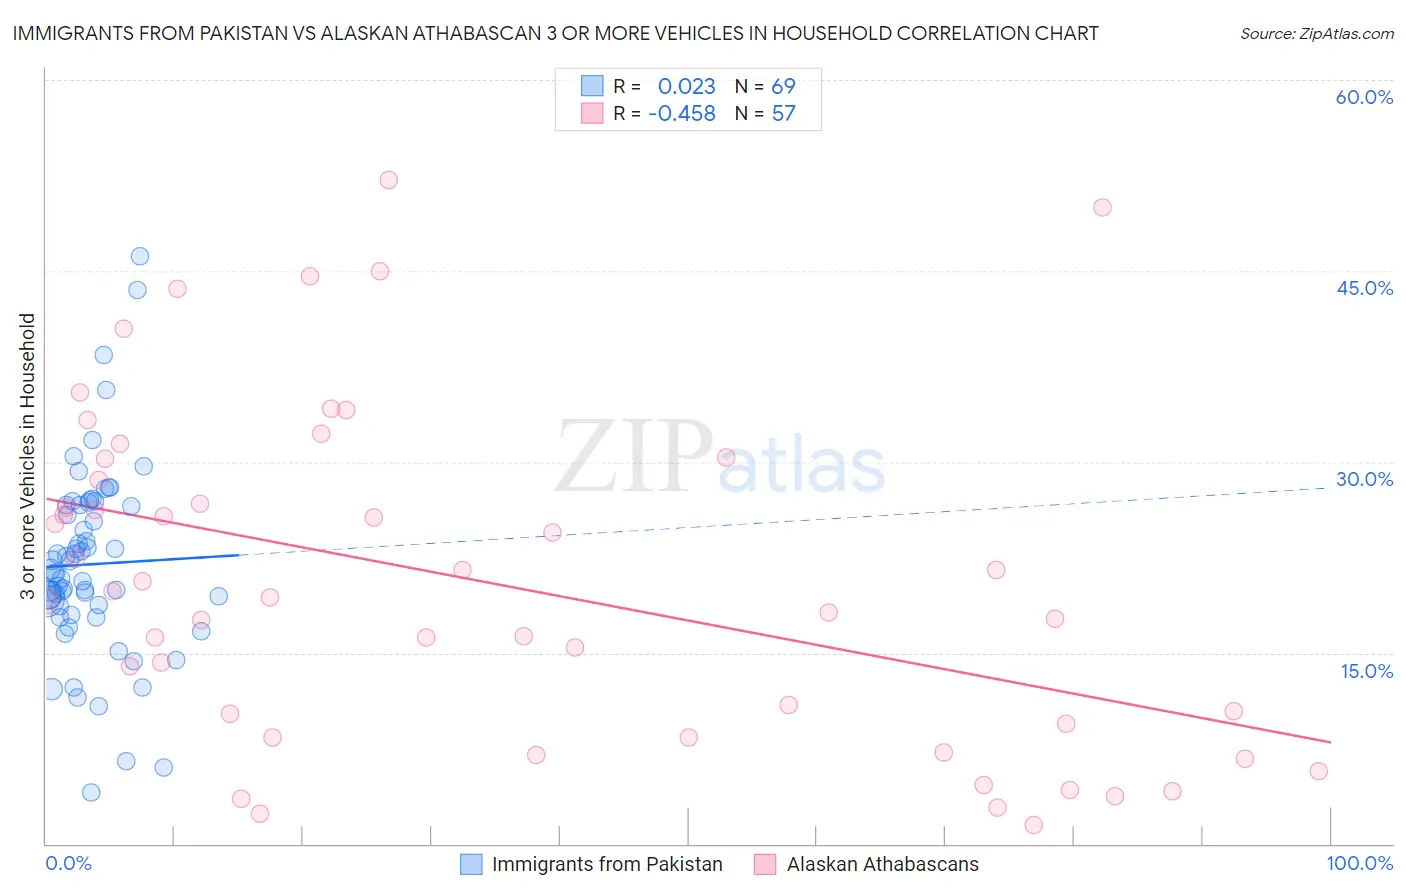
Immigrants from Pakistan vs Alaskan Athabascan 3 or more Vehicles in Household Correlation Chart
The statistical analysis conducted on geographies consisting of 283,714,957 people shows no correlation between the proportion of Immigrants from Pakistan and percentage of households with 3 or more vehicles available in the United States with a correlation coefficient (R) of 0.023 and weighted average of 19.8%. Similarly, the statistical analysis conducted on geographies consisting of 45,796,078 people shows a moderate negative correlation between the proportion of Alaskan Athabascans and percentage of households with 3 or more vehicles available in the United States with a correlation coefficient (R) of -0.458 and weighted average of 21.9%, a difference of 11.0%.
3 or more Vehicles in Household Correlation Summary
| Measurement | Immigrants from Pakistan | Alaskan Athabascan |
| Minimum | 4.0% | 1.4% |
| Maximum | 46.2% | 52.1% |
| Range | 42.1% | 50.7% |
| Mean | 21.9% | 20.6% |
| Median | 21.3% | 19.4% |
| Interquartile 25% (IQ1) | 18.3% | 8.9% |
| Interquartile 75% (IQ3) | 26.6% | 29.4% |
| Interquartile Range (IQR) | 8.3% | 20.5% |
| Standard Deviation (Sample) | 7.5% | 13.0% |
| Standard Deviation (Population) | 7.5% | 12.9% |
Similar Demographics by 3 or more Vehicles in Household
Demographics Similar to Immigrants from Pakistan by 3 or more Vehicles in Household
In terms of 3 or more vehicles in household, the demographic groups most similar to Immigrants from Pakistan are Armenian (19.8%, a difference of 0.050%), Immigrants from Lebanon (19.8%, a difference of 0.050%), Hungarian (19.8%, a difference of 0.21%), Immigrants from Guatemala (19.7%, a difference of 0.22%), and Thai (19.8%, a difference of 0.26%).
| Demographics | Rating | Rank | 3 or more Vehicles in Household |
| Lebanese | 79.8 /100 | #152 | Good 20.0% |
| Yuman | 75.6 /100 | #153 | Good 19.9% |
| Immigrants | Jordan | 75.0 /100 | #154 | Good 19.9% |
| Tlingit-Haida | 73.4 /100 | #155 | Good 19.9% |
| Thais | 71.1 /100 | #156 | Good 19.8% |
| Hungarians | 70.5 /100 | #157 | Good 19.8% |
| Armenians | 68.8 /100 | #158 | Good 19.8% |
| Immigrants | Pakistan | 68.2 /100 | #159 | Good 19.8% |
| Immigrants | Lebanon | 67.6 /100 | #160 | Good 19.8% |
| Immigrants | Guatemala | 65.6 /100 | #161 | Good 19.7% |
| Estonians | 63.2 /100 | #162 | Good 19.7% |
| Chileans | 63.0 /100 | #163 | Good 19.7% |
| Yugoslavians | 62.9 /100 | #164 | Good 19.7% |
| Immigrants | Costa Rica | 61.9 /100 | #165 | Good 19.7% |
| Immigrants | Cameroon | 60.9 /100 | #166 | Good 19.7% |
Demographics Similar to Alaskan Athabascans by 3 or more Vehicles in Household
In terms of 3 or more vehicles in household, the demographic groups most similar to Alaskan Athabascans are British (21.9%, a difference of 0.15%), Creek (21.9%, a difference of 0.18%), Northern European (22.0%, a difference of 0.26%), Bangladeshi (21.9%, a difference of 0.37%), and Potawatomi (21.9%, a difference of 0.38%).
| Demographics | Rating | Rank | 3 or more Vehicles in Household |
| Finns | 99.9 /100 | #60 | Exceptional 22.3% |
| Bhutanese | 99.9 /100 | #61 | Exceptional 22.2% |
| Fijians | 99.9 /100 | #62 | Exceptional 22.2% |
| Chickasaw | 99.9 /100 | #63 | Exceptional 22.2% |
| Immigrants | Taiwan | 99.9 /100 | #64 | Exceptional 22.1% |
| Pima | 99.9 /100 | #65 | Exceptional 22.0% |
| Northern Europeans | 99.9 /100 | #66 | Exceptional 22.0% |
| Alaskan Athabascans | 99.9 /100 | #67 | Exceptional 21.9% |
| British | 99.9 /100 | #68 | Exceptional 21.9% |
| Creek | 99.9 /100 | #69 | Exceptional 21.9% |
| Bangladeshis | 99.8 /100 | #70 | Exceptional 21.9% |
| Potawatomi | 99.8 /100 | #71 | Exceptional 21.9% |
| Portuguese | 99.8 /100 | #72 | Exceptional 21.8% |
| Salvadorans | 99.8 /100 | #73 | Exceptional 21.8% |
| Immigrants | Oceania | 99.8 /100 | #74 | Exceptional 21.8% |