Immigrants from Pakistan vs Cherokee 3 or more Vehicles in Household
COMPARE
Immigrants from Pakistan
Cherokee
3 or more Vehicles in Household
3 or more Vehicles in Household Comparison
Immigrants from Pakistan
Cherokee
19.8%
3 OR MORE VEHICLES IN HOUSEHOLD
68.2/ 100
METRIC RATING
159th/ 347
METRIC RANK
23.0%
3 OR MORE VEHICLES IN HOUSEHOLD
100.0/ 100
METRIC RATING
36th/ 347
METRIC RANK
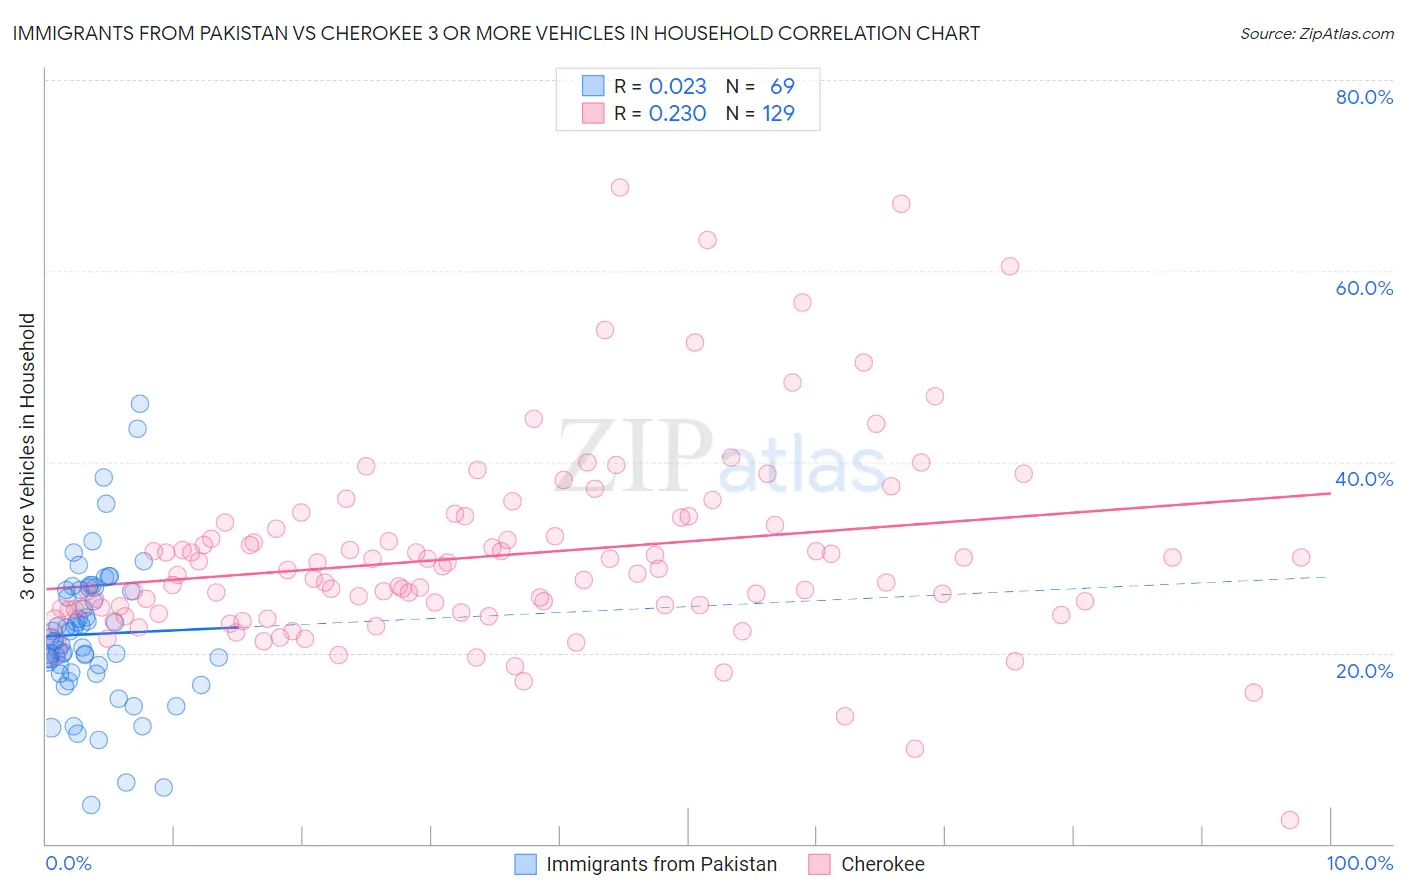
Immigrants from Pakistan vs Cherokee 3 or more Vehicles in Household Correlation Chart
The statistical analysis conducted on geographies consisting of 283,714,957 people shows no correlation between the proportion of Immigrants from Pakistan and percentage of households with 3 or more vehicles available in the United States with a correlation coefficient (R) of 0.023 and weighted average of 19.8%. Similarly, the statistical analysis conducted on geographies consisting of 493,301,702 people shows a weak positive correlation between the proportion of Cherokee and percentage of households with 3 or more vehicles available in the United States with a correlation coefficient (R) of 0.230 and weighted average of 23.0%, a difference of 16.2%.
3 or more Vehicles in Household Correlation Summary
| Measurement | Immigrants from Pakistan | Cherokee |
| Minimum | 4.0% | 2.4% |
| Maximum | 46.2% | 68.8% |
| Range | 42.1% | 66.3% |
| Mean | 21.9% | 30.2% |
| Median | 21.3% | 28.3% |
| Interquartile 25% (IQ1) | 18.3% | 24.5% |
| Interquartile 75% (IQ3) | 26.6% | 33.5% |
| Interquartile Range (IQR) | 8.3% | 9.0% |
| Standard Deviation (Sample) | 7.5% | 10.2% |
| Standard Deviation (Population) | 7.5% | 10.2% |
Similar Demographics by 3 or more Vehicles in Household
Demographics Similar to Immigrants from Pakistan by 3 or more Vehicles in Household
In terms of 3 or more vehicles in household, the demographic groups most similar to Immigrants from Pakistan are Armenian (19.8%, a difference of 0.050%), Immigrants from Lebanon (19.8%, a difference of 0.050%), Hungarian (19.8%, a difference of 0.21%), Immigrants from Guatemala (19.7%, a difference of 0.22%), and Thai (19.8%, a difference of 0.26%).
| Demographics | Rating | Rank | 3 or more Vehicles in Household |
| Lebanese | 79.8 /100 | #152 | Good 20.0% |
| Yuman | 75.6 /100 | #153 | Good 19.9% |
| Immigrants | Jordan | 75.0 /100 | #154 | Good 19.9% |
| Tlingit-Haida | 73.4 /100 | #155 | Good 19.9% |
| Thais | 71.1 /100 | #156 | Good 19.8% |
| Hungarians | 70.5 /100 | #157 | Good 19.8% |
| Armenians | 68.8 /100 | #158 | Good 19.8% |
| Immigrants | Pakistan | 68.2 /100 | #159 | Good 19.8% |
| Immigrants | Lebanon | 67.6 /100 | #160 | Good 19.8% |
| Immigrants | Guatemala | 65.6 /100 | #161 | Good 19.7% |
| Estonians | 63.2 /100 | #162 | Good 19.7% |
| Chileans | 63.0 /100 | #163 | Good 19.7% |
| Yugoslavians | 62.9 /100 | #164 | Good 19.7% |
| Immigrants | Costa Rica | 61.9 /100 | #165 | Good 19.7% |
| Immigrants | Cameroon | 60.9 /100 | #166 | Good 19.7% |
Demographics Similar to Cherokee by 3 or more Vehicles in Household
In terms of 3 or more vehicles in household, the demographic groups most similar to Cherokee are Swedish (23.0%, a difference of 0.030%), Choctaw (23.0%, a difference of 0.040%), Swiss (23.0%, a difference of 0.060%), Spanish American (23.0%, a difference of 0.11%), and Pueblo (23.0%, a difference of 0.17%).
| Demographics | Rating | Rank | 3 or more Vehicles in Household |
| Spanish | 100.0 /100 | #29 | Exceptional 23.1% |
| Immigrants | South Eastern Asia | 100.0 /100 | #30 | Exceptional 23.1% |
| English | 100.0 /100 | #31 | Exceptional 23.1% |
| Pueblo | 100.0 /100 | #32 | Exceptional 23.0% |
| Spanish Americans | 100.0 /100 | #33 | Exceptional 23.0% |
| Swiss | 100.0 /100 | #34 | Exceptional 23.0% |
| Choctaw | 100.0 /100 | #35 | Exceptional 23.0% |
| Cherokee | 100.0 /100 | #36 | Exceptional 23.0% |
| Swedes | 100.0 /100 | #37 | Exceptional 23.0% |
| Dutch | 100.0 /100 | #38 | Exceptional 22.9% |
| Yaqui | 100.0 /100 | #39 | Exceptional 22.9% |
| Europeans | 100.0 /100 | #40 | Exceptional 22.9% |
| Germans | 100.0 /100 | #41 | Exceptional 22.7% |
| Natives/Alaskans | 100.0 /100 | #42 | Exceptional 22.7% |
| Osage | 100.0 /100 | #43 | Exceptional 22.7% |