Immigrants from Zaire vs Russian 3 or more Vehicles in Household
COMPARE
Immigrants from Zaire
Russian
3 or more Vehicles in Household
3 or more Vehicles in Household Comparison
Immigrants from Zaire
Russians
16.7%
3 OR MORE VEHICLES IN HOUSEHOLD
0.1/ 100
METRIC RATING
298th/ 347
METRIC RANK
18.8%
3 OR MORE VEHICLES IN HOUSEHOLD
14.2/ 100
METRIC RATING
205th/ 347
METRIC RANK
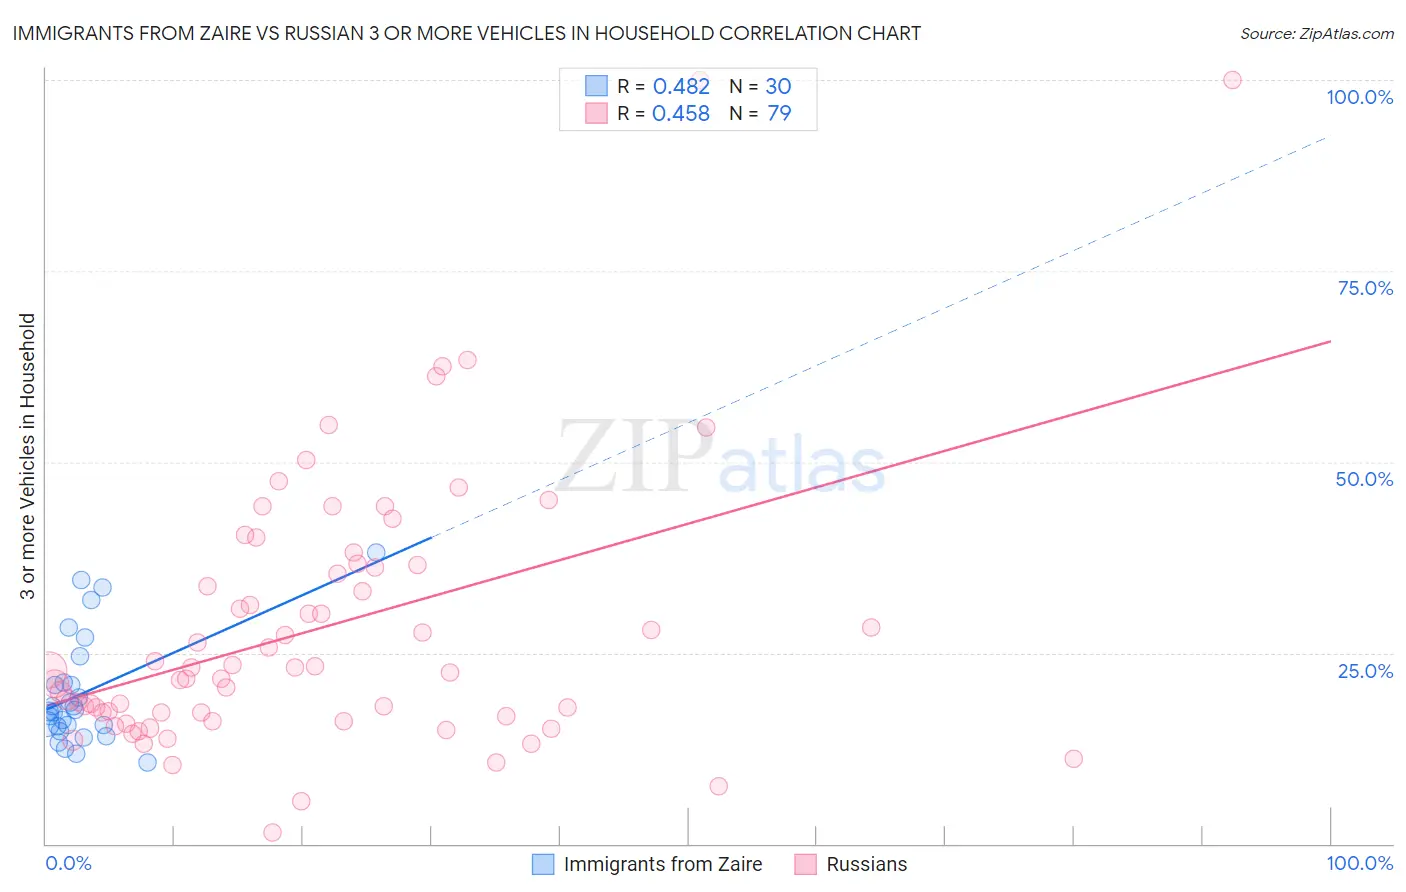
Immigrants from Zaire vs Russian 3 or more Vehicles in Household Correlation Chart
The statistical analysis conducted on geographies consisting of 107,239,583 people shows a moderate positive correlation between the proportion of Immigrants from Zaire and percentage of households with 3 or more vehicles available in the United States with a correlation coefficient (R) of 0.482 and weighted average of 16.7%. Similarly, the statistical analysis conducted on geographies consisting of 511,489,860 people shows a moderate positive correlation between the proportion of Russians and percentage of households with 3 or more vehicles available in the United States with a correlation coefficient (R) of 0.458 and weighted average of 18.8%, a difference of 12.7%.
3 or more Vehicles in Household Correlation Summary
| Measurement | Immigrants from Zaire | Russian |
| Minimum | 10.6% | 1.4% |
| Maximum | 38.1% | 100.0% |
| Range | 27.5% | 98.6% |
| Mean | 19.8% | 28.3% |
| Median | 17.5% | 22.8% |
| Interquartile 25% (IQ1) | 15.4% | 16.7% |
| Interquartile 75% (IQ3) | 21.1% | 36.5% |
| Interquartile Range (IQR) | 5.7% | 19.9% |
| Standard Deviation (Sample) | 7.2% | 18.0% |
| Standard Deviation (Population) | 7.1% | 17.9% |
Similar Demographics by 3 or more Vehicles in Household
Demographics Similar to Immigrants from Zaire by 3 or more Vehicles in Household
In terms of 3 or more vehicles in household, the demographic groups most similar to Immigrants from Zaire are Immigrants from South America (16.7%, a difference of 0.060%), Israeli (16.8%, a difference of 0.37%), Cypriot (16.6%, a difference of 0.54%), Inupiat (16.9%, a difference of 0.84%), and Paraguayan (16.6%, a difference of 0.95%).
| Demographics | Rating | Rank | 3 or more Vehicles in Household |
| Immigrants | Congo | 0.1 /100 | #291 | Tragic 17.0% |
| Immigrants | Spain | 0.1 /100 | #292 | Tragic 17.0% |
| Bahamians | 0.1 /100 | #293 | Tragic 16.9% |
| Immigrants | Western Africa | 0.1 /100 | #294 | Tragic 16.9% |
| Immigrants | Russia | 0.1 /100 | #295 | Tragic 16.9% |
| Inupiat | 0.1 /100 | #296 | Tragic 16.9% |
| Israelis | 0.1 /100 | #297 | Tragic 16.8% |
| Immigrants | Zaire | 0.1 /100 | #298 | Tragic 16.7% |
| Immigrants | South America | 0.1 /100 | #299 | Tragic 16.7% |
| Cypriots | 0.0 /100 | #300 | Tragic 16.6% |
| Paraguayans | 0.0 /100 | #301 | Tragic 16.6% |
| Immigrants | Greece | 0.0 /100 | #302 | Tragic 16.5% |
| Immigrants | Serbia | 0.0 /100 | #303 | Tragic 16.4% |
| Ghanaians | 0.0 /100 | #304 | Tragic 16.4% |
| Immigrants | Morocco | 0.0 /100 | #305 | Tragic 16.3% |
Demographics Similar to Russians by 3 or more Vehicles in Household
In terms of 3 or more vehicles in household, the demographic groups most similar to Russians are Immigrants from Eastern Asia (18.8%, a difference of 0.010%), Immigrants from Romania (18.9%, a difference of 0.070%), Immigrants from Chile (18.8%, a difference of 0.090%), Tohono O'odham (18.9%, a difference of 0.10%), and Immigrants from Burma/Myanmar (18.8%, a difference of 0.10%).
| Demographics | Rating | Rank | 3 or more Vehicles in Household |
| Egyptians | 19.5 /100 | #198 | Poor 19.0% |
| Immigrants | Norway | 19.0 /100 | #199 | Poor 19.0% |
| Argentineans | 18.2 /100 | #200 | Poor 18.9% |
| Arabs | 17.7 /100 | #201 | Poor 18.9% |
| Immigrants | Austria | 15.4 /100 | #202 | Poor 18.9% |
| Tohono O'odham | 14.8 /100 | #203 | Poor 18.9% |
| Immigrants | Romania | 14.6 /100 | #204 | Poor 18.9% |
| Russians | 14.2 /100 | #205 | Poor 18.8% |
| Immigrants | Eastern Asia | 14.1 /100 | #206 | Poor 18.8% |
| Immigrants | Chile | 13.6 /100 | #207 | Poor 18.8% |
| Immigrants | Burma/Myanmar | 13.6 /100 | #208 | Poor 18.8% |
| Immigrants | Egypt | 13.5 /100 | #209 | Poor 18.8% |
| Bulgarians | 13.1 /100 | #210 | Poor 18.8% |
| Immigrants | Kenya | 12.4 /100 | #211 | Poor 18.8% |
| Panamanians | 11.6 /100 | #212 | Poor 18.8% |