Immigrants from Pakistan vs Immigrants from Malaysia 3 or more Vehicles in Household
COMPARE
Immigrants from Pakistan
Immigrants from Malaysia
3 or more Vehicles in Household
3 or more Vehicles in Household Comparison
Immigrants from Pakistan
Immigrants from Malaysia
19.8%
3 OR MORE VEHICLES IN HOUSEHOLD
68.2/ 100
METRIC RATING
159th/ 347
METRIC RANK
18.3%
3 OR MORE VEHICLES IN HOUSEHOLD
3.6/ 100
METRIC RATING
236th/ 347
METRIC RANK
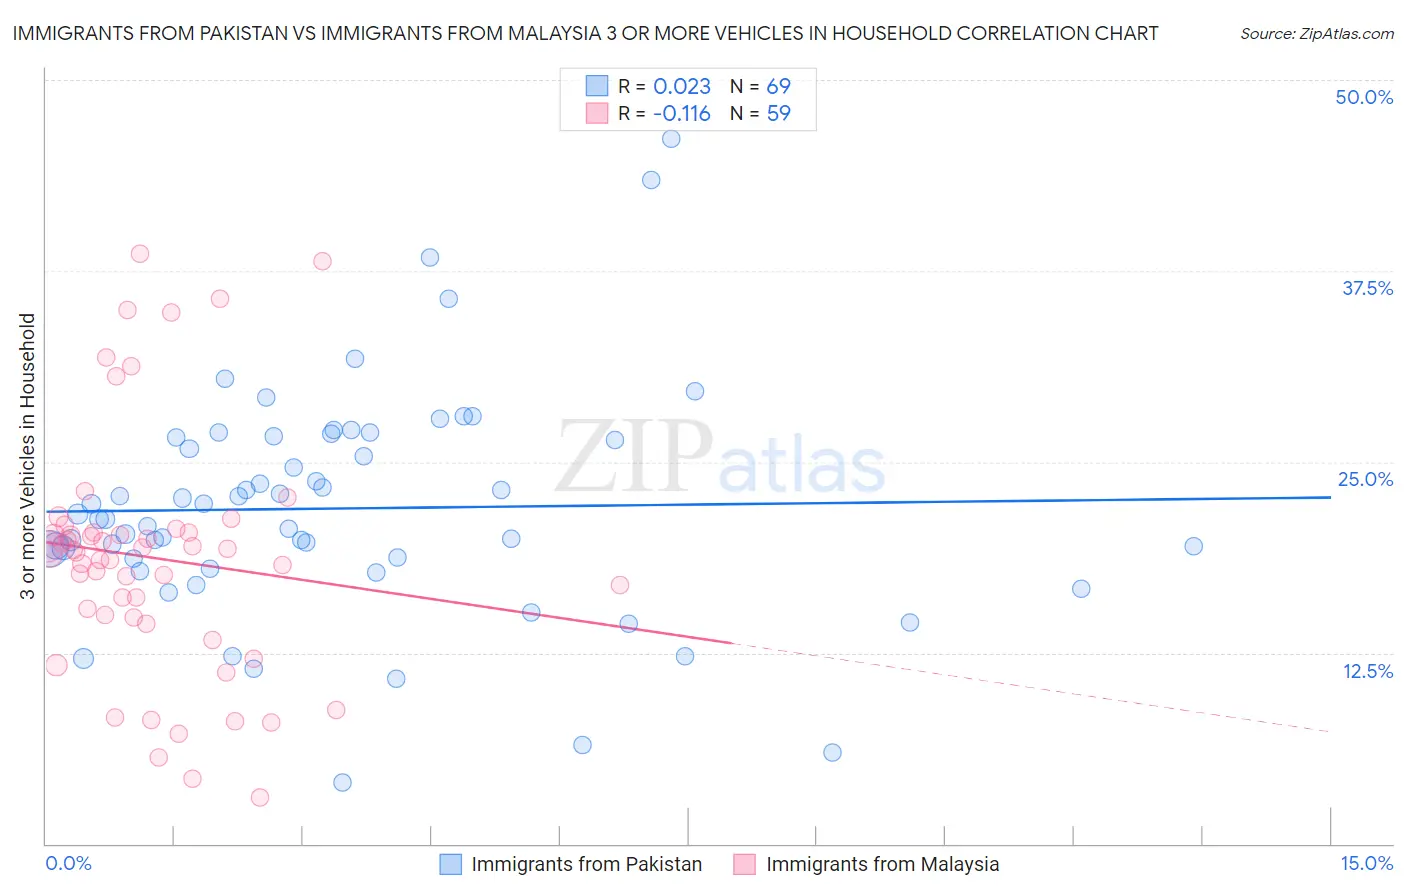
Immigrants from Pakistan vs Immigrants from Malaysia 3 or more Vehicles in Household Correlation Chart
The statistical analysis conducted on geographies consisting of 283,714,957 people shows no correlation between the proportion of Immigrants from Pakistan and percentage of households with 3 or more vehicles available in the United States with a correlation coefficient (R) of 0.023 and weighted average of 19.8%. Similarly, the statistical analysis conducted on geographies consisting of 197,846,297 people shows a poor negative correlation between the proportion of Immigrants from Malaysia and percentage of households with 3 or more vehicles available in the United States with a correlation coefficient (R) of -0.116 and weighted average of 18.3%, a difference of 8.2%.
3 or more Vehicles in Household Correlation Summary
| Measurement | Immigrants from Pakistan | Immigrants from Malaysia |
| Minimum | 4.0% | 3.0% |
| Maximum | 46.2% | 38.6% |
| Range | 42.1% | 35.6% |
| Mean | 21.9% | 18.7% |
| Median | 21.3% | 19.1% |
| Interquartile 25% (IQ1) | 18.3% | 14.8% |
| Interquartile 75% (IQ3) | 26.6% | 20.3% |
| Interquartile Range (IQR) | 8.3% | 5.5% |
| Standard Deviation (Sample) | 7.5% | 8.0% |
| Standard Deviation (Population) | 7.5% | 7.9% |
Similar Demographics by 3 or more Vehicles in Household
Demographics Similar to Immigrants from Pakistan by 3 or more Vehicles in Household
In terms of 3 or more vehicles in household, the demographic groups most similar to Immigrants from Pakistan are Armenian (19.8%, a difference of 0.050%), Immigrants from Lebanon (19.8%, a difference of 0.050%), Hungarian (19.8%, a difference of 0.21%), Immigrants from Guatemala (19.7%, a difference of 0.22%), and Thai (19.8%, a difference of 0.26%).
| Demographics | Rating | Rank | 3 or more Vehicles in Household |
| Lebanese | 79.8 /100 | #152 | Good 20.0% |
| Yuman | 75.6 /100 | #153 | Good 19.9% |
| Immigrants | Jordan | 75.0 /100 | #154 | Good 19.9% |
| Tlingit-Haida | 73.4 /100 | #155 | Good 19.9% |
| Thais | 71.1 /100 | #156 | Good 19.8% |
| Hungarians | 70.5 /100 | #157 | Good 19.8% |
| Armenians | 68.8 /100 | #158 | Good 19.8% |
| Immigrants | Pakistan | 68.2 /100 | #159 | Good 19.8% |
| Immigrants | Lebanon | 67.6 /100 | #160 | Good 19.8% |
| Immigrants | Guatemala | 65.6 /100 | #161 | Good 19.7% |
| Estonians | 63.2 /100 | #162 | Good 19.7% |
| Chileans | 63.0 /100 | #163 | Good 19.7% |
| Yugoslavians | 62.9 /100 | #164 | Good 19.7% |
| Immigrants | Costa Rica | 61.9 /100 | #165 | Good 19.7% |
| Immigrants | Cameroon | 60.9 /100 | #166 | Good 19.7% |
Demographics Similar to Immigrants from Malaysia by 3 or more Vehicles in Household
In terms of 3 or more vehicles in household, the demographic groups most similar to Immigrants from Malaysia are Indonesian (18.3%, a difference of 0.040%), Sierra Leonean (18.3%, a difference of 0.18%), Immigrants from Honduras (18.2%, a difference of 0.28%), Immigrants from Middle Africa (18.2%, a difference of 0.28%), and Immigrants from China (18.2%, a difference of 0.41%).
| Demographics | Rating | Rank | 3 or more Vehicles in Household |
| Immigrants | Switzerland | 5.0 /100 | #229 | Tragic 18.4% |
| Immigrants | Western Asia | 4.8 /100 | #230 | Tragic 18.4% |
| Immigrants | Belgium | 4.8 /100 | #231 | Tragic 18.4% |
| Immigrants | Uganda | 4.6 /100 | #232 | Tragic 18.4% |
| Hondurans | 4.6 /100 | #233 | Tragic 18.4% |
| Immigrants | North Macedonia | 4.4 /100 | #234 | Tragic 18.4% |
| Sierra Leoneans | 3.9 /100 | #235 | Tragic 18.3% |
| Immigrants | Malaysia | 3.6 /100 | #236 | Tragic 18.3% |
| Indonesians | 3.5 /100 | #237 | Tragic 18.3% |
| Immigrants | Honduras | 3.1 /100 | #238 | Tragic 18.2% |
| Immigrants | Middle Africa | 3.1 /100 | #239 | Tragic 18.2% |
| Immigrants | China | 2.9 /100 | #240 | Tragic 18.2% |
| Africans | 2.7 /100 | #241 | Tragic 18.2% |
| Hopi | 2.5 /100 | #242 | Tragic 18.2% |
| Immigrants | Europe | 2.4 /100 | #243 | Tragic 18.1% |