Immigrants from Liberia vs Comanche 3 or more Vehicles in Household
COMPARE
Immigrants from Liberia
Comanche
3 or more Vehicles in Household
3 or more Vehicles in Household Comparison
Immigrants from Liberia
Comanche
17.1%
3 OR MORE VEHICLES IN HOUSEHOLD
0.1/ 100
METRIC RATING
289th/ 347
METRIC RANK
21.0%
3 OR MORE VEHICLES IN HOUSEHOLD
98.2/ 100
METRIC RATING
100th/ 347
METRIC RANK
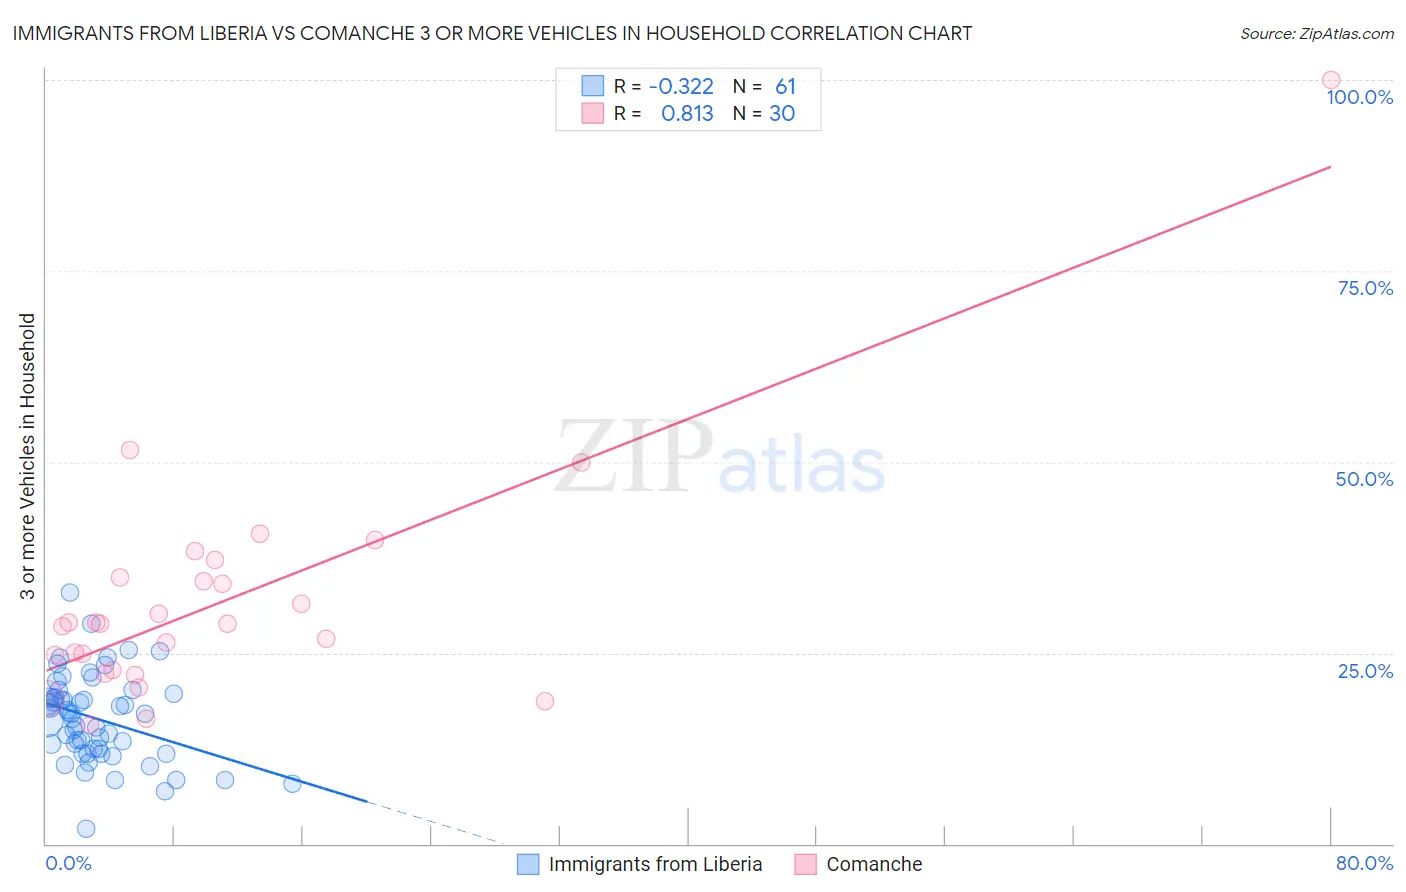
Immigrants from Liberia vs Comanche 3 or more Vehicles in Household Correlation Chart
The statistical analysis conducted on geographies consisting of 135,209,335 people shows a mild negative correlation between the proportion of Immigrants from Liberia and percentage of households with 3 or more vehicles available in the United States with a correlation coefficient (R) of -0.322 and weighted average of 17.1%. Similarly, the statistical analysis conducted on geographies consisting of 109,768,043 people shows a very strong positive correlation between the proportion of Comanche and percentage of households with 3 or more vehicles available in the United States with a correlation coefficient (R) of 0.813 and weighted average of 21.0%, a difference of 22.7%.
3 or more Vehicles in Household Correlation Summary
| Measurement | Immigrants from Liberia | Comanche |
| Minimum | 2.0% | 15.6% |
| Maximum | 32.8% | 100.0% |
| Range | 30.9% | 84.4% |
| Mean | 16.4% | 31.7% |
| Median | 17.0% | 28.8% |
| Interquartile 25% (IQ1) | 12.1% | 22.8% |
| Interquartile 75% (IQ3) | 19.4% | 34.9% |
| Interquartile Range (IQR) | 7.3% | 12.1% |
| Standard Deviation (Sample) | 5.7% | 15.6% |
| Standard Deviation (Population) | 5.7% | 15.4% |
Similar Demographics by 3 or more Vehicles in Household
Demographics Similar to Immigrants from Liberia by 3 or more Vehicles in Household
In terms of 3 or more vehicles in household, the demographic groups most similar to Immigrants from Liberia are Immigrants from Uruguay (17.1%, a difference of 0.070%), Immigrants from Brazil (17.1%, a difference of 0.16%), Menominee (17.2%, a difference of 0.46%), Immigrants from Croatia (17.2%, a difference of 0.52%), and Liberian (17.0%, a difference of 0.57%).
| Demographics | Rating | Rank | 3 or more Vehicles in Household |
| Immigrants | Ireland | 0.3 /100 | #282 | Tragic 17.3% |
| Blacks/African Americans | 0.3 /100 | #283 | Tragic 17.3% |
| Immigrants | Colombia | 0.3 /100 | #284 | Tragic 17.3% |
| Immigrants | Croatia | 0.2 /100 | #285 | Tragic 17.2% |
| Menominee | 0.2 /100 | #286 | Tragic 17.2% |
| Immigrants | Brazil | 0.2 /100 | #287 | Tragic 17.1% |
| Immigrants | Uruguay | 0.2 /100 | #288 | Tragic 17.1% |
| Immigrants | Liberia | 0.1 /100 | #289 | Tragic 17.1% |
| Liberians | 0.1 /100 | #290 | Tragic 17.0% |
| Immigrants | Congo | 0.1 /100 | #291 | Tragic 17.0% |
| Immigrants | Spain | 0.1 /100 | #292 | Tragic 17.0% |
| Bahamians | 0.1 /100 | #293 | Tragic 16.9% |
| Immigrants | Western Africa | 0.1 /100 | #294 | Tragic 16.9% |
| Immigrants | Russia | 0.1 /100 | #295 | Tragic 16.9% |
| Inupiat | 0.1 /100 | #296 | Tragic 16.9% |
Demographics Similar to Comanche by 3 or more Vehicles in Household
In terms of 3 or more vehicles in household, the demographic groups most similar to Comanche are Hmong (21.0%, a difference of 0.040%), Alaska Native (21.0%, a difference of 0.040%), Canadian (21.0%, a difference of 0.10%), Cree (21.0%, a difference of 0.21%), and Pakistani (21.0%, a difference of 0.30%).
| Demographics | Rating | Rank | 3 or more Vehicles in Household |
| Immigrants | Indonesia | 98.8 /100 | #93 | Exceptional 21.1% |
| Immigrants | Cambodia | 98.6 /100 | #94 | Exceptional 21.1% |
| Pakistanis | 98.5 /100 | #95 | Exceptional 21.0% |
| Cree | 98.4 /100 | #96 | Exceptional 21.0% |
| Canadians | 98.3 /100 | #97 | Exceptional 21.0% |
| Hmong | 98.2 /100 | #98 | Exceptional 21.0% |
| Alaska Natives | 98.2 /100 | #99 | Exceptional 21.0% |
| Comanche | 98.2 /100 | #100 | Exceptional 21.0% |
| Blackfeet | 97.9 /100 | #101 | Exceptional 20.9% |
| Seminole | 97.8 /100 | #102 | Exceptional 20.9% |
| Dutch West Indians | 97.8 /100 | #103 | Exceptional 20.9% |
| Luxembourgers | 97.7 /100 | #104 | Exceptional 20.9% |
| Austrians | 97.5 /100 | #105 | Exceptional 20.9% |
| Bolivians | 97.4 /100 | #106 | Exceptional 20.8% |
| Immigrants | Germany | 97.4 /100 | #107 | Exceptional 20.8% |